The great and challenging solar opportunity in India

Our “New Energy Team” combines comprehensive data with deep insights and customized analysis
Since 2008, BRIDGE TO INDIA has been driving change in the Indian solar market through excellence in analysis and communication and is widely recognized as a leading consulting company in this area
Our strengths:
A 360 degree view of the market dynamics
An unrivalled network of
industry stakeholders
A cross-functional team with skills in engineering,
finance, business management and
economics
2 © BRIDGE TO INDIA
Business strategy
Regulatory and policy advice
Market analysis
Due diligence and valuation
Debt and equity fund raising
Business match-making
Market trend projections
Thought leadership reports
Online content

3 © BRIDGE TO INDIA
In renewables, storage and power grids, we have worked with many of the leading stakeholders in India

Powered by BRIDGE TO INDIA
India’s leading online solar marketplace for installers and consumers

Source: Bridge To India analysis
Where India stands on solar today 1
The fundamental drivers of solar 2
The current opportunities 3

Source: Bridge To India analysis
Where India stands on solar today 1

India’s total installed solar capacity in 2015 is 3 GW
Source: BRIDGE TO INDIA database
© BRIDGE TO INDIA

8 © BRIDGE TO INDIA
Will India become one of the largest solar markets in the world? Three different perspectives…
• Compare: Germany 38 GW • € 100+ billion opportunity • 40 GW for distributed solar • 10-‐15 GW under dev. • But: no master plan
• Compare: Germany 3 GW p.a. • < 1% of power generaGon • 95% uGlity scale • Good: ecosystem in place
What are the alterna6ves? • Coal: infra, polluGon • Gas: imports • Large hydro: democracy • Nuclear: underperformer • Underdevelopment?
The Vision
The new Indian government wants to make it a 100 GW
market by 2020
Today, it is only a 1-‐2 GW per year
market
The Reality
The Need
India needs huge amounts of power but has few opGons

9 © BRIDGE TO INDIA
But will it be a design market?...
• Distributed generaGon • Consumer soluGons • Govt. only a facilitator
(through failings, market seWng)
• Slower iniGal growth, more sustainable long-‐term growth
• Market driver: policy (not subsidy)
• Entry point: Grid-‐level soluGon
• Size: UGlity-‐scale generaGon • Project types: Government
tenders, solar parks, GW-‐scale solar projects
• Companies: Established/large-‐scale players
• Success factors: Large project management and finance
• Challenge: Grid management

10 © BRIDGE TO INDIA
… or a default market?
• Market driver: Reacts to a need
• Entry point: Consumer soluGons
• Size/project types: Distributed generaGon
• Govt. role: only a facilitator (through failings, power price seWng)
• Companies: Room for new entrants, business models, technologies
• Success factors: consumer access
• Challenge: Consumer awareness

Source: Bridge To India analysis
The fundamental drivers of solar 2

Bottom line: India needs much, much more electricity
11920
6697
3493 2621 2438
1578 672
0
2000
4000
6000
8000
10000
12000
14000
Very low per capita power consumption
U.S.
Germ
any
China
Iran
Brazil
Mexico
India
Source: World Bank, Bridge To India analysis
And: 400 million people in India are without access to grid electricity
Frequent grid outages
21-30 hours/ week
<5 hours/ week
6-10 hours/ week
11-20 hours/ week
>30 hours/ week
© BRIDGE TO INDIA
kWh
1 2
3

In a “Development” scenario, India needs to increase power supply by a factor of 5
© BRIDGE TO INDIA
1,050
4,978
India’s projected energy generation (TWh/year)
+7% pa
2012 2035 (est)
Scenario “Development” • Average growth of 8% p.a.
over next 20 years • IndustrializaGon (higher
energy intensity of GDP) • Efficiency gains in
generaGon, transmission and distribuGon
• Closing of electricity gap (10%+)
• ElectrificaGon for all (400m) • Historical growth at 7% p.a. • Per person power
consumpGon would be ca. 3,000 kWh p.a. – comparable to current global average
Source: Bridge To India analysis

India’s future power mix: a “coal” vs. a “solar” scenario
“Coal-‐heavy” scenario • Ca. 600 GW new coal fired power plants by
2035 • Total lifeGme emissions of 80 GtCO2 = 8% of
global, historic carbon budget • Large fresh water polluGon (India’s coal has
high ash content) • Air polluGon (India already has 13 of the 20
most polluted ciGes) • Environmental destrucGon due to open cast
mining • Infrastructure bomlenecks: railways (already
used 50% of Indian railway cap.), ports • Import of coal (and gas) – energy security and
current account deficit • Coal price rising? (India’s demand will impact
global prices, future carbon prices)
“Solar-‐heavy” scenario • Ca. 1,600 GW of solar Gll 2035 (and 100 GW
of coal) • Solar would contribute around 60% of power • Annual growth solar rate of 35% (18 GW in
five years as compared to govt. goal of 100 GW)
• At current cell efficiencies, would require ca. 0.8% of India’s land mass or 8% of its waste land
• Would require large investments into balancing, storage, grid infrastructure, demand management
• Would lead to a massive reducGon in the cost of solar (and storage) due to scale
Source: BRIDGE TO INDIA analysis

Source: Bridge To India analysis
The current opportunities 3

More and more international players are investing into the utility-scale Indian solar market
© BRIDGE TO INDIA
International utilities (Equity IRR: 13-15%)
PE backed IPPs (Equity IRR: 18-20%)
International developers (Equity IRR: 15-17%)
Others
Indian corporates (Equity IRR: 20% plus)
Welspun
NTPC
Azure
Hin Clean
SunEdison
Acme (EDF)
Mahindra Sunborne
Essel
Solairedirect
Renew
First Solar
Hero
Today Waaree
Focal
0
50
100
150
200
250
300
350
400
0 50 100 150 200 250 300 350 400
Cap
acity
und
er d
evel
opm
ent M
W
Capacity installed MW
Return expectations for investors
Source: BRIDGE TO INDIA analysis

26.2
7.4
0.75 0.62
Area required per MW (in acre)
Solar parks could make life much easier for investors (land, evacuation) 25 solar parks with an aggregate capacity of 20 GW under development
© BRIDGE TO INDIA
Wind Solar Thermal Nuclear
Source: Spectrum land use report, BRIDGE TO INDIA analysis

Rising tariffs are driving a business case for distributed, private PPA solar models
Cumulative DISCOM deficit of USD 50 billion!
+ 20% Maharashtra
+ 15 - 31% Tamil Nadu
+ 12% Delhi
+ 90% Greater Noida
+ 30 - 50% Bihar
Recent proposed tariff hikes
0
2
4
6
8
10
MH
-MS
ED
CL
KA
-BE
SC
OM
TN-
TAN
GE
DC
O
Del
hi
UP
Har
yana
INR
/ kW
h
Industrial tariffs - Base Energy Charges (2007-2014)
+ 18% Rajasthan
© BRIDGE TO INDIA
Source: BRIDGE TO INDIA analysis

0
2
4
6
8
10
12
Mah
aras
htra
Tam
il N
adu
Kar
nata
ka
Del
hi
Odi
sha
And
hra
Pra
desh
Tela
ngan
a
Utta
r Pra
desh
Wes
t Ben
gal
Raj
asth
an
Pun
jab
Ker
ala
Bih
ar
Har
yana
Him
acha
l
Ass
am
Jhar
khan
d
Mad
hya
Guj
arat
Utta
rakh
and
Chh
attis
garh
INR
/ kW
h Rooftop solar is already financially attractive for commercial consumers across many states…
Viability of rooftop solar for commercial customers
Cost of Solar
Cost of Solar with AD
Solar PV system viable Viable with AD Not viable
Commercial HT tariff
© BRIDGE TO INDIA
Source: BRIDGE TO INDIA analysis
Source: BRIDGE TO INDIA analysis
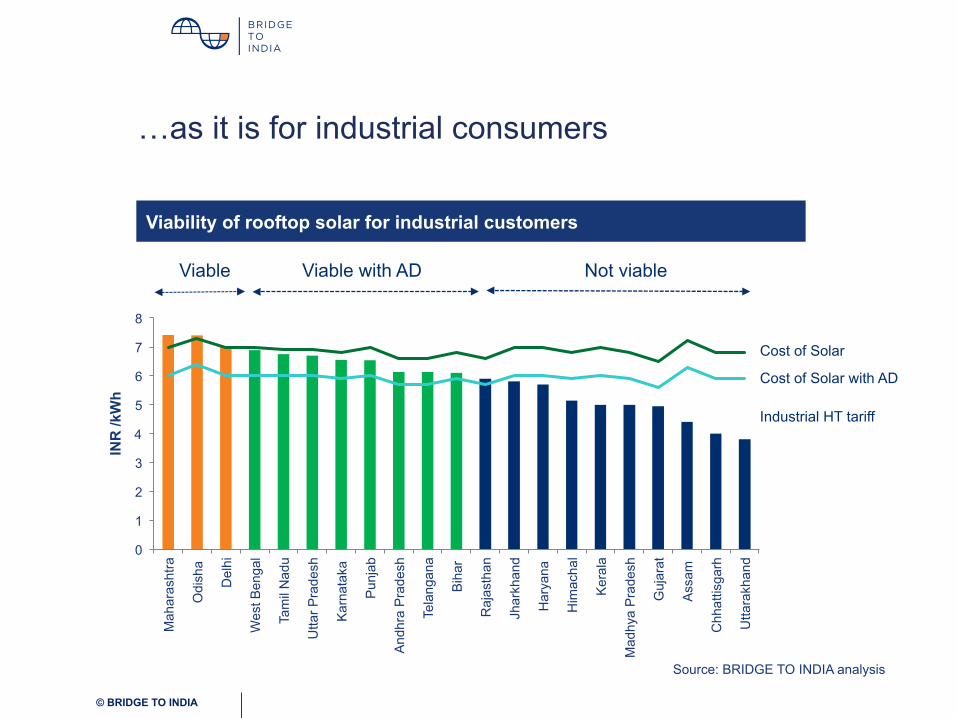
…as it is for industrial consumers
Viability of rooftop solar for industrial customers
Cost of Solar
Cost of Solar with AD
Viable Viable with AD Not viable
Industrial HT tariff
0
1
2
3
4
5
6
7
8
Mah
aras
htra
Odi
sha
Del
hi
Wes
t Ben
gal
Tam
il N
adu
Utta
r Pra
desh
Kar
nata
ka
Pun
jab
And
hra
Pra
desh
Tela
ngan
a
Bih
ar
Raj
asth
an
Jhar
khan
d
Har
yana
Him
acha
l
Ker
ala
Mad
hya
Pra
desh
Guj
arat
Ass
am
Chh
attis
garh
Utta
rakh
and
INR
/kW
h
© BRIDGE TO INDIA
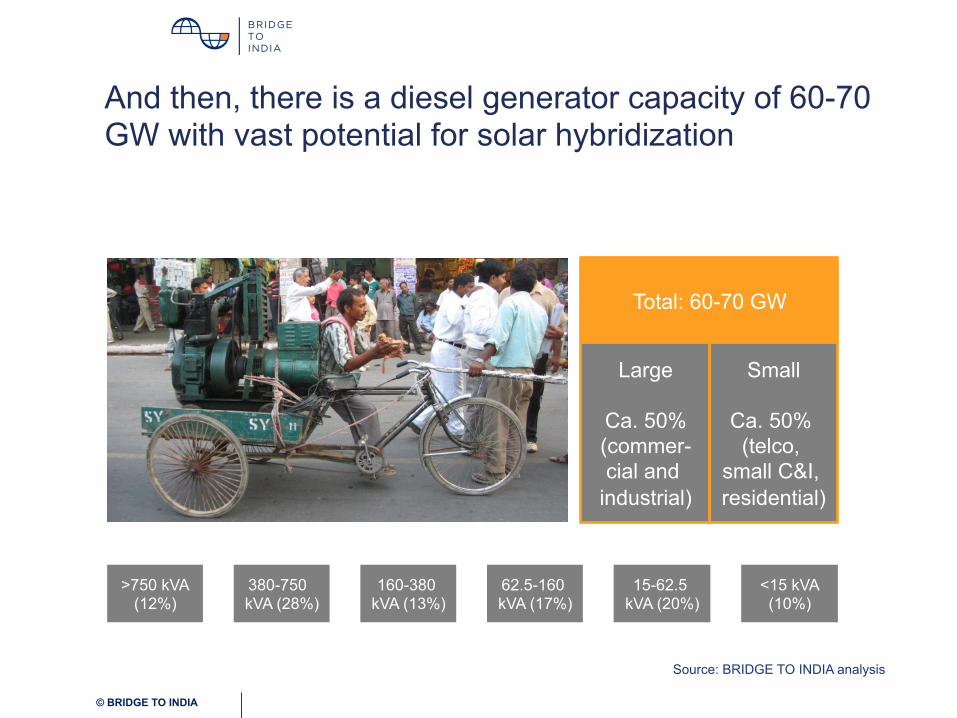
And then, there is a diesel generator capacity of 60-70 GW with vast potential for solar hybridization
Total: 60-70 GW
Small
Ca. 50% (telco,
small C&I, residential)
>750 kVA (12%)
380-750 kVA (28%)
160-380 kVA (13%)
<15 kVA (10%)
15-62.5 kVA (20%)
62.5-160 kVA (17%)
© BRIDGE TO INDIA
Large
Ca. 50% (commer-cial and
industrial)
Source: BRIDGE TO INDIA analysis

So what can European companies do in India?
© BRIDGE TO INDIA
Picture: The Economist
Sell “intelligent” grid related know-how?
Invest in projects? (new risk profile?)
Sell “intelligent” consumer power technologies?
Invest in startups?
… and more. (Remember: it’s a long term game)

© BRIDGE TO INDIA
www.bridgetoindia.com www.bridgetoindia.com/blog www.facebook.com/bridgetoindia LinkedIn group –’ India Solar Future’ www.twitter.com/bridgetoindia
Tank you!
[email protected] +91-124-420-4003
Recommended