American Journal of Research Communication www.usa-journals.com
Jagessar, et al., 2020: Vol 8(3) 1
The Fermentation of Sugar Rich Fruits: jamun (Syzigium Cumini), soursop (Annona Muricata), and papaya (Carica Papaya), with and without additives,
in order to produce optimum ethanol yield for commercial purposes
Jagessar1*, R.C; Douglas2, L.
1 Department of Chemistry, Faculty of Natural Sciences, University of Guyana 2 Final Year, Undergraduate Research student, 2013-2014
ABSTRACT The fermentation of sugar rich fruits: jamun (syzigium cumini), soursop (Annona muricata), and
Carica papaya in the absence and presence of additives was achieved under anaerobic condition
at a pH of 4-5. Initial and Final brixs were recorded and showed that fermentation was almost
completed. The final pH indicates that the filtrate prior to distillation was acidic, due to the
presence of carbonic and acetic acid. The reducing sugar content was measured before and after
fermentation. Papaya fruit matrix, without additive, yields the highest volume of ethanol, (4.650 ±
0.255, v/v), whilst soursop, the least (4.100 ±0.245, v/v). The effects of the additives were variable
at the different percentages of 0.1, 0.5 and 1%. 0.1% promalt, with 0.5% K3PO4 produced the
highest % yield of ethanol (14.163 ± 0.017, v/v), whereas the lowest % yield of ethanol (4.520 ±
0.08, v/v)) was produced by soursop with ZnSO4 additive. At the 0.5% level, promalt with 0.5%
K3PO4 produced the highest % yield (9.870 ±0.05, v/v). At the 1% level, K3PO4 additive produced
the highest yield (7.690 ±0.055, v/v) of ethanol. Compared to the reference compound, glucose,
the mean ethanolic content of the fruits, without and with additives,were lower than that of glucose
(9.480, v/v). Exception being, the mean ethanolic content with promalt at 0.1 % level with 0.5%
K3PO4 on soursop (14.163 ± 0.017, v/v) and at the 0.5% level (9.870 ± 0.05, v/v). Gas
chromatographic analyses were also done on the distillate, from the fermented matrix, without and

American Journal of Research Communication www.usa-journals.com
Jagessar, et al., 2020: Vol 8(3) 2
with additives. It was found that the distillate in most cases consists of ethanol and by products of
acetaldehyde, methanol, methylacetate, 1-propanol, ethylacetate, 1-butanol, isobutylalcohol, iso-
amyl alcohol, 2-methyl-1-butanol, 1-pentanol and furfural in most cases. Our research shows that
all of the selected fruits can be used as attractive substrates for the production of ethanol and hence
there cultivation should be encouraged as a boost to the Agro Sector of the country and also, a
source for the blending with gasoline to produce gas alcohol. However, future work is necessary
to intensify the yield of ethanol beyond the recorded in the literature.
Keywords: Fermentation, Saccharomyces Cerevisae fruit substrate, jamun, soursop, papaya,
0Brix, pH, temperature, potassium phosphate, zinc sulphate, distillate, ethanol.
{Citation: Jagessar, R.C; Douglas, L. The Fermentation of Sugar Rich Fruits: jamun (Syzigium
Cumini), soursop (Annona Muricata), and papaya (Carica Papaya), with and without additives, in
order to produce optimum ethanol yield for commercial purposes. American Journal of Research
Communication, 8: (3): 1-37}
1.0. INTRODUCTION
With, a view to decrease dependence on fossil fuel, as a result of depletion, increasing global
fuel prices, increasing population and increasing global warming, there has been increased interest
in the use of alternative renewable energy sources of which bioethanol is one 1-33. Bioethanol (b.p:
78.5°C) can be used for a variety of purposes, of which blending with gasoline to produce gas
alcohol to power automobiles is of current utilization in countries such as Brazil and the United

American Journal of Research Communication www.usa-journals.com
Jagessar, et al., 2020: Vol 8(3) 3
States 1,2,3, 7,10. In addition, ethanol is a clean burning renewable energy source1-33. Ethanol is also
an important component of alcoholic beverages such as wine, beer, cider, vodka, gin. whisky,
brandy etc. It is also an important starting materials for aldehydes, ketones, carboxylic acid,
carboxylic acid derivatives and the hydroxyl group is a component of many pharmaceutical drugs 5. Ethanol can be used in the perfume, disinfectant, tincture, biological and biofuel industries.
Ethanol production via fermentation has been one of the world most significant approaches to aid
in the advancement of Commercial Industry1-33.
Ethanol doesn’t have significant environmental impact as fossil fuel combustion 1-33. It has
low air polluting effect and low atmospheric photochemical reactivity, further reducing impact on
the ozone layer1-33. It contributes little net CO2 accumulation to the atmosphere and thus should
curb global warming1-33.
Ethanol can be used in three primary ways as biofuel, namely, E10 which is a blend of 10%
ethanol and 90% unleaded gasoline, a component of reformulated gasoline, both directly and or as
ethyl tertiary butyl ether (ETBE) and as E85 which is 85% ethanol and 15% unleaded gasoline.
When mixed with unleaded gasoline, ethanol increases octane levels, decreases exhaust emissions
and extends the supply of gasoline. Bio-ethanol is made by fermenting almost any material that
contain starch or sugar. Grains such as corn and sorghum are good sources, but fruits that are high
in sugar concentration are excellent sources as well, since they contain ready to ferment sugars 10
To solve the above problem, emanating from fossil fuel, one alternative is to produce
bioethanol from fruits, other grown organic matter or waste3,4,6-29. Bioethanol can be obtained via
the fermentation of glucose, fructose or sucrose under the influence of Saccharomyces cerevisiae
at room temperature, 4-33. Also, acid hydrolysis of lignocellulose material followed by subsequent
fermentation 3,9-33 . Sugar rich sources include ripe fruits 8-28 etc. Other sources include
biodegradable fraction of products, waste and residues from agriculture like vegetables and animal
origin 7-28 etc. The percentage yield of ethanol, ranging from 4.0 -10.0 v/v) have been reported 3-
33. Fruits that are high in sugar concentration are favourable to the fermentation process, since they
can produce high percentage volume of ethanol 9-33
The process of fermentation using yeast, Saccharomyces cerevisiae occurs under certain
factors which is suitable for the production of ethanol. The importance of maintaining specific
conditions for fermentation, in which the increase in temperature to 45 °C enabled the system to
still show high cell growth and ethanol production rates, while it was inhibited at 50 °C and the

American Journal of Research Communication www.usa-journals.com
Jagessar, et al., 2020: Vol 8(3) 4
pH. 4.0–5.0 was the optimal range for the ethanol production process 21. Ethanol fermentation is
anaerobic pathway carried out by yeast in which simple sugars are converted to ethanol and carbon
dioxide 7-28. Jamun (Syzygium cumini) fruit was utilized for the production of red wine which offers
a lot of health benefits by acting as an effective medicine. The alcohol content of the wine varied
from 6.62 to 10.25, depending upon the variable concentration of total soluble sugars (7.88 to
10.53%) and varying levels of yeast (5, 10, 15 and 20%). Saccharomyces cerevisiae was used in
the fermentation process 29.
A red wine from anthocyanin-rich tropical jamun fruit having medicinal (anti-diabetic and
curing bleeding piles) properties was prepared via fermentation, using wine yeast, Saccharomyees
cerevisiae) and the quality attributes compared with commercial grape red wines30. A kinetic
evaluation of the fermentation of soursop (substrate) by Saccharomyces cerevisiae (yeast enzyme)
was conducted by determining the effect of various parameters (such as temperature, substrate,
pH, and yeast concentration) on the rate of production of CO2 31.
The production of ethanol from Carica papaya (pawpaw) agricultural waste, using dried
active bakers yeast strain (Sacchromyces cerevisiae) was investigated. The results of this work
show that the rate of alcohol production via fermentation of pawpaw fruit waste by bakers yeast
(Sacchromyces cerevisiae) increases with fermentation time and peaked at 72 h. It is also increased
with yeast concentration at the temperature of 30 °C. The optimum pH for fermentation is 4.5 32
The ethanolic content of Papaya (Carica papaya) verses Sapodilla (Manilkara zapota) via
fermentation has been reported33. The mean ethanolic content of papaya (1.964, v/v) was lower
than that of sapodilla (14.91, v/v). It was found that Magnifera indica (mango) in the presence of
additives produced the highest mean yield of ethanol of 25.16%, v/v 34. Other substrates that play
a positive role in the production of ethanol are the presence of salts, the pH, and the presence of
substances that enhance the activity of the enzymes of the yeast species. As mentioned before,
when these conditions are rightly set, the amount of ethanol that will be produced will be
significantly greater than the customary amount at room temperature. If these conditions are met
it could affect the yeast growth35 and as a result affect fermentation as depicted in diagram below:

American Journal of Research Communication www.usa-journals.com
Jagessar, et al., 2020: Vol 8(3) 5
Fig. 1.0 The relationship between fermentation and the growth of yeast
Based on research conducted, nitrogenous compounds, ammonium, urea, magnesium sulphate
salts, potassium salts, and also amino acids all enhance the production of ethanol. The addition of
nitrogenous compounds, enhances the yield that is obtained, and also ammonium and urea salts
play a role in the functioning of the yeast enzymes. The presence of certain salts such as
magnesium sulphate and potassium salts is also known to bring about higher yields of ethanol. A
high initial sugar concentration brings about a significant yield of ethanol provided that an
osmotolerant strain of yeast is being utilized. High substrate concentrations have an inhibitory
effect on the yeast strain, because of high osmotic pressure and low water activity, which serves
to dehydrate the yeast. Hence, the use of an osmotolerant species of yeast nullifies the dehydration
problem and maximizes on ethanol yield. Amino acids are required to act as catalysts, since they
convert nitrogen into the ammonium state that is required by yeast.
This paper reports the fermentation of jamun(Syzigium Cumini), soursop(Annona Muricata),
and papaya (Carica Papaya), with a view to produce ethanol for commercial use and in the future
blending with gasoline to produce gas-alcohol. Guyana has started to use the initiative Brazil has
taken over the past forty two years. The first fleet of vehicles belonging to the Ministry of
Agriculture was fueled up by bio-friendly ethanol, at the launch of the Bio-ethanol E-10 Fuel brand
in Guyana in 2014. The plant is capable of producing fuel blends with 5%, 10%, 15%, 20% and
25% ethanol. The plant is focused primarily on mixing gasoline with ethanol at 10% to produce
E-10 blend that is compatible with vehicles in Guyana and which has been tested successfully on

American Journal of Research Communication www.usa-journals.com
Jagessar, et al., 2020: Vol 8(3) 6
Toyota Corolla35.
2.0. MATERIALS AND METHODS
2.1. Methodology
2.2. Chemicals
n-Butanol (BuOH) and ethanol (analytical grade, 99.5%) were purchased from Sigma-Aldrich
(Israel) and used thereafter without any pretreatment. Ethyl acetate (analytical grade, 99.5%) was
purchased from Frutarom (Israel). Glucose, KH2PO4, NH4SO4 and MgSO4*7H2O were from
Sigma (all chemically pure or higher grade).
2.3. Raw materials:
Fruits such as Papaya, soursop were obtained from the local market at Bourda , Georgetown, while
Jamun was obtained from a farm in #1 Canal Bagotville, West Bank Demerara. The fruits were
transported to Banks DIH Rum Factory Laboratory on the required days, where they were prepared
for experimentation.
2.4. Reducing sugar test:
About 2ml of each fruit sample was placed in test tubes, then using a pipette, 10 drops of Benedict’s
solution was added to the test tube. This was then placed in a hot water bath, until a yellow or
orange colour change was observed. This would indicate the presence of reducing sugars. This
was done before and after fermentation.
2.5. Preparation of Samples:
Soursops (papaya ) were washed thoroughly with distilled water, seeds were removed , then 550g
of the fruit pulp and skin were weighed thrice on an electric balance, then proceeded to be blended

American Journal of Research Communication www.usa-journals.com
Jagessar, et al., 2020: Vol 8(3) 7
using a sterile juice blender (with each 550g portion of fruit being blended in 130ml of distilled
water). The fruit pulp & skin matrix was then poured into three (3) plastic jars that were sterilized
prior to use (550g of fruit pulp & skin matrix in each jar). The jamun fruit was squeezed manually
to separate seed from pulp, instead of blending and all the contents of the fruit was used, then
weighed (550g) and distilled water was also added to each matrix. The fruit pulp & skin matrix
was then poured into three (3) plastic jars that were sterilized prior to use (550g of fruit pulp &
skin matrix in each jar). The initial pH of the fruit pulp & skin matrix, its temperature and its total
initial soluble solids content (0 Brix) were measured prior to fermentation.
2.6. Yeast Rehydration:
The yeast strain used was wine yeast (Saccharomyces cerevisiae). This was provided by Banks
DIH. 6g of the dried yeast each were weighed in three sterilized 100ml beakers, and then 40ml of
lukewarm distilled water was added to each beaker. This was mixed properly using a sterilized
plastic spatula to ensure all the yeast was completely dissolved. After which each beaker was
sealed using plastic paraffin seals and left to stand for 60 minutes.
2.7. Yeast nutrients:
Yeast nutrients, such as a small sample of the fruit pulp & skin matrix and or metal salts solution
were added to the beaker with the yeast to aid in rapid yeast replication (growth) by starting a mini
culture. The beakers were covered again using plastic paraffin seal and left to stand for 20 minutes.
2.8. Using Promalt:
Promalt was used to aid in the hydrolysis of unevenly modified D- glucose to alpha glucose and
also to solubilize amino acids, proteins and polypeptides. Also it has the properties to hydrolyze
starch(if present) to glucose, due to the presence of the enzyme alpha amylase. This was achieved
by weighing small grams promalt (0.5g, 1.0g, and 1.5g) and adding to 500 ml beaker containing

American Journal of Research Communication www.usa-journals.com
Jagessar, et al., 2020: Vol 8(3) 8
fruit pulp & skin matrix, then gently heating the mixture to a temperature of 680C to allow the
enzymes to work optimally.
2.9. Fermentation procedure:
The fruit pulp & skin matrix were prepared initially (soursop, then papaya followed by
jamun) as described above. Reducing sugar test was carried out as described above. The yeast was
then hydrated as described above. The hydrated yeast, Saccharomyces cerevisiae, was slowly
poured into to each plastic jar containing each fruit mash and each jar was sealed creating an
anaerobic environment by only allowing carbon dioxide to be given off, but not for oxygen to be
entered. This was done by a rubber bound, with a rubber tube leading out of it at the mouth of the
jars. This tube was immersed in a test tube containing paraffin oil. The jars were then left to ferment
for three days in a dark room, where the temperature was approximately 28-30ºC. Yeasts need low
pH to replicate but higher acidity than the normal range can inhibit chain elongation which
affect DNA replication After fermentation, the temperature of fruit mash was measured. Filtration
was then carried out, using a Whatman filter paper, a glass funnel and another (sterilised) glass jar.
This was done for each jar, giving a total of three glass jars with filtrate. After fermentation (for
some samples), reducing sugar test was carried out on a small volume (approximately 2ml) of the
fermented samples. For each fruit, the same procedure was repeated in triplicate, with varying
concentration of metal salts. The procedure was repeated using 5ml of 0.1%, 0.5%, and 1.0% zinc
sulphate, respectively which was added to the beaker with yeast prior to mixing with fruit skin &
pulp matrix. The procedure was further repeated using 5ml of 0.1%, 0.5%, and 1.0% potassium
phosphate respectively which was added to the beaker with yeast prior to mixing with fruit skin &
pulp matrix. The above procedure was repeated using 0.5g promalt as described above and 5ml of
0.5% potassium phosphate was added to yeast hydrant. This was then repeated using 1.0g promalt
and 0.5% potassium phosphate, then 1.5g promalt and 0.5% potassium phosphate respectively.
220g of glucose was diluted in 1L of water. This was measured equally and placed in three separate
jars. The fermentation procedure describe above was repeated. Fig. 2.0. (a) shows the apparatus
that was setup to conduct fermentation, whereas Fig. 2.0. (b) is the apparatus used for distillation.
Fig. 3.0. shows the density meter used to determine Brix & % yield of ethanol.

American Journal of Research Communication www.usa-journals.com
Jagessar, et al., 2020: Vol 8(3) 9
Fig. 2.0 (a) above shows how apparatus that was set up to conduct fermentation, whereas
Fig. 2.0 (b) is the apparatus used for distillation.
Figure 3.0 shows the Density Meter used to determine Brix and % ethanol.

American Journal of Research Communication www.usa-journals.com
Jagessar, et al., 2020: Vol 8(3) 10
3.0. Analytical assay 3.1.pH
Measuring pH before and after fermentation was done by placing the probe of a small amount of
sample (before fermentation) and filtrate (after fermentation). The brand of the pH meter used was
OAKLAND Waterproof Data Meter pH 310 Series.
3.2. Acidity
3.3. Preparation of stock solution:
Sodium hydroxide stock solution was prepared by diluting 12g NaOH pellet in 1L water.
3.4. Standardization:
25 ml aliquot of the stock solution was placed in a conical flask and a few drops of drops of
phenolphthalein were placed in aliquot. This was then titrated against a 0.2N hydrochloric acid
solution until a pink colour change was observed. The concentration of the stock solution was
determined by calculation and was confirmed to be a 0.2N NaOH
3.5. Determining concentration of acetic acid of filtrate:
The 0.2N NaOH was placed in a burette. Using a 25ml volumetric flask, 25ml of filtrate from each
jar was measured out and poured into three separate 100ml beaker. The initial pH was checked,
and then the initial volume in burette was also written down. 25ml aliquot was titrated against
0.2N NaOH drop-wise and by vigorously swirling the mixture with the probe of the pH meter
being kept in the beaker, this was continued until the pH reached 6.2. The final reading on the
burette was subtracted from the initial and this value was multiplied by a factor of 8. The answer
was recorded as the concentration of acetic acid in each filtrate (the lower the pH the, more acidic
the sample).

American Journal of Research Communication www.usa-journals.com
Jagessar, et al., 2020: Vol 8(3) 11
3.6. 0Brix
The brand of the instrument used was a DMA 5000 Anton Paar Density meter. The initial and
final amount of total soluble solid was measured before and after fermentation and was referred to
as 0Brix. The value that is obtained for degrees Brix is a good approximation to the true value for
total soluble solids. This was achieved by drawing 2ml of the liquid sample into a 2ml syringe
(samples were drawn carefully to avoid introducing air bubbles in syringe). With the density meter
setting placed as Brix. The sample was carefully injected into the sample collecting tube (samples
were carefully injected to avoid introducing air bubbles into the sample tube). Keeping syringe in,
the start button was then pressed and the reading was printed on the screen. After that, the syringe
was removed and the contents in tube was flushed on into a waste jar using distilled water and air
pressure.
3.7. Distillation
100 ml volumetric flask was rinsed with filtrate. The volumetric flask was carefully filled
with the filtrate slightly over the mark. This was placed in a water bath with thermometer in flask.
The content in flask was attemperated to 200C( temperature at which volumetric flask was
calibrated). If extra was needed to be removed or topped up, a pasteur pipette was used. This
content was quickly transferred to a 250ml round bottom flask. The volumetric flask was then
rinsed with 50ml distilled water to prevent flask from boiling dry. Boiling chip was added to flask,
and then connected to the distillation assembly, ensuring that all ground glass joints were secure.
Cold water was constantly being flowed through the condenser. The 100ml volumetric flask was
immered in a cold water bath and placed under the distillation apparatus as per figure. The adaptor
tubing was placed properly into flask. Heat was applied to the round bottom flask end of the
distillation set up which contained filtrate and water, boiling commenced after a few minutes.
When the distillation commenced, the condensed distillate was let to accumulate to about 80-100
ml in collecting volumetric flask. The boiling ceased and the flask was removed after this was
achieved. The content in flask was then attemperated to 200C. Then was stoppered and placed in
an ultrasonic shaker( Mettler Toledo)

American Journal of Research Communication www.usa-journals.com
Jagessar, et al., 2020: Vol 8(3) 12
3.8. Determining alcohol percentage:
Using a DMA 5000 Anton Paar Density meter, 2ml of the liquid sample was drawn into a 2ml
syringe (sample of the distillate were drawn carefully to avoid introducing air bubbles in syringe).
With the density meter setting, placed as OIML V/V. The sample was carefully injected into the
sample collecting tube (samples were carefully injected to avoid introducing air bubbles into the
sample tube), keeping the syringe in, the start button was then pressed and the reading was printed
on the screen. After that, the syringe was removed and the contents in tube was flushed on into a
waste jar using distilled water and air pressure.
3.9. Gas chromatogram analyses
Another way to confirm the amount of ethanol in distillate is by the use of a gas chromatogram.
However, the method used was not able to quantify the ethanol peaks on the gas chromatogram,
but was able to quantify the presence of other forms of alcohol that was in a smaller concentration
compared to ethanol and was present because distillate was not 100% pure ethanol. The method
used was the External Standard method for determining amount of various forms of alcohol
isomers found in distillate. Distillates were analyzed on Gas chromatogram (Agilent
Technologies). Distillate samples were placed in glass vials and labeled properly. The
corresponding information was inputted on the monitor then the samples were run. The gas
chromatogram was later printed on screen, the area under the curve was calculated automatically
and the amount of each compound present (except ethanol) was quantified and results printed on
screen. Analysis of ethanol and butanol was conducted using SRI GC model 8610C, equipped with
a 60 m column (Restec MXT-1, Id 0.53 mm, 5 µM), on-column injector and FID conditions:
250°C; H2, 25 PSI, equivalent to 25 ml/min; air, 2 PSI, equivalent to 100 ml/min; gain set
to 'medium'. The GC was also equipped with an internal air compressor and hydrogen generator.
N2 was used as carrier gas with pressure control (24 PSI constant; equivalent to 27 ml/min). The
GC was connected to a computer running Peak Simple software version 2.8. Oven temperature
(and hence column and injector temperature) was initially set at 50°C and then elevated at the rate
of 7°C/min to 100°C, thus giving a total run time of 7 min. Furthermore, 2 µL samples were

American Journal of Research Communication www.usa-journals.com
Jagessar, et al., 2020: Vol 8(3) 13
injected manually at time 0, using a 5 µl Hamilton syringe and temperature cycle was started.
Syringe was thoroughly washed with ethyl acetate between injections to avoid cross-
contamination. Each injection was repeated three times, ethanol routinely came out at retention
time equivalent to 65°C.
Another method proposed under the title “Analysis of volatile aroma constituents of wine produced
from Indian mango (Mangifera indica L) by GC-MS is as follows37:
The analysis of volatile compounds was carried out by a Hewlett-Packard series 6890, gas
chromatograph linked to an HP-5973 mass-selective detector equipped with fused silica capillary
column. The flow rate of carrier gas helium was 1 ml/min. The injection volume was 1 μl. The
injection temperature was programmed from 60°C for 2 min and then raised to 250°C at 4°C/min,
held for 20 min. Injector temperature was maintained at 250°C. Mass spectra (MS) were acquired
in the electronic impact (EI) and positive chemical ionization (PCI) modes. The transfer line
temperature was 250°C. MS were scanned at 70 ev electron impact mass spectrometry (EIMS) and
230 eV positive chemical ionization mass spectrometry (PCIMS) in the range m/z 29–350 atomic
mass unit (amu) 1–s intervals. A sample of 100 ml of wine was adjusted to pH 7, by the addition
of NaOH, and 1 ml of 4-methyl-2-pentanol (at a concentration of 10 mg/l) was added as an internal
standard. The sample was extracted three times with diethyl ether. The sample was reduced to 1
ml by evaporating the ether solvent in a rotary evaporator at 40°C with low pressure. An aliquot
(1 μl) of sample was injected into GC-MS. The identification of the volatile compound was
confirmen (MS Chemstation Wiley 7N library) or with their retention times of standards. The
analysis was carried out in triplicate
3.10. Standard solutions and calibration curves
Standard solutions of n-butanol were prepared in ethyl acetate (EtOAc) and injected without
further treatment. Standard solutions of ethanol (EtOH) were prepared in distilled water containing
1% v/v of n-butanol as an internal standard, extracted and injected. Peak area ratios of the ethanol
vs. n-butanol were calculated and plotted against ethanol concentration (% v/v) to afford a
calibration curve which served for ethanol quantification in the fermentation samples.

American Journal of Research Communication www.usa-journals.com
Jagessar, et al., 2020: Vol 8(3) 14
4.0. Results
Table 1.0. shows some physical characteristics of the fruits before and after fermentation
Local
(Scientific
name)
Initial
Degrees Brix
(0.05Bx)
Final
Degrees Brix
(0.05 Bx)
Initial pH of
solution
Final pH of
Filtrate
Average
concentration
of acetic acid
(± 0.1g/ml)
Jamun
(Syzigium
cumini)
14 2.625 3.20 3.03 170
Papaya
(Carica
papaya)
11.3 1.237 4.81 4.06 65
Soursop
(Annona
Muricata)
16.55 1.433 4.20 3.74 70
Glucose 16.63 0.00 6.67 3.11 55

American Journal of Research Communication www.usa-journals.com
Jagessar, et al., 2020: Vol 8(3) 15
Table 2.0. Shows the (mean % ethanol ± SD) for the different substrates with the different
composition of metal salts
Fruit
Type
Mean %
v/v
Ethanol ±
SD , v/v
Mean %
Ethanol ± SD
with additive (ZnSO4),
v/v
Mean %
Ethanol ± SD
with additive (K3PO4),
v/v
Mean %
v/v Ethanol ± SD
with additive (Promalt) and 0.5%
K3PO4
0.1% 0.5% 1% 0.1% 0.5% 1% 0.1% 0.5% 1%
Soursop 4.100 ± 0.245 4.650±0.101 4.520± 0.08
6.740± 0.01
4.780±0.091 8.690± 0.095
7.690± 0.055
14.163±0.017 9.870±0.05 7.430± 0.026
Jamun 4.640 ± 0 4.970± 0.02 5.220±0.1 5.220± 0.355
5.340± 0.16 5.740± 0.065
5.630± 0.081
6.570± 0.098 7.530± 0.026 6.950± 0.05
Papaya 4.650 ± 0.255 5.220±0.173 5.260± 0.036
4.780± 0.043
5.400± 0.021
5.700± 0.1
4.900± 0.173
4.930± 0.435 5.710± 0.494 5.470± 0.13
Glucose 9.480 8.870 9.120 8.940 9.360 9.180 9.120 8.800 8.590 9.030

American Journal of Research Communication www.usa-journals.com
Jagessar, et al., 2020: Vol 8(3) 16
Table 3.0. Below is the List of Standards that were present to analyze the sample injected
Ret timeReRe Area
( pA*s)
Amt/Area Amount
(g/100LAA)
Name of
compound
2.851 9.27157 2.16792e-1 2.01000 Acetaldehyde
3.074 9.38672 2.14132e-1 2.01000 Methanol
- - - - Ethanol
4.916 11.80068 1.70329e-1 2.01000 Methyl Acetate
7.151 15.16423 1.32549e-1 2.01000 1-propanol
7.911 13.18315 1.52467e-1 2.01000 Ethyl Acetate
8.186 16.82237 1.19484e-1 2.01000 2 Butanol
9.081 18.99220 1.16958e-1 2.01000 Iso butyl alcohol
10.055 35.05545 1.16958e-1 2.01000 1 Butanol
11.834 19.08633 1.05311e-1 2.01000 Iso Amyl
Alcohol
11.907 21.34000 9.41893e-1 2.01000 2 Methyl-1
butanol
12.565 18.55479 1.08328e-1 2.01000 1 Pentanol
14.389 12.41335 1.61922e-1 2.01000 Furfural
Ret time Area
( pA*s)
Amt/Area Amount
(g/100LAA)
Name of
compound
2.851 9.27157 2.16792e-1 2.01000 Acetaldehyde

American Journal of Research Communication www.usa-journals.com
Jagessar, et al., 2020: Vol 8(3) 17
Gas Chromatograph 1.0. shows the profile of absolute ethanol at a 99.99% ethanol (Reference
sample)
American Journal of Research Communication www.usa-journals.com
Jagessar, et al., 2020: Vol 8(3) 18
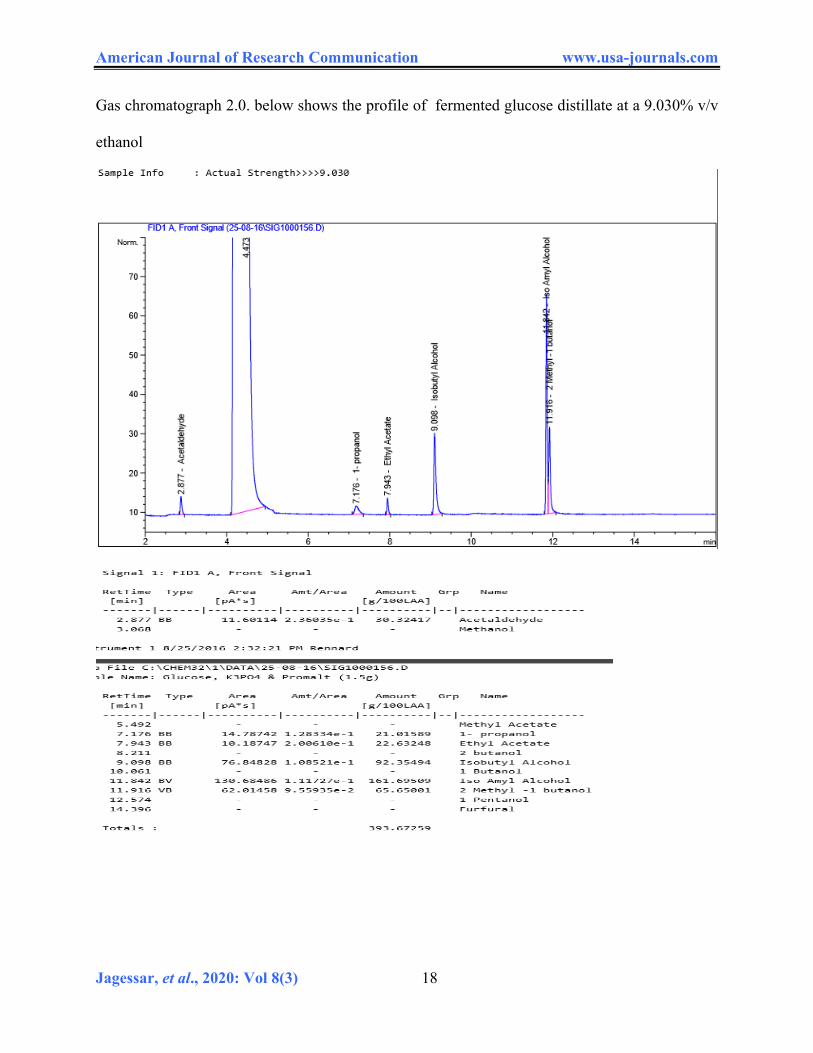
Gas chromatograph 2.0. below shows the profile of fermented glucose distillate at a 9.030% v/v
ethanol

American Journal of Research Communication www.usa-journals.com
Jagessar, et al., 2020: Vol 8(3) 19
Gas chromatograph 3.0 below shows the profile of Soursop(Annona Muricata) distillate at a
(14.163% v/v ethanol)

American Journal of Research Communication www.usa-journals.com
Jagessar, et al., 2020: Vol 8(3) 20
Gas chromatograph 4.0 below shows the profile of jamun (Syzigium Cumini) distillate at a
7.53%v/v ethanol

American Journal of Research Communication www.usa-journals.com
Jagessar, et al., 2020: Vol 8(3) 21
Gas chromatograph 5.0 below shows the profile obtained for of papaya (Carica Papaya) distillate
at a 5.360%v/v ethanol

American Journal of Research Communication www.usa-journals.com
Jagessar, et al., 2020: Vol 8(3) 22
Gas chromatograph 6.0. below shows the profile of Soursop (Annona muricata) and Potassium
phosphate distillate at 8.494% ethanol.
.

American Journal of Research Communication www.usa-journals.com
Jagessar, et al., 2020: Vol 8(3) 23
6.0. Statistical analysis: Each experiment was repeated thrice and results are expressed as means ± standard deviations.
The data obtained were analyzed by Anova test1 in Microsoft excel 2010 by using single factor
and two factors with replication of variance. It was carried out to test for any significant differences
between the means values at a 95% confidence level. Null Hypothesis for the test: there is no
significant difference in the % volume of ethanol produced. If p-value is ˂ 0.05 there is
significance difference between the values. Also, if F value calculated is < than F critical, there is
no significance difference between the values.

American Journal of Research Communication www.usa-journals.com
Jagessar, et al., 2020: Vol 8(3) 24
Table 4.0. Shows a summary of the results obtained from Anova: Single factor test to
compare % ethanol obtained for all fruit substrates without additive
Source of
Variation
SS df MS F P-value F critical
Between
Groups
0.590689 2 0.295344 7.073177 0.026416 5.143253
Within
Groups
0.250533 6 0.041756
Total 0.841222 8
Table 5.0. Shows a summary of the results obtained from Anova: Two factors with
replication test to compare % ethanol for all fruit substrates with selected additive
ANOVA
Source of
Variation
SS df MS F P-value F crit
Sample 79.95382963 2 39.97691481 1374.535232 4.88105 x
10-47
3.168245967
Columns 112.3597111 8 14.04496389 482.9111448 2.26522 x
10-47
2.115223279
Interaction 138.9890815 16 8.686817593 298.6807985 9.97375 x
10-47
1.834629446
Within 1.570533333 54 0.029083951
Total 332.8731556 80

American Journal of Research Communication www.usa-journals.com
Jagessar, et al., 2020: Vol 8(3) 25
7.0. Graphical Analysis Bar graph 1.0 below showing average % v/v of ethanol that was obtained for Soursop(Annona
Muricata) using selected additives
Bar graph 2.0 below showing average % v/v of ethanol that was obtained for Jamun (Syzigium
Cumini) using selected additives
0
2
4
6
8
10
12
No Additive Zinc Sulphate Potassium Phosphate Potassium Phosphate& Promalt
% V
olum
e et
hano
l
Fruit/Substrate solution Sample
0
1
2
3
4
5
6
7
8
No Additive Zinc Sulphate Potassium Phosphate Potassium Phosphate& Promalt
% V
olum
e Et
hano
l
Fruit/substrate Solution Sample

American Journal of Research Communication www.usa-journals.com
Jagessar, et al., 2020: Vol 8(3) 26
Bar graph 3.0 below Showing average % v/v of ethanol that was obtained for Papaya(Carica
Papaya) using selected additives
Bar graph 4.0 below showing the average % volume of ethanol that was obtained for the selected
fruits and reference glucose, with and without additives.
0
1
2
3
4
5
6
No Additive Zinc Sulphate Potassium Phosphate Potassium Phosphate &Promalt
% V
olum
e Et
hano
l
Fruit/Substrate Solution Sample
0
2
4
6
8
10
12
Soursop Jamun Papaya Glucose
%Vo
lum
e Et
hano
l
Fruit/Substrate Solution Sample
No Additive
Zinc Sulphate
PotassiumPhosphate
PotassiumPhosphate &Promalt
American Journal of Research Communication www.usa-journals.com
Jagessar, et al., 2020: Vol 8(3) 27
8.0. Discussion
The main objective of this research was to produce ethanol and to see what effects the
variables in metal salts such as ZnSO4, K3PO4 and promalt with 0.5% K3PO4 will have on the
mean percentage yield of ethanol. The initial 0Brix (initial total soluble solids), is a measurement
of the amount of sugar/sucrose that are available for fermentation. Of the three fruits, soursop
displayed the highest initial 0Brix value (16.55), followed by jamun (14.0) and the least was papaya
(11.3). Hence, its was anticipated that soursop produced the highest yield of ethanol, followed by
jamun and papaya. As fermentation proceeds, the Brix content is expected to decrease. As an
indication of complete and efficient fermentation, the Final Brix value is expected to be zero.
From Table 1.0, it was noticeable that the final brix value was not zero. The final Brix value range
from (1.237 to 2.625), indicating that some more hours were necessary for complete fermentation.
For soursop, the initial brix was 16.55 and the final brix was 1.433. For the reference compound,
glucose, it was noticeable that the final brix was zero, indicating that fermentation has proceeded
to completion and was highly efficient. In addition, Fehling’s reducing sugar test indicates that
there was still some fermentable sugar left after the prescribed fermentation period. Hence, some
more time was necessary for fermentation.
Table 2.0. shows the mean % ethanol ± SD for the different fruit substrates in the absence
and presence of additives. The mean ethanol content v/v) in the absence of additives range from
(4.100 ±0.245 v/v) to (4.650 ±0.255 v/v) ethanol. The highest percentage yield of (4.65 ±0.00, v/v)
was produced by fermented papaya. Thus, the mean ethanolic content decrease in the order: papaya
> jamun > soursop. All the additives produce an increase in the mean % of ethanol, v/v to that
without. This can be discussed with reference to each fruit. However, for additives, increasing the
percentage concentration of the additive, didn’t always increase the mean % of ethanol yield, v/v).

American Journal of Research Communication www.usa-journals.com
Jagessar, et al., 2020: Vol 8(3) 28
Some showed an increase at the 0.5% and then a decrease at 1%, whereas others showed a decrease
at 0.5% and then an increase at 1%. For example, consider soursop, as a typical example, with
ZnSO4 as an additive, there was an increase in ethanolic content at 0.1% i.e from (4.100 ± 0.245
v/v to 4.65 ± 0.10, v/v). At the 0.5% concentration of ZnSO4, this decrease to 4.520 ±0.08, v/v)
and then increase to 6.74 ±0.01, v/v) at the 1% concentration. For the K3PO4 additive, there was
an increase at the 0.1% concentration, (4.78 ±0.091, v/v). There was also a further increase of
value to (8.690 ±0.0095, v/v) at the 0.5% concentration. However, at the 1% value, there was a
decrease to (7.690 ±0.055, v/v). Likewise for jamun, there was an increase in ethanolic content
from (4.64 ± 0.00, v/v to 5.340 ± 0.11, v/v) at 0.1 % level with K3PO4. At the 0.5% concentration,
the value increase to (5.740 ± 0.065, v/v) and then decrease to (5.630 ± 0.081, v/v) at the 1% level.
For the soursop with promalt additive, and 0.5% K3PO4, the mean ethanolic content increase from
(4.100 ± 0.245, v/v to 14.163 ±0.017 , v/v) at the 0.1% level, then to (9.87 ±0.05, v/v) at 0.5%
level and then decrease further to (7.430 ± 0.026, v/v) at the 1% level.
The additive increased the ethanolic content to varying percentage and this is dependent
on the fruit type. Comparing the 0.1 % addition, the highest increase was seen for soursop with
promalt’s addition and 0.5% K3PO4 (14.163 ± 0.017, v/v) and the lowest at the 0.1% addition of
ZnSO4 on soursop (4.650 ± 0.101, v/v). The lowest mean % of ethanol was registered with ZnSO4
on papaya (4.780 ± 0.043, v/v) at the 1.0% level. At the 0.5% percentage, the highest percentage
yield of ethanol of (9.870 ± 0.05, v/v) was produced by soursop with promalt additive and 0.5%
K3PO4, whereas the lowest of (4.520 ± 0.08, v/v) was induced by soursop with 0.5% ZnSO4. .
At the 1% concentration, the additive that produced the highest % yield of ethanol was K3PO4 on
soursop (7.690 ±0.05, v/v ) and the lowest was induced by papaya with ZnSO4 at the same
percentage. Bar graph 1.0, 2.0 and 3.0 shows the average % v/v of ethanol that was obtained for

American Journal of Research Communication www.usa-journals.com
Jagessar, et al., 2020: Vol 8(3) 29
soursop (Annona muricata), Jamun (Syzigium cumini) and papaya (Carica papaya) with and
without additives. Bar graph 4.0 shows the average % volume of ethanol that was obtained for the
selected fruits and reference glucose, with and without additives.
Other than the production of lactic acid (which is due to the fact that fermentation is an
anaerobic process), acetic acid is also produced if filtrate is exposed to oxygen, Acetobacter
bacteria will convert some of the ethanol into acetic acid. This process is known as the acetification
and can be determined by titration, in which 25ml of each filtrate was titrated against a 0.2N
sodium hydroxide to determine how much acetic acid was produced. From Table 1.0, fermented
jamun produced the highest acidity (168-170 (g/ml) followed by soursop (68-70g/ml), then papaya
(64-65g/ml) and lastly glucose (55- 56g/ml). Accordingly, at normal fermentation, the range of
acetic acid is around 300-400mgs/L. Yeasts need low pH to replicate, but higher acidity that the
normal range can inhibit chain elongation which affect DNA replication
As much as ethanol is a major end product of fermentation, there are also other by products
produced such as CO2, other alcohol isomers, various forms of acids etc. The jar used to ferment
each substrate was modeled in such a way as to create an anaerobic environment and also to let
the excess carbon dioxide produced to be released. The presence of carbon dioxide inhibits
fermentation31 and it was important to have this carbon dioxide released, creating a more
fermentable environment. As the yeast goes through its growth stages, it has to then compete with
the production of ethanol, and scarcity of nutrients. Thus, a step was taken further to analyze the
distillates on a gas chromatogram by the use of External method, the problem with this method is
that the ethanol peak could not have been quantified, but this was the best available option with
limited time at hand. Due to the fact that the filtrates were distilled using simple distillation it
meant that the distillate would not have been pure ethanol because during fermentation process

American Journal of Research Communication www.usa-journals.com
Jagessar, et al., 2020: Vol 8(3) 30
other side reactions also take place resulting in the production of other alcohol isomers. To confirm
that ethanol was in the samples, absolute ethanol was analyzed on the GC and was used as a
reference to superimpose the retention time at which ethanol peak comes off, and that large peak
came off at a retention time from 4 to 6 minutes because its purity being 99.99% pure absolute
ethanol. The profile came back as null when all of the other external standards were compared.
Keeping this in mind all the other distillates were analyzed and at a similar retention time, the
largest peak came off that was no able to be quantified based on the calibration of the instrument.
This large peak was concluded to be the ethanol peak. There were other forms of isomer that were
able to be quantified and the area under each of these peaks was integrated by the use of a
calculation factor that is done automatically by the Gas chromatogram. This maintained for each
gas chromatograph profile produced.
Glucose, which was used as a fermentation reference, was analyzed on gas chromatogram.
At a 9.030%(v/v) ethanol as determined by the density meter, the profile produced by this run
shows that a large peak came off at 4.473 retention time and this peak was not quantified was
concluded to be the ethanol peak. Also, traces of acetaldehyde, 1-propanol, Ethyl Acetate, Isobutyl
Alcohol, Amyl Alcohol, and 2 Methyl-1-butanol and the retention times were 2.877, 7.176, 7.943,
9.098, 11.842, and 11.916 minutes respectively. Second to ethanol was iso amyl alcohol
(161.69509g/100L of absolute alcohol) and the least abundance form of isomer in this sample was
that of 1-propanol( 21.01589 g/L of absolute alcohol). The total volume of the isomers quantified
by the gas chromatogram was 393.67259g/100L of absolute ethanol. The GC profile for the
soursop distillate (14.16%v/v ethanol) , showed a that a large peak came off at 4.407(min) retention
time and this peak was not quantified and was concluded to be the ethanol peak. Also were traces
of acetaldehyde, methanol ,1-propanol, Ethyl Acetate, Isobutyl Alcohol, an unidentified isomer,

American Journal of Research Communication www.usa-journals.com
Jagessar, et al., 2020: Vol 8(3) 31
1-butanol Amyl Alcohol, and 2 Methyl-1-butanol, 1-pentanol and furfural and the retention times
were 2.876, 3.088, 7.194, 7.94, 9.110, 10.087, 11,859, 11.932, 12.753, 14.428 minutes
respectively. Methanol was 348.78311g/100L of absolute alcohol in this sample was more seen to
be the most abundant isomer other than ethanol, secondly iso amyl alcohol which was
99.86300g/100L of absolute ethanol. And the total volume of isomers quantified by the gas
chromatogram was 643.51377g/100L of absolute ethanol. For jamun distillate(7.53%v/v ethanol),
there was a large peak at retention time 4.414 which was concluded as the ethanol peak. Also there
were traces of acetaldehyde, 1-propanol, ethyl acetate, isobutyl alcohol, iso amyl alcohol and
methyl-1 butanol, the corresponding retention times were 2.873, 3.076, 7.151, 7.928, 9.085,
11.838, 11.913 minutes respectively. In this sample iso amy alcohol(175.24066g/100L of absolute
alcohol) was the second most abundant isomer present and the least abundant was that of
methanol(32.73031g/100L of absolute alcohol). The total volume isomers quantified by the gas
chromatogram was 575.00674g/100L of absolute alcohol.
For papaya distillate, the ethanol peak came off at 4.322(min) retention time, with a
strength of 5.360 %, v/v). Acetaldehyde, methanol, 1-propanol, ethyl acetate, isobutyl, and
unidentified isomer, iso amyl alcohol, and 2- methyl-1-butanol came off at the retention time at
2.871, 3.076, 7.152, 7.933, 9.092, 9.803, 11.838, 11.912 minutes respectively. The second largest
amount of alcohol in this sample was methanol and was quantified as 2129.36989 g/100L of
absolutes alcohol, secondly was iso amyl alcohol (130.00957g/100L of absolute alcohol) and the
least was ethyl acetate which was quantified as 15.19698g/100L of absolute alcohol that was
present in the sample. The total volume of isomers as quantified by the gas chromatogram was
2524.78922g/100L of absolute alcohol.

American Journal of Research Communication www.usa-journals.com
Jagessar, et al., 2020: Vol 8(3) 32
Gas chromatograph 6.0 shows the profile of the distillate from soursop, with potassium
phosphate additive. There was a large peak at retention time, 4.378, 8.494% ethanol, which was
concluded to be the ethanol peak. Also, there were traces of acetaldehyde, methanol, 1-propanol,
ethylacetate, 2-butanol, isobutyl alcohol, 1-butanol, iso-amyl alchol, 2-methyl-1-butanol, 1-
pentanol and 1-furfural. These came off at retention time of 2.870, 3.076, 7.154, 7.930, 8.222,
9.089, 10.067, 11.847, 11.919, 12.743 and 14.43 respectively. The total volume of isomers as
quantified by the gas chromatogram was 1213.56128.
When comparing the amount of isomers other than ethanol that were analyzed on the gas
chromatograph, it is seen that indeed the distillates were not only comprised of ethanol but other
quantified isomers and followed the sequence in terms of percentage abundance: papaya > jamun
>soursop > glucose and is due to the fact that the fruits fermented had other compounds present,
which facilitated other side reactions, whereas glucose was merely glucose, but was able to have
had other side reactions taking place also. Side products of fermentation such as glycerol,
methanol, higher alcohols (fusel oil), succinic acid, volatile acids, and lactic acid acetaldehyde and
hydrogen sulphides may be formed as a result of other side reactions. Methanol is a side product
of demethylation of pectins by enzymatic activities.
Based on this, the Anova single factor, using Microsoft excel 2010, Table 4.0., test were
done to compare % ethanol for all fruit substrates, without additive and it was seen that the p-value
was 0.026416 which is less than 0.05 and also the F value (7.073) was greater than the F-critical
value (5.143), and the conclusion was drawn that indeed there was significant differences with
the percentage per volume of ethanol produced by the different fruit substrates and this was so
because the initial Brix for each fruit varied, and this value is one of the main determinant of the
percentage ethanol production. Also when this analysis was done with Anova, two factors with

American Journal of Research Communication www.usa-journals.com
Jagessar, et al., 2020: Vol 8(3) 33
replication test on Microsoft excel 2010, to compare % ethanol for all fruit substrates with selected
additive, it was observed that p-values for the samples (4.88×10-47), the columns (2.265×10-47)
and, their interactions (9.97×10-47), were all less than 0.05, and also the F values were larger than
the F-critical values. Based on these, the conclusion was drawn that indeed there was significant
differences with the percentage per volume of ethanol produced by the different fruit substrates
with different additives.
7.0. Conclusion The fermentation of sugar rich fruits: jamun (syzigium cumini), soursop (Annona muricata), and
Carica papaya in the absence and presence of additives was achieved under anaerobic condition
at a pH of 4-5. In the absence of additives, ethanol production decrease in the order: Papaya >
Jamun > Soursop, with papaya producing an ethanolic content of (4.650 ± 0.255, v/v). The
additive did increased the ethanolic content to varying percentage and this is dependent on the fruit
type. The ethanolic content from the fruit type range from: 4.520 ± 0.08, v/v to 14.163 ± 0.017,
v/v). Gas chromatographic analyses were also done on the distillate, from the fermented matrix,
without and with additives. It was found that the distillate in most cases consists of ethanol,
acetaldehyde, methanol, methylacetate, 1-propanol, ethylacetate, 1-butanol, isobutylalcohol, iso-
amyl alcohol, 2-methyl-1-butanol, 1-pentanol and furfural in most cases. Our research shows that
all of the selected fruits can be used as attractive substrates for the production of ethanol and hence
its cultivation should be encouraged as a boost to the Agro Sector of the country and also, a source
for the blending with gasoline to produce gas alcohol. However, future work is necessary to
intensify the yield of ethanol beyond the 25% recorded in the literature34.

American Journal of Research Communication www.usa-journals.com
Jagessar, et al., 2020: Vol 8(3) 34
9.0 References
1. Demirbas AH, Demirbas I. “Importance of rural bioenergy for developing countries”. Energy
Conversion Management, (2007); 48, 2386-2398.
2. Demirbas A. “Biofuels sources, biofuel policy, biofuel economy and global biofuel projections.
Energy Conversion and Management”, 2008; 49, 2106-2116.
3. Yu Z, Zhang H. “Ethanol fermentation of acid-hydrolysed cellulosic pryolysate with
Saccharomyces cerevisiae”. Biores.Technol, 2004; 93, 199-204.
4. Reddy VL, Reddy OVS. Production of Ethanol from Mango (Mangifera indica I) fruit Juice
Fermentation, Research Journal of Microbiology, 2007; 2(10): 763-769.
5. Solomons GWT, Fryhle CB. Organic Chemistry, 9th Edition, John Wiley and Sons, Inc.2008.
6. Martin M, Galbe M, Wahlborn CF, Hahn-Hagerdal B, Jonsson, LJ. “Ethanol production from
enzymatic hydrolysates of sugarcane bagasse using recombinant xylose-utilising Saccharomyces
cerevisiae”. Enzyme Micro.Technol, 2002; 31: 274-282.
7. Graham RW, Reynolds TW, Hsu Y. Preliminary assessment of systems for deriving liquid and
gaseous fuels from waste or grown organics. US Department of Commerce, National Technical
Information Service, 1976; 1-40.
8. Dutta A, Mukherjee A. “Comparison of alcohol production in batch culture using different
substrates by Saccharomyces cerevisiae”. Biomedical and Pharmacology Journal, 2010; 3(1), 23-
26.
9. Reddy VL, Reddy OVS. “Production, optimization and characterization of wine from Mango
Mangifera indica Linn Natural Product Radiance, 2009; 8(4), 426-435.
10. Naik SN, Goud VV, Rout PK, Dalai AK “Production of first and second generation biofuels:
a comprehensive review, “Renewable and Sustainable Energy Reviews, 2010; 14 (2), 578-597.
11.Hossain ABMS, Ahmed SA, Ahmed MA, Adnan FMA, A, Annuar MSM, Mustafa H, Hammad
N, “Bioethanol fuel production from rotten banana as an environmental waste management and
sustainable energy”, African Journal of Microbiology Research, 2011; 5(6), 586-598.
12. Ingale S, Joshi S, Gupte A. “Production of bioethanol using agricultural waste: banana pseudo
stem”. Braz J. Microbiol, 2014; 45(3): 885–892.
13. Wairagu NW, Kiptoo J, Githiomi JK. Nutritional assessment of Sclerocarya birrea (amarula)
fruit from Kenya. International Journal of Current Research. 2013; 5(5):1074–1078.

American Journal of Research Communication www.usa-journals.com
Jagessar, et al., 2020: Vol 8(3) 35
14. Chanprasartsuk O, Pheanudomkitlert K, Toonwai D. Pineapple wine fermentation with yeasts
isolated from fruit as single and mixed starter cultures. As. J. Food Ag-Ind., 2012; 5(02), 104-111
15. Saifuddin M, Khandaker MM, Hossain ABMS, Jahan S Md, Mat NB, Boyce AN, “Bioethanol
production from mango waste (Mangifera indica L. cv chokanan): biomass as renewable energy”.
Australian Journal of Basic and Applied Sciences 2014. 8 (9), 229-237.
16. Chowdhury P, Ray RC. Fermentation of Jamun (Syzgium cumini L.) Fruits to Form Red Wine.
ASEAN Food Journal, 2007; 14 (1): 15-23 (2007.
17. Patil SS, Thorat RM, Rajasekaran P. Fermentation of Jamun (Syzgium cumini L.) Fruits to
Form Red Wine, Journal of Advanced Laboratory Research in Biology, 2012; 3(3): 234-238.
18. Tropea A, Wilson D, Giovanna Loredana La Torre, Lo CURTO Rosario, Saugman P, Davies,
PT Bioethanol Production From Pineapple Wastes. Journal of Food Research; Published by
Canadian Centre of Science and Education. 2014; 3 (4); 60-70.
19. Mishra J, Kumar D, Samanta S, Vishwakarma M, “A comparative study of ethanol production
from various agro residues by using Saccharomyces cerevisiae and Candida albicans. Journal of
Yeast and Fungal Research. 2012; 3(2), 12 – 17.
20. Fish WW, Bruton BD, Russo VM. “Watermelon juice: a promising feedstock supplement,
diluent, and nitrogen supplement for ethanol bioproduction”, Journal of Biotechnology for
Biofuels, 2009: 2: 18; 1-9.
21. Zhang HJ, Zhang H, Wang L, Guo XN. Preparation and functional properties of rice bran
proteins from heat-stabilized defatted rice bran, Food Research International, 2012; 47, 359-
363.
22. Gervásio P. da Silva1, Elza F. de Araújo, Daison O. Silva, Walter V. Guimarães (2005)
Ethanolic Fermentation of Sucrose, Sugarcane juice and molasses by Escherichia coli strain ko11
and Klebsiella Oxytoca strain p2, 36:395-404. Retrieved on 18th November, 2015 from
http://www.scielo.br/pdf/bjm/v36n4/v36n4a17.pdf.
23. Tiwari S, Jadhav SK, Sharma M, Tiwari KL. Fermentation of Waste Fruits for Bioethanol
Production, Asian Journal of Biological Sciences, 7 (1), 30-34.
24. Ramesh N, Naveen KS, Jaikrishna GE, Akash BK. The production of Biodiesel from
Manilkara zapota (chikoo or Sapodilla) seed oil and performance characteristics study on single

American Journal of Research Communication www.usa-journals.com
Jagessar, et al., 2020: Vol 8(3) 36
cylinder CI engine.
www.kscst.iisc.ernet.in/spp/40_series/SPP40S/03_Seminar_Biofuel_Projects/01_BE_Seminar/2
88_40S_B_BE_011
25. Akin-Osanaiye BC, Nzelibe HC, Agbaji AS. “Ethanol production from Carica papaya (paw-
paw) fruit waste, Asian Journal of Biochemistry. 2008; 3(3):188-193.
26. Alagesan CM, Panneerselvam A. “Production, Optimization and Characterization of wine from Papaya using Saccharomyces cerevisiae”, Int.J.Curr.Microbiol.App.Sci. 2016; 3, 1-7. 27. Maragatham CM, Panneerselvam A. Isolation, identification and characterization of wine yeast from rotten papaya fruits for wine production , Advances in Applied Sciences Research, 2011; 2 (2): 93-98. 28. Massengo V, Loumouamou BW, Diakabana P, Silou T. Ethanol production by fermentation of the pulp of the “BOKO” mango”. International Journal of Chemical Science and Technology, 2014; 4(4), 71-77. 29. Patil SS, Thorat RM, Rajasekaran P. Utilization of Jamun Fruit (Syzygium cumini) for Production of Red Wine, Journal of Advanced Laboratory Research in Biology). 2012; 3(3), 200-203. 30. Chowdhury P, Ray RC, Fermentation of Jamun (Syzgium cumini L.) Fruits to Form Red Wine, ASEAN Food Journal. 2007; 14 (1): 15-23. 31. Ogbebor C, Akpoveta VO, Osakwe SA. Medjor WO. Fermentation of Soursop Using
Saccharomyces cerevisiae: A Kinetic Evaluation, Chemistry and Materials Research , 2014; 6 (9),
60-64.
32. Akin-Osanaiye BC, Nzelibe HC, Agbaji AS. Ethanol Production from Carica papaya
(Pawpaw) Fruit Waste, Asian Journal of Biochemistry. 2008; 3(3): 188-193.
33. Jagessar RC, Collins M. American Journal of Research Communication, 2018; 6(9): 17-30.
34. Jagessar RC, Meusa T. The fermentation capacity of the pulp of Magnifera indica, Carica
papaya and the peel of Magnifera indica in the absence and presence of additives. The highest %
yield of ethanol, furnished by a fruit, Carica papaya. American Journal of Research
Communication, 2018, 6(10): 68-8

American Journal of Research Communication www.usa-journals.com
Jagessar, et al., 2020: Vol 8(3) 37
35. Margalit Y. Winery Technology & Operations: A Handbook for small Wineries, San
Francisco, United States of America, 2005; 71- 78, 158-168.
36. https://www.kaieteurnewsonline.com/2014/05/03/albion-sugar-estate-produces-ethanol-in-
100m-project/ May 03, 2014. Retrieved 2018-03-15.
37. Okigbo RN, Obire O. “Mycoflora and production of wine from fruits of soursop (Annona Muricata L”. International Journal of Wine Research. 2009; 1, 1-9.
36. Skoog AD, Holler JF, Nieman AT. “ Principles of Instrumental Analysis”, 5th ed, Thomson
Learning, Inc.USA, 1998; 329-353.
37. Daniel HC “Quantitative Chemical Analysis”, 6th ed. W.H. Freeman and Company, New
York, 2003; 61-79.
38. Lane DM, Analysis of Variance, USA, 2015.
onlinestatbook.com/2/analysis_of_variance/intro.html
39. Skoog DA, West DM, Holler FJ, Crouch SR. “Fundamental of Analytical Chemistry, 8th ed.
Thomson Books/Cole, USA, 2014.
Recommended