THE EMERGING INVESTMENT OPPORTUNITY IN FUNDAMENTAL
RESOURCE SECTORSCA P I TA L I Z I N G O N T H E S H I F T TO D I ST R I B U T E D I N F R AST RU CT U R E
FA L L 20 16
PAG E 2
TABLE OF CONTENTS
E X ECU T I V E SU M M A RY . . . . . . . . . . . . . . . . . . . . . . . . . . . . . . . . . . . . . . . . . . . . . . . . . . . . . . . . . . . . . . . . . . . . . . . . . . . 3
The convergence of physical, economic, and technological trends is driving a major paradigm shift in how resources are used and managed—creating unprecedented opportunities for investors.
CO N V E RG I N G T R E N DS D R I V I N G M A J O R PA RA D I G M S H I F T . . . . . . . . . . . . . . . . . . . . . . . . . . . . 4
Converging Trends . . . . . . . . . . . . . . . . . . . . . . . . . . . . . . . . . . . . . . . . . . . . . . . . . . . . . . . . . . . . . . . . . . . . . . . . . . . . . . . . . . . . . . 4
Long-Term Resource Needs
Resource Resilience Needs
Technological Capabilities
Distributed Models for Resource Utilization . . . . . . . . . . . . . . . . . . . . . . . . . . . . . . . . . . . . . . . . . . . . . . . . . . . . . . . . . . . . 6
Efficiency: Doing More with Less
Reuse: Converting Waste Streams to Value
Reaching Price Parity Across Sectors . . . . . . . . . . . . . . . . . . . . . . . . . . . . . . . . . . . . . . . . . . . . . . . . . . . . . . . . . . . . . . . . . . . 7
Agriculture
Energy
Water
Waste
CREATING UNPRECEDENTED OPPORTUNITIES FOR INVESTORS . . . . . . . . . . . . . . . . . . . . . . 15
High Impacts = High Returns . . . . . . . . . . . . . . . . . . . . . . . . . . . . . . . . . . . . . . . . . . . . . . . . . . . . . . . . . . . . . . . . . . . . . . . . . . . 15
Long-Term Stewardship of Increasingly High-Value Resources
Capital-Ready Projects . . . . . . . . . . . . . . . . . . . . . . . . . . . . . . . . . . . . . . . . . . . . . . . . . . . . . . . . . . . . . . . . . . . . . . . . . . . . . . . . . . 16
Project Models
Experienced Developers
Emerging Investor Access . . . . . . . . . . . . . . . . . . . . . . . . . . . . . . . . . . . . . . . . . . . . . . . . . . . . . . . . . . . . . . . . . . . . . . . . . . . . . . . 17
Real Assets
Project Finance
CONCLUSIONS . . . . . . . . . . . . . . . . . . . . . . . . . . . . . . . . . . . . . . . . . . . . . . . . . . . . . . . . . . . . . . . . . . . . . . . . . . . . . . . . . . . 20

PAG E 3
EXECUTIVE SUMMARY
The convergence of physical resource limitations, economic value, and technological innovation is driving a paradigm shift toward the more
efficient and localized use of natural resources—providing an unprecedented opportunity for investors. Within the critical resource sectors of food, water, energy, and waste, firms are innovating new, distributed models for resource management . These innovations have reached (or will soon reach) price parity with the incumbent, centralized resource delivery systems across these sectors . This shift presents an unprecedented opportunity for investors, who can finance and accelerate the transition to localized resources while realizing exceptional risk-
adjusted returns on such investments . Financial innovation is opening investor access to these opportunities through new real asset project finance products .
The objective of this paper is to identify this emerging opportunity for investors. It demonstrates why distributed resource management models make economic sense and outlines the subsequent investment opportunity . It further details how a new class of innovative investment products is emerging to link institutional capital to sustainable real asset projects .
Source: U.S. Census Bureau, International Database, July
2015 Update
Fig. 1. Global population is projected to grow by over 40% in
the next quarter-century.
Source: US Census Bureau
WORLD POPULATION:
1950 - 2050
3 BILLION4 BILLION
196
0
1970
198
0
199
0
20
00
20
10
20
20
20
30
20
40
20
50
10
9
8
7
6
5
4
3
2
1
0
5 BILLION6 BILLION
7 BILLION
8 BILLION
9 BILLION
UNITED KINGDOM
COUNTRYPOPULATION AT THE START OF THE GROWTH PERIOD (Million)YEARS TO DOUBLE PER CAPITA GDP1
YEAR
1700 1800 1900 2000
53
65
33
16
12
16 822
1,023
22
48
28
10
9154
UNITED STATES
GERMANY
JAPAN
SOUTH KOREA
INDIA
CHINA
CO
ST
TIME
PRICE PARITY
CENTRALIZED/EXTRACTIVE
MODEL
DISTRIBUTED/SUSTAINABLE
MODEL
fresh water used for soil-based farming 50-80% of which is lost to evaporation
70% GLOBAL
1500 MILES
70-95% LESS
LOCALon average, food travels 1500 to 2500 miles on its way to our plate
fresh water used for vertical farming utilizing the aquaponics or aeroponics method of farming
vertical farming reduces the need for long-distance transport diminishing the use of fossil fuel and ensuring quality
TRADITIONAL FARMING VERTICAL FARMING
$14,250
250 KG
120 KG
20 kWh
160 KM
275 KM
+72%
30 kWh
$5,250
-63%
-52%
+50%
5
2015
BATTERY COST (1000$) BATTERY WEIGHT (10s of KG) BATTERY RANGE (10s of KM)
BATTERY CAPACITY (kWh)
2015 2015 20152020E 2020E 2020E 2020E
10
15
20
25
30
35
40
• EFFICIENCY
• REUSE
• SOURCE OF DIVERSIFICATIONAA
SOURCE SOURCE SOURCE SOURCE
WASTE
TREATMENT USE
THE FUTURE: WATER CULTIVATION
USE
LOSSLOSS
LOSS
• INEFFICIENCY
• DISPOSABILITY
• HOMOGENOUS SUPPLYLL
SOURCE
WASTE
TREATMENT
LOSS
TODAY: WATER HUNTING
TIN
(cans, solder)
GOLD
( jewelry, dental)
PHOSPHORUS
(fertil izer, animal blades)
ALUMINUM
(transport, electric, consumer durables)
Today’s global consumption rate
Half the U.S. consumption rate
Reverse base
Annual global consumption
reverse base
(assuming global
consumption =
global production)
World population1/2 U.S. per capita
consumption in
2006
X
If the demand grows, some key resources will be exhausted more quicky if predicted technologies appear and the population grows
HOW MANY YEARS LEFT IF THE WORLD CONSUMES ATZINC
(galvanizing)
LEAD
(lead pipes, batteries)
SILVER
( jewelry, catalytic converters)
CHROMIUM
(chrome plating, paint)
INDIUM
(LCDs)
PLATINUM
( jewelry, catalysts, fuel cells)
ANTIMONY
(drugs)
URANIUM
(weapons, power stations)
NICKEL
(batteries, turbine blades)
TITANIUM
(cellphones, camera lenses)
COPPER
(wire, coins, plumbing)
48
9
13
42
29
1317
19
30
59
(t(t(t(tttttt(t(t((( rrrrrr
4
20
34
36
38
40
42
57
142
510
116
46
45
61
143
360
90
345
1027
40
6.58 BILLIONWORLD POPULATION IN APRIL 2007
301 MILLIONU.S. POPULATION IN APRIL 2007
POPULATION COMPARISON
PLATINUM
0%
PHOSPHORUS
0%
GALLIUM
0%
URANIUM
0%
INDIUM
0%
COPPER
31%
NICKEL
35%
SILVER
16%
TITANIUM
20%
LEAD
72%
GOLD
43%
ALUMINUM
49%
ZINC
26%
TIN
26%
GERMANIUM
35%
CHROMIUM
25%
HOW LONG WILL IT LAST
PROPORTION OF CONSUMPTION MET BY RECYCLED MATERIALS
RE
TU
RN
15%
14%
13%
12%
11%
10%
9%
8%
7%
6%
5%
BONDS
1% 2% 3% 4% 5% 6% 7% 8% 9% 10% 11% 12% 13% 14% 15% 16% 17% 18%
REAL ESTATE
AGRICULTURE
TIMBER
EQUITIES
PRIVATE EQUITY
CHART 2: INCREASES IN REAL ASSET ALLOCATIONS% OF RESPONDENTS INCREASING IN THE PAST THREE YEARS/NEXT 18 MONTHS
REAL ESTATE
(n=192)
INFRASTRUCTURE
(n=132)
COMMODITIES
(n=59)
% 0 10 20 30 40 50
Will increase over the next 18 months
Increased over the past three years
Source: Blackrock and The Economist Intelligence Unit, 31 October 2014.
7
6
5
4
3
2
1
0
40
30
20
10
0
600
500
400
300
200
100
0
0-50
0-25
0
0-25
0-50
400
350
300
250
18001800 18501850 19001900 19501950 20002000
4
3
2
1
0
POPULATION
TROPICAL FOREST LOSS
ENERGY USE WATER USE
TEMPERATURE CHANGECARBON DIOXIDE EMISSIONS
Wo
rld
po
pu
lati
on
(b
illio
ns)
Glo
bal tr
op
ical fo
rest
lo
ss
co
mp
are
d w
ith
170
0 b
ase
lin
e (
%)
Wo
rld
pri
mary
en
erg
y u
se(E
J)
Glo
bal w
ate
r u
se (
tho
usa
nd
km
2)
Me
an
glo
bal te
mp
era
ture
ch
an
ge
(oC
)
Atm
osp
he
ric c
on
ce
ntr
ati
on
of
CO
2 (
pp
m)
7
6
5
4
3
2
1
0
40
30
20
10
0
600
500
400
300
200
100
0
0-50
0-25
0
0-25
0-50
400
350
300
250
18001800 18501850 19001900 19501950 20002000
4
3
2
1
0
A. POPULATION
I. TROPICAL FOREST LOSS
D. ENERGY USE D. WATER USE
M. TEMPERATURE CHANGEL. CARBON DIOXIDE EMISSIONS
Wo
rld
pu
pilati
on
(b
illio
ns)
Glo
bal tr
op
ical fo
rest
lo
ss
co
mp
are
d w
ith
170
0 b
ase
lin
e (
%)
Wo
rld
pri
mary
en
erg
y u
se(E
J)
Glo
bal w
ate
r u
se (
tho
usa
nd
km
2)
Me
an
glo
bal te
mp
era
ture
ch
an
ge
(oC
)
Atm
osp
he
ric c
on
ce
ntr
ati
on
of
CO
2 (
pp
m)
Source: U.S. Census Bureau, International Database, July
2015 Update
Fig. 1. Global population is projected to grow by over 40% in
the next quarter-century.
Source: US Census Bureau
WORLD POPULATION:
1950 - 2050
3 BILLION
196
0
1970
198
0
199
0
20
00
20
10
20
20
20
30
2040
2050
10
9
8
7
6
5
4
3
2
1
0
5 BILLION6 BILLION
7 BILLION
8 BILLION
9 BILLION
UNITED KINGDOM
COUNTRYPOPULATION AT THE START OF THE GROWTH PERIOD (Million)YEARS TO DOUBLE PER CAPITA GDP1
YEAR
1700 1800 1900 2000
53
65
33
16
12
16 822
1,023
22
48
28
10
9154
UNITED STATES
GERMANY
JAPAN
SOUTH KOREA
INDIA
CHINA
CO
ST
TIME
PRICE PARITY
CENTRALIZED/EXTRACTIVE MODEL
DISTRIBUTED/REGENERATIVEMODELDISTRIBUTETR D//D REGENERATIVEG TE E
fresh water used for soil-based farming, 50–80% of which is lost to evaporation
70% GLOBAL
1500 MILES
70-95% LESS
LOCALon average, food travels 1500 to 2500 miles on its way to our plate
fresh water used for vertical farming utilizing the aquaponics or aeroponics method
vertical farming reduces the need for long-distance transport diminishing the use of fossil fuel and ensuring quality
TRADITIONAL FARMING VERTICAL FARMING
$14,250
250 KG
120 KG
20 kWh
160 KM
275 KM
+72%
30 kWh
$5,250
-63%
-52%
+50%
5
2015
BATTERY COST (1000$) BATTERY WEIGHT (10s of KG) BATTERY RANGE (10s of KM)
BATTERY CAPACITY (kWh)
2015 2015 20152020E 2020E 2020E 2020E
10
15
20
25
30
35
40
• EFFICIENCY
• REUSE• SOURCE OF DIVERSIFICATIONAA
SOURCE SOURCE SOURCE SOURCE
WASTE
TREATMENT USE
THE FUTURE: WATER CULTIVATION
USE
LOSS
LOSS
LOSS
LOSS
• INEFFICIENCY
• DISPOSABILITY
• HOMOGENOUS SUPPLYLL
SOURCE
WASTE
TREATMENT
TODAY: WATER HUNTING
TIN
(cans, solder)
GOLD
( jewellery, dental)
PHOSPHORUS
(fertil izer, animal blades)
ALUMINUM
(transport, electric, comsumer durables)
Today’s global consumption rate
Half the U.S. consumption rate
Reverse base
Annual global consumption
reverse base
(assuming global
consumption =
global production)
World population1/
2 U.S. per capita
consumption in
2006
X
If the demand grows, some key resources will be exhausted more quicky if predicted technologies appear and the population grows
HOW MANY YEARS LEFT IF THE WORLD CONSUMES AT..ZINC
(galvanising)
LEAD
(lead pipes, batteries)
SILVER
( jewellery, catalytic converters)
CHROMIUM
(chrome plating, paint)
INDIUM
(LCDs)
PLATINUM
( jewellery, catalysts, fuel cells)
ANTIMONY
(drugs)
URANIUM
(weapons, power stations)
NICKEL
(batteries, turbine blades)
TITANIUM
(cellphones, camera lenses)
COPPER
(wire, coins, plumbing)
48
9
13
42
29
1317
19
30
59
(t(t(tttt(t(( rrrr
4
20
34
36
38
40
42
57
142
510
116
46
45
61
143
360
90
345
1027
40
6.58 BILLIONWORLD POPULATION IN
APRIL 2007
301 MILLIONU.S. POPULATION IN
APRIL 2007
POPULATION COMPARISON
PLATINUM
0%
PHOSPHORUS
0%
GALLIUM
0%
URANIUM
0%
INDIUM
0%
COPPER
31%
NICKEL
35%
SILVER
16%
TITANIUM
20%
LEAD
72%
GOLD
43%
ALUMINUM
49%
ZINC
26%
TIN
26%
GERMANIUM
35%
CHROMIUM
25%
HOW LONG WILL IT LAST
PROPORTION OF CONSUMPTION MET BY RECYCLED MATERIALS
RE
TU
RN
15%
14%
13%
12%
11%
10%
9%
8%
7%
6%
5%
BONDS
1% 2% 3% 4% 5% 6% 7% 8% 9% 10% 11% 12% 13% 14% 15% 16% 17% 18%
REAL ESTATE
AGRICULTURE
TIMBER
EQUITIES
PRIVATE EQUITY
CHART 2: INCREASES IN REAL ASSET ALLOCATIONS% OF RESPONDENTS INCREASING IN THE PAST THREE YEARS/NEXT 18 MONTHS
REAL ESTATE
(n=192)
INFRASTRUCTURE
(n=132)
COMMODITIES
(n=59)
% 0 10 20 30 40 50
Will increase over the next 18 months
Increased over the past three years
Source: Blackrock and The Economist Intelligence Unit, 31 October 2014.
Incomes are rising in developing economies faster—and on a greater scale—than at any previous point in history
World Population: 1950–2050
Fig. 1. Global population is projected to grow by over 30% in
the next quarter-century.
Source: US Census Bureau.
Fig. 2. Three billion more consumers will enter the global middle class by 2030. This shift represents an unprecedented rate and scale of wealth creation and resource consumption.
Source: McKinsey & Company.

PAG E 4
CONVERGING TRENDS DRIVING MAJOR PARADIGM SHIFTTHE CONVERGING TRENDS
Critical resources are facing increasing demand, accelerating scarcity, and rapid environmental change—creating crucial sustainability and
resilience challenges . Technological innovation is simultaneously enabling new, more efficient decentralized infrastructure to help alleviate resource constraints in a more affordable, reliable and sustainable way .
Long-Term Resource NeedsThe global population is projected to grow by over thirty percent before the middle of this century1, with three billion more consumers expected to enter the global middle class by 20302 (Fig . 1, Fig . 2) . These trends are driving unprecedented rates of consumption, dramatically increasing demand for natural resources and exacerbating the need to deliver sustainability
Resource Resilience NeedsHuman activities are also dramatically altering the Earth’s natural systems that support and sustain life at unprecedented rates and scales (Fig . 3) . 3 4 These trends are driving rapid global environmental change, underpinning the need to deliver resilience solutions at scale .
Fig. 3. Human activities have drastically and rapidly altered the Earth’s natural systems in recent decades.
Source: Rockefeller Foundation and Lancet Commission.
1 World Population Projected to Reach 9.7 Billion by 2050. 2015. United Nations Department of Economic and Social Affairs.2 Dobbs, Richard, Jeremy Oppenheim, Fraser Thompson, Marcel Brinkman, and Marc Zornes. Resource Revolution: Meeting the World’s Energy, Materials, Food, and Water Needs.
November 2011. McKinsey & Company.3 Ecosystems and Human Well-Being: Synthesis Report. 2005. Millennium Ecosystem Assessment. Washington, DC: Island Press.4 Whitmee, Sarah et al. 2015. Safeguarding Human Health in the Anthropocene Epoch: Report of the Rockefeller Foundation-Lancet Commission on Planetary Health.
The Lancet Commissions.
Source: U.S. Census Bureau, International Database, July
2015 Update
Fig. 1. Global population is projected to grow by over 40% in
the next quarter-century.
Source: US Census Bureau
WORLD POPULATION:
1950 - 2050
3 BILLION4 BILLION
196
0
1970
198
0
199
0
20
00
20
10
20
20
20
30
20
40
20
50
10
9
8
7
6
5
4
3
2
1
0
5 BILLION6 BILLION
7 BILLION
8 BILLION
9 BILLION
UNITED KINGDOM
COUNTRYPOPULATION AT THE START OF THE GROWTH PERIOD (Million)YEARS TO DOUBLE PER CAPITA GDP1
YEAR
1700 1800 1900 2000
53
65
33
16
12
16 822
1,023
22
48
28
10
9154
UNITED STATES
GERMANY
JAPAN
SOUTH KOREA
INDIA
CHINA
CO
ST
TIME
PRICE PARITY
CENTRALIZED/EXTRACTIVE
MODEL
DISTRIBUTED/SUSTAINABLE
MODEL
fresh water used for soil-based farming 50-80% of which is lost to evaporation
70% GLOBAL
1500 MILES
70-95% LESS
LOCALon average, food travels 1500 to 2500 miles on its way to our plate
fresh water used for vertical farming utilizing the aquaponics or aeroponics method of farming
vertical farming reduces the need for long-distance transport diminishing the use of fossil fuel and ensuring quality
TRADITIONAL FARMING VERTICAL FARMING
$14,250
250 KG
120 KG
20 kWh
160 KM
275 KM
+72%
30 kWh
$5,250
-63%
-52%
+50%
5
2015
BATTERY COST (1000$) BATTERY WEIGHT (10s of KG) BATTERY RANGE (10s of KM)
BATTERY CAPACITY (kWh)
2015 2015 20152020E 2020E 2020E 2020E
10
15
20
25
30
35
40
• EFFICIENCY
• REUSE
• SOURCE OF DIVERSIFICATIONAA
SOURCE SOURCE SOURCE SOURCE
WASTE
TREATMENT USE
THE FUTURE: WATER CULTIVATION
USE
LOSSLOSS
LOSS
• INEFFICIENCY
• DISPOSABILITY
• HOMOGENOUS SUPPLYLL
SOURCE
WASTE
TREATMENT
LOSS
TODAY: WATER HUNTING
TIN
(cans, solder)
GOLD
( jewelry, dental)
PHOSPHORUS
(fertil izer, animal blades)
ALUMINUM
(transport, electric, consumer durables)
Today’s global consumption rate
Half the U.S. consumption rate
Reverse base
Annual global consumption
reverse base
(assuming global
consumption =
global production)
World population1/2 U.S. per capita
consumption in
2006
X
If the demand grows, some key resources will be exhausted more quicky if predicted technologies appear and the population grows
HOW MANY YEARS LEFT IF THE WORLD CONSUMES ATZINC
(galvanizing)
LEAD
(lead pipes, batteries)
SILVER
( jewelry, catalytic converters)
CHROMIUM
(chrome plating, paint)
INDIUM
(LCDs)
PLATINUM
( jewelry, catalysts, fuel cells)
ANTIMONY
(drugs)
URANIUM
(weapons, power stations)
NICKEL
(batteries, turbine blades)
TITANIUM
(cellphones, camera lenses)
COPPER
(wire, coins, plumbing)
48
9
13
42
29
1317
19
30
59
(t(t(t(tttttt(t(t((( rrrrrr
4
20
34
36
38
40
42
57
142
510
116
46
45
61
143
360
90
345
1027
40
6.58 BILLIONWORLD POPULATION IN APRIL 2007
301 MILLIONU.S. POPULATION IN APRIL 2007
POPULATION COMPARISON
PLATINUM
0%
PHOSPHORUS
0%
GALLIUM
0%
URANIUM
0%
INDIUM
0%
COPPER
31%
NICKEL
35%
SILVER
16%
TITANIUM
20%
LEAD
72%
GOLD
43%
ALUMINUM
49%
ZINC
26%
TIN
26%
GERMANIUM
35%
CHROMIUM
25%
HOW LONG WILL IT LAST
PROPORTION OF CONSUMPTION MET BY RECYCLED MATERIALS
RE
TU
RN
15%
14%
13%
12%
11%
10%
9%
8%
7%
6%
5%
BONDS
1% 2% 3% 4% 5% 6% 7% 8% 9% 10% 11% 12% 13% 14% 15% 16% 17% 18%
REAL ESTATE
AGRICULTURE
TIMBER
EQUITIES
PRIVATE EQUITY
CHART 2: INCREASES IN REAL ASSET ALLOCATIONS% OF RESPONDENTS INCREASING IN THE PAST THREE YEARS/NEXT 18 MONTHS
REAL ESTATE
(n=192)
INFRASTRUCTURE
(n=132)
COMMODITIES
(n=59)
% 0 10 20 30 40 50
Will increase over the next 18 months
Increased over the past three years
Source: Blackrock and The Economist Intelligence Unit, 31 October 2014.
7
6
5
4
3
2
1
0
40
30
20
10
0
600
500
400
300
200
100
0
0-50
0-25
0
0-25
0-50
400
350
300
250
18001800 18501850 19001900 19501950 20002000
4
3
2
1
0
POPULATION
TROPICAL FOREST LOSS
ENERGY USE WATER USE
TEMPERATURE CHANGECARBON DIOXIDE EMISSIONS
Wo
rld
po
pu
lati
on
(b
illio
ns)
Glo
bal tr
op
ical fo
rest
lo
ss
co
mp
are
d w
ith
170
0 b
ase
lin
e (
%)
Wo
rld
pri
mary
en
erg
y u
se(E
J)
Glo
bal w
ate
r u
se (
tho
usa
nd
km
2)
Me
an
glo
bal te
mp
era
ture
ch
an
ge
(oC
)
Atm
osp
he
ric c
on
ce
ntr
ati
on
of
CO
2 (
pp
m)

PAG E 5
Technological CapabilitiesInnovation is driving new resource capabilities through a new generation of decentralized infrastructure that is cost-effective at scales substantially smaller than those of conventional infrastructure . These technological advancements—and the consequent feasibility of decentralized infrastructure—result in increased resource efficiency and opportunities for lowering the cost and price volatility of natural resources.5 6 7
Take the energy sector, for example . Most electricity is generated at large, centralized power plants, inefficiently distributing to customers hundreds of miles away . Today, however, technological advances in renewable energy generation and storage are driving a shift toward more decentralized energy production . We now see greater diversity in energy generation sources (including solar, natural gas, and wind), greater efficiency across a distributed infrastructure system (less lengthy transmission and transit costs as generation is closer to both fuel supply and load), and greater resilience
(as the distributed infrastructure is not as vulnerable to outside shocks, such as natural disasters, as incumbent centralized systems) .
This trend can be seen at an economy-wide level, where the shift to more efficient and sustainable production is already underway . This is illustrated by the decoupling of GDP and CO2 emissions: the economy is growing while we are using natural resources more efficiently . 2014 was the first year that global GDP decoupled from carbon emissions8; in 2015, this was the reality for twenty-one national economies .9 The United States is the largest country to experience multiple consecutive years of economic growth decoupled from CO2 emissions, and projections indicate that the nation’s shift to a cleaner electricity system after 2020 will sustain this trend (Fig . 4)10 .
Fig. 4. Shifts to cleaner technologies are driving more efficient economic output in the US.
Source: World Resources Institute.
7
6
5
4
3
2
1
0
40
30
20
10
0
600
500
400
300
200
100
0
0-50
0-25
0
0-25
0-50
400
350
300
250
18001800 18501850 19001900 19501950 20002000
4
3
2
1
0
A. POPULATION
I. TROPICAL FOREST LOSS
D. ENERGY USE D. WATER USE
M. TEMPERATURE CHANGEL. CARBON DIOXIDE EMISSIONS
Wo
rld
pu
pilati
on
(b
illio
ns)
Glo
bal tr
op
ical fo
rest
lo
ss
co
mp
are
d w
ith
170
0 b
ase
lin
e (
%)
Wo
rld
pri
mary
en
erg
y u
se(E
J)
Glo
bal w
ate
r u
se (
tho
usa
nd
km
2)
Me
an
glo
bal te
mp
era
ture
ch
an
ge
(oC
)
Atm
osp
he
ric c
on
ce
ntr
ati
on
of
CO
2 (
pp
m)
Source: U.S. Census Bureau, International Database, July
2015 Update
Fig. 1. Global population is projected to grow by over 40% in
the next quarter-century.
Source: US Census Bureau
WORLD POPULATION:
1950 - 2050
3 BILLION
196
0
1970
198
0
199
0
20
00
20
10
20
20
20
30
2040
2050
10
9
8
7
6
5
4
3
2
1
0
5 BILLION6 BILLION
7 BILLION
8 BILLION
9 BILLION
UNITED KINGDOM
COUNTRYPOPULATION AT THE START OF THE GROWTH PERIOD (millions)YEARS TO DOUBLE PER CAPITA GDP1
YEAR
1700 1800 1900 2000
53
65
33
16
12
16 822
1,023
22
48
28
10
9154
UNITED STATES
GERMANY
JAPAN
SOUTH KOREA
INDIA
CHINA
CO
ST
TIME
PRICE PARITY
CENTRALIZED/EXTRACTIVE
MODEL
DISTRIBUTED/SUSTAINABLE
MODEL
fresh water used for soil-based farming 50-80% of which is lost to evaporation
70% GLOBAL
1500 MILES
70-95% LESS
LOCALon average, food travels 1500 to 2500 miles on its way to our plate
fresh water used for vertical farming utilizing the aquaponics or aeroponics method of farming
vertical farming reduces the need for long-distance transport diminishing the use of fossil fuel and ensuring quality
TRADITIONAL FARMING VERTICAL FARMING
$14,250
250 KG
120 KG
20 kWh
160 KM
275 KM
+72%
30 kWh
$5,250
-63%
-52%
+50%
5
2015
BATTERY COST (1000$) BATTERY WEIGHT (10s of KG) BATTERY RANGE (10s of KM)
BATTERY CAPACITY (kWh)
2015 2015 20152020E 2020E 2020E 2020E
10
15
20
25
30
35
40
• EFFICIENCY
• REUSE
• SOURCE OF DIVERSIFICATIONAA
SOURCE SOURCE SOURCE SOURCE
WASTE
TREATMENT USE
THE FUTURE: WATER CULTIVATION
USE
LOSSLOSS
LOSS
• INEFFICIENCY
• DISPOSABILITY
• HOMOGENOUS SUPPLYLL
SOURCE
WASTE
TREATMENT
LOSS
TODAY: WATER HUNTING
TIN
(cans, solder)
GOLD
( jewellery, dental)
PHOSPHORUS
(fertil izer, animal blades)
ALUMINUM
(transport, electric, comsumer durables)
Today’s global consumption rate
Half the U.S. consumption rate
Reverse base
Annual global consumption
reverse base
(assuming global
consumption =
global production)
World population1/
2 U.S. per capita
consumption in
2006
X
If the demand grows, some key resources will be exhausted more quicky if predicted technologies appear and the population grows
HOW MANY YEARS LEFT IF THE WORLD CONSUMES AT..ZINC
(galvanising)
LEAD
(lead pipes, batteries)
SILVER
( jewellery, catalytic converters)
CHROMIUM
(chrome plating, paint)
INDIUM
(LCDs)
PLATINUM
( jewellery, catalysts, fuel cells)
ANTIMONY
(drugs)
URANIUM
(weapons, power stations)
NICKEL
(batteries, turbine blades)
TITANIUM
(cellphones, camera lenses)
COPPER
(wire, coins, plumbing)
48
9
13
42
29
1317
19
30
59
(t(t(tttt(t(( rrrr
4
20
34
36
38
40
42
57
142
510
116
46
45
61
143
360
90
345
1027
40
6.58 BILLIONWORLD POPULATION IN
APRIL 2007
301 MILLIONU.S. POPULATION IN
APRIL 2007
POPULATION COMPARISON
PLATINUM
0%
PHOSPHORUS
0%
GALLIUM
0%
URANIUM
0%
INDIUM
0%
COPPER
31%
NICKEL
35%
SILVER
16%
TITANIUM
20%
LEAD
72%
GOLD
43%
ALUMINUM
49%
ZINC
26%
TIN
26%
GERMANIUM
35%
CHROMIUM
25%
HOW LONG WILL IT LAST
PROPORTION OF CONSUMPTION MET BY RECYCLED MATERIALS
RE
TU
RN
15%
14%
13%
12%
11%
10%
9%
8%
7%
6%
5%
BONDS
1% 2% 3% 4% 5% 6% 7% 8% 9% 10% 11% 12% 13% 14% 15% 16% 17% 18%
REAL ESTATE
AGRICULTURE
TIMBER
EQUITIES
PRIVATE EQUITY
CHART 2: INCREASES IN REAL ASSET ALLOCATIONS% OF RESPONDENTS INCREASING IN THE PAST THREE YEARS/NEXT 18 MONTHS
REAL ESTATE
(n=192)
INFRASTRUCTURE
(n=132)
COMMODOTIES
(n=59)
% 0 10 20 30 40 50
Will increase over the next 18 months
Increased over the past three years
Source: Blackrock and The Economist Intelligence Unit, 31 October 2014.
$1.40
$1.20
$1.00
$0.80
$0.60
$0.40
$0.20
$0
2014 2016 2018 2020 2022 2024 2026 2028 2030 2032 2034 2036 2038 2040 2042 2044 2046 2048 2050
NY
2026CA
2031
KY
2047
TX
2047
HI
PRE-2014
SOLAR-PLUS BATTERY LEVELIZED COST OF ELECTRICITY (LCOE) VS. UTILITY RETAIL PRICE PROJECTIONSCOMERCIAL - BASE CASE {Y-AXIS $/kWh}
Louisville, KY
Westchester, NY
San Antonio, TX
Los Angeles, CA
Honolulu, HI
LCOE Retail Price
100
80
60
40
20
0
Mainstream
Direct
Intermediated
Portland, OR
Blueberries
Sacramento, CA
Spring mix
Twin Cities, MN
Beef
DC area
Milk
ea
d te
Pe
rce
nt
of
reta
il p
rice
Syracuse, NY
Apples
$ T
rillio
ns
(US
D)
1995
Total volume of sustainable investments nearly doubled from 2012 to 2014
20031999 20071997 20052001 2010 2012 2014
$3.47 Trillion
$6.57 Trillion7
6
5
4
3
2
1
0
2
1950 1970 19951955 1975 2000 20151960 1980 2005 20201965 19901985 2010 2025
HISTORICAL FORECAST
CO2
GDP
$24,000
$20,000
$16,000
$12,000
$8,000
$4,000
$0
6,000
5,000
4,000
3,000
2,000
1,000
0
U.S. CO2 Emissions and GDP, 1950–2025
5 Heck, Dr. Stefan. 2015. Resource Revolution: Investor Opportunities in the New Climate. Stanford University.6 Heck, Stefan and Matt Rogers. 2014. Resource Revolution: How to Capture the Biggest Business Opportunity in a Century. New York: Melcher Media.7 Distributed Systems: A Design Model for Sustainable and Resilient Infrastructure. 2010. Victorian Eco Innovation Lab at the University of Melbourne.8 Global Energy-Related Emissions of CO2 Stalled in 2014: IEA Data Point to Emissions Decoupling from Economic Growth for First Time in 40 Years. 2015. International Energy Agency.9 Aden, Nate. 2016. The Roads to Decoupling: 21 Countries are Reducing Carbon Emissions While Growing GDP. World Resources Institute.10 Aden, Nate. 2016. The Roads to Decoupling: 21 Countries are Reducing Carbon Emissions While Growing GDP. World Resources Institute.
Tota
l Ene
rgy-
Rel
ated
Car
bon
Dio
xide
Em
issi
ons
(Mt
CO
2)
GD
P (B
illions of Chained 20
09
Dollars)

PAG E 6
RESOURCE MANAGEMENT AND PLANNING NEED TO TRANSITION FROM
THE PAST MODEL THAT PLACED VALUE PRIMARILY ON EXTRACTING
NATURAL RESOURCES, TO A NEW MODEL THAT VALUES PROJECTS WITH
CONNECTED BENEFITS AND SUSTAINABLE OUTCOMES.”11 ‘‘
DISTRIBUTED MODELS FOR RESOURCE UTILIZATION
The convergence of these global mega-trends represents “an opportunity to achieve a resource productivity revolution comparable with the progress made on labor productivity during the 20th century”12 through innovative, highly-resilient distributed resource utilization models . Just as networked computers and mobile devices replaced mainframe computers and redefined how we work, consume, and live, critical resource sectors are undergoing a radical transformation toward distributed infrastructure . This creates new standards of efficiency and reduces vulnerability to shocks that would otherwise devastate incumbent centralized systems .
These distributed models for sustainable resource management are marked by efficiency (the ability to do more with less resources) and reuse (the ability to convert waste into value) .
Efficiency: Doing More with LessIn order to achieve growth in the face of increased resource demand, a revolution of production efficiency—the ability to do more with less—is needed .13 By stimulating and deploying technological innovation and establishing new methods of organization and management, radical improvements in efficiency will drive enhanced productivity across the food, energy, water, and waste sectors .14 15
Reuse: Converting Waste Streams to ValueReuse can be thought of as converting waste streams into value that can then be utilized again, a concept that is critical to achieving sustainable economic development in the twenty-first century .16 By applying proven technologies to current waste streams, new opportunities to create sellable commodities from previously discarded materials will drive more reuse, and reduce waste, across critical resource sectors .
11 Dobbs, Richard, Jeremy Oppenheim, Fraser Thompson, Marcel Brinkman, and Marc Zornes. Resource Revolution: Meeting the World’s Energy, Materials, Food, and Water Needs. November 2011. McKinsey & Company.
12 From Crisis to Connectivity: Renewed Thinking About Managing California’s Water & Food Supply. 2014. California Roundtable on Agriculture and the Environment. Prepared by Ag Innovations Network.
13 Borza, Mioara. 2014. The Connection between Efficiency and Sustainability: A Theoretical Approach. Proceddia Economics and Finance. Volume 15: pp. 1355–1363.14 Heck, Stefan and Matt Rogers. 2014. Resource Revolution: How to Capture the Biggest Business Opportunity in a Century. New York: Melcher Media.15 Borza, Mioara. 2014. The Connection between Efficiency and Sustainability: A Theoretical Approach. Proceddia Economics and Finance. Volume 15: pp. 1355–1363.16 Mohanty, C.R.C. 2011. Reduce, Reuse, Recycle and Resource Efficiency as the Basis for Sustainable Waste Management. United Nations Centre for Regional Development.17 Distributed Systems: A Design Model for Sustainable and Resilient Infrastructure. 2010. Victorian Eco Innovation Lab at the University of Melbourne.
OVER THE NEXT FEW DECADES, THE WAY PEOPLE OBTAIN THEIR FOOD,
WATER, AND ENERGY WILL UNDERGO A MAJOR EVOLUTION. PEOPLE
WILL NO LONGER RELY ON INDUSTRIAL PRODUCTION UNITS HUNDREDS
OR THOUSANDS OF KILOMETERS AWAY. INSTEAD THEY WILL SOURCE
A GREATER PROPORTION OF ESSENTIAL RESOURCES, GOODS, AND
SERVICES FROM WITHIN THEIR ‘NEIGHBORHOOD’.”17
‘‘
PAG E 7
REACHING PRICE PARITY ACROSS SECTORS
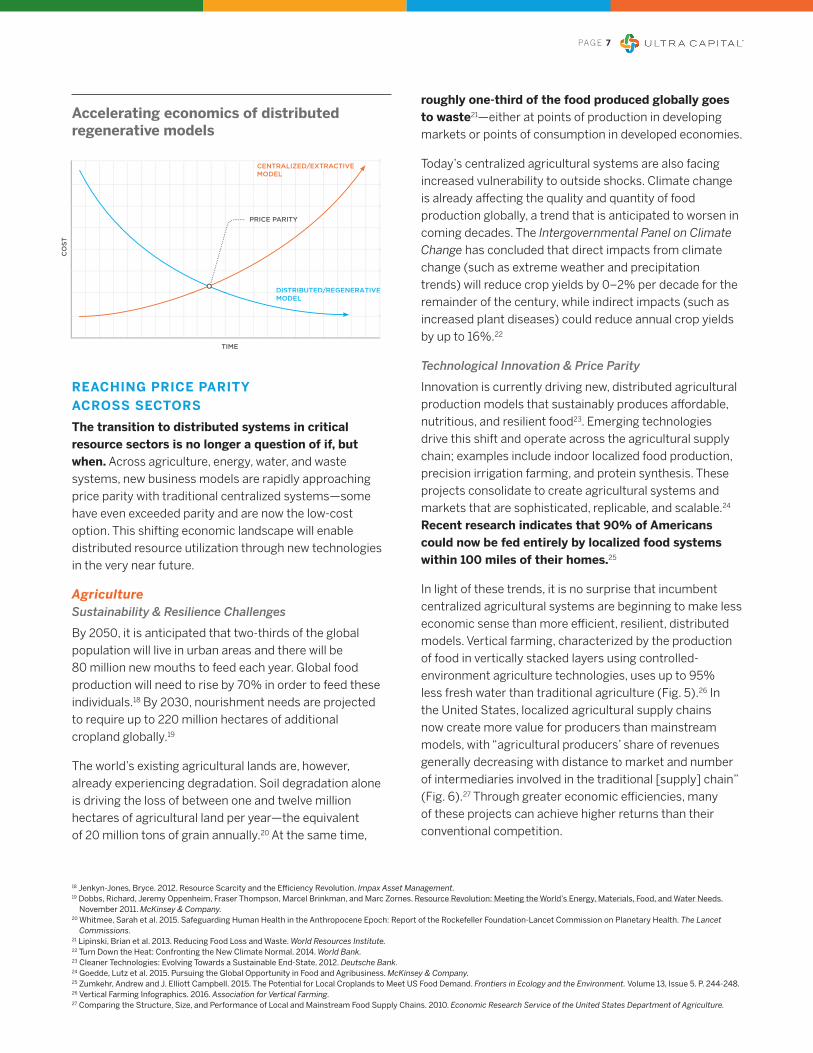
The transition to distributed systems in critical resource sectors is no longer a question of if, but when. Across agriculture, energy, water, and waste systems, new business models are rapidly approaching price parity with traditional centralized systems—some have even exceeded parity and are now the low-cost option . This shifting economic landscape will enable distributed resource utilization through new technologies in the very near future .
AgricultureSustainability & Resilience Challenges
By 2050, it is anticipated that two-thirds of the global population will live in urban areas and there will be 80 million new mouths to feed each year . Global food production will need to rise by 70% in order to feed these individuals .18 By 2030, nourishment needs are projected to require up to 220 million hectares of additional cropland globally .19
The world’s existing agricultural lands are, however, already experiencing degradation . Soil degradation alone is driving the loss of between one and twelve million hectares of agricultural land per year—the equivalent of 20 million tons of grain annually .20 At the same time,
roughly one-third of the food produced globally goes to waste21—either at points of production in developing markets or points of consumption in developed economies .
Today’s centralized agricultural systems are also facing increased vulnerability to outside shocks . Climate change is already affecting the quality and quantity of food production globally, a trend that is anticipated to worsen in coming decades . The Intergovernmental Panel on Climate Change has concluded that direct impacts from climate change (such as extreme weather and precipitation trends) will reduce crop yields by 0–2% per decade for the remainder of the century, while indirect impacts (such as increased plant diseases) could reduce annual crop yields by up to 16% .22
Technological Innovation & Price Parity
Innovation is currently driving new, distributed agricultural production models that sustainably produces affordable, nutritious, and resilient food23 . Emerging technologies drive this shift and operate across the agricultural supply chain; examples include indoor localized food production, precision irrigation farming, and protein synthesis . These projects consolidate to create agricultural systems and markets that are sophisticated, replicable, and scalable .24 Recent research indicates that 90% of Americans could now be fed entirely by localized food systems within 100 miles of their homes.25
In light of these trends, it is no surprise that incumbent centralized agricultural systems are beginning to make less economic sense than more efficient, resilient, distributed models . Vertical farming, characterized by the production of food in vertically stacked layers using controlled-environment agriculture technologies, uses up to 95% less fresh water than traditional agriculture (Fig . 5) .26 In the United States, localized agricultural supply chains now create more value for producers than mainstream models, with “agricultural producers’ share of revenues generally decreasing with distance to market and number of intermediaries involved in the traditional [supply] chain” (Fig . 6) .27 Through greater economic efficiencies, many of these projects can achieve higher returns than their conventional competition .
7
6
5
4
3
2
1
0
40
30
20
10
0
600
500
400
300
200
100
0
0-50
0-25
0
0-25
0-50
400
350
300
250
18001800 18501850 19001900 19501950 20002000
4
3
2
1
0
A. POPULATION
I. TROPICAL FOREST LOSS
D. ENERGY USE D. WATER USE
M. TEMPERATURE CHANGEL. CARBON DIOXIDE EMISSIONS
Wo
rld
pu
pilati
on
(b
illio
ns)
Glo
bal tr
op
ical fo
rest
lo
ss
co
mp
are
d w
ith
170
0 b
ase
lin
e (
%)
Wo
rld
pri
mary
en
erg
y u
se(E
J)
Glo
bal w
ate
r u
se (
tho
usa
nd
km
2)
Me
an
glo
bal te
mp
era
ture
ch
an
ge
(oC
)
Atm
osp
he
ric c
on
ce
ntr
ati
on
of
CO
2 (
pp
m)
Source: U.S. Census Bureau, International Database, July
2015 Update
Fig. 1. Global population is projected to grow by over 40% in
the next quarter-century.
Source: US Census Bureau
WORLD POPULATION:
1950 - 2050
3 BILLION
196
0
1970
198
0
199
0
20
00
20
10
20
20
20
30
2040
2050
10
9
8
7
6
5
4
3
2
1
0
5 BILLION6 BILLION
7 BILLION
8 BILLION
9 BILLION
UNITED KINGDOM
COUNTRYPOPULATION AT THE START OF THE GROWTH PERIOD (Million)YEARS TO DOUBLE PER CAPITA GDP1
YEAR
1700 1800 1900 2000
53
65
33
16
12
16 822
1,023
22
48
28
10
9154
UNITED STATES
GERMANY
JAPAN
SOUTH KOREA
INDIA
CHINA
CO
ST
TIME
PRICE PARITY
CENTRALIZED/EXTRACTIVE MODEL
DISTRIBUTED/REGENERATIVEMODELDISTRIBUTETR D//D REGENERATIVEG TE E
fresh water used for soil-based farming, 50–80% of which is lost to evaporation
70% GLOBAL
1500 MILES
70-95% LESS
LOCALon average, food travels 1500 to 2500 miles on its way to our plate
fresh water used for vertical farming utilizing the aquaponics or aeroponics method
vertical farming reduces the need for long-distance transport diminishing the use of fossil fuel and ensuring quality
TRADITIONAL FARMING VERTICAL FARMING
$14,250
250 KG
120 KG
20 kWh
160 KM
275 KM
+72%
30 kWh
$5,250
-63%
-52%
+50%
5
2015
BATTERY COST (1000$) BATTERY WEIGHT (10s of KG) BATTERY RANGE (10s of KM)
BATTERY CAPACITY (kWh)
2015 2015 20152020E 2020E 2020E 2020E
10
15
20
25
30
35
40
• EFFICIENCY
• REUSE• SOURCE OF DIVERSIFICATIONAA
SOURCE SOURCE SOURCE SOURCE
WASTE
TREATMENT USE
THE FUTURE: WATER CULTIVATION
USE
LOSS
LOSS
LOSS
LOSS
• INEFFICIENCY
• DISPOSABILITY
• HOMOGENOUS SUPPLYLL
SOURCE
WASTE
TREATMENT
TODAY: WATER HUNTING
TIN
(cans, solder)
GOLD
( jewellery, dental)
PHOSPHORUS
(fertil izer, animal blades)
ALUMINUM
(transport, electric, comsumer durables)
Today’s global consumption rate
Half the U.S. consumption rate
Reverse base
Annual global consumption
reverse base
(assuming global
consumption =
global production)
World population1/
2 U.S. per capita
consumption in
2006
X
If the demand grows, some key resources will be exhausted more quicky if predicted technologies appear and the population grows
HOW MANY YEARS LEFT IF THE WORLD CONSUMES AT..ZINC
(galvanising)
LEAD
(lead pipes, batteries)
SILVER
( jewellery, catalytic converters)
CHROMIUM
(chrome plating, paint)
INDIUM
(LCDs)
PLATINUM
( jewellery, catalysts, fuel cells)
ANTIMONY
(drugs)
URANIUM
(weapons, power stations)
NICKEL
(batteries, turbine blades)
TITANIUM
(cellphones, camera lenses)
COPPER
(wire, coins, plumbing)
48
9
13
42
29
1317
19
30
59
(t(t(tttt(t(( rrrr
4
20
34
36
38
40
42
57
142
510
116
46
45
61
143
360
90
345
1027
40
6.58 BILLIONWORLD POPULATION IN
APRIL 2007
301 MILLIONU.S. POPULATION IN
APRIL 2007
POPULATION COMPARISON
PLATINUM
0%
PHOSPHORUS
0%
GALLIUM
0%
URANIUM
0%
INDIUM
0%
COPPER
31%
NICKEL
35%
SILVER
16%
TITANIUM
20%
LEAD
72%
GOLD
43%
ALUMINUM
49%
ZINC
26%
TIN
26%
GERMANIUM
35%
CHROMIUM
25%
HOW LONG WILL IT LAST
PROPORTION OF CONSUMPTION MET BY RECYCLED MATERIALS
RE
TU
RN
15%
14%
13%
12%
11%
10%
9%
8%
7%
6%
5%
BONDS
1% 2% 3% 4% 5% 6% 7% 8% 9% 10% 11% 12% 13% 14% 15% 16% 17% 18%
REAL ESTATE
AGRICULTURE
TIMBER
EQUITIES
PRIVATE EQUITY
CHART 2: INCREASES IN REAL ASSET ALLOCATIONS% OF RESPONDENTS INCREASING IN THE PAST THREE YEARS/NEXT 18 MONTHS
REAL ESTATE
(n=192)
INFRASTRUCTURE
(n=132)
COMMODITIES
(n=59)
% 0 10 20 30 40 50
Will increase over the next 18 months
Increased over the past three years
Source: Blackrock and The Economist Intelligence Unit, 31 October 2014.
Accelerating economics of distributed regenerative models
18 Jenkyn-Jones, Bryce. 2012. Resource Scarcity and the Efficiency Revolution. Impax Asset Management.19 Dobbs, Richard, Jeremy Oppenheim, Fraser Thompson, Marcel Brinkman, and Marc Zornes. Resource Revolution: Meeting the World’s Energy, Materials, Food, and Water Needs.
November 2011. McKinsey & Company.20 Whitmee, Sarah et al. 2015. Safeguarding Human Health in the Anthropocene Epoch: Report of the Rockefeller Foundation-Lancet Commission on Planetary Health. The Lancet
Commissions.21 Lipinski, Brian et al. 2013. Reducing Food Loss and Waste. World Resources Institute.22 Turn Down the Heat: Confronting the New Climate Normal. 2014. World Bank.23 Cleaner Technologies: Evolving Towards a Sustainable End-State. 2012. Deutsche Bank.24 Goedde, Lutz et al. 2015. Pursuing the Global Opportunity in Food and Agribusiness. McKinsey & Company.25 Zumkehr, Andrew and J. Elliott Campbell. 2015. The Potential for Local Croplands to Meet US Food Demand. Frontiers in Ecology and the Environment. Volume 13, Issue 5. P. 244-248.26 Vertical Farming Infographics. 2016. Association for Vertical Farming.27 Comparing the Structure, Size, and Performance of Local and Mainstream Food Supply Chains. 2010. Economic Research Service of the United States Department of Agriculture.

PAG E 8
EnergySustainability & Resilience Challenges
The costs of relying on centralized fossil fuel energy systems are becoming more apparent by the day.28 As the world continues to meet rapidly increasing energy demand with fossil fuel combustion, anthropogenic carbon emissions have reached unprecedented levels at an unprecedented rate . The last time the Earth’s atmosphere reached the levels of CO2 seen today (in the Pliocene epoch, 2 .6 million years ago), our planet was much
warmer, with a climate and sea level very different from those in which modern human civilizations have developed and thrived .29 The consequences of climate change are already being observed and experienced around the world; even at current (relatively low) levels, there are more frequent occurrences of “extreme heat and extreme precipitation, drying trends in drought-prone regions, and increased tropical cyclone activity .”30
Percent of retail prices received by producers net of marketing and processing costs, by place and supply chain type
7
6
5
4
3
2
1
0
40
30
20
10
0
600
500
400
300
200
100
0
0-50
0-25
0
0-25
0-50
400
350
300
250
18001800 18501850 19001900 19501950 20002000
4
3
2
1
0
A. POPULATION
I. TROPICAL FOREST LOSS
D. ENERGY USE D. WATER USE
M. TEMPERATURE CHANGEL. CARBON DIOXIDE EMISSIONS
Wo
rld
pu
pilati
on
(b
illio
ns)
Glo
bal tr
op
ical fo
rest
lo
ss
co
mp
are
d w
ith
170
0 b
ase
lin
e (
%)
Wo
rld
pri
mary
en
erg
y u
se(E
J)
Glo
bal w
ate
r u
se (
tho
usa
nd
km
2)
Me
an
glo
bal te
mp
era
ture
ch
an
ge
(oC
)
Atm
osp
he
ric c
on
ce
ntr
ati
on
of
CO
2 (
pp
m)
Source: U.S. Census Bureau, International Database, July
2015 Update
Fig. 1. Global population is projected to grow by over 40% in
the next quarter-century.
Source: US Census Bureau
WORLD POPULATION:
1950 - 2050
3 BILLION
196
0
1970
198
0
199
0
20
00
20
10
20
20
20
30
2040
2050
10
9
8
7
6
5
4
3
2
1
0
5 BILLION6 BILLION
7 BILLION
8 BILLION
9 BILLION
UNITED KINGDOM
COUNTRYPOPULATION AT THE START OF THE GROWTH PERIOD (Million)YEARS TO DOUBLE PER CAPITA GDP1
YEAR
1700 1800 1900 2000
53
65
33
16
12
16 822
1,023
22
48
28
10
9154
UNITED STATES
GERMANY
JAPAN
SOUTH KOREA
INDIA
CHINA
CO
ST
TIME
PRICE PARITY
CENTRALIZED/EXTRACTIVE MODEL
DISTRIBUTED/REGENERATIVEMODELDISTRIBUTETR D//D REGENERATIVEG TE E
fresh water used for soil-based farming, 50–80% of which is lost to evaporation
70% GLOBAL
1500 MILES
70-95% LESS
LOCALon average, food travels 1500 to 2500 miles on its way to our plate
fresh water used for vertical farming utilizing the aquaponics or aeroponics method
vertical farming reduces the need for long-distance transport diminishing the use of fossil fuel and ensuring quality
TRADITIONAL FARMING VERTICAL FARMING
$14,250
250 KG
120 KG
20 kWh
160 KM
275 KM
+72%
30 kWh
$5,250
-63%
-52%
+50%
5
2015
BATTERY COST (1000$) BATTERY WEIGHT (10s of KG) BATTERY RANGE (10s of KM)
BATTERY CAPACITY (kWh)
2015 2015 20152020E 2020E 2020E 2020E
10
15
20
25
30
35
40
• EFFICIENCY
• REUSE• SOURCE OF DIVERSIFICATIONAA
SOURCE SOURCE SOURCE SOURCE
WASTE
TREATMENT USE
THE FUTURE: WATER CULTIVATION
USE
LOSS
LOSS
LOSS
LOSS
• INEFFICIENCY
• DISPOSABILITY
• HOMOGENOUS SUPPLYLL
SOURCE
WASTE
TREATMENT
TODAY: WATER HUNTING
TIN
(cans, solder)
GOLD
( jewellery, dental)
PHOSPHORUS
(fertil izer, animal blades)
ALUMINUM
(transport, electric, comsumer durables)
Today’s global consumption rate
Half the U.S. consumption rate
Reverse base
Annual global consumption
reverse base
(assuming global
consumption =
global production)
World population1/
2 U.S. per capita
consumption in
2006
X
If the demand grows, some key resources will be exhausted more quicky if predicted technologies appear and the population grows
HOW MANY YEARS LEFT IF THE WORLD CONSUMES AT..ZINC
(galvanising)
LEAD
(lead pipes, batteries)
SILVER
( jewellery, catalytic converters)
CHROMIUM
(chrome plating, paint)
INDIUM
(LCDs)
PLATINUM
( jewellery, catalysts, fuel cells)
ANTIMONY
(drugs)
URANIUM
(weapons, power stations)
NICKEL
(batteries, turbine blades)
TITANIUM
(cellphones, camera lenses)
COPPER
(wire, coins, plumbing)
48
9
13
42
29
1317
19
30
59
(t(t(tttt(t(( rrrr
4
20
34
36
38
40
42
57
142
510
116
46
45
61
143
360
90
345
1027
40
6.58 BILLIONWORLD POPULATION IN
APRIL 2007
301 MILLIONU.S. POPULATION IN
APRIL 2007
POPULATION COMPARISON
PLATINUM
0%
PHOSPHORUS
0%
GALLIUM
0%
URANIUM
0%
INDIUM
0%
COPPER
31%
NICKEL
35%
SILVER
16%
TITANIUM
20%
LEAD
72%
GOLD
43%
ALUMINUM
49%
ZINC
26%
TIN
26%
GERMANIUM
35%
CHROMIUM
25%
HOW LONG WILL IT LAST
PROPORTION OF CONSUMPTION MET BY RECYCLED MATERIALS
RE
TU
RN
15%
14%
13%
12%
11%
10%
9%
8%
7%
6%
5%
BONDS
1% 2% 3% 4% 5% 6% 7% 8% 9% 10% 11% 12% 13% 14% 15% 16% 17% 18%
REAL ESTATE
AGRICULTURE
TIMBER
EQUITIES
PRIVATE EQUITY
CHART 2: INCREASES IN REAL ASSET ALLOCATIONS% OF RESPONDENTS INCREASING IN THE PAST THREE YEARS/NEXT 18 MONTHS
REAL ESTATE
(n=192)
INFRASTRUCTURE
(n=132)
COMMODITIES
(n=59)
% 0 10 20 30 40 50
Will increase over the next 18 months
Increased over the past three years
Source: Blackrock and The Economist Intelligence Unit, 31 October 2014.
Fig. 5. Vertical farming is more energy and water-efficient than traditional
agricultural methods.
Source: Association for Vertical Farming.
28 Disruptive Technologies: Advances that Will Transform Life, Business, and the Global Economy. 2013. McKinsey Global Institute.29 Kunzig, Robert. 2013. Climate Milestone: Earth’s CO2 Level Passes 400ppm. National Geographic. 30 Turn Down the Heat: Confronting the New Climate Normal. 2014. World Bank.
Traditional Farming Vertical Farming
7
6
5
4
3
2
1
0
40
30
20
10
0
600
500
400
300
200
100
0
0-50
0-25
0
0-25
0-50
400
350
300
250
18001800 18501850 19001900 19501950 20002000
4
3
2
1
0
A. POPULATION
I. TROPICAL FOREST LOSS
D. ENERGY USE D. WATER USE
M. TEMPERATURE CHANGEL. CARBON DIOXIDE EMISSIONS
Wo
rld
pu
pilati
on
(b
illio
ns)
Glo
bal tr
op
ical fo
rest
lo
ss
co
mp
are
d w
ith
170
0 b
ase
lin
e (
%)
Wo
rld
pri
mary
en
erg
y u
se(E
J)
Glo
bal w
ate
r u
se (
tho
usa
nd
km
2)
Me
an
glo
bal te
mp
era
ture
ch
an
ge
(oC
)
Atm
osp
he
ric c
on
ce
ntr
ati
on
of
CO
2 (
pp
m)
Source: U.S. Census Bureau, International Database, July
2015 Update
Fig. 1. Global population is projected to grow by over 40% in
the next quarter-century.
Source: US Census Bureau
WORLD POPULATION:
1950 - 2050
3 BILLION
196
0
1970
198
0
199
0
20
00
20
10
20
20
20
30
2040
2050
10
9
8
7
6
5
4
3
2
1
0
5 BILLION6 BILLION
7 BILLION
8 BILLION
9 BILLION
UNITED KINGDOM
COUNTRYPOPULATION AT THE START OF THE GROWTH PERIOD (millions)YEARS TO DOUBLE PER CAPITA GDP1
YEAR
1700 1800 1900 2000
53
65
33
16
12
16 822
1,023
22
48
28
10
9154
UNITED STATES
GERMANY
JAPAN
SOUTH KOREA
INDIA
CHINA
CO
ST
TIME
PRICE PARITY
CENTRALIZED/EXTRACTIVE
MODEL
DISTRIBUTED/SUSTAINABLE
MODEL
fresh water used for soil-based farming 50-80% of which is lost to evaporation
70% GLOBAL
1500 MILES
70-95% LESS
LOCALon average, food travels 1500 to 2500 miles on its way to our plate
fresh water used for vertical farming utilizing the aquaponics or aeroponics method of farming
vertical farming reduces the need for long-distance transport diminishing the use of fossil fuel and ensuring quality
TRADITIONAL FARMING VERTICAL FARMING
$14,250
250 KG
120 KG
20 kWh
160 KM
275 KM
+72%
30 kWh
$5,250
-63%
-52%
+50%
5
2015
BATTERY COST (1000$) BATTERY WEIGHT (10s of KG) BATTERY RANGE (10s of KM)
BATTERY CAPACITY (kWh)
2015 2015 20152020E 2020E 2020E 2020E
10
15
20
25
30
35
40
• EFFICIENCY
• REUSE
• SOURCE OF DIVERSIFICATIONAA
SOURCE SOURCE SOURCE SOURCE
WASTE
TREATMENT USE
THE FUTURE: WATER CULTIVATION
USE
LOSSLOSS
LOSS
• INEFFICIENCY
• DISPOSABILITY
• HOMOGENOUS SUPPLYLL
SOURCE
WASTE
TREATMENT
LOSS
TODAY: WATER HUNTING
TIN
(cans, solder)
GOLD
( jewellery, dental)
PHOSPHORUS
(fertil izer, animal blades)
ALUMINUM
(transport, electric, comsumer durables)
Today’s global consumption rate
Half the U.S. consumption rate
Reverse base
Annual global consumption
reverse base
(assuming global
consumption =
global production)
World population1/
2 U.S. per capita
consumption in
2006
X
If the demand grows, some key resources will be exhausted more quicky if predicted technologies appear and the population grows
HOW MANY YEARS LEFT IF THE WORLD CONSUMES AT..ZINC
(galvanising)
LEAD
(lead pipes, batteries)
SILVER
( jewellery, catalytic converters)
CHROMIUM
(chrome plating, paint)
INDIUM
(LCDs)
PLATINUM
( jewellery, catalysts, fuel cells)
ANTIMONY
(drugs)
URANIUM
(weapons, power stations)
NICKEL
(batteries, turbine blades)
TITANIUM
(cellphones, camera lenses)
COPPER
(wire, coins, plumbing)
48
9
13
42
29
1317
19
30
59
(t(t(tttt(t(( rrrr
4
20
34
36
38
40
42
57
142
510
116
46
45
61
143
360
90
345
1027
40
6.58 BILLIONWORLD POPULATION IN
APRIL 2007
301 MILLIONU.S. POPULATION IN
APRIL 2007
POPULATION COMPARISON
PLATINUM
0%
PHOSPHORUS
0%
GALLIUM
0%
URANIUM
0%
INDIUM
0%
COPPER
31%
NICKEL
35%
SILVER
16%
TITANIUM
20%
LEAD
72%
GOLD
43%
ALUMINUM
49%
ZINC
26%
TIN
26%
GERMANIUM
35%
CHROMIUM
25%
HOW LONG WILL IT LAST
PROPORTION OF CONSUMPTION MET BY RECYCLED MATERIALS
RE
TU
RN
15%
14%
13%
12%
11%
10%
9%
8%
7%
6%
5%
BONDS
1% 2% 3% 4% 5% 6% 7% 8% 9% 10% 11% 12% 13% 14% 15% 16% 17% 18%
REAL ESTATE
AGRICULTURE
TIMBER
EQUITIES
PRIVATE EQUITY
CHART 2: INCREASES IN REAL ASSET ALLOCATIONS% OF RESPONDENTS INCREASING IN THE PAST THREE YEARS/NEXT 18 MONTHS
REAL ESTATE
(n=192)
INFRASTRUCTURE
(n=132)
COMMODOTIES
(n=59)
% 0 10 20 30 40 50
Will increase over the next 18 months
Increased over the past three years
Source: Blackrock and The Economist Intelligence Unit, 31 October 2014.
$1.40
$1.20
$1.00
$0.80
$0.60
$0.40
$0.20
$0
2014 2016 2018 2020 2022 2024 2026 2028 2030 2032 2034 2036 2038 2040 2042 2044 2046 2048 2050
NY
2026CA
2031
KY
2047
TX
2047
HI
PRE-2014
SOLAR-PLUS BATTERY LEVELIZED COST OF ELECTRICITY (LCOE) VS. UTILITY RETAIL PRICE PROJECTIONSCOMERCIAL - BASE CASE {Y-AXIS $/kWh}
Louisville, KY
Westchester, NY
San Antonio, TX
Los Angeles, CA
Honolulu, HI
LCOE Retail Price
100
80
60
40
20
0
Mainstream
Direct
Intermediated
Portland, OR
Blueberries
Sacramento, CA
Spring mix
Twin Cities, MN
Beef
DC area
Milk
ea
d te
Pe
rce
nt
of
reta
il p
rice
Syracuse, NY
Apples
$ T
rillio
ns
(US
D)
1995
Total volume of sustainable investments nearly doubled from 2012 to 2014
20031999 20071997 20052001 2010 2012 2014
$3.47 Trillion
$6.57 Trillion7
6
5
4
3
2
1
0
2
1950 1970 19951955 1975 2000 20151960 1980 2005 20201965 19901985 2010 2025
HISTORICAL FORECAST
CO2
GDP
$24,000
$20,000
$16,000
$12,000
$8,000
$4,000
$0
6,000
5,000
4,000
3,000
2,000
1,000
0
Perc
ent
of r
etai
l pri
ce
Fig. 6. Agricultural producers’ share of revenue
decreases with distance to market, helping drive
price parity for distributed agricultural systems.
Source: US Department of Agriculture.

PAG E 9
Centralized fossil fuel systems are also extremely inefficient and inequitable . In the United States, we waste more energy than we use—an issue that has increased since 1970 .31 Globally, one out of every five people still lacks access to electricity, and twice as many (nearly three billion people) use wood, coal, charcoal, animal waste, or other biomass to cook their meals and heat their homes . This lack of modern energy access not only inhibits global economic development, but also leads to the deaths of nearly two million people per year from indoor air pollution .32
Technological Innovation & Price Parity
Fortunately, clean energy technologies are increasingly efficient and cost-effective . The cost of renewable, energy generation has dropped dramatically over the past decade and is poised for further reduction .33 34 Additionally, new distributed energy storage technologies are rapidly advancing in capability and cost (Fig . 7) . The combination of these distributed generation and storage tech-nologies are anticipated to disrupt centralized energy systems to the extent that developed markets will move to an off-grid approach while developing markets will leapfrog traditional centralized infrastructure altogether .35 36
Fig. 7. Distributed energy storage technologies are achieving rapid performance improvements and cost reductions, disrupting centralized energy systems to drive more sustainable, distributed energy infrastructure
in developed and emerging markets.
Source: Goldman Sachs.
7
6
5
4
3
2
1
0
40
30
20
10
0
600
500
400
300
200
100
0
0-50
0-25
0
0-25
0-50
400
350
300
250
18001800 18501850 19001900 19501950 20002000
4
3
2
1
0
A. POPULATION
I. TROPICAL FOREST LOSS
D. ENERGY USE D. WATER USE
M. TEMPERATURE CHANGEL. CARBON DIOXIDE EMISSIONS
Wo
rld
pu
pilati
on
(b
illio
ns)
Glo
bal tr
op
ical fo
rest
lo
ss
co
mp
are
d w
ith
170
0 b
ase
lin
e (
%)
Wo
rld
pri
mary
en
erg
y u
se(E
J)
Glo
bal w
ate
r u
se (
tho
usa
nd
km
2)
Me
an
glo
bal te
mp
era
ture
ch
an
ge
(oC
)
Atm
osp
he
ric c
on
ce
ntr
ati
on
of
CO
2 (
pp
m)
Source: U.S. Census Bureau, International Database, July
2015 Update
Fig. 1. Global population is projected to grow by over 40% in
the next quarter-century.
Source: US Census Bureau
WORLD POPULATION:
1950 - 2050
3 BILLION
196
0
1970
198
0
199
0
20
00
20
10
20
20
20
30
2040
2050
10
9
8
7
6
5
4
3
2
1
0
5 BILLION6 BILLION
7 BILLION
8 BILLION
9 BILLION
UNITED KINGDOM
COUNTRYPOPULATION AT THE START OF THE GROWTH PERIOD (Million)YEARS TO DOUBLE PER CAPITA GDP1
YEAR
1700 1800 1900 2000
53
65
33
16
12
16 822
1,023
22
48
28
10
9154
UNITED STATES
GERMANY
JAPAN
SOUTH KOREA
INDIA
CHINA
CO
ST
TIME
PRICE PARITY
CENTRALIZED/EXTRACTIVE MODEL
DISTRIBUTED/REGENERATIVEMODELDISTRIBUTETR D//D REGENERATIVEG TE E
fresh water used for soil-based farming, 50–80% of which is lost to evaporation
70% GLOBAL
1500 MILES
70-95% LESS
LOCALon average, food travels 1500 to 2500 miles on its way to our plate
fresh water used for vertical farming utilizing the aquaponics or aeroponics method
vertical farming reduces the need for long-distance transport diminishing the use of fossil fuel and ensuring quality
TRADITIONAL FARMING VERTICAL FARMING
$14,250
250 KG
120 KG
20 kWh
160 KM
275 KM
+72%
30 kWh
$5,250
-63%
-52%
+50%
5
2015
BATTERY COST (1000$) BATTERY WEIGHT (10s of KG) BATTERY RANGE (10s of KM)
BATTERY CAPACITY (kWh)
2015 2015 20152020E 2020E 2020E 2020E
10
15
20
25
30
35
40
• EFFICIENCY
• REUSE• SOURCE OF DIVERSIFICATIONAA
SOURCE SOURCE SOURCE SOURCE
WASTE
TREATMENT USE
THE FUTURE: WATER CULTIVATION
USE
LOSS
LOSS
LOSS
LOSS
• INEFFICIENCY
• DISPOSABILITY
• HOMOGENOUS SUPPLYLL
SOURCE
WASTE
TREATMENT
TODAY: WATER HUNTING
TIN
(cans, solder)
GOLD
( jewellery, dental)
PHOSPHORUS
(fertil izer, animal blades)
ALUMINUM
(transport, electric, comsumer durables)
Today’s global consumption rate
Half the U.S. consumption rate
Reverse base
Annual global consumption
reverse base
(assuming global
consumption =
global production)
World population1/
2 U.S. per capita
consumption in
2006
X
If the demand grows, some key resources will be exhausted more quicky if predicted technologies appear and the population grows
HOW MANY YEARS LEFT IF THE WORLD CONSUMES AT..ZINC
(galvanising)
LEAD
(lead pipes, batteries)
SILVER
( jewellery, catalytic converters)
CHROMIUM
(chrome plating, paint)
INDIUM
(LCDs)
PLATINUM
( jewellery, catalysts, fuel cells)
ANTIMONY
(drugs)
URANIUM
(weapons, power stations)
NICKEL
(batteries, turbine blades)
TITANIUM
(cellphones, camera lenses)
COPPER
(wire, coins, plumbing)
48
9
13
42
29
1317
19
30
59
(t(t(tttt(t(( rrrr
4
20
34
36
38
40
42
57
142
510
116
46
45
61
143
360
90
345
1027
40
6.58 BILLIONWORLD POPULATION IN
APRIL 2007
301 MILLIONU.S. POPULATION IN
APRIL 2007
POPULATION COMPARISON
PLATINUM
0%
PHOSPHORUS
0%
GALLIUM
0%
URANIUM
0%
INDIUM
0%
COPPER
31%
NICKEL
35%
SILVER
16%
TITANIUM
20%
LEAD
72%
GOLD
43%
ALUMINUM
49%
ZINC
26%
TIN
26%
GERMANIUM
35%
CHROMIUM
25%
HOW LONG WILL IT LAST
PROPORTION OF CONSUMPTION MET BY RECYCLED MATERIALS
RE
TU
RN
15%
14%
13%
12%
11%
10%
9%
8%
7%
6%
5%
BONDS
1% 2% 3% 4% 5% 6% 7% 8% 9% 10% 11% 12% 13% 14% 15% 16% 17% 18%
REAL ESTATE
AGRICULTURE
TIMBER
EQUITIES
PRIVATE EQUITY
CHART 2: INCREASES IN REAL ASSET ALLOCATIONS% OF RESPONDENTS INCREASING IN THE PAST THREE YEARS/NEXT 18 MONTHS
REAL ESTATE
(n=192)
INFRASTRUCTURE
(n=132)
COMMODITIES
(n=59)
% 0 10 20 30 40 50
Will increase over the next 18 months
Increased over the past three years
Source: Blackrock and The Economist Intelligence Unit, 31 October 2014.
Low carbon technologies achieve rapid performance improvements and cost reductionsBattery cost reduction/performance improvements
31 Heck, Dr. Stefan. 2015. Resource Revolution: Investor Opportunities in the New Climate. Stanford University.32 Secretary-General Ban Ki-moon. 2011. Sustainable Energy for All: A Vision Statement. United Nations.33 Net Energy Metering, Zero Net Energy, and the Distributed Energy Resource Future: Adapting Electric Utility Business Models for the 21st Century. 2012. Rocky Mountain Institute.34 The Low Carbon Economy: Investor’s Guide to a Low-Carbon World, 2015–2025. 2015. Goldman Sachs.35 Solar Power & Energy Storage: Policy Factors vs. Improving Economics. 2014. Morgan Stanley.36 Disruptive Technologies: Advances that Will Transform Life, Business, and the Global Economy. 2013. McKinsey Global Institute.37 Solar Power & Energy Storage: Policy Factors vs. Improving Economics. 2014. Morgan Stanley.
ENERGY STORAGE, WHEN COMBINED WITH SOLAR POWER, COULD
DISRUPT UTILITIES TO THE EXTENT THAT CUSTOMERS MOVE TO AN
OFF-GRID APPROACH.”37‘‘

PAG E 10
In the United States, a considerable number of utility customers will likely see price parity for distributed clean energy systems within the next ten years (Fig . 8) .38 39 The electricity system of the near-future is therefore poised to cost-effectively meet sustainability and resiliency challenges by “encompassing an increasingly diverse and interconnected set of actors”40 through distributed networks and technologies .
WaterSustainability & Resilience Challenges
Over-consumption, inadequate valuation, inefficient irrigation systems, and climate change are exacerbating freshwater scarcity globally.42 Roughly 750 million people currently lack access to safe drinking water sources, while another 1 billion lack access to adequate sanitation services .43 By 2030, it is anticipated that 40% of the world’s population will suffer from water shortage .44
Fig. 8. Distributed clean energy systems will likely
see price parity with incumbent centralized
systems across the United States within the
next decade.
Source: Rocky Mountain Institute.
Solar + battery levelized cost of electricity (LCOE) vs. utility retail price projectionsCommercial-base case (Y-Axis $/kWh)
38 Solar Power & Energy Storage: Policy Factors vs. Improving Economics. 2014. Morgan Stanley.39 Net Energy Metering, Zero Net Energy, and the Distributed Energy Resource Future: Adapting Electric Utility Business Models for the 21st Century. 2012. Rocky Mountain Institute.40 Net Energy Metering, Zero Net Energy, and the Distributed Energy Resource Future: Adapting Electric Utility Business Models for the 21st Century. 2012. Rocky Mountain Institute.41 Distributed Energy. 2016. Rocky Mountain Institute.42 Whitmee, Sarah et al. 2015. Safeguarding Human Health in the Anthropocene Epoch: Report of the Rockefeller Foundation-Lancet Commission on Planetary Health. The Lancet
Commissions.43 Whitmee, Sarah et al. 2015. Safeguarding Human Health in the Anthropocene Epoch: Report of the Rockefeller Foundation-Lancet Commission on Planetary Health. The Lancet
Commissions.44 Water Scarcity. 2013. UN Water.
CENTRALIZED ELECTRICITY SYSTEMS ARE BECOMING OBSOLETE. IN
THEIR PLACE ARE EMERGING ‘DISTRIBUTED RESOURCES’—SMALLER,
DECENTRALIZED SOURCES THAT ARE CHEAPER, CLEANER, LESS RISKY,
MORE FLEXIBLE, AND QUICKER TO DEPLOY.”41 ‘‘
7
6
5
4
3
2
1
0
40
30
20
10
0
600
500
400
300
200
100
0
0-50
0-25
0
0-25
0-50
400
350
300
250
18001800 18501850 19001900 19501950 20002000
4
3
2
1
0
A. POPULATION
I. TROPICAL FOREST LOSS
D. ENERGY USE D. WATER USE
M. TEMPERATURE CHANGEL. CARBON DIOXIDE EMISSIONS
Wo
rld
pu
pilati
on
(b
illio
ns)
Glo
bal tr
op
ical fo
rest
lo
ss
co
mp
are
d w
ith
170
0 b
ase
lin
e (
%)
Wo
rld
pri
mary
en
erg
y u
se(E
J)
Glo
bal w
ate
r u
se (
tho
usa
nd
km
2)
Me
an
glo
bal te
mp
era
ture
ch
an
ge
(oC
)
Atm
osp
he
ric c
on
ce
ntr
ati
on
of
CO
2 (
pp
m)
Source: U.S. Census Bureau, International Database, July
2015 Update
Fig. 1. Global population is projected to grow by over 40% in
the next quarter-century.
Source: US Census Bureau
WORLD POPULATION:
1950 - 2050
3 BILLION
196
0
1970
198
0
199
0
20
00
20
10
20
20
20
30
2040
2050
10
9
8
7
6
5
4
3
2
1
0
5 BILLION6 BILLION
7 BILLION
8 BILLION
9 BILLION
UNITED KINGDOM
COUNTRYPOPULATION AT THE START OF THE GROWTH PERIOD (millions)YEARS TO DOUBLE PER CAPITA GDP1
YEAR
1700 1800 1900 2000
53
65
33
16
12
16 822
1,023
22
48
28
10
9154
UNITED STATES
GERMANY
JAPAN
SOUTH KOREA
INDIA
CHINA
CO
ST
TIME
PRICE PARITY
CENTRALIZED/EXTRACTIVE
MODEL
DISTRIBUTED/SUSTAINABLE
MODEL
fresh water used for soil-based farming 50-80% of which is lost to evaporation
70% GLOBAL
1500 MILES
70-95% LESS
LOCALon average, food travels 1500 to 2500 miles on its way to our plate
fresh water used for vertical farming utilizing the aquaponics or aeroponics method of farming
vertical farming reduces the need for long-distance transport diminishing the use of fossil fuel and ensuring quality
TRADITIONAL FARMING VERTICAL FARMING
$14,250
250 KG
120 KG
20 kWh
160 KM
275 KM
+72%
30 kWh
$5,250
-63%
-52%
+50%
5
2015
BATTERY COST (1000$) BATTERY WEIGHT (10s of KG) BATTERY RANGE (10s of KM)
BATTERY CAPACITY (kWh)
2015 2015 20152020E 2020E 2020E 2020E
10
15
20
25
30
35
40
• EFFICIENCY
• REUSE
• SOURCE OF DIVERSIFICATIONAA
SOURCE SOURCE SOURCE SOURCE
WASTE
TREATMENT USE
THE FUTURE: WATER CULTIVATION
USE
LOSSLOSS
LOSS
• INEFFICIENCY
• DISPOSABILITY
• HOMOGENOUS SUPPLYLL
SOURCE
WASTE
TREATMENT
LOSS
TODAY: WATER HUNTING
TIN
(cans, solder)
GOLD
( jewellery, dental)
PHOSPHORUS
(fertil izer, animal blades)
ALUMINUM
(transport, electric, comsumer durables)
Today’s global consumption rate
Half the U.S. consumption rate
Reverse base
Annual global consumption
reverse base
(assuming global
consumption =
global production)
World population1/
2 U.S. per capita
consumption in
2006
X
If the demand grows, some key resources will be exhausted more quicky if predicted technologies appear and the population grows
HOW MANY YEARS LEFT IF THE WORLD CONSUMES AT..ZINC
(galvanising)
LEAD
(lead pipes, batteries)
SILVER
( jewellery, catalytic converters)
CHROMIUM
(chrome plating, paint)
INDIUM
(LCDs)
PLATINUM
( jewellery, catalysts, fuel cells)
ANTIMONY
(drugs)
URANIUM
(weapons, power stations)
NICKEL
(batteries, turbine blades)
TITANIUM
(cellphones, camera lenses)
COPPER
(wire, coins, plumbing)
48
9
13
42
29
1317
19
30
59
(t(t(tttt(t(( rrrr
4
20
34
36
38
40
42
57
142
510
116
46
45
61
143
360
90
345
1027
40
6.58 BILLIONWORLD POPULATION IN
APRIL 2007
301 MILLIONU.S. POPULATION IN
APRIL 2007
POPULATION COMPARISON
PLATINUM
0%
PHOSPHORUS
0%
GALLIUM
0%
URANIUM
0%
INDIUM
0%
COPPER
31%
NICKEL
35%
SILVER
16%
TITANIUM
20%
LEAD
72%
GOLD
43%
ALUMINUM
49%
ZINC
26%
TIN
26%
GERMANIUM
35%
CHROMIUM
25%
HOW LONG WILL IT LAST
PROPORTION OF CONSUMPTION MET BY RECYCLED MATERIALS
RE
TU
RN
15%
14%
13%
12%
11%
10%
9%
8%
7%
6%
5%
BONDS
1% 2% 3% 4% 5% 6% 7% 8% 9% 10% 11% 12% 13% 14% 15% 16% 17% 18%
REAL ESTATE
AGRICULTURE
TIMBER
EQUITIES
PRIVATE EQUITY
CHART 2: INCREASES IN REAL ASSET ALLOCATIONS% OF RESPONDENTS INCREASING IN THE PAST THREE YEARS/NEXT 18 MONTHS
REAL ESTATE
(n=192)
INFRASTRUCTURE
(n=132)
COMMODOTIES
(n=59)
% 0 10 20 30 40 50
Will increase over the next 18 months
Increased over the past three years
Source: Blackrock and The Economist Intelligence Unit, 31 October 2014.
$1.40
$1.20
$1.00
$0.80
$0.60
$0.40
$0.20
$0
2014 2016 2018 2020 2022 2024 2026 2028 2030 2032 2034 2036 2038 2040 2042 2044 2046 2048 2050
NY
2026CA
2031
KY
2047
TX
2047
HI
PRE-2014
SOLAR-PLUS BATTERY LEVELIZED COST OF ELECTRICITY (LCOE) VS. UTILITY RETAIL PRICE PROJECTIONSCOMERCIAL - BASE CASE {Y-AXIS $/kWh}
Louisville, KY
Westchester, NY
San Antonio, TX
Los Angeles, CA
Honolulu, HI
LCOE Retail Price
100
80
60
40
20
0
Mainstream
Direct
Intermediated
Portland, OR
Blueberries
Sacramento, CA
Spring mix
Twin Cities, MN
Beef
DC area
Milk
ea
d te
Pe
rce
nt
of
reta
il p
rice
Syracuse, NY
Apples
$ T
rillio
ns
(US
D)
1995
Total volume of sustainable investments nearly doubled from 2012 to 2014
20031999 20071997 20052001 2010 2012 2014
$3.47 Trillion
$6.57 Trillion7
6
5
4
3
2
1
0
2
1950 1970 19951955 1975 2000 20151960 1980 2005 20201965 19901985 2010 2025
HISTORICAL FORECAST
CO2
GDP
$24,000
$20,000
$16,000
$12,000
$8,000
$4,000
$0
6,000
5,000
4,000
3,000
2,000
1,000
0
7
6
5
4
3
2
1
0
40
30
20
10
0
600
500
400
300
200
100
0
0-50
0-25
0
0-25
0-50
400
350
300
250
18001800 18501850 19001900 19501950 20002000
4
3
2
1
0
A. POPULATION
I. TROPICAL FOREST LOSS
D. ENERGY USE D. WATER USE
M. TEMPERATURE CHANGEL. CARBON DIOXIDE EMISSIONS
Wo
rld
pu
pilati
on
(b
illio
ns)
Glo
bal tr
op
ical fo
rest
lo
ss
co
mp
are
d w
ith
170
0 b
ase
lin
e (
%)
Wo
rld
pri
mary
en
erg
y u
se(E
J)
Glo
bal w
ate
r u
se (
tho
usa
nd
km
2)
Me
an
glo
bal te
mp
era
ture
ch
an
ge
(oC
)
Atm
osp
he
ric c
on
ce
ntr
ati
on
of
CO
2 (
pp
m)
Source: U.S. Census Bureau, International Database, July
2015 Update
Fig. 1. Global population is projected to grow by over 40% in
the next quarter-century.
Source: US Census Bureau
WORLD POPULATION:
1950 - 2050
3 BILLION
196
0
1970
198
0
199
0
20
00
20
10
20
20
20
30
2040
2050
10
9
8
7
6
5
4
3
2
1
0
5 BILLION6 BILLION
7 BILLION
8 BILLION
9 BILLION
UNITED KINGDOM
COUNTRYPOPULATION AT THE START OF THE GROWTH PERIOD (millions)YEARS TO DOUBLE PER CAPITA GDP1
YEAR
1700 1800 1900 2000
53
65
33
16
12
16 822
1,023
22
48
28
10
9154
UNITED STATES
GERMANY
JAPAN
SOUTH KOREA
INDIA
CHINA
CO
ST
TIME
PRICE PARITY
CENTRALIZED/EXTRACTIVE
MODEL
DISTRIBUTED/SUSTAINABLE
MODEL
fresh water used for soil-based farming 50-80% of which is lost to evaporation
70% GLOBAL
1500 MILES
70-95% LESS
LOCALon average, food travels 1500 to 2500 miles on its way to our plate
fresh water used for vertical farming utilizing the aquaponics or aeroponics method of farming
vertical farming reduces the need for long-distance transport diminishing the use of fossil fuel and ensuring quality
TRADITIONAL FARMING VERTICAL FARMING
$14,250
250 KG
120 KG
20 kWh
160 KM
275 KM
+72%
30 kWh
$5,250
-63%
-52%
+50%
5
2015
BATTERY COST (1000$) BATTERY WEIGHT (10s of KG) BATTERY RANGE (10s of KM)
BATTERY CAPACITY (kWh)
2015 2015 20152020E 2020E 2020E 2020E
10
15
20
25
30
35
40
• EFFICIENCY
• REUSE
• SOURCE OF DIVERSIFICATIONAA
SOURCE SOURCE SOURCE SOURCE
WASTE
TREATMENT USE
THE FUTURE: WATER CULTIVATION
USE
LOSSLOSS
LOSS
• INEFFICIENCY
• DISPOSABILITY
• HOMOGENOUS SUPPLYLL
SOURCE
WASTE
TREATMENT
LOSS
TODAY: WATER HUNTING
TIN
(cans, solder)
GOLD
( jewellery, dental)
PHOSPHORUS
(fertil izer, animal blades)
ALUMINUM
(transport, electric, comsumer durables)
Today’s global consumption rate
Half the U.S. consumption rate
Reverse base
Annual global consumption
reverse base
(assuming global
consumption =
global production)
World population1/
2 U.S. per capita
consumption in
2006
X
If the demand grows, some key resources will be exhausted more quicky if predicted technologies appear and the population grows
HOW MANY YEARS LEFT IF THE WORLD CONSUMES AT..ZINC
(galvanising)
LEAD
(lead pipes, batteries)
SILVER
( jewellery, catalytic converters)
CHROMIUM
(chrome plating, paint)
INDIUM
(LCDs)
PLATINUM
( jewellery, catalysts, fuel cells)
ANTIMONY
(drugs)
URANIUM
(weapons, power stations)
NICKEL
(batteries, turbine blades)
TITANIUM
(cellphones, camera lenses)
COPPER
(wire, coins, plumbing)
48
9
13
42
29
1317
19
30
59
(t(t(tttt(t(( rrrr
4
20
34
36
38
40
42
57
142
510
116
46
45
61
143
360
90
345
1027
40
6.58 BILLIONWORLD POPULATION IN
APRIL 2007
301 MILLIONU.S. POPULATION IN
APRIL 2007
POPULATION COMPARISON
PLATINUM
0%
PHOSPHORUS
0%
GALLIUM
0%
URANIUM
0%
INDIUM
0%
COPPER
31%
NICKEL
35%
SILVER
16%
TITANIUM
20%
LEAD
72%
GOLD
43%
ALUMINUM
49%
ZINC
26%
TIN
26%
GERMANIUM
35%
CHROMIUM
25%
HOW LONG WILL IT LAST
PROPORTION OF CONSUMPTION MET BY RECYCLED MATERIALS
RE
TU
RN
15%
14%
13%
12%
11%
10%
9%
8%
7%
6%
5%
BONDS
1% 2% 3% 4% 5% 6% 7% 8% 9% 10% 11% 12% 13% 14% 15% 16% 17% 18%
REAL ESTATE
AGRICULTURE
TIMBER
EQUITIES
PRIVATE EQUITY
CHART 2: INCREASES IN REAL ASSET ALLOCATIONS% OF RESPONDENTS INCREASING IN THE PAST THREE YEARS/NEXT 18 MONTHS
REAL ESTATE
(n=192)
INFRASTRUCTURE
(n=132)
COMMODOTIES
(n=59)
% 0 10 20 30 40 50
Will increase over the next 18 months
Increased over the past three years
Source: Blackrock and The Economist Intelligence Unit, 31 October 2014.
$1.40
$1.20
$1.00
$0.80
$0.60
$0.40
$0.20
$0
2014 2016 2018 2020 2022 2024 2026 2028 2030 2032 2034 2036 2038 2040 2042 2044 2046 2048 2050
NY
2026CA
2031
KY
2047
TX
2047
HI
PRE-2014
SOLAR-PLUS BATTERY LEVELIZED COST OF ELECTRICITY (LCOE) VS. UTILITY RETAIL PRICE PROJECTIONSCOMERCIAL - BASE CASE {Y-AXIS $/kWh}
Louisville, KY
Westchester, NY
San Antonio, TX
Los Angeles, CA
Honolulu, HI
LCOE Retail Price
100
80
60
40
20
0
Mainstream
Direct
Intermediated
Portland, OR
Blueberries
Sacramento, CA
Spring mix
Twin Cities, MN
Beef
DC area
Milk
ea
d te
Pe
rce
nt
of
reta
il p
rice
Syracuse, NY
Apples
$ T
rillio
ns
(US
D)
1995
Total volume of sustainable investments nearly doubled from 2012 to 2014
20031999 20071997 20052001 2010 2012 2014
$3.47 Trillion
$6.57 Trillion7
6
5
4
3
2
1
0
2
1950 1970 19951955 1975 2000 20151960 1980 2005 20201965 19901985 2010 2025
HISTORICAL FORECAST
CO2
GDP
$24,000
$20,000
$16,000
$12,000
$8,000
$4,000
$0
6,000
5,000
4,000
3,000
2,000
1,000
0
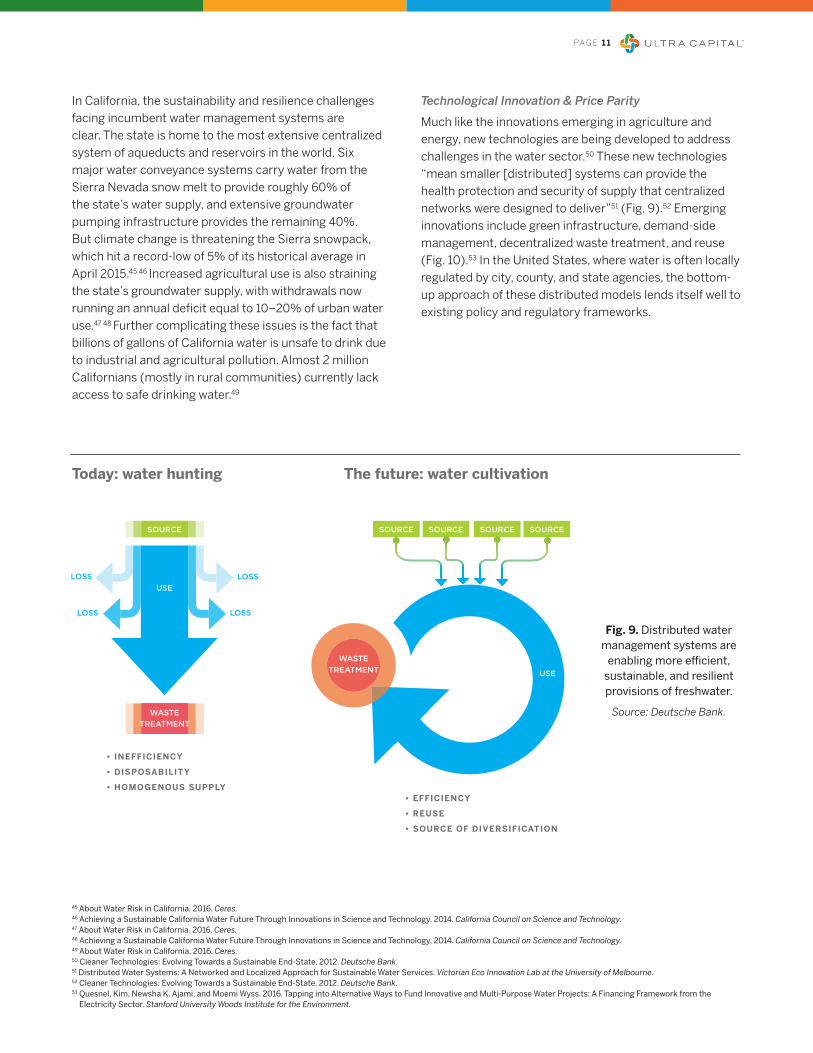
PAG E 1 1
In California, the sustainability and resilience challenges facing incumbent water management systems are clear . The state is home to the most extensive centralized system of aqueducts and reservoirs in the world . Six major water conveyance systems carry water from the Sierra Nevada snow melt to provide roughly 60% of the state’s water supply, and extensive groundwater pumping infrastructure provides the remaining 40% . But climate change is threatening the Sierra snowpack, which hit a record-low of 5% of its historical average in April 2015 .45 46 Increased agricultural use is also straining the state’s groundwater supply, with withdrawals now running an annual deficit equal to 10–20% of urban water use .47 48 Further complicating these issues is the fact that billions of gallons of California water is unsafe to drink due to industrial and agricultural pollution . Almost 2 million Californians (mostly in rural communities) currently lack access to safe drinking water .49
Technological Innovation & Price Parity
Much like the innovations emerging in agriculture and energy, new technologies are being developed to address challenges in the water sector .50 These new technologies “mean smaller [distributed] systems can provide the health protection and security of supply that centralized networks were designed to deliver”51 (Fig . 9) .52 Emerging innovations include green infrastructure, demand-side management, decentralized waste treatment, and reuse (Fig . 10) .53 In the United States, where water is often locally regulated by city, county, and state agencies, the bottom-up approach of these distributed models lends itself well to existing policy and regulatory frameworks .
Fig. 9. Distributed water management systems are
enabling more efficient, sustainable, and resilient provisions of freshwater.
Source: Deutsche Bank.
7
6
5
4
3
2
1
0
40
30
20
10
0
600
500
400
300
200
100
0
0-50
0-25
0
0-25
0-50
400
350
300
250
18001800 18501850 19001900 19501950 20002000
4
3
2
1
0
A. POPULATION
I. TROPICAL FOREST LOSS
D. ENERGY USE D. WATER USE
M. TEMPERATURE CHANGEL. CARBON DIOXIDE EMISSIONS
Wo
rld
pu
pilati
on
(b
illio
ns)
Glo
bal tr
op
ical fo
rest
lo
ss
co
mp
are
d w
ith
170
0 b
ase
lin
e (
%)
Wo
rld
pri
mary
en
erg
y u
se(E
J)
Glo
bal w
ate
r u
se (
tho
usa
nd
km
2)
Me
an
glo
bal te
mp
era
ture
ch
an
ge
(oC
)
Atm
osp
he
ric c
on
ce
ntr
ati
on
of
CO
2 (
pp
m)
Source: U.S. Census Bureau, International Database, July
2015 Update
Fig. 1. Global population is projected to grow by over 40% in
the next quarter-century.
Source: US Census Bureau
WORLD POPULATION:
1950 - 2050
3 BILLION19
60
1970
198
0
199
0
20
00
20
10
20
20
20
30
2040
2050
10
9
8
7
6
5
4
3
2
1
0
5 BILLION6 BILLION
7 BILLION
8 BILLION
9 BILLION
UNITED KINGDOM
COUNTRYPOPULATION AT THE START OF THE GROWTH PERIOD (Million)YEARS TO DOUBLE PER CAPITA GDP1
YEAR
1700 1800 1900 2000
53
65
33
16
12
16 822
1,023
22
48
28
10
9154
UNITED STATES
GERMANY
JAPAN
SOUTH KOREA
INDIA
CHINA
CO
ST
TIME
PRICE PARITY
CENTRALIZED/EXTRACTIVE MODEL
DISTRIBUTED/REGENERATIVEMODELDISTRIBUTETR D//D REGENERATIVEG TE E
fresh water used for soil-based farming, 50–80% of which is lost to evaporation
70% GLOBAL
1500 MILES
70-95% LESS
LOCALon average, food travels 1500 to 2500 miles on its way to our plate
fresh water used for vertical farming utilizing the aquaponics or aeroponics method
vertical farming reduces the need for long-distance transport diminishing the use of fossil fuel and ensuring quality
TRADITIONAL FARMING VERTICAL FARMING
$14,250
250 KG
120 KG
20 kWh
160 KM
275 KM
+72%
30 kWh
$5,250
-63%
-52%
+50%
5
2015
BATTERY COST (1000$) BATTERY WEIGHT (10s of KG) BATTERY RANGE (10s of KM)
BATTERY CAPACITY (kWh)
2015 2015 20152020E 2020E 2020E 2020E
10
15
20
25
30
35
40
• EFFICIENCY
• REUSE• SOURCE OF DIVERSIFICATIONAA
SOURCE SOURCE SOURCE SOURCE
WASTE
TREATMENT USE
THE FUTURE: WATER CULTIVATION
USE
LOSS
LOSS
LOSS
LOSS
• INEFFICIENCY
• DISPOSABILITY
• HOMOGENOUS SUPPLYLL
SOURCE
WASTE
TREATMENT
TODAY: WATER HUNTING
TIN
(cans, solder)
GOLD
( jewellery, dental)
PHOSPHORUS
(fertil izer, animal blades)
ALUMINUM
(transport, electric, comsumer durables)
Today’s global consumption rate
Half the U.S. consumption rate
Reverse base
Annual global consumption
reverse base
(assuming global
consumption =
global production)
World population1/
2 U.S. per capita
consumption in
2006
X
If the demand grows, some key resources will be exhausted more quicky if predicted technologies appear and the population grows
HOW MANY YEARS LEFT IF THE WORLD CONSUMES AT..ZINC
(galvanising)
LEAD
(lead pipes, batteries)
SILVER
( jewellery, catalytic converters)
CHROMIUM
(chrome plating, paint)
INDIUM
(LCDs)
PLATINUM
( jewellery, catalysts, fuel cells)
ANTIMONY
(drugs)
URANIUM
(weapons, power stations)
NICKEL
(batteries, turbine blades)
TITANIUM
(cellphones, camera lenses)
COPPER
(wire, coins, plumbing)
48
9
13
42
29
1317
19
30
59
(t(t(tttt(t(( rrrr
4
20
34
36
38
40
42
57
142
510
116
46
45
61
143
360
90
345
1027
40
6.58 BILLIONWORLD POPULATION IN
APRIL 2007
301 MILLIONU.S. POPULATION IN
APRIL 2007
POPULATION COMPARISON
PLATINUM
0%
PHOSPHORUS
0%
GALLIUM
0%
URANIUM
0%
INDIUM
0%
COPPER
31%
NICKEL
35%
SILVER
16%
TITANIUM
20%
LEAD
72%
GOLD
43%
ALUMINUM
49%
ZINC
26%
TIN
26%
GERMANIUM
35%
CHROMIUM
25%
HOW LONG WILL IT LAST
PROPORTION OF CONSUMPTION MET BY RECYCLED MATERIALS
RE
TU
RN
15%
14%
13%
12%
11%
10%
9%
8%
7%
6%
5%
BONDS
1% 2% 3% 4% 5% 6% 7% 8% 9% 10% 11% 12% 13% 14% 15% 16% 17% 18%
REAL ESTATE
AGRICULTURE
TIMBER
EQUITIES
PRIVATE EQUITY
CHART 2: INCREASES IN REAL ASSET ALLOCATIONS% OF RESPONDENTS INCREASING IN THE PAST THREE YEARS/NEXT 18 MONTHS
REAL ESTATE
(n=192)
INFRASTRUCTURE
(n=132)
COMMODITIES
(n=59)
% 0 10 20 30 40 50
Will increase over the next 18 months
Increased over the past three years
Source: Blackrock and The Economist Intelligence Unit, 31 October 2014.
7
6
5
4
3
2
1
0
40
30
20
10
0
600
500
400
300
200
100
0
0-50
0-25
0
0-25
0-50
400
350
300
250
18001800 18501850 19001900 19501950 20002000
4
3
2
1
0
A. POPULATION
I. TROPICAL FOREST LOSS
D. ENERGY USE D. WATER USE
M. TEMPERATURE CHANGEL. CARBON DIOXIDE EMISSIONS
Wo
rld
pu
pilati
on
(b
illio
ns)
Glo
bal tr
op
ical fo
rest
lo
ss
co
mp
are
d w
ith
170
0 b
ase
lin
e (
%)
Wo
rld
pri
mary
en
erg
y u
se(E
J)
Glo
bal w
ate
r u
se (
tho
usa
nd
km
2)
Me
an
glo
bal te
mp
era
ture
ch
an
ge
(oC
)
Atm
osp
he
ric c
on
ce
ntr
ati
on
of
CO
2 (
pp
m)
Source: U.S. Census Bureau, International Database, July
2015 Update
Fig. 1. Global population is projected to grow by over 40% in
the next quarter-century.
Source: US Census Bureau
WORLD POPULATION:
1950 - 2050
3 BILLION
196
0
1970
198
0
199
0
20
00
20
10
20
20
20
30
2040
2050
10
9
8
7
6
5
4
3
2
1
0
5 BILLION6 BILLION
7 BILLION
8 BILLION
9 BILLION
UNITED KINGDOM
COUNTRYPOPULATION AT THE START OF THE GROWTH PERIOD (Million)YEARS TO DOUBLE PER CAPITA GDP1
YEAR
1700 1800 1900 2000
53
65
33
16
12
16 822
1,023
22
48
28
10
9154
UNITED STATES
GERMANY
JAPAN
SOUTH KOREA
INDIA
CHINA
CO
ST
TIME
PRICE PARITY
CENTRALIZED/EXTRACTIVE MODEL
DISTRIBUTED/REGENERATIVEMODELDISTRIBUTETR D//D REGENERATIVEG TE E
fresh water used for soil-based farming, 50–80% of which is lost to evaporation
70% GLOBAL
1500 MILES
70-95% LESS
LOCALon average, food travels 1500 to 2500 miles on its way to our plate
fresh water used for vertical farming utilizing the aquaponics or aeroponics method
vertical farming reduces the need for long-distance transport diminishing the use of fossil fuel and ensuring quality
TRADITIONAL FARMING VERTICAL FARMING
$14,250
250 KG
120 KG
20 kWh
160 KM
275 KM
+72%
30 kWh
$5,250
-63%
-52%
+50%
5
2015
BATTERY COST (1000$) BATTERY WEIGHT (10s of KG) BATTERY RANGE (10s of KM)
BATTERY CAPACITY (kWh)
2015 2015 20152020E 2020E 2020E 2020E
10
15
20
25
30
35
40
• EFFICIENCY
• REUSE• SOURCE OF DIVERSIFICATIONAA
SOURCE SOURCE SOURCE SOURCE
WASTE
TREATMENT USE
THE FUTURE: WATER CULTIVATION
USE
LOSS
LOSS
LOSS
LOSS
• INEFFICIENCY
• DISPOSABILITY
• HOMOGENOUS SUPPLYLL
SOURCE
WASTE
TREATMENT
TODAY: WATER HUNTING
TIN
(cans, solder)
GOLD
( jewellery, dental)
PHOSPHORUS
(fertil izer, animal blades)
ALUMINUM
(transport, electric, comsumer durables)
Today’s global consumption rate
Half the U.S. consumption rate
Reverse base
Annual global consumption
reverse base
(assuming global
consumption =
global production)
World population1/
2 U.S. per capita
consumption in
2006
X
If the demand grows, some key resources will be exhausted more quicky if predicted technologies appear and the population grows
HOW MANY YEARS LEFT IF THE WORLD CONSUMES AT..ZINC
(galvanising)
LEAD
(lead pipes, batteries)
SILVER
( jewellery, catalytic converters)
CHROMIUM
(chrome plating, paint)
INDIUM
(LCDs)
PLATINUM
( jewellery, catalysts, fuel cells)
ANTIMONY
(drugs)
URANIUM
(weapons, power stations)
NICKEL
(batteries, turbine blades)
TITANIUM
(cellphones, camera lenses)
COPPER
(wire, coins, plumbing)
48
9
13
42
29
1317
19
30
59
(t(t(tttt(t(( rrrr
4
20
34
36
38
40
42
57
142
510
116
46
45
61
143
360
90
345
1027
40
6.58 BILLIONWORLD POPULATION IN
APRIL 2007
301 MILLIONU.S. POPULATION IN
APRIL 2007
POPULATION COMPARISON
PLATINUM
0%
PHOSPHORUS
0%
GALLIUM
0%
URANIUM
0%
INDIUM
0%
COPPER
31%
NICKEL
35%
SILVER
16%
TITANIUM
20%
LEAD
72%
GOLD
43%
ALUMINUM
49%
ZINC
26%
TIN
26%
GERMANIUM
35%
CHROMIUM
25%
HOW LONG WILL IT LAST
PROPORTION OF CONSUMPTION MET BY RECYCLED MATERIALS
RE
TU
RN
15%
14%
13%
12%
11%
10%
9%
8%
7%
6%
5%
BONDS
1% 2% 3% 4% 5% 6% 7% 8% 9% 10% 11% 12% 13% 14% 15% 16% 17% 18%
REAL ESTATE
AGRICULTURE
TIMBER
EQUITIES
PRIVATE EQUITY
CHART 2: INCREASES IN REAL ASSET ALLOCATIONS% OF RESPONDENTS INCREASING IN THE PAST THREE YEARS/NEXT 18 MONTHS
REAL ESTATE
(n=192)
INFRASTRUCTURE
(n=132)
COMMODITIES
(n=59)
% 0 10 20 30 40 50
Will increase over the next 18 months
Increased over the past three years
Source: Blackrock and The Economist Intelligence Unit, 31 October 2014.
Today: water hunting The future: water cultivation
• INEFFICIENCY
• DISPOSABILITY
• HOMOGENOUS SUPPLY• EFFICIENCY
• REUSE
• SOURCE OF DIVERSIFICATION
45 About Water Risk in California. 2016. Ceres.46 Achieving a Sustainable California Water Future Through Innovations in Science and Technology. 2014. California Council on Science and Technology.47 About Water Risk in California. 2016. Ceres.48 Achieving a Sustainable California Water Future Through Innovations in Science and Technology. 2014. California Council on Science and Technology.49 About Water Risk in California. 2016. Ceres.50 Cleaner Technologies: Evolving Towards a Sustainable End-State. 2012. Deutsche Bank.51 Distributed Water Systems: A Networked and Localized Approach for Sustainable Water Services. Victorian Eco Innovation Lab at the University of Melbourne.52 Cleaner Technologies: Evolving Towards a Sustainable End-State. 2012. Deutsche Bank.53 Quesnel, Kim, Newsha K. Ajami, and Moemi Wyss. 2016. Tapping into Alternative Ways to Fund Innovative and Multi-Purpose Water Projects: A Financing Framework from the
Electricity Sector. Stanford University Woods Institute for the Environment.
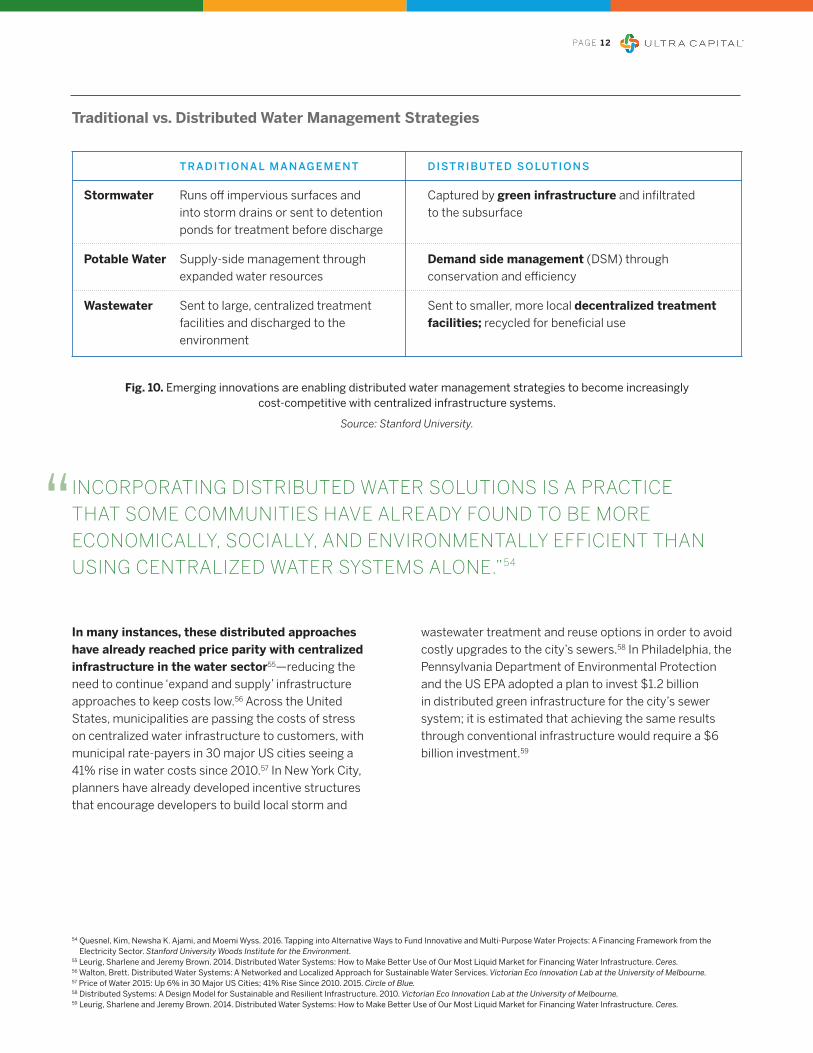
PAG E 1 2
In many instances, these distributed approaches have already reached price parity with centralized infrastructure in the water sector55—reducing the need to continue ‘expand and supply’ infrastructure approaches to keep costs low .56 Across the United States, municipalities are passing the costs of stress on centralized water infrastructure to customers, with municipal rate-payers in 30 major US cities seeing a 41% rise in water costs since 2010 .57 In New York City, planners have already developed incentive structures that encourage developers to build local storm and
wastewater treatment and reuse options in order to avoid costly upgrades to the city’s sewers .58 In Philadelphia, the Pennsylvania Department of Environmental Protection and the US EPA adopted a plan to invest $1 .2 billion in distributed green infrastructure for the city’s sewer system; it is estimated that achieving the same results through conventional infrastructure would require a $6 billion investment .59
54 Quesnel, Kim, Newsha K. Ajami, and Moemi Wyss. 2016. Tapping into Alternative Ways to Fund Innovative and Multi-Purpose Water Projects: A Financing Framework from the Electricity Sector. Stanford University Woods Institute for the Environment.
55 Leurig, Sharlene and Jeremy Brown. 2014. Distributed Water Systems: How to Make Better Use of Our Most Liquid Market for Financing Water Infrastructure. Ceres.56 Walton, Brett. Distributed Water Systems: A Networked and Localized Approach for Sustainable Water Services. Victorian Eco Innovation Lab at the University of Melbourne.57 Price of Water 2015: Up 6% in 30 Major US Cities; 41% Rise Since 2010. 2015. Circle of Blue.58 Distributed Systems: A Design Model for Sustainable and Resilient Infrastructure. 2010. Victorian Eco Innovation Lab at the University of Melbourne.59 Leurig, Sharlene and Jeremy Brown. 2014. Distributed Water Systems: How to Make Better Use of Our Most Liquid Market for Financing Water Infrastructure. Ceres.
Fig. 10. Emerging innovations are enabling distributed water management strategies to become increasingly cost-competitive with centralized infrastructure systems.
Source: Stanford University.
Traditional vs. Distributed Water Management Strategies
TRADITIONAL MANAGEMENT
Stormwater Runs off impervious surfaces and into storm drains or sent to detention ponds for treatment before discharge
Potable Water Supply-side management through expanded water resources
Wastewater Sent to large, centralized treatment facilities and discharged to the environment
DISTRIBUTED SOLUTIONS
Captured by green infrastructure and infiltrated to the subsurface
Demand side management (DSM) through conservation and efficiency
Sent to smaller, more local decentralized treatment facilities; recycled for beneficial use
INCORPORATING DISTRIBUTED WATER SOLUTIONS IS A PRACTICE THAT SOME COMMUNITIES HAVE ALREADY FOUND TO BE MORE ECONOMICALLY, SOCIALLY, AND ENVIRONMENTALLY EFFICIENT THAN USING CENTRALIZED WATER SYSTEMS ALONE.”54
‘‘

PAG E 1 3
WasteSustainability & Resilience Challenges
The collection, transport, treatment and disposal of waste streams (both residential and industrial)are among the most persistent, difficult, and costly challenges facing societies around the world today. Given current population and economic growth trends, this problem is poised to get worse. Global solid waste generation, already above 3 .5 million tonnes per day, is on pace to increase 70% by 2025 .60 The global cost of dealing with this waste is anticipated to rise from $205 billion per year in 2010 to $375 billion per year by 2025 .61 At current rates, waste volumes will triple by 2100 .62 In the United States, trash has become the leading national export and, on average, municipalities now spend more on waste management than on fire protection, parks and recreation, and libraries .63
As the problems and costs of waste disposal continue to grow, the price of developing new finite resources and producing new raw materials to meet growing demand is also increasing. For example, at current consumption rates, natural reserves of tin will be gone within forty years . Despite these very real scarcities, only 26% of tin is currently composed of recycled materials .64 Similar scarcity trends exist across inorganic material extraction and development (Figure 11) .
Comparable cost trends hold true for organic materials as well . In the United States, food waste is the single largest part of municipal solid waste streams . Over 97% of this food waste goes to landfills or incinerators, costing over $1 billion in disposal costs and foregoing any reuse value .65 Converting this waste stream into biogas, for example, could power more than three million US homes for one year—creating an estimated $33 billion market opportunity for converting the organic waste stream into energy .66
Technological Innovation & Price Parity
The concurrent trends of increasing disposal costs and increasing raw material costs are resulting in a sea change in the waste management sector; efficient reuse models are becoming more economical than traditional landfill solutions.67 These models are driven by new innovations enabling resource repurposing across the waste lifecycle, including but not limited to: anaerobic digestion of organic materials, waste derived fuel alternatives, and landfill gas recovery .
For example, energy savings alone from recycling aluminum (compared to producing it from raw materials) is now up to 95%; plastics 90%; and copper 85% .68 It is estimated that reducing organic food waste by 30% in developed markets could save up to 40 million hectares of cropland, and the worldwide market for recycling electronic waste is forecast to more than double between 2009 and 2020 .69
60 Bhada-Tata, Perinaz, Daniel A. Hoornweg. 2012. What a Waste: A Global Review of Solid Waste Management. World Bank.61 Bhada-Tata, Perinaz, Daniel A. Hoornweg. 2012. What a Waste: A Global Review of Solid Waste Management. World Bank.62 Global Waste on Pace to Triple by 2100. 2013. World Bank.63 Humes, Edward. 2012. Grappling with a Garbage Glut. Wall Street Journal.64 How Much is Left? The Limits of Earth’s Resources: A Graphical Accounting of the Limits to What One Planet Can Provide. 2010. Scientific American.65 Newman, Chris. 2010. US Environmental Protection Agency’s Food Waste Activities. US EPA Region 5.66 Biogas Opportunities Roadmap: Voluntary Actions to Reduce Methane Emissions and Increase Energy Independence. 2014. US Department of Agriculture, US Environmental
Protection Agency, and US Department of Energy.67 Cleaner Technologies: Evolving Towards a Sustainable End-State. 2012. Deutsche Bank.68 Sustainable Solid Waste Management and the Green Economy. 2013. International Solid Waste Association.69 Cleaner Technologies: Evolving Towards a Sustainable End-State. 2012. Deutsche Bank.

PAG E 14
Source: U.S. Census Bureau, International Database, July
2015 Update
Fig. 1. Global population is projected to grow by over 40% in
the next quarter-century.
Source: US Census Bureau
WORLD POPULATION:
1950 - 2050
3 BILLION4 BILLION
196
0
1970
198
0
199
0
20
00
20
10
20
20
20
30
20
40
20
50
10
9
8
7
6
5
4
3
2
1
0
5 BILLION6 BILLION
7 BILLION
8 BILLION
9 BILLION
UNITED KINGDOM
COUNTRYPOPULATION AT THE START OF THE GROWTH PERIOD (Million)YEARS TO DOUBLE PER CAPITA GDP1
YEAR
1700 1800 1900 2000
53
65
33
16
12
16 822
1,023
22
48
28
10
9154
UNITED STATES
GERMANY
JAPAN
SOUTH KOREA
INDIA
CHINA
CO
ST
TIME
PRICE PARITY
CENTRALIZED/EXTRACTIVE
MODEL
DISTRIBUTED/SUSTAINABLE
MODEL
fresh water used for soil-based farming 50-80% of which is lost to evaporation
70% GLOBAL
1500 MILES
70-95% LESS
LOCALon average, food travels 1500 to 2500 miles on its way to our plate
fresh water used for vertical farming utilizing the aquaponics or aeroponics method of farming
vertical farming reduces the need for long-distance transport diminishing the use of fossil fuel and ensuring quality
TRADITIONAL FARMING VERTICAL FARMING
$14,250
250 KG
120 KG
20 kWh
160 KM
275 KM
+72%
30 kWh
$5,250
-63%
-52%
+50%
5
2015
BATTERY COST (1000$) BATTERY WEIGHT (10s of KG) BATTERY RANGE (10s of KM)
BATTERY CAPACITY (kWh)
2015 2015 20152020E 2020E 2020E 2020E
10
15
20
25
30
35
40
• EFFICIENCY
• REUSE
• SOURCE OF DIVERSIFICATIONAA
SOURCE SOURCE SOURCE SOURCE
WASTE
TREATMENT USE
THE FUTURE: WATER CULTIVATION
USE
LOSSLOSS
LOSS
• INEFFICIENCY
• DISPOSABILITY
• HOMOGENOUS SUPPLYLL
SOURCE
WASTE
TREATMENT
LOSS
TODAY: WATER HUNTING
TIN
(cans, solder)
GOLD
( jewelry, dental)
PHOSPHORUS
(fertil izer, animal blades)
ALUMINUM
(transport, electric, consumer durables)
Today’s global consumption rate
Half the U.S. consumption rate
Reverse base
Annual global consumption
reverse base
(assuming global
consumption =
global production)
World population1/2 U.S. per capita
consumption in
2006
X
If the demand grows, some key resources will be exhausted more quicky if predicted technologies appear and the population grows
HOW MANY YEARS LEFT IF THE WORLD CONSUMES ATZINC
(galvanizing)
LEAD
(lead pipes, batteries)
SILVER
( jewelry, catalytic converters)
CHROMIUM
(chrome plating, paint)
INDIUM
(LCDs)
PLATINUM
( jewelry, catalysts, fuel cells)
ANTIMONY
(drugs)
URANIUM
(weapons, power stations)
NICKEL
(batteries, turbine blades)
TITANIUM
(cellphones, camera lenses)
COPPER
(wire, coins, plumbing)
48
9
13
42
29
1317
19
30
59
(t(t(t(tttttt(t(t((( rrrrrr
4
20
34
36
38
40
42
57
142
510
116
46
45
61
143
360
90
345
1027
40
6.58 BILLIONWORLD POPULATION IN APRIL 2007
301 MILLIONU.S. POPULATION IN APRIL 2007
POPULATION COMPARISON
PLATINUM
0%
PHOSPHORUS
0%
GALLIUM
0%
URANIUM
0%
INDIUM
0%
COPPER
31%
NICKEL
35%
SILVER
16%
TITANIUM
20%
LEAD
72%
GOLD
43%
ALUMINUM
49%
ZINC
26%
TIN
26%
GERMANIUM
35%
CHROMIUM
25%
HOW LONG WILL IT LAST
PROPORTION OF CONSUMPTION MET BY RECYCLED MATERIALS
RE
TU
RN
15%
14%
13%
12%
11%
10%
9%
8%
7%
6%
5%
BONDS
1% 2% 3% 4% 5% 6% 7% 8% 9% 10% 11% 12% 13% 14% 15% 16% 17% 18%
REAL ESTATE
AGRICULTURE
TIMBER
EQUITIES
PRIVATE EQUITY
CHART 2: INCREASES IN REAL ASSET ALLOCATIONS% OF RESPONDENTS INCREASING IN THE PAST THREE YEARS/NEXT 18 MONTHS
REAL ESTATE
(n=192)
INFRASTRUCTURE
(n=132)
COMMODITIES
(n=59)
% 0 10 20 30 40 50
Will increase over the next 18 months
Increased over the past three years
Source: Blackrock and The Economist Intelligence Unit, 31 October 2014.
7
6
5
4
3
2
1
0
40
30
20
10
0
600
500
400
300
200
100
0
0-50
0-25
0
0-25
0-50
400
350
300
250
18001800 18501850 19001900 19501950 20002000
4
3
2
1
0
POPULATION
TROPICAL FOREST LOSS
ENERGY USE WATER USE
TEMPERATURE CHANGECARBON DIOXIDE EMISSIONS
Wo
rld
po
pu
lati
on
(b
illio
ns)
Glo
bal tr
op
ical fo
rest
lo
ss
co
mp
are
d w
ith
170
0 b
ase
lin
e (
%)
Wo
rld
pri
mary
en
erg
y u
se(E
J)
Glo
bal w
ate
r u
se (
tho
usa
nd
km
2)
Me
an
glo
bal te
mp
era
ture
ch
an
ge
(oC
)
Atm
osp
he
ric c
on
ce
ntr
ati
on
of
CO
2 (
pp
m)
Fig. 11. At current and projected consumption rates, inorganic materials face impending scarcities that are driving the need for more efficient reuse models in waste management.
Source: Scientific American.
How Long Will It Last?
Proportion of Consumption Met by Recycled Materials (%)

PAG E 1 5
CREATING UNPRECEDENTED OPPORTUNITIES FOR INVESTORSHIGH IMPACTS = HIGH RETURNS
Given the increasingly compelling economics of distributed resource management models70, “rather than facing a crisis because of resource
scarcity, we confront an opportunity that will reframe the world’s economy and create opportunities for trillions of dollars in impacts.”71 For investors, this presents the chance to ‘do well by doing good’—generating high-returns from investments that positively impact sustainability across sectors .
Long-Term Stewardship of Increasingly High-Value ResourcesAt a time of rapid population growth, rising affluence, and environmental change, critical resources are increasingly high-value . Technological advances are enabling supply to meet increased demand through resilient, localized, and long-term resource utilization . Investors who overlook this
are “missing out on an enormous opportunity for value creation .”73 Global markets could realize $2.9 trillion in savings in 2030 from capturing enhanced resource productivity potential—and 70% of these productivity opportunities have an internal rate of return of more than 10% at current prices .74
Investors capitalizing on these opportunities also benefit from broader market trends, in which accounting for environmental, social, and governance (ESG) factors already yields higher returns in debt and equity markets . Global equity strategies that focus on the materiality of ESG factors have exceeded market benchmarks by an annualized 500 basis points over the past decade .75 This has become so widely understood that the US Department of Labor recently revised its Employee Retirement Income Savings Act (ERISA) guidance to explicitly say that considering ESG concerns is part of a pension plan’s fiduciary duty .76 In the United States, $1 of every $6 under professional management is now aligned with sustainable investing strategies (Fig . 12), and 65% of individual investors expect these strategies to become even more prevalent in the next five years .77
70 Environmental Finance and Innovation Forum Summit Report. 2014. Goldman Sachs.71 Heck, Stefan and Matt Rogers. 2014. Resource Revolution: How to Capture the Biggest Business Opportunity in a Century. New York: Melcher Media.72 Heck, Stefan and Matt Rogers. 2014. Resource Revolution: How to Capture the Biggest Business Opportunity in a Century. New York: Melcher Media.73 Jenkyn-Jones, Bryce. 2012. Resource Scarcity and the Efficiency Revolution. Impax Asset Management.74 Dobbs, Richard, Jeremy Oppenheim, Fraser Thompson, Marcel Brinkman, and Marc Zornes. Resource Revolution: Meeting the World’s Energy, Materials, Food, and Water Needs. November 2011. McKinsey & Company.75 Bailey, Jonathan, Bryce Klempner, and Josh Zoffer. June 2016. Sustaining Sustainability: What Institutional Investors Should Do Next on ESG. McKinsey & Company.76 Bailey, Jonathan, Bryce Klempner, and Josh Zoffer. June 2016. Sustaining Sustainability: What Institutional Investors Should Do Next on ESG. McKinsey & Company.77 Sustainable Signals: The Individual Investor Perspective. 2015. Morgan Stanley Institute for Sustainable Investing.
ADAM SMITH’S CLASSICAL WORK ON ECONOMICS, WEALTH OF
NATIONS (1776), DEFINED THREE MAJOR INPUTS FOR BUSINESS:
LABOR, CAPITAL, AND LAND. THE TWO INDUSTRIAL REVOLUTIONS
THE WORLD HAS SEEN THUS FAR FOCUSED PRIMARILY ON LABOR
AND CAPITAL… BUT NEITHER OF THE FIRST TWO REVOLUTIONS
FOCUSED ON SMITH’S THIRD INPUT: LAND AND NATURAL RESOURCES.
THAT IS PRECISELY WHAT WE SEE HAPPENING NOW, AND WE BELIEVE
THE BENEFITS WILL BE EVERY BIT AS GREAT AS THE BENEFITS
ACCOMPANYING THE FIRST TWO REVOLUTIONS.”72
‘‘

PAG E 16
In short, successful investors are realizing that there is more value in managing resources sustainably. Higher impact is translating into higher returns, as sustainability and resilience needs paired with technological capabilities accelerate the value of natural resources . As with the real estate sector, it is increasingly understood that investing in the long-term stewardship of real assets will generate better returns over time .
CAPITAL-READY PROJECTS
While many financial products allow for limited exposure to these opportunities in a more general sense, the most direct exposure to investing in sustainable resource utilization is emerging in project finance. By investing along the cycle of development, construction, and operation of the asset, investors can benefit from the cash flow and underlying appreciation of the resource . Such project opportunities are technologically and operationally proven and ready to be financed across core resource sectors .
Project ModelsOpportunities to invest in sustainable distributed systems are manifesting as high-value real asset projects across critical resource sectors. These distributed infrastructure projects typically have costs amounting to less than $100M (frequently in the $20M–$70M range), have long-term contracts for
raw material inputs (such as municipal solid waste, wastewater, biomass, etc .), include long-term off-take contracts for outputs (energy, water, fertilizer, nutrients, biochemical, etc .), and utilize innovative technology that has been commercially proven over the past five to ten years to convert the inputs to the output . Both inputs and outputs are typically derived from and utilized within a local radius, though most facilities can access national markets for contingency . Overall, these small- and mid-size distributed solutions not only provide greater resiliency and efficiency compared to incumbent centralized systems, but also increasingly yield strong financial returns for investors .
In the energy sector, the market for distributed energy storage in the United States grew 243% in 2015—and is projected to reach $2 .5 billion by 2020 .78 In general, the small- and mid-size project sector in North America is expected to grow more quickly than the entire infrastructure sector, which is forecasted to grow by 25% annually over the next decade .79
Experienced DevelopersMany project developers implementing distributed resource utilization models have deep experience with the innovative (and commercially proven) technologies they are utilizing . These developers also often hold unique competitive advantages in a localized project-scope,
Fig. 12. $1 out of every $6 under professional
management in the United States is now under
sustainable investment strategies.
Source: Morgan Stanley.
7
6
5
4
3
2
1
0
40
30
20
10
0
600
500
400
300
200
100
0
0-50
0-25
0
0-25
0-50
400
350
300
250
18001800 18501850 19001900 19501950 20002000
4
3
2
1
0
A. POPULATION
I. TROPICAL FOREST LOSS
D. ENERGY USE D. WATER USE
M. TEMPERATURE CHANGEL. CARBON DIOXIDE EMISSIONS
Wo
rld
pu
pilati
on
(b
illio
ns)
Glo
bal tr
op
ical fo
rest
lo
ss
co
mp
are
d w
ith
170
0 b
ase
lin
e (
%)
Wo
rld
pri
mary
en
erg
y u
se(E
J)
Glo
bal w
ate
r u
se (
tho
usa
nd
km
2)
Me
an
glo
bal te
mp
era
ture
ch
an
ge
(oC
)
Atm
osp
he
ric c
on
ce
ntr
ati
on
of
CO
2 (
pp
m)
Source: U.S. Census Bureau, International Database, July
2015 Update
Fig. 1. Global population is projected to grow by over 40% in
the next quarter-century.
Source: US Census Bureau
WORLD POPULATION:
1950 - 2050
3 BILLION
196
0
1970
198
0
199
0
20
00
20
10
20
20
20
30
2040
2050
10
9
8
7
6
5
4
3
2
1
0
5 BILLION6 BILLION
7 BILLION
8 BILLION
9 BILLION
UNITED KINGDOM
COUNTRYPOPULATION AT THE START OF THE GROWTH PERIOD (millions)YEARS TO DOUBLE PER CAPITA GDP1
YEAR
1700 1800 1900 2000
53
65
33
16
12
16 822
1,023
22
48
28
10
9154
UNITED STATES
GERMANY
JAPAN
SOUTH KOREA
INDIA
CHINA
CO
ST
TIME
PRICE PARITY
CENTRALIZED/EXTRACTIVE
MODEL
DISTRIBUTED/SUSTAINABLE
MODEL
fresh water used for soil-based farming 50-80% of which is lost to evaporation
70% GLOBAL
1500 MILES
70-95% LESS
LOCALon average, food travels 1500 to 2500 miles on its way to our plate
fresh water used for vertical farming utilizing the aquaponics or aeroponics method of farming
vertical farming reduces the need for long-distance transport diminishing the use of fossil fuel and ensuring quality
TRADITIONAL FARMING VERTICAL FARMING
$14,250
250 KG
120 KG
20 kWh
160 KM
275 KM
+72%
30 kWh
$5,250
-63%
-52%
+50%
5
2015
BATTERY COST (1000$) BATTERY WEIGHT (10s of KG) BATTERY RANGE (10s of KM)
BATTERY CAPACITY (kWh)
2015 2015 20152020E 2020E 2020E 2020E
10
15
20
25
30
35
40
• EFFICIENCY
• REUSE
• SOURCE OF DIVERSIFICATIONAA
SOURCE SOURCE SOURCE SOURCE
WASTE
TREATMENT USE
THE FUTURE: WATER CULTIVATION
USE
LOSSLOSS
LOSS
• INEFFICIENCY
• DISPOSABILITY
• HOMOGENOUS SUPPLYLL
SOURCE
WASTE
TREATMENT
LOSS
TODAY: WATER HUNTING
TIN
(cans, solder)
GOLD
( jewellery, dental)
PHOSPHORUS
(fertil izer, animal blades)
ALUMINUM
(transport, electric, comsumer durables)
Today’s global consumption rate
Half the U.S. consumption rate
Reverse base
Annual global consumption
reverse base
(assuming global
consumption =
global production)
World population1/
2 U.S. per capita
consumption in
2006
X
If the demand grows, some key resources will be exhausted more quicky if predicted technologies appear and the population grows
HOW MANY YEARS LEFT IF THE WORLD CONSUMES AT..ZINC
(galvanising)
LEAD
(lead pipes, batteries)
SILVER
( jewellery, catalytic converters)
CHROMIUM
(chrome plating, paint)
INDIUM
(LCDs)
PLATINUM
( jewellery, catalysts, fuel cells)
ANTIMONY
(drugs)
URANIUM
(weapons, power stations)
NICKEL
(batteries, turbine blades)
TITANIUM
(cellphones, camera lenses)
COPPER
(wire, coins, plumbing)
48
9
13
42
29
1317
19
30
59
(t(t(tttt(t(( rrrr
4
20
34
36
38
40
42
57
142
510
116
46
45
61
143
360
90
345
1027
40
6.58 BILLIONWORLD POPULATION IN
APRIL 2007
301 MILLIONU.S. POPULATION IN
APRIL 2007
POPULATION COMPARISON
PLATINUM
0%
PHOSPHORUS
0%
GALLIUM
0%
URANIUM
0%
INDIUM
0%
COPPER
31%
NICKEL
35%
SILVER
16%
TITANIUM
20%
LEAD
72%
GOLD
43%
ALUMINUM
49%
ZINC
26%
TIN
26%
GERMANIUM
35%
CHROMIUM
25%
HOW LONG WILL IT LAST
PROPORTION OF CONSUMPTION MET BY RECYCLED MATERIALS
RE
TU
RN
15%
14%
13%
12%
11%
10%
9%
8%
7%
6%
5%
BONDS
1% 2% 3% 4% 5% 6% 7% 8% 9% 10% 11% 12% 13% 14% 15% 16% 17% 18%
REAL ESTATE
AGRICULTURE
TIMBER
EQUITIES
PRIVATE EQUITY
CHART 2: INCREASES IN REAL ASSET ALLOCATIONS% OF RESPONDENTS INCREASING IN THE PAST THREE YEARS/NEXT 18 MONTHS
REAL ESTATE
(n=192)
INFRASTRUCTURE
(n=132)
COMMODOTIES
(n=59)
% 0 10 20 30 40 50
Will increase over the next 18 months
Increased over the past three years
Source: Blackrock and The Economist Intelligence Unit, 31 October 2014.
$1.40
$1.20
$1.00
$0.80
$0.60
$0.40
$0.20
$0
2014 2016 2018 2020 2022 2024 2026 2028 2030 2032 2034 2036 2038 2040 2042 2044 2046 2048 2050
NY
2026CA
2031
KY
2047
TX
2047
HI
PRE-2014
SOLAR-PLUS BATTERY LEVELIZED COST OF ELECTRICITY (LCOE) VS. UTILITY RETAIL PRICE PROJECTIONSCOMERCIAL - BASE CASE {Y-AXIS $/kWh}
Louisville, KY
Westchester, NY
San Antonio, TX
Los Angeles, CA
Honolulu, HI
LCOE Retail Price
100
80
60
40
20
0
Mainstream
Direct
Intermediated
Portland, OR
Blueberries
Sacramento, CA
Spring mix
Twin Cities, MN
Beef
DC area
Milk
ea
d te
Pe
rce
nt
of
reta
il p
rice
Syracuse, NY
Apples
$ T
rillio
ns
(US
D)
1995
Total volume of sustainable investments nearly doubled from 2012 to 2014
20031999 20071997 20052001 2010 2012 2014
$3.47 Trillion
$6.57 Trillion7
6
5
4
3
2
1
0
2
1950 1970 19951955 1975 2000 20151960 1980 2005 20201965 19901985 2010 2025
HISTORICAL FORECAST
CO2
GDP
$24,000
$20,000
$16,000
$12,000
$8,000
$4,000
$0
6,000
5,000
4,000
3,000
2,000
1,000
0
Total Volume of Sustainable Investments Nearly Doubled from 2012–2014
78 Munsell, Mike. 2016. US Energy Storage Market Grew 243% in 2015, Largest Year on Record. Green Tech Media.79 Small and Mid-Size Sustainable Real Asset Project Finance. May 1, 2016. Ultra Capital, LLC.
$ T
rilli
ons
(US
D)

PAG E 17
including strong customer relationships, familiarity with regional regulatory environments, and experience with sector-specific challenges .
Given the rapidly changing economic landscape of the sectors in which they operate, however, many project developers still lack “some of the resources, tools, and knowledge required to attract capital from institutions and other large-scale investors .”80 Building a bridge between institutional capital and experienced developers with increasingly high-value projects therefore represents an enormous market opportunity to finance tomorrow’s distributed, sustainable resource sectors .
EMERGING INVESTOR ACCESS
To date, conventional financial instruments have mostly failed to access these new types of projects . As the
landscape evolves and these new distributed resource management models take hold, financial instruments that allow investors to capitalize on such opportunities are emerging in real asset project finance.
Real AssetsReal assets are physical goods (such as commodities, infrastructure, or real estate) that are independent from variations in the value of money .81 This definition alone suggests some of the most beneficial characteristics of real assets for investors: their returns are often consistent, predictable, and largely uncorrelated with other asset classes.82 With value derived directly from their physical properties, real assets are generally low-risk and offer attractive risk-adjusted returns compared to alternative asset classes (Fig . 14) .83 84
Fig. 14. Real assets have favorable risk/return profiles.
Source: Aquila Capital; private equity source Preqin.
20-Year Risk-Return of Selected Real Asset Classes vs. Bonds and Equities
7
6
5
4
3
2
1
0
40
30
20
10
0
600
500
400
300
200
100
0
0-50
0-25
0
0-25
0-50
400
350
300
250
18001800 18501850 19001900 19501950 20002000
4
3
2
1
0
A. POPULATION
I. TROPICAL FOREST LOSS
D. ENERGY USE D. WATER USE
M. TEMPERATURE CHANGEL. CARBON DIOXIDE EMISSIONS
Wo
rld
pu
pilati
on
(b
illio
ns)
Glo
bal tr
op
ical fo
rest
lo
ss
co
mp
are
d w
ith
170
0 b
ase
lin
e (
%)
Wo
rld
pri
mary
en
erg
y u
se(E
J)
Glo
bal w
ate
r u
se (
tho
usa
nd
km
2)
Me
an
glo
bal te
mp
era
ture
ch
an
ge
(oC
)
Atm
osp
he
ric c
on
ce
ntr
ati
on
of
CO
2 (
pp
m)
Source: U.S. Census Bureau, International Database, July
2015 Update
Fig. 1. Global population is projected to grow by over 40% in
the next quarter-century.
Source: US Census Bureau
WORLD POPULATION:
1950 - 2050
3 BILLION
196
0
1970
198
0
199
0
20
00
20
10
20
20
20
30
2040
2050
10
9
8
7
6
5
4
3
2
1
0
5 BILLION6 BILLION
7 BILLION
8 BILLION
9 BILLION
UNITED KINGDOM
COUNTRYPOPULATION AT THE START OF THE GROWTH PERIOD (Million)YEARS TO DOUBLE PER CAPITA GDP1
YEAR
1700 1800 1900 2000
53
65
33
16
12
16 822
1,023
22
48
28
10
9154
UNITED STATES
GERMANY
JAPAN
SOUTH KOREA
INDIA
CHINA
CO
ST
TIME
PRICE PARITY
CENTRALIZED/EXTRACTIVE MODEL
DISTRIBUTED/REGENERATIVEMODELDISTRIBUTETR D//D REGENERATIVEG TE E
fresh water used for soil-based farming, 50–80% of which is lost to evaporation
70% GLOBAL
1500 MILES
70-95% LESS
LOCALon average, food travels 1500 to 2500 miles on its way to our plate
fresh water used for vertical farming utilizing the aquaponics or aeroponics method
vertical farming reduces the need for long-distance transport diminishing the use of fossil fuel and ensuring quality
TRADITIONAL FARMING VERTICAL FARMING
$14,250
250 KG
120 KG
20 kWh
160 KM
275 KM
+72%
30 kWh
$5,250
-63%
-52%
+50%
5
2015
BATTERY COST (1000$) BATTERY WEIGHT (10s of KG) BATTERY RANGE (10s of KM)
BATTERY CAPACITY (kWh)
2015 2015 20152020E 2020E 2020E 2020E
10
15
20
25
30
35
40
• EFFICIENCY
• REUSE• SOURCE OF DIVERSIFICATIONAA
SOURCE SOURCE SOURCE SOURCE
WASTE
TREATMENT USE
THE FUTURE: WATER CULTIVATION
USE
LOSS
LOSS
LOSS
LOSS
• INEFFICIENCY
• DISPOSABILITY
• HOMOGENOUS SUPPLYLL
SOURCE
WASTE
TREATMENT
TODAY: WATER HUNTING
TIN
(cans, solder)
GOLD
( jewellery, dental)
PHOSPHORUS
(fertil izer, animal blades)
ALUMINUM
(transport, electric, comsumer durables)
Today’s global consumption rate
Half the U.S. consumption rate
Reverse base
Annual global consumption
reverse base
(assuming global
consumption =
global production)
World population1/
2 U.S. per capita
consumption in
2006
X
If the demand grows, some key resources will be exhausted more quicky if predicted technologies appear and the population grows
HOW MANY YEARS LEFT IF THE WORLD CONSUMES AT..ZINC
(galvanising)
LEAD
(lead pipes, batteries)
SILVER
( jewellery, catalytic converters)
CHROMIUM
(chrome plating, paint)
INDIUM
(LCDs)
PLATINUM
( jewellery, catalysts, fuel cells)
ANTIMONY
(drugs)
URANIUM
(weapons, power stations)
NICKEL
(batteries, turbine blades)
TITANIUM
(cellphones, camera lenses)
COPPER
(wire, coins, plumbing)
48
9
13
42
29
1317
19
30
59
(t(t(tttt(t(( rrrr
4
20
34
36
38
40
42
57
142
510
116
46
45
61
143
360
90
345
1027
40
6.58 BILLIONWORLD POPULATION IN
APRIL 2007
301 MILLIONU.S. POPULATION IN
APRIL 2007
POPULATION COMPARISON
PLATINUM
0%
PHOSPHORUS
0%
GALLIUM
0%
URANIUM
0%
INDIUM
0%
COPPER
31%
NICKEL
35%
SILVER
16%
TITANIUM
20%
LEAD
72%
GOLD
43%
ALUMINUM
49%
ZINC
26%
TIN
26%
GERMANIUM
35%
CHROMIUM
25%
HOW LONG WILL IT LAST
PROPORTION OF CONSUMPTION MET BY RECYCLED MATERIALS
RE
TU
RN
15%
14%
13%
12%
11%
10%
9%
8%
7%
6%
5%
BONDS
1% 2% 3% 4% 5% 6% 7% 8% 9% 10% 11% 12% 13% 14% 15% 16% 17% 18%
REAL ESTATE
AGRICULTURE
TIMBER
EQUITIES
PRIVATE EQUITY
CHART 2: INCREASES IN REAL ASSET ALLOCATIONS% OF RESPONDENTS INCREASING IN THE PAST THREE YEARS/NEXT 18 MONTHS
REAL ESTATE
(n=192)
INFRASTRUCTURE
(n=132)
COMMODITIES
(n=59)
% 0 10 20 30 40 50
Will increase over the next 18 months
Increased over the past three years
Source: Blackrock and The Economist Intelligence Unit, 31 October 2014.
Volatility (standard deviation)
Ret
urn
80 Small and Mid-Size Sustainable Real Asset Project Finance. May 1, 2016. Ultra Capital, LLC.81 Real Assets: A Sought-After Investment Class in Times of Crisis. 2012. Deutsche Bank.82 Real Assets and Impact Investing: A Primer for Families. 2016. The Impact.83 Private Real Assets: Improving Portfolio Diversification with Uncorrelated Market Exposure. TIAA-CREF Asset Management.84 Real Assets: The New Mainstream. 2015. Aquila Capital.

PAG E 1 8
Investors have traditionally underweighted real assets in their portfolios because they have been difficult to access through standard investment offerings . Additionally, some real asset markets have only recently developed or are still taking shape .85 However, with long-term population growth and consumption trends helping drive unprecedented demand for natural resources, real asset investments are increasingly in-demand and favored .86 A growing number of institutional investors are now adding real assets to their
portfolios, and even more intend to do so within the next year (Fig . 15) .87
Newly structured real asset vehicles can provide investor access to rapidly growing natural resource sectors .88 89 The opportunity for investing in real assets at a project-level is emerging as the next frontier in sustainable investing.
Increases in Real Asset Allocations% of respondents increasing in past three years/next 18 months
7
6
5
4
3
2
1
0
40
30
20
10
0
600
500
400
300
200
100
0
0-50
0-25
0
0-25
0-50
400
350
300
250
18001800 18501850 19001900 19501950 20002000
4
3
2
1
0
A. POPULATION
I. TROPICAL FOREST LOSS
D. ENERGY USE D. WATER USE
M. TEMPERATURE CHANGEL. CARBON DIOXIDE EMISSIONS
Wo
rld
pu
pilati
on
(b
illio
ns)
Glo
bal tr
op
ical fo
rest
lo
ss
co
mp
are
d w
ith
170
0 b
ase
lin
e (
%)
Wo
rld
pri
mary
en
erg
y u
se(E
J)
Glo
bal w
ate
r u
se (
tho
usa
nd
km
2)
Me
an
glo
bal te
mp
era
ture
ch
an
ge
(oC
)
Atm
osp
he
ric c
on
ce
ntr
ati
on
of
CO
2 (
pp
m)
Source: U.S. Census Bureau, International Database, July
2015 Update
Fig. 1. Global population is projected to grow by over 40% in
the next quarter-century.
Source: US Census Bureau
WORLD POPULATION:
1950 - 2050
3 BILLION
196
0
1970
198
0
199
0
20
00
20
10
20
20
20
30
2040
2050
10
9
8
7
6
5
4
3
2
1
0
5 BILLION6 BILLION
7 BILLION
8 BILLION
9 BILLION
UNITED KINGDOM
COUNTRYPOPULATION AT THE START OF THE GROWTH PERIOD (Million)YEARS TO DOUBLE PER CAPITA GDP1
YEAR
1700 1800 1900 2000
53
65
33
16
12
16 822
1,023
22
48
28
10
9154
UNITED STATES
GERMANY
JAPAN
SOUTH KOREA
INDIA
CHINA
CO
ST
TIME
PRICE PARITY
CENTRALIZED/EXTRACTIVE MODEL
DISTRIBUTED/REGENERATIVEMODELDISTRIBUTETR D//D REGENERATIVEG TE E
fresh water used for soil-based farming, 50–80% of which is lost to evaporation
70% GLOBAL
1500 MILES
70-95% LESS
LOCALon average, food travels 1500 to 2500 miles on its way to our plate
fresh water used for vertical farming utilizing the aquaponics or aeroponics method
vertical farming reduces the need for long-distance transport diminishing the use of fossil fuel and ensuring quality
TRADITIONAL FARMING VERTICAL FARMING
$14,250
250 KG
120 KG
20 kWh
160 KM
275 KM
+72%
30 kWh
$5,250
-63%
-52%
+50%
5
2015
BATTERY COST (1000$) BATTERY WEIGHT (10s of KG) BATTERY RANGE (10s of KM)
BATTERY CAPACITY (kWh)
2015 2015 20152020E 2020E 2020E 2020E
10
15
20
25
30
35
40
• EFFICIENCY
• REUSE• SOURCE OF DIVERSIFICATIONAA
SOURCE SOURCE SOURCE SOURCE
WASTE
TREATMENT USE
THE FUTURE: WATER CULTIVATION
USE
LOSS
LOSS
LOSS
LOSS
• INEFFICIENCY
• DISPOSABILITY
• HOMOGENOUS SUPPLYLL
SOURCE
WASTE
TREATMENT
TODAY: WATER HUNTING
TIN
(cans, solder)
GOLD
( jewellery, dental)
PHOSPHORUS
(fertil izer, animal blades)
ALUMINUM
(transport, electric, comsumer durables)
Today’s global consumption rate
Half the U.S. consumption rate
Reverse base
Annual global consumption
reverse base
(assuming global
consumption =
global production)
World population1/
2 U.S. per capita
consumption in
2006
X
If the demand grows, some key resources will be exhausted more quicky if predicted technologies appear and the population grows
HOW MANY YEARS LEFT IF THE WORLD CONSUMES AT..ZINC
(galvanising)
LEAD
(lead pipes, batteries)
SILVER
( jewellery, catalytic converters)
CHROMIUM
(chrome plating, paint)
INDIUM
(LCDs)
PLATINUM
( jewellery, catalysts, fuel cells)
ANTIMONY
(drugs)
URANIUM
(weapons, power stations)
NICKEL
(batteries, turbine blades)
TITANIUM
(cellphones, camera lenses)
COPPER
(wire, coins, plumbing)
48
9
13
42
29
1317
19
30
59
(t(t(tttt(t(( rrrr
4
20
34
36
38
40
42
57
142
510
116
46
45
61
143
360
90
345
1027
40
6.58 BILLIONWORLD POPULATION IN
APRIL 2007
301 MILLIONU.S. POPULATION IN
APRIL 2007
POPULATION COMPARISON
PLATINUM
0%
PHOSPHORUS
0%
GALLIUM
0%
URANIUM
0%
INDIUM
0%
COPPER
31%
NICKEL
35%
SILVER
16%
TITANIUM
20%
LEAD
72%
GOLD
43%
ALUMINUM
49%
ZINC
26%
TIN
26%
GERMANIUM
35%
CHROMIUM
25%
HOW LONG WILL IT LAST
PROPORTION OF CONSUMPTION MET BY RECYCLED MATERIALS
RE
TU
RN
15%
14%
13%
12%
11%
10%
9%
8%
7%
6%
5%
BONDS
1% 2% 3% 4% 5% 6% 7% 8% 9% 10% 11% 12% 13% 14% 15% 16% 17% 18%
REAL ESTATE
AGRICULTURE
TIMBER
EQUITIES
PRIVATE EQUITY
CHART 2: INCREASES IN REAL ASSET ALLOCATIONS% OF RESPONDENTS INCREASING IN THE PAST THREE YEARS/NEXT 18 MONTHS
REAL ESTATE
(n=192)
INFRASTRUCTURE
(n=132)
COMMODITIES
(n=59)
% 0 10 20 30 40 50
Will increase over the next 18 months
Increased over the past three years
Source: Blackrock and The Economist Intelligence Unit, 31 October 2014.
Fig. 15. Institutional investors are increasingly adding real assets to their portfolios and intend to maintain that trend.
Source: Blackrock and The Economist Intelligence Unit.
Project Finance Project finance offers the opportunity to bring institutional capital to real assets in order to deploy distributed resource management models at scale. Well-structured real asset project finance investments are designed to mitigate or minimize intangible risks, which makes this an attractive proposition for investors . The inherent foundation of these projects is a defined set of inputs and outputs that can be contracted—and often guaranteed or insured—to deliver expected returns .
The same lack of up-to-date financial instruments that has limited investor access to these types of projects has also prevented project developers from deploying their projects in a scalable, systemic way . Thus, project finance tailored to the unique attributes of these distributed systems is also an attractive proposition for project developers whose growth has been stunted by lack of access to appropriate capital .
With respect to the agriculture, energy, water, and waste sectors, which desperately need increased investment in distributed infrastructure to meet pressing sustainability and resilience needs, the opportunity to meet the demand of both investors and developers provides the ideal scenario in which to truly have impact (Table 1) .
85 Real Assets: A Sought-After Investment Class in Times of Crisis. 2012. Deutsche Bank.86 Real Assets: A Sought-After Investment Class in Times of Crisis. 2012. Deutsche Bank.87 The Ascent of Real Assets: Gauging Growth and Goals in Institutional Portfolios. 2015. Blackrock and The Economist Intelligence Unit.88 The Ascent of Real Assets: Gauging Growth and Goals in Institutional Portfolios. 2015. Blackrock and The Economist Intelligence Unit. 89 Real Assets and Impact Investing: A Primer for Families. 2016. The Impact.

PAG E 19
Table 1. Real Asset Project Finance Examples
TECHNOLOGY MARKET PROJECT POTENTIAL TYPE DESCRIPTION PLATFORM SIZE SIZE RETURN
AG R I C U LT U R E
Indoor Agriculture Localized/modular farming Hydroponics, aquaponics, $5B+ $1M– 18+% and LED lighting $50M
AgTech / Internet of Operational and cost efficiencies in water Data, sensors, robotics, $10B+ $5M– 12%– Things Ag and nutrient delivery and harvesting autonomous vehicles $25M 18%
Sustainable Protein Feeding the growing middle class Aquaculture, Single Cell $10B+ $5M– 18+% with alternative protein sources Protein to replace fishmeal $25M
Waste-to-Value Profitable use of large-scale systemic Ag waste to marketable $10B+ $25M 18+% waste streams products, woody biomass to carbon products
E N E R GY
Distributed Storage Store energy for price arbitrage, Lithium and lead batteries $2B–$10B $100k– 12%– resiliency, and grid services by 2020 $30M 18%
Hydropower Hydroelectric generation plants, Generation and water $10B $500k– 10%– from low-head at existing dams to flow systems $50M 16% in-conduit in pipes
Solar Community and distributed Photovoltaic $30B $1M– 10%– solar projects $10M 18%
Energy Efficiency Implementing technology to use less Combined heat + power, $20B+ $1M– 10%– energy to provide the same service LED lights $100M 16%
WAT E R
Water Reuse (On-Site) On-site water reclamation and re-use Moving bed bioreactor $10B+ $5M– 11%– systems (MBBR) $15M 13%
Water Reuse Water treatment at the industrial Filtration, Biomimicry $5B+ $5M 10%– (Industrial/Municipal) or municipal scale 13%
Brackish Water Treating salt water from water bodies Modular desalination $5B+ $5M 11%– Treatment or after industrial use 14%
Industrial Water Treating industrial/fracking wastewater Modular water chemical $5B+ $5M 11%– Treatment treatment and discharge 14%
WA S T E
Waste-to-Energy Converting post-consumer organic, Anaerobic digestion, $15B+ $15M 12%– food production, and farm waste composting 15% to energy
Waste-to-Value Advanced material recycling Recycling or repurposing $20B+ $25M 18+% previously unusable waste
Waste-to-Handling Biomass collection for feedstock Hauling and diversion $1B–$5B $1M–$5M 18+%
Inorganic Materials Recycling inorganic materials into Process technologies in $20B $10M– 15%– Reuse new products material recycling facilities $50M 20%
Source: US Environmental Protection Agency, Department of Agriculture, Federal Energy Regulatory Commission

PAG E 20
CONCLUSIONS
With rapidly evolving sustainability and resilience needs and technological capabilities, critical resource sectors are facing an unprecedented
shift away from centralized infrastructure towards more distributed systems . The implications of this shift are enormous—not only for resource efficiency, productivity, and reuse, but also for investors .
As decentralized resource infrastructure reaches price parity with centralized models across agriculture, energy, water, and waste, opportunities emerge for investors to ‘do well by doing good’—helping finance and accelerate the transition to sustainable resource utilization while realizing exceptional risk-adjusted returns on such investments .
While traditional financial instruments have been slow to effectively identify and access these opportunities, new instruments in real assets and project finance are beginning to provide investors access . This is transformative for environmental sustainability and investors alike; the convergence of increasing resource values, technological innovation, and new financial instruments has created the unprecedented opportunity to invest at scale in sustainable resource management through distributed infrastructure .
ABOUT ULTRA CAPITAL
Ultra Capital constructs portfolios of small to mid-size sustainable real asset projects in agriculture, energy, water and waste . We provide
institutional investors with diversified portfolios of yield oriented real assets, and project developers with capital and project finance expertise . Ultra Capital has assembled an experienced team of investment professionals with a broad range of expertise in project development, finance, engineering, and capital markets to deliver consistently underwritten and risk managed project portfolios to investors .
www.ultracapital.com
CONTACT INFORMATION
San Francisco473 Jackson StreetSan Francisco, CA 94111USA+1 415–985–2200
Philadelphia840 First AvenueKing of Prussia, PA 19406 USA+1 215–278–9875
AmsterdamPrins Hendriklaan 511075 BA AmsterdamThe Netherlands+ 31–6–236–603–10
Disclosures
This paper is not intended to be relied upon as a forecast, research or investment advice, and is not a recommendation, offer or solicitation to buy or sell any securities or to adopt any investment strategy . The opinions expressed are as of September 2016 and may change as subsequent conditions vary . The information and opinions contained in this paper are derived from proprietary and nonproprietary sources deemed by Ultra Capital to be reliable, are not necessarily all-inclusive and are not guaranteed as to accuracy . Not all opinions contained herein may be attributable to Ultra Capital . As such, no warranty of accuracy or reliability is given and no responsibility arising in any other way for errors and omissions (including responsibility to any person by reason of negligence) is accepted by Ultra Capital, its officers, employees or agents . This paper may contain “forward-looking” information that is not purely historical in nature . Such information may include, among other things, projections and forecasts . There is no guarantee that any forecasts made will come to pass . Reliance upon information in this paper is at the sole discretion of the reader . The information provided here is neither tax nor legal advice .
Investing involves risk, including possible loss of principal amount invested. Many factors may affect infrastructure investments and real asset values, including both the general and local economies and the laws and regulations (including zoning, environmental and tax laws) affecting these types of investments.
©2016 Ultra Capital LLC . All rights reserved .
AcknowledgementsUltra Capital would like to give special thanks to Tara O’Shea for her efforts with the comprehensive research in this paper.
Recommended