1
The Economic Impact of the Oklahoma State University
Medical Center and Residency Program on the State and
Regional Economies
Prepared by:
Brian Whitacre
Associate Professor & Extension Economist
Oklahoma State University
Email: [email protected]
Lara Brooks
Extension Associate
Oklahoma State University
Email: [email protected]
Chad Landgraf
GIS Specialist
OSU Center for Rural Health
Email: [email protected]
Oklahoma Cooperative Extension Service
513 Ag Hall
Stillwater, OK 74078
Phone: 405-744-9825
Fax: 405-744-9835
February 2013
Report AE-13010

2
Table of Contents Executive Summary ...................................................................................................................................... 3
Introduction ................................................................................................................................................... 6
Research Methodology ................................................................................................................................. 6
Oklahoma State University Medical Center Background ............................................................................. 8
OSUMC Revenues .................................................................................................................................... 9
OSUMC Expenditures ............................................................................................................................ 10
Employment and Salaries Including Residency Program ....................................................................... 12
OSUMC Construction Expenditures ....................................................................................................... 13
Visitor Days and Spending ..................................................................................................................... 13
The Impact of the OSUMC on the Tulsa Metropolitan Area Economy in FY 2012 .................................. 14
The Multiplier Effect .............................................................................................................................. 15
The Economic Impact from Operational Activities Including Residency Program ............................... 15
Economic Impact from Construction Activities ..................................................................................... 17
Economic Impact from Visitor Spending ............................................................................................... 19
Summary of OSUMC Impacts ................................................................................................................ 21
The Economic Impact of OSUMC Residency Graduates ........................................................................... 23
Overview of OSUMC Residency Graduates .......................................................................................... 23
The Multiplier Effect .............................................................................................................................. 31
References ................................................................................................................................................... 34
Appendix A- Review of Literature Relative to Impact Studies .................................................................. 35
Appendix A References .......................................................................................................................... 37
Appendix B- Model and Data Used to Estimate Employment and Income Multipliers ............................. 38
Appendix B References .......................................................................................................................... 41
Appendix C - Total Economic Impact of OSUMC Residents by Congressional District (2004-2012) ..... 42
Appendix D - OSUMC Residency Completers, by Congressional District and Specialty (2004-2012) .... 43

3
Executive Summary
This study examines the economic contributions of the Oklahoma State University
Medical Center (OSUMC) in terms of both day-to-day operations and via the production of
osteopathic residents who complete their training at this facility. The economic impacts of the
Medical Center itself are mostly focused on the Tulsa metropolitan area of the state. These
impacts are summarized in three basic categories:
- Operations of OSUMC, including the residency program
- Construction activities associated with OSUMC
- OSUMC visitor spending
Each category generates jobs and income that have a multiplicative effect on the local
economy, as many businesses and residents in the area rely on spending from the medical center
and its employees. These multiplier effects are estimated via a widely-accepted methodology
known as input-output analysis. Using data from OSUMC on number of employees, payroll,
construction spending, and number of visitors to the center, multipliers specific to the Tulsa
metropolitan area create a defendable estimate of the total economic impact that the center has
on annual income and jobs. The findings are summarized for fiscal year 2012 below.
Employment Income Retail Sales Tax Collections
Sector Total Impact Total Impact State Sales Tax
(4.5%) County Sales Tax (0.85%)
City Sales Tax (3.167%)
OSUMC Operations 2,350 $121,369,814 $1,228,869 $232,120 $648,638
Construction 17 $695,376 $7,041 $1,330 $3,716
Visitor Spending 8 $207,757 $2,104 $397 $1,110
Total 2,375 $122,272,947 $1,238,014 $233,847 $653,465
Overall, OSUMC contributes 2,375 jobs and over $120M in income to the Tulsa area
economy. Further, a portion of that income is spent on retail sales in the area, which in turn
generate tax revenue that is paid back to state and local governments. For fiscal year 2012, over
$1.2M in state sales tax collections can be attributed to OSUMC, and over $200K and $600K for
county and city sales tax collections, respectively.

4
OSUMC also houses the largest osteopathic residency program in the United States,
where medical students who have finished their Doctor of Osteopathic Medicine (D.O.) degrees
can complete their training before taking jobs in a private practice or hospital. Physicians who
have completed their residencies at OSUMC are free to locate anywhere to find a job, but the
majority (68% since 2004) have opted to stay in Oklahoma. These physicians create jobs and
income where they choose to locate, particularly if they set up a private practice that employs
nurses, medical technicians, or receptionists. This report uses data on the locations of 201
OSUMC residency completers since 2004 that are practicing in Oklahoma to assess the
economic contributions of the physicians the program has produced. Research relating to the
number of jobs created per primary care physician and the percentage of doctors operating their
own private practice is used to generate the direct impact of OSUMC resident graduates.
Multiplier effects are then included to account for secondary impacts of the jobs and income that
the physicians help to create. The total economic impact of OSUMC resident graduates by
Congressional District is summarized below (and in map version on the following page):
Congressional District
1 2 3 4 5 Total
Number of OSUMC Residency Grads 134 28 15 11 13 201
Total Employment Generated 1,763 353 252 144 145 2,656
Total Income Generated $95,081,507 $16,653,263 $10,149,104 $6,732,348 $8,213,161 $136,829,384
Each of the 5 Congressional Districts has benefitted from at least 11 D.O.s who
completed their residency at OSUMC. These physicians have created many jobs and a
significant amount of income in each district, totaling over 2,650 jobs and $135M across the
state. Thus, the economic influence of OSUMC is not simply limited to the Tulsa area, but is
found in communities ranging from Grove to Buffalo to Ardmore. When combined with the
impact of the medical center itself, the economic contributions of OSUMC and its residency
program are quite impressive.

5

6
Introduction
The Oklahoma State University Medical Center (OSUMC) has a substantial health,
education, and economic impact on the surrounding area and across the state. Outside of
providing patient care, the OSUMC houses the largest osteopathic residency program in the
United States. A substantial share of those residents earned their Doctor of Osteopathic
Medicine (D.O.) degrees from the OSU Center for Health Sciences located in Tulsa. The option
to fully complete an osteopathic program (including residency) within the state of Oklahoma
could influence new physicians to practice within the state upon completion of their residency.
These physicians have a considerable economic impact on their respective regions and the state.
The objective of this study is to estimate the impact that the OSUMC has on the
economy. More specifically, the report will:
Present financial data reflecting hospital expenditures and revenue
Present OSUMC employment and payroll data
Measure the economic impacts that OSUMC operation, including the residency
program, construction activities, and visitor spending, have on the Tulsa
metropolitan statistical area through increased: employment, wages, salaries, and
benefits, and retail sales
Measure the economic impact that OSUMC residency graduates have on their
respective Oklahoma congressional districts after completing their residency
program
Research Methodology
This report will be presented in two main sections. The first will quantify the impacts on
jobs and income (wages, salaries, and benefits) created on an annual basis by the OSUMC, its
employees, residents, and visitors. The second section will examine the impacts that previous
OSUMC residents have on the local economies where they choose to practice after completing
their residency program.
A review of previous literature relative to impact (also known as input-output) analysis is
located in Appendix A. Data for this study are from Fiscal Year (FY) 2012. The impacts of the

7
Medical Center itself are primarily focused on the Tulsa metropolitan area economy, but also
spill over to the surrounding counties. Much of the revenue is used to hire clinical and
administrative staff and provide residency wages. Most of the income provided directly through
these jobs is spent and re-spent within the local economy, creating additional jobs and income.
As a result, the total number of jobs and the total income attributable to the OSUMC are larger
than the direct number of jobs and income that are reported by the medical center itself.
Revenue not used to hire employees is used to procure goods and services. The impacted
businesses (many of which are located within the Tulsa metropolitan area) use this revenue to
then hire employees, pay salaries, and purchase materials. This additional economic activity is
called the multiplier effect. The economic impacts of the OSUMC will be examined in three
parts:
Operations of the OSUMC, including the residency program
Construction activities
OSUMC visitor spending
To calculate the economic impacts described above, a widely-accepted input-output
model and data known as IMPLAN were used.1 IMPLAN allows for estimation of the direct,
secondary, and total impacts of the OSUMC on the primary impact region including the Tulsa
metropolitan area. The economic impact in this report will be quantified as total employment
including direct, secondary and total jobs and the associated wages, salaries, and benefits.
Detailed information on the model used in this report can be found in Appendix B.
To assess the economic impact of physicians who completed their residency programs at
OSUMC, a list of all residency completers since 2004 was meshed with American Medical
Association Masterfile data to determine the location of physician practices and their associated
specialties. This data suggests that OSUMC keeps an impressive 68% of its residents in the state
of Oklahoma after they have completed their program and begun working as physicians. Studies
on the economic contributions of physicians find that those who work in private practice
generate more local jobs and income than do those who work in hospital settings. Recent data is
used to generate assumptions about the percentage of residency graduates in various specialties
1 IMPLAN stands for Impact Analysis for Planning, and is a software program commonly used for estimating
economic impacts. An overview of the IMPLAN model is found in Appendix B.

8
who go on to careers in these different settings. The total economic contribution of these
residency completers is then estimated using a similar IMPLAN-type methodology, and results
are broken out by congressional district.
The following section provides some background information on OSUMC, including
revenues and expenditures for FY 2012. It also discusses the employment and payroll numbers
for 2012, and details other categories that have an economic contribution to the local Tulsa area
such as construction work and visitor spending.
Oklahoma State University Medical Center Background
The OSU Medical Center is located in Tulsa, Oklahoma. Tulsa is the second largest
metropolitan statistical area (MSA) in Oklahoma. The MSA includes the surrounding counties
of Osage, Pawnee, Creek, Rogers, Wagoner, and Okmulgee. OSUMC attracts a large share of
patients from within Tulsa County and the surrounding communities. Figure 1 displays the
Tulsa MSA, which for the purpose of this study will be used as the medical service area.
Figure 1. OSUMC Medical Service Area

9
OSUMC Revenues
OSUMC’s operations are funded largely from revenues derived from hospital patient
revenue (86.8%). Total revenue sources by major funding source are shown in Table 1. Total
FY 2012 revenue equaled over $126 million. Figure 2 graphically displays the shares of revenue
sources. Medical education and resident support is the second largest component (5.6 %)
followed by private gifts (2.9%).
Table 1. OSUMC Revenue Sources, FY 2012
Revenue Source Revenue Amount Percent
Hospital Patient Revenue $109,484,997 86.8%
Medical Education/Resident Support $7,091,825 5.6%
Private gifts $3,684,950 2.9%
Auxiliary Enterprises $3,141,562 2.5%
Investment Income $73,779 0.1%
Other Sources $2,666,758 2.1%
Total $126,143,871 100.0% Source: OSUMC

10
Hospital Patient Revenue, 86.8%
Medical Education/Resident
Support, 5.6%
Private gifts, 2.9%
Auxiliary Enterprises, 2.5%
Investment Income, 0.1% Other Sources, 2.1%
Figure 2. OSUMC Revenue Sources, FY 2012
OSUMC Expenditures
OSUMC expenditures are presented in Table 2. Employee expenses including wages,
salaries, and benefits comprise the largest share of expenditures with 68.9% of the total. Medical
supplies and printing are the next largest category with 18% of total outlays. OSUMC
expenditures totaled over $129 million in FY 2012. Figure 3 graphically displays expenditures
by major category.

11
Table 2. OSUMC Expenditures, FY 2012
Funding Use Expenditure Amount Percent
Employee Expenses $89,156,617 68.9%
Supplies and Printing $23,278,753 18.0%
Insurance $2,791,098 2.2%
Maintenance $2,645,055 2.0%
Equipment $2,327,362 1.8%
Utilities $1,899,629 1.5%
Leases & Rentals $1,148,087 0.9%
Interest on Debt $1,042,625 0.8%
Advertising $205,867 0.2%
Travel $96,101 0.1%
Taxes $96,964 0.1%
Other $4,778,615 3.7%
Total $129,466,773 100.0% Source: OSUMC
Employee Expenses, 68.9%
Supplies and Printing, 18.0%
Insurance, 2.2% Maintenance, 2.0% Equipment, 1.8%
Utilities, 1.5%
Other, 5.7%
Figure 3. OSUMC Expenditures, FY 2012

12
Employment and Salaries Including Residency Program
Total employment and descriptions are presented in Table 3. OSUMC employs 1,101
full time employees with 181 part time and 32 contract employees. These groups are further
divided into employment types. Professional employees include physicians and administration.
This category had 439 full time employees with 105 part time and 19 contracted employees.
Staff is defined as health care support positions, including those performing clerical work. In FY
2012, there were 500 full-time staff members with 76 part-time and 13 contracted. Residents are
medical students completing their residency program through OSUMC. In FY 2012, there were
162 residents at the OSUMC.
Table 3. OSUMC Employment Data, FY 2012
Employment Full-Time Part-Time Contract Labor
Professional 439 105 19
Staff 500 76 13
Residents 162 0 0
Total 1,101 181 32 Source: OSUMC
Table 4 displays the payroll details for each employment category described in Table 3.
Payroll is defined as the sum of all wages, salaries, and benefits paid out to employees. Total
payroll equaled $73,557,463 in FY 2012, with payments to professional staff accounting for the
largest share.
Table 4. OSUMC Payroll Data, FY 2012
Employment Wages, Salaries, Benefits
Professional
$38,582,110
Staff
$25,208,553
Residents
$9,766,800
Total $73,557,463 Source: OSUMC

13
OSUMC Construction Expenditures
Construction is another important economic activity that is attributable to OSUMC.
While most projects take a limited amount of time, economic impacts still occur from hiring
within the community or hiring labor outside of the community that purchases goods and
services such as food and services from within the community. Rather than outlining
construction projects, total construction costs will be examined to determine fiscal year impacts
instead of individual project impacts.
Table 5 presents the total FY construction expenditures. Construction totals range from
just over $1 million in 2012 to $9.8 million projected in 2013. Note that the 2013 total includes
work on the parking garage associated with OSUMC that will employ a significant amount of
local construction workers.
Table 5. OSUMC Construction Expenditures, FY2011-2013
Fiscal Year Construction Amount
FY 2011
$3,475,658
FY 2012
$1,151,502
FY 2013 (Estimated) $9,800,000
Total $14,427,160 Source: OSUMC
Visitor Days and Spending
OSUMC’s residency program attracts a large number of visitors each year for various
events and activities. With the presence of the residents, the likelihood of family and student
visitors increases dramatically. OSUMC also attracts visitors for alumni and college activities.
In addition, several visitors are brought to the medical center by administrators and faculty to
attend conferences and other meetings associated with the activities of the center.
Each time a non-local visitor comes to the medical center, they spend money at local
restaurants, and often buy gas before they leave. Some visitors stay overnight which also
generates revenue for the local lodging businesses. These are all local expenditures that occur
due to the location of the medical center and the residency program.

14
Table 6 presents the annual number of visitors by type along with their estimated daily
spending. It is estimated that OSUMC attracts 3,025 visitors annually with estimated
expenditures of $325,675 that is spent locally.
Table 6. OSUMC Visitors and Spending
Visitor Category Visitors Daily
Spending2 Total Expenditures
Student Visitors/Parent Activities 1,000 $169 $169,000
Alumni Activities 75 $123 $9,225
College Activities 750 $123 $92,250
Faculty and Staff Visitors 1,200 $46 $55,200
Total 3,025 $325,675 Source: OSUMC; U.S. General Services Administration
The Impact of the OSUMC on the Tulsa Metropolitan Area Economy in FY
2012
This section of the report focuses on the economic impact in terms of employment and
income as derived from wages, salaries, and benefits resulting from the presence of OSUMC in
the greater Tulsa metropolitan area.
These activities are divided into the following categories:
OSUMC Operations (Employment and Income)
Construction
Visitor Spending
The direct economic benefits of the OSUMC are substantial (as noted in Tables 3 – 6),
but do not show the complete impact. Secondary economic impacts are created when OSUMC
employees, residents, visitors, construction firms and their employees purchase goods and
services. These secondary benefits are measured by economic multipliers.
2 Visitor expenditures were estimated using U.S. General Services Administration’s lodging and meals and
incidental expense rates for Oklahoma. Faculty and staff visitors are assumed no overnight stays with only daily
meal and incidental expenses. Alumni and college activity visitors are assumed overnight stays with one day of
meal and incidental expenses, and student visitors/parent activities are assumed overnight stays with two days of
meal and incidental expenses

15
The Multiplier Effect
To further illustrate the multiplier effect, consider the opening of a new hospital. The
hospital purchases goods and services from other businesses and the dollars flowing to those
businesses increase. Likewise, the hospital will hire employees who in turn purchase goods and
services locally. The purchases of the hospital, its employees and residents will create additional
jobs and wages and salaries throughout the local economy.
A multiplier from an input-output model such as IMPLAN can measure the effect created
by an increase or decrease in economic activity. For example, an employment multiplier of 1.75
indicates that if one job is created by the medical center, then an additional 0.75 job is created in
other businesses due to the medical center, employee, and resident spending. The model
calculates employment (in terms of jobs) and income (in terms of dollars) multipliers. The
multipliers are county-specific due to differences in locally-available goods and services across
counties. The multipliers can be aggregated to multi-county level when economic activity spills
across county borders, as is the case with the Tulsa metropolitan area.
The Economic Impact from Operational Activities Including Residency Program
The economic impact from activities related to operations and the residency program is
presented in Table 7. Direct employment (full and part time and contract labor) and income
(payroll including wages, salaries, and benefits) from operational activities and the residency
program were estimated in the previous section in Tables 3 and 4. These activities are
continuous, thus occurring every year. Total estimated employment was 1,224 employees in FY
2012. This total includes full-time employees (1,101), part-time employees (181), and
contracted employees (32). It is assumed that 2 part-time employees account for 1 full-time
equivalent. The hospital sector employment multiplier for the Tulsa metropolitan statistical area
is 1.92. This means that for every job/resident another 0.92 job is created in other businesses in
the metropolitan area. The secondary employment generated in the Tulsa metropolitan area is
estimated at 1,126 jobs. This generates a total employment impact of 2,350 jobs in the Tulsa
metro area for FY 2012.
Data on the income from employees and residents are also presented in Table 7. Data
provided by OSUMC indicate that total income was $73,557,463 for all employees and residents.
This total includes all wages, salaries, and benefits paid out to employees and residents at

16
OSUMC. The hospital sector multiplier for the Tulsa metro area is 1.65. It is applied in the
same manner as the employment multiplier in the sense that for every $1 paid to employees and
residents at the OSUMC, another $0.65 is generated throughout the Tulsa metro area economy
through the purchasing of goods and services. Therefore, the total income impact from the
OSUMC is $121,369,813.95.
Income also impacts retail sales. A concept known as the retail sales capture ratio can be
used to estimate the impact of operational activities on local retail sales. This ratio indicates the
percent of personal income spent on items that generate a sales tax within the Tulsa metro area.
Data from the Oklahoma Tax Commission, Oklahoma Resources Integration General
Information Network System (ORIGINS), and the Bureau of Economic Analysis indicate that
22.5% of the income in the Tulsa metro area is spent at establishments that collect sales tax
within the Tulsa metro area. Given that the total income impact of the OSUMC is $121.3M, the
retail sales capture ratio suggests that $27.3M of that is spent on retail sales locally. The state
collects tax on that money (4.5%), which implies that the economic activity generated by
OSUMC is providing over $1.2M to the state’s budget each year. Similarly, Tulsa county
obtains a share of the money spent on retail sales (0.85%), suggesting that OSUMC contributes
of $200K to the county budget each year. Note that the City of Tulsa accounts for nearly 75% of
retail expenditures that occur within the metro area. The Tulsa city sales tax impact numbers in
Table 7 reflect that assumption. The contribution of OSUMC to the state and local government
revenues should not go unnoticed.

17
Table 7. Employment, Income and Retail Sales Impact of the OSUMC, FY 2012
Category Amount
Employment Impact OSU Medical Center Employment
1,224
Hospital Sector Employment Multiplier 1.92 Secondary Employment Impact
1,126
Total Employment Impact
2,350
Income Impact OSU Medical Center Income
$73,557,463
Hospital Sector Income Multiplier 1.65 Secondary Income Impact
$47,812,350
Total Income Impact
$121,369,813
Retail Sales and Sales Tax Impact Retail Sales
$27,308,208
State Sales Tax (4.5%)
$1,228,869
Tulsa County Sales Tax (0.85%)
$232,119
Tulsa City Sales Tax (3.167%)
$648,638
Source: OSUMC; 2011 IMPLAN Data, Minnesota Implan Group Inc.; Oklahoma Tax Commission;
Oklahoma Resources Integration General Information Network System (ORIGINS); Bureau of Economic
Analysis
Economic Impact from Construction Activities
OSUMC spends a significant amount on construction, and that amount is projected to
significantly increase in FY 2013. This impact is often overlooked. It must be noted that these
impacts only occur during the year of construction, and they are not continuous. In FY 2011,
OSUMC spent $3,475,658 on construction projects throughout the year. In FY 2012, $1,151,502
in construction occurred through OSUMC. The projected construction costs for FY 2013 are
$9.8 million (Table 8). From IMPLAN, the Tulsa metro area ratios for employment and wages
generated per million dollars of construction were used to estimate employment and income for
each fiscal year. In FY 2011, the capital investment was estimated to create 28.1 full time jobs
with approximately $1,206,265 in wages, salaries and benefits. The projected construction
expenditures in FY 2013 are estimated to yield 79.3 full time jobs with approximately

18
$3,401,198.41 in wages. Dollars invested in construction activities will also have an additional
impact on the local economy.
Table 8. OSUMC Construction Impact
Fiscal Year Construction Amount Employment Wages, Salaries and Benefits
FY 2011 $3,475,658 28.1 $1,206,265
FY 2012 $1,151,502 9.3 $399,641
FY 2013 (Estimated) $9,800,000 79.3 $3,401,198
Source: OSUMC; 2011 IMPLAN Data, Minnesota Implan Group Inc.
Table 9 presents the employment impacts of construction. The construction employment
multiplier of 1.78 indicates that 0.78 jobs will be created in other businesses in the Tulsa metro
area due to construction activities. Those jobs in other businesses are referred to as secondary
jobs. The estimated secondary employment impact for FY 2011 was an additional 21.9 jobs.
The FY 2012 secondary impact yielded 7.3 jobs, and the projected FY 2013 secondary impact
will yield 61.9 jobs from construction activities.
Table 9. OSUMC Construction Impact- Employment Impact
Fiscal Year Direct
Employment
Construction Employment Multiplier
Secondary Employment Impact
Total Employment Impact
FY 2011 28.1 1.78 21.9 50.08
FY 2012 9.3 1.78 7.3 16.59
FY 2013 (Estimated) 79.3 1.78 61.9 141.21
Source: 2011 IMPLAN Data, Minnesota Implan Group Inc.
The impact on income from construction activities is included in Table 10. The
construction impact multiplier is 1.74. Therefore, every $1 of wages and salaries paid to
construction employees generates another $0.74 in income for other businesses in the Tulsa
metro area. The estimated secondary income for FY 2012 is $295,735 while the projected

19
secondary income for FY 2013 is $2,156,887. This yields a total income impact of $695,376 in
FY 2012 and a projected total income impact of $5,918,085 in FY 2013.
Table 10. OSUMC Construction Impact- Income Impact
Fiscal Year Direct Income
Construction Income Multiplier
Secondary Income Impact
Total Income Impact
FY 2011 $1,206,266 1.74 $892,637 $2,098,902
FY 2012 $399,642 1.74 $295,735 $695,376
FY 2013 (Estimated) $3,401,198 1.74 $2,516,887 $5,918,085
Source: 2011 IMPLAN Data, Minnesota Implan Group Inc.
The retail sales impact from construction activity income is presented in Table 11. The
same retail expenditures ratio of 22.5% is applied in this section. It is estimated that $7,041 is
generated in state sales tax collections (4.5%) from retail expenditures from FY 2012
construction activity. FY 2013’s construction impact on state sales tax collections is expected to
generate $59,921.
Table 11. Income and Retail Sales Impact of OSUMC from Construction Spending
Fiscal Year Total Income
Impact Retail Sales State Sales
Tax Tulsa County
Sales Tax
City of Tulsa Sales
Tax
FY 2011 $2,098,902 $472,253 $21,251 $4,014 $11,217
FY 2012 $695,376 $156,460 $7,041 $1,330 $3,716
FY 2013 (Estimated) $5,918,085 $1,331,569 $59,921 $11,318 $31,628 Source: OSUMC; 2011 IMPLAN Data, Minnesota Implan Group Inc.; Oklahoma Tax Commission;
Oklahoma Resources Integration General Information Network System (ORIGINS); Bureau of Economic
Analysis
Economic Impact from Visitor Spending
As noted previously, OSUMC’s residency program attracts many visitors. These visitors
spend dollars that contribute to the local economy. Data in Table 6 estimate that 3,025 visitors
spend $325,675 in FY 2012. These data were converted to jobs and income based on ratios of

20
expenditures to jobs and income from IMPLAN. The impact of visitor spending is presented in
Table 12.
Table 12. Employment Income and Retail Sales Impact of OSUMC from Visitor
Spending
Category Amount
Employment Impact Jobs from Visitor Spending
6
Retail Trade and Services Employment Multiplier 1.40 Secondary Employment Impact
2
Total Employment Impact 8
Income Impact Income from Visitor Spending
$125,913
Retail Trade and Services Income Multiplier 1.65 Secondary Income Impact
$81,843
Total Income Impact
$207,757
Retail Sales and Sales Tax Impact Retail Sales
$46,745
State Sales Tax (4.5%)
$2,104
Tulsa County Sales Tax (0.85%)
$397
Tulsa City Sales Tax (3.167%) $1,110
Source: OSUMC; 2011 IMPLAN Data, Minnesota Implan Group Inc.; Oklahoma Tax Commission;
Oklahoma Resources Integration General Information Network System (ORIGINS); Bureau of Economic
Analysis
Full and part time jobs created in businesses due to OSUMC visitor spending were
estimated at 6. The employment multiplier of 1.40 estimated that 2 secondary jobs were created.
The total impact on employment was 8 jobs generated from visitor spending from OSUMC.
Income generated from visitor spending was estimated at $125,913. The estimated
secondary impact was $81,844 using the retail trade and services sector income multiplier of
1.65. This yielded a total income impact from visitor spending of $207,757. By applying the
retail expenditure ratio of 22.5% as discussed earlier, this income resulted in $46,745 in retail
sales and $2,104 in state sales tax collections.

21
Summary of OSUMC Impacts
Table 13 summarizes OSUMC’s total impact as it relates to jobs, income, retail sales and
sales tax collections for FY 2012. The total direct job contribution of OSUMC for FY 2012 was
1,239 jobs. When including the secondary impacts, the total employment impact rises to 2,375.
The direct income activities were estimated at over $74 million, and over $122 million in total
income impact for the Tulsa metro area was generated by the OSUMC’s activity. These dollars
resulted in over $27 million in retail sales and $1.2 million in state sales tax collections for the
year.

22
Table 13. Economic Impact of OSUMC on the Tulsa Metropolitan Area and the State of Oklahoma, FY 2012
Employment Income Retail Sales
Sector Direct Employment
Multiplier Total
Impact Direct Income
Multiplier Total Impact Retail Sales State Sales Tax
(4.5%)
County Sales Tax (0.85%)
City Sales Tax
(3.167%)
OSUMC Operations 1,224 1.92 2,350 $73,557,463 1.65 $121,369,814 $27,308,208 $1,228,869 $232,120 $648,638
Construction 9 1.78 17 $399,642 1.74 $695,376 $156,460 $7,041 $1,330 $3,716
Visitor
Spending 6 1.40 8 $125,913 1.65 $207,757 $46,745 $2,104 $397 $1,110
Total 1,239 2,375 $74,083,018 $122,272,947 $27,511,413 $1,238,014 $233,847 $653,465
Source: OSUMC; 2011 IMPLAN Data, Minnesota Implan Group Inc.; Oklahoma Tax Commission; Oklahoma Resources Integration General Information Network System (ORIGINS); Bureau of Economic Analysis

23
The Economic Impact of OSUMC Residency Graduates
The previous section of this report detailed the economic impact that OSUMC has on the
Tulsa Metropolitan Statistical Area. The number of jobs and amount of income generated by
OSUMC is quite impressive (Table 13); however, these impacts are generally confined to a
relatively small geographic area of the state. On the other hand, OSUMC residents who
complete their residencies are free to travel to any part of the state (or country) to begin work.
Many choose to operate their own primary care practice, while others become hospitalists or join
an existing practice in their specialty. OSUMC has an impressive track record of keeping
individuals who have completed their residencies in state: since 2004, 201 of 294 graduates
(68%) have remained in Oklahoma.3 Therefore, the residency program at OSUMC has an
economic impact on a much larger area than simply the Tulsa MSA. The OSUMC residency
program contributes to a large number of local economies across the state by providing doctors
who work and create jobs (and income) in those communities.
Overview of OSUMC Residency Graduates
Historical class sizes for residents at OSUMC are shown in Figure 4 below. The total
number of residents has increased steadily since the early 2000s, rising to over 160 for the 2012-
13 year. For the past 4-5 years, the average class size has been around 50 residents.4 This
represents 50 potential doctors that are eligible to start their own practices or join an existing
practice every year, and historical estimates suggest that 34 of them will stay in Oklahoma.
3 A list of all OSUMC residency completers since 2004 was meshed with licensure data from the American Medical
Association Masterfile to determine which completers were actively practicing in Oklahoma. 4 The OSUMC residency program is a 3-year program. 3 classes of around 50 residents equals the 140 – 160 total
residents displayed in Figure 4.

24
Figure 4. OSUMC Resident Class Size by Year (2001 – 2013)
Source: OSUMC
Figure 5 demonstrates the location of OSUMC residency graduates between 2004 and
2012 as they have begun their careers across Oklahoma. As might be expected, many graduates
choose to stay close to their residency location, with a high percentage of graduates staying in
the Tulsa MSA. However, Figure 5 also indicates that OSUMC residency graduates are located
all across Oklahoma – and not just in metropolitan areas. More detailed maps of each of the
Congressional Districts can be found in Appendix D.
0
20
40
60
80
100
120
140
160
180
Tota
l Nu
mb
er o
f R
esi
de
nts

25
Figure 5. OSUMC Resident Graduates (2004-2012) by Practice Location and U.S. Congressional District – All Specialties

26
Table 14 breaks out the 201 resident graduates since 2004 that have stayed in Oklahoma
by Congressional District. While a high percentage (66%) of graduates that stay in Oklahoma
continue to live and work in District 1 (which houses Tulsa), each of the other 4 congressional
districts contains at least 11 D.O.s who completed their residencies at OSUMC.
Table 14. OSUMC Resident Graduates (2004 – 2012): Location by Congressional District
and Specialty
Congressional District
Specialty 1 2 3 4 5 Total
Primary Care
Family Medicine 28 11 9 3 1 52
OBGYN 3 0 2 3 1 9
Pediatrics 13 4 0 1 0 18
Internal Medicine 25 2 2 0 4 33
TOTAL Primary Care 69 17 13 7 6 112
Other
General Surgery 7 2 2 1 0 12
Diagnostic Radiology 9 1 0 0 0 10
Anesthesiology 7 5 0 0 3 15
Emergency Medicine 22 2 0 1 0 25
Ophthalmology 5 0 0 1 1 7
Other 15 1 0 1 3 20
TOTAL Other 65 11 2 4 7 89
TOTAL For District 134 28 15 11 13 201 Source: OSUMC
Table 14 further breaks out the OSUMC residency graduates by specialty. This is of
particular interest for this study because residents with specialties that focus on primary care are
much more likely to start their own practices (as opposed to being employed by a hospital).
These specialties include family medicine, OBGYN, pediatrics, and internal medicine. Other
specialties, such as general surgery, diagnostic radiology, or anesthesiology, are more likely to
be employed at the hospital level. Assumptions about where graduates choose to work will have
an impact on the number of jobs and associated income that they create in their communities.
Several studies have attempted to assess the economic impact of a physician who
operates their own primary care practice. Data from an American Medical Association (2003)
survey suggested that a typical family medical practice physician has three full-time employees,

27
putting the total employment impact of the practice at four jobs. Eilrich et al. (2007) quantified
the wages and salaries associated with these jobs using U.S. Bureau of Labor Statistics data,
coming up with a total of $337,396 in 2012 dollars.5 However, the impact of a physician goes
beyond simply the jobs and income provided at their practice, since the physician is often
responsible for sending patients to the local hospital. This physician support is vital for
maintaining sufficient hospital utilization rates. The Eilrich study carefully documented a
physicians’ impact on the local hospital, citing data which indicates that a typical family
medicine physician generates 134.4 hospital discharges per year. This data was combined with a
recent estimate of net hospital revenue per discharge to come up with the total hospital revenue
that can be attributed to a primary care physician. This revenue is typically used to support
hospital employment and payroll, and data from several Oklahoma hospitals were used to
determine the percentage of all revenues that were spent on wages and salaries. When all of
these factors were applied, the typical primary care physician contributed 12.6 jobs at the local
hospital for a total of $478,018 in income (Eilrich et al, 2007). Overall, then, each primary care
physician that operates their own practice generates 16.6 jobs that provide $848,780 worth of
income to the local area. A summary of these contributions is listed in Table 15 below.
Table 15. Employment and Wages Generated by a Practicing Primary Care Physician
Clinic Employment
4
Wages, Salaries, and Benefits
$337,396
Hospital Employment
12.6
Wages, Salaries, and Benefits
$478,018
Total Employment
16.6
Wages, Salaries, and Benefits $848,780 Source: Eilrich et al., 2007
5 The Eilrich et al. study focuses on rural physicians and uses Oklahoma-specific data for the typical jobs included at
the physician’s practice, which include nurse, medical technician, and receptionist. This study generated their estimates in 2005 dollars; they were converted to 2012 dollars using the Consumer Price Index from the Bureau of Labor Statistics.

28
Not all primary care residency graduates will go on to start their own practices. Some
will join existing private practices, which will not generate as many additional jobs or income,
since the other employees at that practice will be shared among the multiple doctors. In this
case, the economic impact would be limited to the jobs supported at the local hospital through
referrals. The methodology for estimating this impact was laid out above, and resulted in 12.6
jobs and $478,018 in income per doctor. This may be a conservative estimate since bringing
additional doctors into a private practice may require the creation of additional supporting jobs
(nurse, receptionist), but these are not included in our analysis.
Recently, some primary care physicians have begun taking jobs as “hospitalists,” which
means they are employed by a hospital and do not operate their own clinic. Their activities
include patient care, teaching, and research related to hospital care. Survey data (MGMA, 2012)
suggest that the vast majority of hospitalists (90%) specialize in internal medicine, although
some specialize in pediatrics or family practice. Employment as a hospitalist is a growing trend,
and Finarelli (2009) estimates that 12% of primary care physicians worked as hospitalists in
2010. This was an increase from about 7% in 2005. From an economic impact perspective,
however, doctors employed as hospitalists do not create additional jobs in a community as do
physicians employed in private practice. Generally speaking, since they are not hiring workers or
generating hospital visits, a hospitalists’ economic contribution is limited to their own job and
income. In reality, the presence of a hospitalist at a particular location may generate additional
revenue that allows the hospital to increase employment in other areas. However, the hospitalist
is not directly responsible for inpatient or outpatient visits, and deriving an estimate of a
hospitalist’s contribution to revenue apart from other hospital employees is not tractable at best.
For specialties other than primary care (such as general surgery, radiology, or emergency
medicine), employment at a hospital is much more commonplace. Determining the economic
impact of these physicians is again challenging, since they are not directly employing any
workers. At a minimum, however, these physicians can be counted for the contribution that their
own jobs and income make to the local economy. Table 16 provides these estimates by noting
the average wage for physicians in specialties likely to be employed by a hospital, including
hospitalists (Merritt Hawkins, 2012). It is interesting to note that physician salaries for the South
Central region (which includes Oklahoma) are right around the national average (Medscape,

29
2012). Additionally, rural – urban differences in physician salaries are minimal. Median
physician incomes varied by less than $5,000 between rural and urban areas in a recent study
(Reschovsky and Staiti, 2005). Thus, the salaries displayed in Table 16 are a useful
approximation for wages earned by Oklahoma D.O.s.
Table 16. Employment and Wages Generated by a Physician Working for a Hospital
Specialty Jobs Supported Annual Salary
Primary Care
Hospitalist 1 $221,000
Other
General Surgery 1 $350,000
Diagnostic Radiology 1 $335,000
Anesthesiology 1 $334,000
Emergency Medicine 1 $264,000
Ophthalmology 1 $248,000
Other 1 $285,000 Source: Merritt Hawkins, 2012
As noted above, assumptions regarding whether a physician sets up his or her own
practice, or is employed by a hospital, will influence the number of jobs and income that can be
attributed to that physician. Several datasets were used to estimate the percentage of primary
care physicians who work in different type of practices. In particular, data from the 2008 Health
Tracking Physician Survey (ICPSR, 2009) provides over 4,000 observations on physician
specialties and practice type. According to this data, when the analysis is limited to primary care
physicians, approximately 35% work in solo or 2-person practices. Over 50% work for group
practices of 3 or more, and about 12% work for a hospital or medical school. This 12% meshes
well with Finarelli’s (2009) estimate that approximately 12% of primary care physicians will
work as hospitalists. Thus, 35% of OSUMC residency completers who specialized in primary
care are assumed to start their own practice, and create the 16.6 jobs and $848,780 in income
documented in Table 15. 53% of those completers are assumed to join an existing practice, and
help generate 12.6 jobs and $478,016 associated only with the hospital portion of Table 15.
Finally, 12% of OSUMC residency completers will work as hospitalists, contributing only their
own job and salary to the local economy.

30
Each of the non-primary care specialty resident graduates (general surgery, diagnostic
radiology, anesthesiology, emergency medicine, and ophthalmology) is also assumed to work
directly for a hospital. The economic contributions of these physicians are limited to their own
job and salary (Table 16).
Table 17 summarizes the impacts by congressional district by applying these assumptions
to the doctors working in each specialty. Note that for those physicians operating their own
practice, the employment and income impacts are broken into categories for clinic and hospital
(based on the assumptions demonstrated in Table 15) since these groupings will be important
when assessing their linkages to the overall economy. These multiplier effects are reviewed in
the next section.
Table 17. Direct Economic Impacts of OSUMC Residency Completers (2004-2012) by
Congressional District
Congressional District
1 2 3 4 5 TOTAL
EMPLOYMENT Primary Care
Own Practice (35%)
Clinic 96.6 23.8 18.2 9.8 8.4 156.8
Hospital 304.3 75.0 57.3 30.9 26.5 493.9
Join Practice (53%) 460.8 113.5 86.8 46.7 40.1 747.9
Hospitalist (12%) 8.3 2.0 1.6 0.8 0.7 13.4
Other
Hospital-Employed 65.0 11.0 2.0 4.0 7.0 89.0
TOTAL Employment 935.0 225.3 165.9 92.3 82.6 1,501.1
INCOME Primary Care
Own Practice (35%)
Clinic $8,148,113 $2,007,506 $1,535,152 $826,620 $708,532 $13,225,923
Hospital $11,544,135 $2,844,207 $2,174,982 $1,171,144 $1,003,838 $18,738,306
Join Practice (53%) $17,481,118 $4,306,942 $3,293,544 $1,773,447 $1,520,097 $28,375,148
Hospitalist (12%) $1,829,880 $450,840 $344,760 $185,640 $159,120 $2,970,240
Other
Hospital-Employed $19,126,000 $3,518,000 $700,000 $1,147,000 $2,105,000 $26,596,000
TOTAL Income $58,129,246 $13,127,495 $8,048,438 $5,103,851 $5,496,587 $89,905,617

31
Overall, the direct economic impact of these OSUMC residency completers is striking. A
total of 1,500 jobs and nearly $90M in income is generated due to their activity across the state.
While some congressional districts have much larger impacts than others (which is expected
given the distribution of residents), each district can claim at least 80 jobs and $5.5M in income
that are directly attributable to the OSUMC residency program graduates. Further, this data only
represents physicians who have completed the residency program since 2004. OSUMC has a
long history of providing outstanding training to residents, and many of those earlier graduates
are undoubtedly still practicing in Oklahoma – but are not included in this data.
The Multiplier Effect
The previous chapter discussed the multiplier effect that takes place when the direct jobs
and wages generated by OSUMC benefit the community by creating additional jobs and income
in the local economy. For example, purchases made by the hospital from local stores benefit
those local businesses who sell their products, and spending by households who are employed by
the hospital helps a wide variety of local industries such as housing, grocery stores, and retail.
Similarly, the jobs and wages created by residency graduates who are now out working in
various parts of the state have multiplier effects on the economies in which they operate. The
physician’s office will purchase supplies such as equipment, paper, or office furniture, at least
some of which is available locally. The nurse employed by the doctor spends some of her money
at local restaurants, which increases their revenue.6 These multiplier impacts vary by county,
since some counties have more locally available goods and services than others. For the
purposes of this report, multiplier effects are aggregated to congressional districts so that the
impact of the residency program on each district can be observed.
Employment and income multipliers for two distinct sectors are used to assess the total
economic impact of the OSUMC residency completers who have begun working across
Oklahoma. As the tables above have suggested, physicians can work in two distinct setups: a
private practice, or a hospital. The multipliers for employment and income generated from a
physician’s private practice will be different from those associated with a hospital, simply
6 These non-direct economic impacts are known as indirect (in the case of business-to-business activity) and
induced (in the case of household spending activity) effects.

32
because the local purchases and spending patterns of the two entities will be different. Thus,
physicians who choose to work in private practice will have a different multiplicative effect on
the economy than those who choose to work in hospitals. IMPLAN calculates these industry-
specific multipliers at the county level. They are aggregated to congressional district for the
purposes of this report.
Table 18 summarizes the income and employment impacts of the OSUMC residency
graduates across Oklahoma. Appendix C contains more detailed information (including specific
employment and income multipliers) for each of the 5 congressional districts across the state.
Table 18. Total Economic Impact of OSUMC Residency Graduates, 2004 - 12 (Summary)
All Congressional Districts
TOTAL
Direct Multiplier Total
EMPLOYMENT Primary Care
Clinic-based 156.8 1.84 288.4
Hospital-based 1255.3 1.76 2207.3
Other
Hospital-based 89.0 1.80 160.3
TOTAL Employment 1,501.1
2,656.0
INCOME Primary Care
Clinic-based $13,225,923 1.41 $18,617,872
Hospital-based $50,083,694 1.53 $76,412,129
Other
Hospital-based $26,596,000 1.57 $41,799,383
TOTAL Income $89,905,617 $136,829,384
In general, the employment multipliers are quite high for both clinic and hospital-based
operations. On average, each job at a primary care physician’s office generates an additional
0.84 jobs around the local economy. Similarly, each job at the hospital generates an additional
0.77 jobs locally. Note that while the hospital-based multipliers are the same for primary care or
other employment in each congressional district (Appendix C), the aggregate multipliers
displayed in Table 18 may be different due to the weight each category received across different

33
districts. The aggregate income multipliers can be interpreted in a comparable manner: for each
$1 in income created in a primary care physician’s office, an additional $0.41 in income is
generated throughout the local economy.
The total multiplicative effects of both employment and income by the OSUMC
residency program are sizable (Table 18). While the residency program has a substantial impact
on the number of direct jobs (1,501) and income ($90M), these jobs and income drive even more
growth in economies across the state. On whole, OSUMC residency graduates are shown to
contribute over 2,600 jobs and over $135M in income in Oklahoma once indirect and induced
effects are included.
It is worth noting that even the congressional district that benefits the least from the
OSUMC residency program (District 4) still receives substantial economic contributions. More
than 140 jobs and over $6.7M in total economic impact can be attributed to the OSUMC
residency completers in this district. In the most active district (District 1), the total economic
contribution rises to over 1,760 jobs and over $95M. Again, these numbers are only
representative of OSUMC residency completers since 2004, and many other doctors from the
program are undoubtedly still practicing. In today’s economic environment where businesses
contributing 5-6 jobs to the local economy are celebrated, the OSUMC residency program
represents an important component for each of the regional economies across the state.

34
References
American Medical Association. 2003. “Physician Socioeconomic Statistics, 2003 Edition.”
Center for Health Policy Research.
Eilrich, Fred; Doeksen, Gerald; and St. Clair, Cheryl. 2007. “The Economic Impact of a Rural
Primary Care Physician and the Potential Health Dollars Lost to Out-migrating Health
Services.” National Center for Rural Health Works.
Finarellit, Hugo. 2009. “The Hospital Executive Guide’s to Physician Staffing.” Health
Leaders Media. Available at
http://www.healthleadersmedia.com/supplemental/6693_browse.pdf
ICPSR (Inter-University Consortium for Policital and Social Research). 2009. “Health Tracking
Physician Survey, 2008”. Available at
http://www.icpsr.umich.edu/icpsrweb/HMCA/studies/27202
Medical Group Management Association and the Society of Hospital Medicine. 2012. “2012
State of Hospital Medicine Report.” Available at
http://www.hospitalmedicine.org/AM/Template.cfm?Section=Practice_Resources&Template
=/CM/HTMLDisplay.cfm&ContentID=29857
Medscape. 2012. “Physician Compensation Report 2012.” Available at:
http://www.medscape.com/features/slideshow/compensation/2012/public
Merritt Hawkins. 2012. “2012 Compilation of Physician Compensation Surveys.” Available at
http://www.merritthawkins.com/compensation-surveys.aspx
Reschovsky, James and Staiti, Andrea. 2005. “Physician Incomes in Rural and Urban
America.” Center for Studying Health System Change, Issue Brief No. 92

35
Appendix A- Review of Literature Relative to Impact Studies
For many years, researchers have been interested in quantifying the benefits, beyond the
provision of degrees, of universities and colleges. One of the first detailed guides to measure the
economic benefits of a college or university to the local community was requested by the
American Council on Education (ACE) in 1968 (Caffrey and Isaacs, 1971). Based on some
previous impact studies, Caffrey and Isaacs (1971) identified four primary groups that generated
economic activity through spending. These four categories were: 1. the college, 2. faculty and
staff, 3. students, and 4. visitors to the college. They developed several models and sub-models
to estimate the spending. These models have provided the foundation for numerous economic
impact studies since and are still being adopted today. For example, the Association of American
Medical Colleges has been measuring the economic impact of their member institutions on the
individual states in which they were located for a number of years. The results are based on
adaptations of the ACE models with the latest study completed in 2006 (Umbach, 2006).
Since the development of the ACE models, technology has simplified the process for
deriving multipliers. The original ACE model depends upon numerous surveys to faculty, staff,
students, local businesses and community residents and relies heavily upon proportional
spending calculations to estimate indirect economic impact. It is a difficult model to implement
and is less applicable to some colleges such as community colleges (Head, 1997). The proportion
of money spent locally can be difficult to estimate. More recently, computer models have been
created utilizing input-output analysis that not only make estimating the multiplier effect more
reasonable, but allow different multipliers to be created for local, regional or state impacts
(Appendix B). Two frequently used computer models are the Regional Input-Output Modeling
System (RIMS II) published by the U.S. Bureau of Economic Analysis and MicroIMPLAN
developed by the United States Forest Service. These computer models have been used to
estimate the impact of universities, medical schools, hospital construction and physician clinics,
just to name a few (Packham, Price and Harris, 2007; Eilrich, Doeksen and St. Clair, 2007;
Doeksen et al., 2005; Wong and Bedroussian, 2006; Fox and Fuji Noe, 2003; Center for
Business Research, L. William Seidman Research Institute, W.P. Carey School of Business
Arizona State University, 2003; Gilmer, Hodgin and Schiflett, 2001; Charney and Pavlakovich,

36
1999). For example, a detailed study estimating the impacts of the University of Nevada School
of Medicine (UNSOM) on the Nevada economy was complete using the IMPLAN model
(Packham, Price and Harris, 2007). The study includes estimates of the employment and payroll
impacts of UNSOM medical education, patient care activities and construction in 2006.In 2001,
the National Association of State Universities and Land-Grant Universities surveyed its members
for their most recent economic impact reports. They published a summary analysis based on data
from 96 member institutions and 10 member university systems (National Association of State
Universities and Land Grant Colleges, 2001).

37
Appendix A References
Caffrey, J. and Isaacs, H., "Estimating the Impact of a College or University on the Local
Economy," American Council on Education, 1971.
"The Contribution of Arizona State University to the Arizona Economy: FY 2002," Center for
Business Research, L. William Seidman Research Institute, W.P. Carey School of Business,
April 2003
Charney, A. and Pavlakovich, V., "The University of Arizona: An Investment in Arizona's and
Pima County's Future: Economic & Revenue Impact Analysis, 1997-98," Eller College of
Business and Public Administration, University of Arizona, Sept. 1999.
Doeksen, G, et al., "The Economic Impact of the New Hospital on the Economy of Drumright,
Creek County Oklahoma," Oklahoma Cooperative Extension Service, Oklahoma State
University, Jan. 2005.
Eilrich, F., Doeksen, G. and St .Clair, C., "The Economic Impact of a Rural Primary Care
Physician and the Potential Health Dollars Lost to Out-migrating Health Services," National
Center for Rural Health Works, Oklahoma State University, Jan. 2007.
Fox, A. and Fuji Noe, G., "Morehouse School of Medicine Economic Impact Study," Office of
Planning and Institutional Research, Morehouse School of Medicine, Feb. 2003.
Gilmer, R., Hodgin, R., and Schiflett, M., "Economic Impact of Texas Medical Center on
Southeast Texas," Houston Business: A Perspective on the Houston Economy, Federal Reserve
Bank of Dallas, Houston Branch, Oct. 2001.
Head, R., "The Economic Impact of Piedmont Virginia Community College upon its Service
Region (1996-1997)", Office of Institutional Research, Piedmont Virginia Community College,
Charlottesville, Virginia, Research Report No. 2-98, Nov. 1997.
National Association of State Universities and Land Grant Colleges, "Shaping the Future: The
Economic Impact of Public Universities," National Association
Packham, J., Price, S. and Harris, T., "The Impact of the University of Nevada School of
Medicine on the Nevada Economy," University Center for Economic Development, University
of Nevada Reno, Nevada Cooperative Extension Service, Technical Report UCED 2006/07-16,
Apr. 2007.
Umbach, T., "The Economic Impact of AAMC-Member Medical Schools and Teaching
Hospitals 2005," Association of American Medical Colleges, Washington D.C., 2006.
Wong, P. and Bedroussian, A., "Economic Benefits of Proposed University of Central Florida
College of Medicine," Milken Institute, Mar. 2006.

38
Appendix B- Model and Data Used to Estimate Employment and Income
Multipliers
A computer spreadsheet that uses state IMPLAN multipliers was developed to enable
community development specialists to easily measure the secondary benefits of the health sector
on a state, regional or county economy. The complete methodology, which includes an aggregate
version, a disaggregate version, and a dynamic version, is presented in Measuring the Economic
Importance of the Health Sector on a Local Economy: A Brief Literature Review and Procedures
to Measure Local Impacts (Doeksen, et al., 1997). A brief review of input-output analysis and
IMPLAN are presented here.
A Review of Input-Output Analysis
Input-output (I/O) (Miernyk, 1965) was designed to analyze the transactions among the
industries in an economy. These models are largely based on the work of Wassily Leontief
(1936). Detailed I/O analysis captures the indirect and induced interrelated circular behavior of
the economy. For example, an increase in the demand for health services requires more
equipment, more labor, and more supplies, which, in turn, requires more labor to produce the
supplies, etc. By simultaneously accounting for structural interaction between sectors and
industries, I/O analysis gives expression to the general economic equilibrium system. The
analysis utilizes assumptions based on linear and fixed coefficients and limited substitutions
among inputs and outputs. The analysis also assumes that average and marginal I/O coefficients
are equal.
Nonetheless, the framework has been widely accepted and used. I/O analysis is useful
when carefully executed and interpreted in defining the structure of a region, the
interdependencies among industries, and forecasting economic outcomes.
The I/O model coefficients describe the structural interdependence of an economy. From
the coefficients, various predictive devices can be computed, which can be useful in analyzing
economic changes in a state, a region or a county. Multipliers indicate the relationship between
some observed change in the economy and the total change in economic activity created
throughout the economy.

39
MicroIMPLAN
MicroIMPLAN is a computer program developed by the United States Forest Service
(Alward, et al., 1989) to construct I/O accounts and models. Typically, the complexity of I/O
modeling has hindered practitioners from constructing models specific to a community
requesting an analysis. Too often, inappropriate U.S. multipliers have been used to estimate local
economic impacts. In contrast, IMPLAN can construct a model for any state, region, county, or
zip code area in the United States by using available state, county, and zip code level data.
Impact analysis can be performed once a regional I/O model is constructed.
Five different sets of multipliers are estimated by IMPLAN, corresponding to five
measures of regional economic activity. These are: total industry output, personal income, total
income, value added, and employment. The total impact of a change in the economy consists of
direct, indirect, and induced impacts. Direct impacts are the changes in the activities of the
impacting industry such as the addition of another physician and corresponding medical staff to
the medical service area. The increased purchases of inputs by the new physician clinic as a
result of the direct impact are the indirect impact on the business sectors.
Two types of multipliers are generated. Type I multipliers measure the impact in terms of
direct and indirect effects. However, the total impact of a change in the economy consists of
direct, indirect, and induced changes. Both the direct and indirect impacts change the flow of
dollars to the state, region, or county’s households. Subsequently, the households alter their
consumption accordingly. The effect of the changes in household consumption on businesses in a
community is referred to as an induced effect. To measure the total impact, a Type II multiplier
is used. The Type II multiplier compares direct, indirect, and induced effects with the direct
effects generated by a change in final demand (the sum of direct, indirect, and induced divided
by direct). IMPLAN also estimates a modified Type II multiplier, called a Type SAM multiplier,
which also includes the direct, indirect, and induced effects. The Type SAM multiplier further
modifies the induced effect to include spending patterns of households based on a breakdown of
households by nine different income groups.
Minnesota IMPLAN Group, Inc. (MIG)
Dr. Wilbur Maki at the University of Minnesota utilized the I/O model and database work
from the U. S. Forest Service’s Land Management Planning Unit in Fort Collins to further

40
develop the methodology and to expand the data sources. Scott Lindall and Doug Olson joined
the University of Minnesota in 1984 and worked with Maki and the model.
As an outgrowth of their work with the University of Minnesota, Lindall and Olson
entered into a technology transfer agreement with the University of Minnesota that allowed them
to form MIG. At first, MIG focused on database development and provided data that could be
used in the Forest Service version of the software. In 1995, MIG took on the task of writing a
new version of the IMPLAN software from scratch. This new version extended the previous
Forest Service version by creating an entirely new modeling system that included creating Social
Accounting Matrices (SAMs) – an extension of input-output accounts, and resulting SAM
multipliers. Version 2 of the new IMPLAN software became available in May of 1999. For more
information about Minnesota IMPLAN Group, Inc., please contact Scott Lindall or Doug Olson
by phone at 651-439-4421 or by email at [email protected] or review their website at
www.implan.com.

41
Appendix B References
Miernyk, W.H. "The Element of Input-Output Analysis," New York, NY, Random House, 1965.
Doeksen, G.A., Johnson, T. and Willoughby, C., "Measuring the Economic Importance of the
Health Sector on a Local Economy: A Brief Literature Review and Procedures to Measure
Local Impacts, Southern Rural Development Center," SRDC Pub. No. 202, 1997.
Minnesota IMPLAN Group, Inc., "User's Guide, Analysis Guide, Data Guide," IMPLAN
Professional Version 2.0 Social Accounting and Impact Analysis Software, 2nd Ed., Jun 2000.

42
Appendix C - Total Economic Impact of OSUMC Residents by Congressional District (2004-2012)
Congressional District
1 2 3 4 5
Direct Multiplier Total Direct Multiplier Total Direct Multiplier Total Direct Multiplier Total Direct Multiplier Total
EMPLOYMENT
Primary Care
Clinic-based 96.6 2.03 195.8 23.8 1.48 35.2 18.2 1.47 26.7 9.8 1.56 15.3 8.4 1.83 15.4
Hospital-based 773.4 1.87 1,445.4 190.5 1.58 300.2 145.7 1.52 221.9 78.5 1.56 122.3 67.2 1.75 117.5
Other
Hospital-based 65.0 1.87 121.5 11.0 1.58 17.3 2.0 1.52 3.0 4.0 1.56 6.2 7.0 1.75 12.2
TOTAL Employment 935.0 1,762.6 225.3 352.7 165.9 251.7 92.3 143.8 82.6 145.2
INCOME
Primary Care
Clinic-based $8,148,113 1.48 $12,082,837 $2,007,506 1.27 $2,543,109 $1,535,152 1.26 $1,927,383 $826,620 1.29 $1,065,017 $708,532 1.41 $999,526
Hospital-based $30,855,133 1.66 $51,238,034 $7,601,989 1.27 $9,646,164 $5,813,286 1.26 $7,338,111 $3,130,231 1.33 $4,147,556 $2,683,055 1.51 $4,042,264
Other
Hospital-based $19,126,000 1.66 $31,760,636 $3,518,000 1.27 $4,463,990 $700,000 1.26 $883,610 $1,147,000 1.33 $1,519,775 $2,105,000 1.51 $3,171,372
TOTAL Income $58,129,246 $95,081,507 $13,127,495 $16,653,263 $8,048,438 $10,149,104 $5,103,851 $6,732,348 $5,496,587 $8,213,161

43
Appendix D - OSUMC Residency Completers, by Congressional District and Specialty
(2004-2012)
- Congressional District 1
- Congressional District 2
- Congressional District 3
- Congressional District 4
- Congressional District 5
Tulsa
Bixby
Jenks
Coweta
Owasso
Sapulpa
Glenpool
Bartlesville
Broken Arrow
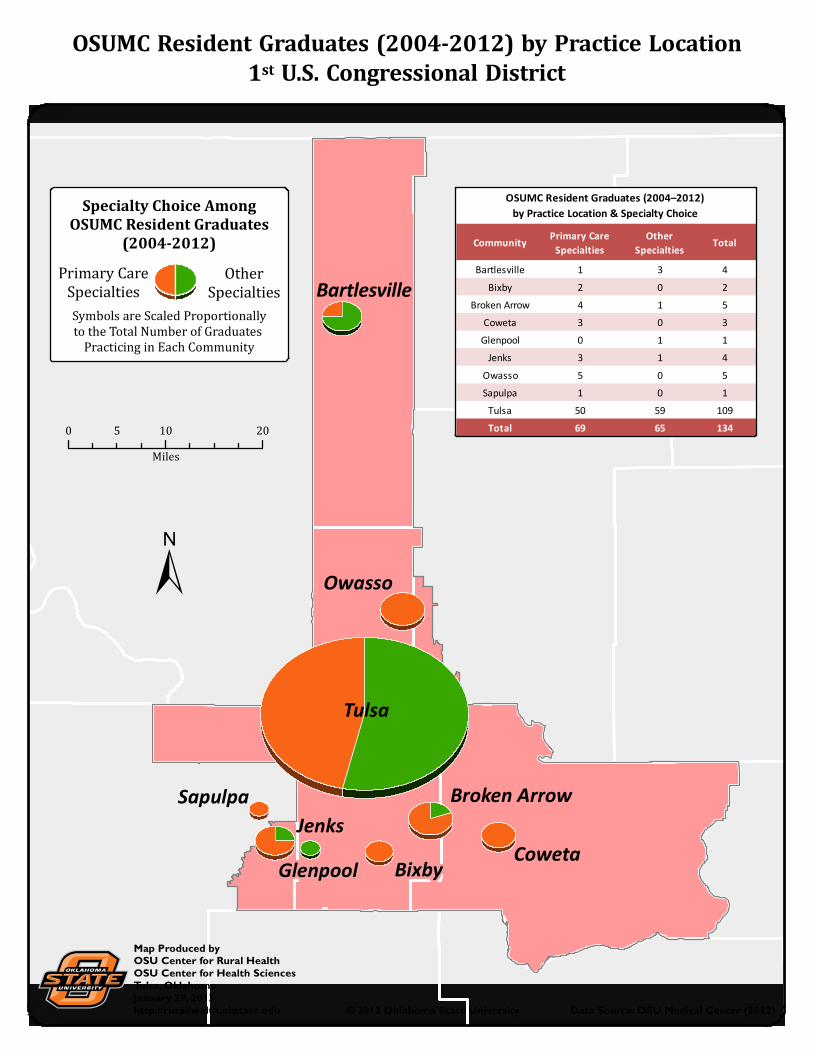
OSUMC Resident Graduates (2004-2012) by Practice Location
1st U.S. Congressional District
© 2013 Oklahoma State University Data Source: OSU Medical Center (2012)
0 10 205
Miles
Map Produced byOSU Center for Rural HealthOSU Center for Health SciencesTulsa, OklahomaJanuary 29, 2013http://ruralhealth.okstate.edu
±
CommunityPrimary Care
Specialties
Other
SpecialtiesTotal
Bartlesville 1 3 4
Bixby 2 0 2
Broken Arrow 4 1 5
Coweta 3 0 3
Glenpool 0 1 1
Jenks 3 1 4
Owasso 5 0 5
Sapulpa 1 0 1
Tulsa 50 59 109
Total 69 65 134
OSUMC Resident Graduates (2004–2012)
by Practice Location & Specialty ChoiceSpecialty Choice Among
OSUMC Resident Graduates
(2004-2012)
Symbols are Scaled Proportionally
to the Total Number of Graduates
Practicing in Each Community
Other
Specialties
Primary Care
Specialties

Tahlequah
MuskogeeSallisaw
Okmulgee
McAlester
Coalgate
Talihina
Durant
Claremore
Grove
OSUMC Resident Graduates (2004-2012) by Practice Location
2nd U.S. Congressional District
© 2013 Oklahoma State University Data Source: OSU Medical Center (2012)
0 30 6015
Miles
Map Produced byOSU Center for Rural HealthOSU Center for Health SciencesTulsa, OklahomaJanuary 29, 2013http://ruralhealth.okstate.edu
±
CommunityPrimary Care
Specialties
Other
SpecialtiesTotal
Claremore 3 1 4
Coalgate 1 0 1
Durant 2 0 2
Grove 1 1 2
McAlester 2 1 3
Muskogee 2 2 4
Okmulgee 2 0 2
Sallisaw 1 0 1
Tahlequah 2 6 8
Talihina 1 0 1
Total 17 11 28
OSUMC Resident Graduates (2004–2012)
by Practice Location & Specialty Choice
Specialty Choice Among
OSUMC Resident Graduates
(2004-2012)
Symbols are Scaled Proportionally
to the Total Number of Graduates
Practicing in Each Community
Other
Specialties
Primary Care
Specialties

Buffalo
Enid
Ponca City
Cleveland
Yukon
Bristow
Chandler
Prague
OSUMC Resident Graduates (2004-2012) by Practice Location
3rd U.S. Congressional District
© 2013 Oklahoma State University Data Source: OSU Medical Center (2012)
0 50 10025
Miles
Map Produced byOSU Center for Rural HealthOSU Center for Health SciencesTulsa, OklahomaJanuary 29, 2013http://ruralhealth.okstate.edu
±
CommunityPrimary Care
Specialties
Other
SpecialtiesTotal
Bristow 2 0 2
Buffalo 1 0 1
Chandler 1 0 1
Cleveland 1 0 1
Enid 2 1 3
Ponca City 3 1 4
Prague 2 0 2
Yukon 1 0 1
Total 13 2 15
OSUMC Resident Graduates (2004–2012)
by Practice Location & Specialty Choice
Specialty Choice Among
OSUMC Resident Graduates
(2004-2012)
Symbols are Scaled Proportionally
to the Total Number of Graduates
Practicing in Each Community
Other
Specialties
Primary Care
Specialties

Newcastle
Ardmore
Sulphur
Ada
Chickasha
Norman
Moore
Midwest City
OSUMC Resident Graduates (2004-2012) by Practice Location
4th U.S. Congressional District
© 2013 Oklahoma State University Data Source: OSU Medical Center (2012)
0 20 4010
Miles
Map Produced byOSU Center for Rural HealthOSU Center for Health SciencesTulsa, OklahomaJanuary 29, 2013http://ruralhealth.okstate.edu
±
CommunityPrimary Care
Specialties
Other
SpecialtiesTotal
Ada 1 0 1
Ardmore 0 1 1
Chickasha 1 0 1
Midwest City 0 1 1
Moore 2 1 3
Newcastle 1 0 1
Norman 1 1 2
Sulphur 1 0 1
Total 7 4 11
OSUMC Resident Graduates (2004–2012)
by Practice Location & Specialty Choice
Other
Specialties
Primary Care
Specialties
Specialty Choice Among
OSUMC Resident Graduates
(2004-2012)
Symbols are Scaled Proportionally
to the Total Number of Graduates
Practicing in Each Community

Oklahoma City
Edmond
OSUMC Resident Graduates (2004-2012) by Practice Location
5th U.S. Congressional District
© 2013 Oklahoma State University Data Source: OSU Medical Center (2012)
0 10 205
Miles
Map Produced byOSU Center for Rural HealthOSU Center for Health SciencesTulsa, OklahomaJanuary 29, 2013http://ruralhealth.okstate.edu
±
CommunityPrimary Care
Specialties
Other
SpecialtiesTotal
Edmond 1 0 1
Oklahoma City 5 7 12
Total 6 7 13
OSUMC Resident Graduates (2004–2012)
by Practice Location & Specialty Choice
Specialty Choice Among
OSUMC Resident Graduates
(2004-2012)
Symbols are Scaled Proportionally
to the Total Number of Graduates
Practicing in Each Community
Other
Specialties
Primary Care
Specialties
Recommended