THE CROSS-BRONXEXPRESSWAY
Steve Alpert & Lexcie Lu

Steve M. Alpert & Lexcie Lu
1.011 Project Evaluation, Spring 2003Big Dig Seminar at Boston University, Metropolitan College
Slide 2 of 21
Outline
1. History of the Cross-Bronx2. Robert Moses3. Problems: Construction, Social4. Interchange: Highbridge and Bruckner5. Ramifications6. Evaluation: Who was Right?7. How to Build Urban Freeways

Steve M. Alpert & Lexcie Lu
1.011 Project Evaluation, Spring 2003Big Dig Seminar at Boston University, Metropolitan College
Slide 3 of 21
NYC Expressways and Parkways: Timeline
Triborough Bridge and Tunnel Authority introduces yet another freeway plan
1955
Robert Moses proposes limited-access highways for all vehicles
– Existing parkways only open to cars– Largest highway undertaking by far (100+ freeway miles)
Late 1945
Regional Plan Association proposes NY/NJ/CT freeway network
1936
Bronx River Parkway opens: first surviving limited-access highway, first NYC-area parkway
1925
Long Island Motor Parkway opens: first highway using overpasses, one of first with concrete
1908
Steve M. Alpert & Lexcie Lu
1.011 Project Evaluation, Spring 2003Big Dig Seminar at Boston University, Metropolitan College
Slide 4 of 21
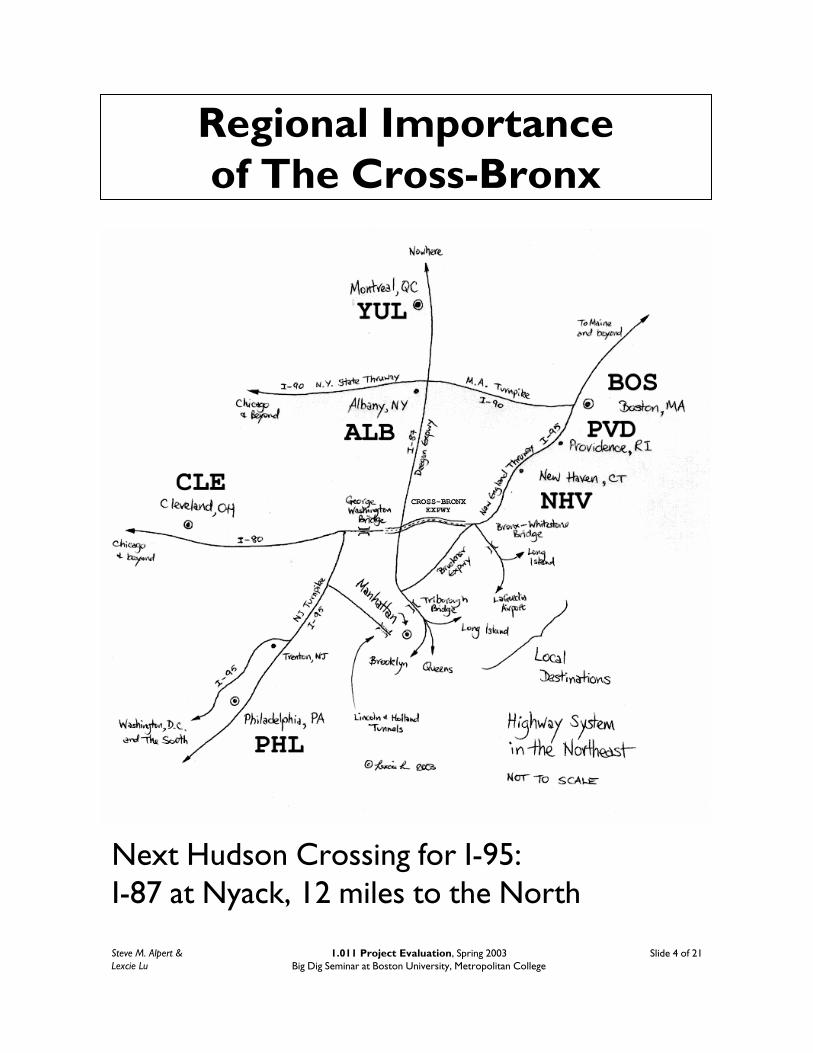
Regional Importance of The Cross-Bronx
Next Hudson Crossing for I-95: I-87 at Nyack, 12 miles to the North

Steve M. Alpert & Lexcie Lu
1.011 Project Evaluation, Spring 2003Big Dig Seminar at Boston University, Metropolitan College
Slide 5 of 21
Robert Moses —Why the Highway System?
• NY State Head of Parks (1924)• NYC Parks Commissioner,
Head of Triborough Bridge & Tunnel Authority (1933)
• Notable (and hated) for pushing plans through without prior approval
• Philosophy– Beautiful parkways, state parks– Economic development:
Shea Stadium, UN Building, 1960 World’s Fair
• Hated ‘ghetto’ slums– Subways = waste of money– Downtown = dead without expressways
Steve M. Alpert & Lexcie Lu
1.011 Project Evaluation, Spring 2003Big Dig Seminar at Boston University, Metropolitan College
Slide 6 of 21
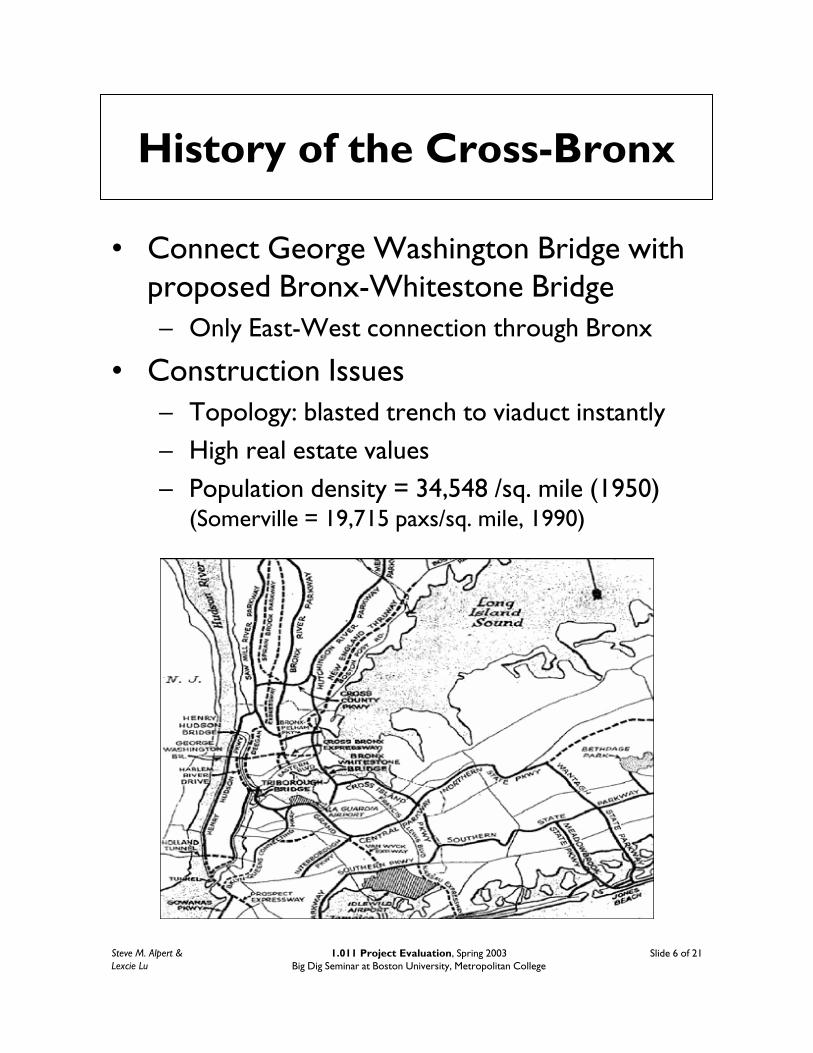
History of the Cross-Bronx
• Connect George Washington Bridge with proposed Bronx-Whitestone Bridge– Only East-West connection through Bronx
• Construction Issues– Topology: blasted trench to viaduct instantly– High real estate values– Population density = 34,548 /sq. mile (1950)
(Somerville = 19,715 paxs/sq. mile, 1990)

Steve M. Alpert & Lexcie Lu
1.011 Project Evaluation, Spring 2003Big Dig Seminar at Boston University, Metropolitan College
Slide 7 of 21
Stages
• Bruckner Interchange (I-95 complete)
1972
• Highbridge interchange with I-87, Alexander Hamilton Bridge
1964
• “Middle” (between east and west)1962
• “Extension” (Bruckner Circle to ThrogsNeck Bridge)
• Now I-295 spur (also I-895)
1961
• “East” (between Bronx River Pkwy andBruckner Circle)
• “West” (between Harlem River and Jerome Avenue)
1954
• Initial cost estimate: $17 million (1941)• Became part of planned I-95 (1946)• Interstate 95 approved (1957)• 8.3 miles (Bruckner to Highbridge)

Steve M. Alpert & Lexcie Lu
1.011 Project Evaluation, Spring 2003Big Dig Seminar at Boston University, Metropolitan College
Slide 8 of 21
Problems: Construction
• Highway to Nowhere– First section is less than a mile long– Western and Eastern sections done first
• Possibility the middle never gets built• Traffic problems through the center of the Bronx
• Accidents– 1959: retaining wall collapses (rain weakened
hillside), one died– 1962: crane buckles, two died
• Materials– Unionport Bridge delayed – competition for
materials with other highway projects– Inferior drying method used on Highbridge
pavement = 70% cost overrun
• Existing Infrastructure– Tunnels under a subway line (!)– IRT subway station raised to fit highway
underneath – service not disrupted

Steve M. Alpert & Lexcie Lu
1.011 Project Evaluation, Spring 2003Big Dig Seminar at Boston University, Metropolitan College
Slide 9 of 21
Problems: Social
• Many people displaced along corridor– First contract was for relocating tenants– 1,530 families moved in above stretch
• 5,000 total for highway
– $7 million to move people– Neighbourhood(s) destroyed permanently
• Moses v.s. Bronx Borough President James Lyons– Lyons wanted alignment through Crotona Park
• 1-2% of the damage (19 families moved)
– Moses threatened to stop construction• Interstate engineering standards; Corruption

Steve M. Alpert & Lexcie Lu
1.011 Project Evaluation, Spring 2003Big Dig Seminar at Boston University, Metropolitan College
Slide 10 of 21
Highbridge Interchange
• Washington Bridge is not Interstate-standard– Ends in traffic light– Narrow lanes, no shoulders
• New interchange with Washington Bridge and Harlem River Drive
• Washington Bridge built in 1888 for $2.65 million– Improve to six lanes, remove trolley tracks (1949)– Replaced by Alexander Hamilton Bridge (1959-64)
• Connect Cross-Bronx and Deegan Expwy– 18 months overrun
• Ultimate Cost = $60 million (1969)
Steve M. Alpert & Lexcie Lu
1.011 Project Evaluation, Spring 2003Big Dig Seminar at Boston University, Metropolitan College
Slide 11 of 21
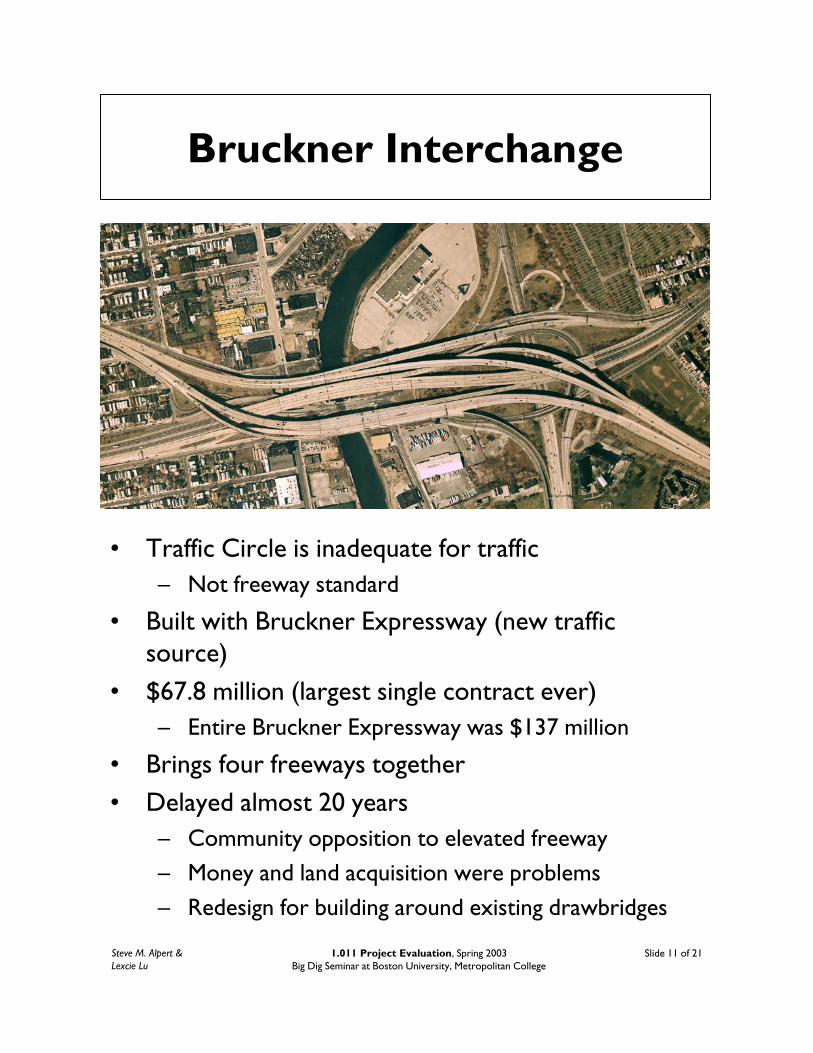
Bruckner Interchange
• Traffic Circle is inadequate for traffic– Not freeway standard
• Built with Bruckner Expressway (new traffic source)
• $67.8 million (largest single contract ever)– Entire Bruckner Expressway was $137 million
• Brings four freeways together• Delayed almost 20 years
– Community opposition to elevated freeway– Money and land acquisition were problems– Redesign for building around existing drawbridges
Steve M. Alpert & Lexcie Lu
1.011 Project Evaluation, Spring 2003Big Dig Seminar at Boston University, Metropolitan College
Slide 12 of 21
Ramifications
• Robert Moses forced out of New York– Resigned from city to head World’s Fair (1959)– Lost NY State jobs under Rockefeller, then
retired (1968)
• No more construction through cities– Planned NYC expressways (Bushwick, Lower-
and Mid- Manhattan, Nassau) stopped• Nassau half-built
– Embarcadero, Central Artery, other elevated highways now being torn down
• Boston– Inner Belt (I-695) cancelled– Route 2 (Northwest Expressway) replaced
with Alewife Red Line Extension (interstate funds transfer)
– Southwest Expressway (I-95)
• Community opposition = effective force– Park Freeway West (Milwaukee), Somerset
Freeway (NJ), West Side Highway (Manhattan)
• Highways seen as bad in urban areas

Steve M. Alpert & Lexcie Lu
1.011 Project Evaluation, Spring 2003Big Dig Seminar at Boston University, Metropolitan College
Slide 13 of 21
Cancelled Highway Projects
Southwest Expressway (I-95), Boston, Mass.
I-295 and U.S. Route 6, Providence, R.I.
Route 1 and MA 60, Lynn, Mass. (planned I-95)
I-189 (at U.S. Route 7), Burlington, Verm.

Steve M. Alpert & Lexcie Lu
1.011 Project Evaluation, Spring 2003Big Dig Seminar at Boston University, Metropolitan College
Slide 14 of 21
Who was Right?
• Direct Costs– Opportunity cost of land (acquisition costs)– Construction cost
• Externalities (also Costs)– Displacement of existing residents– Devaluation of properties immediately adjacent– Splitting neighbourhoods in half
• Direct Benefits (Convertible to Revenue)– Time saving for passengers– Logistics cost savings for freight
• Positive Externalities– Increase in value of nearby properties– Reduction in accident rate
• Monetize costs and benefits for Project Evaluation (Economic Analysis)
Steve M. Alpert & Lexcie Lu
1.011 Project Evaluation, Spring 2003Big Dig Seminar at Boston University, Metropolitan College
Slide 15 of 21
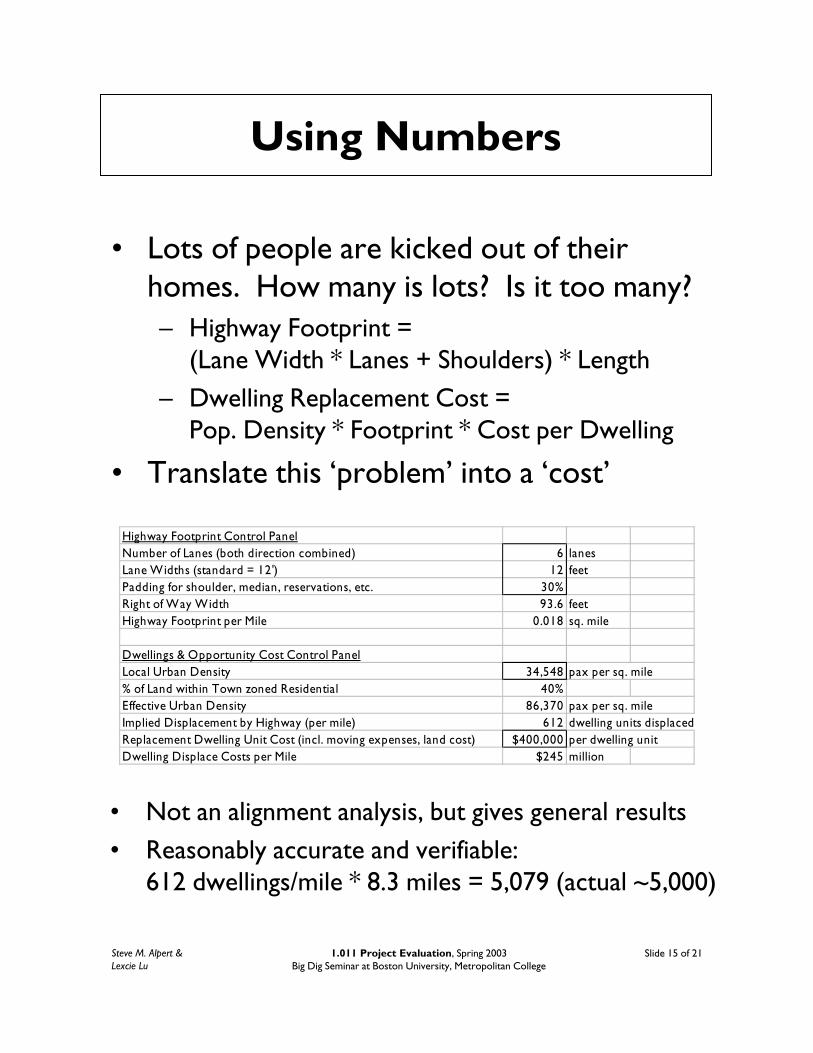
Using Numbers
• Lots of people are kicked out of their homes. How many is lots? Is it too many?– Highway Footprint =
(Lane Width * Lanes + Shoulders) * Length– Dwelling Replacement Cost =
Pop. Density * Footprint * Cost per Dwelling
• Translate this ‘problem’ into a ‘cost’
Highway Footprint Control PanelNumber of Lanes (both direction combined) 6 lanesLane Widths (standard = 12') 12 feetPadding for shoulder, median, reservations, etc. 30%Right of Way Width 93.6 feetHighway Footprint per Mile 0.018 sq. mile
Dwellings & Opportunity Cost Control PanelLocal Urban Density 34,548 pax per sq. mile% of Land within Town zoned Residential 40%Effective Urban Density 86,370 pax per sq. mileImplied Displacement by Highway (per mile) 612 dwelling units displaced Replacement Dwelling Unit Cost (incl. moving expenses, land cost) $400,000 per dwelling unitDwelling Displace Costs per Mile $245 million
• Not an alignment analysis, but gives general results• Reasonably accurate and verifiable:
612 dwellings/mile * 8.3 miles = 5,079 (actual ~5,000)

Steve M. Alpert & Lexcie Lu
1.011 Project Evaluation, Spring 2003Big Dig Seminar at Boston University, Metropolitan College
Slide 16 of 21
Estimating Social Costs
• Repeat the process for each item considered a social ‘cost’
• Invent ways to model intangibles– Neighbourhood cut-off? Use gravity model!
Rent per Household per Annum $18,000 per household per annuNumber of Households per Building 4.0 households/buildingOpportunity Cost per Building per Year $72,000 per building per annumOpportunity Cost per Mile $11.0 million per annum(This should increase with inflation -- ongoing cost)
Adjacent Property Devaluation Control PanelMileage Either Side of Alignment Impacted 0.2 milesNumber of paxs per household 2.5 paxs/householdHousehold Impacted per Mile 5,528 householdsAssume Rent Value Reduced by n% in These Households 10%Loss of Equity per Annum per Household $1,800 per annum per househoTotal Loss of Equity per Annum $9.9 million per annum
Neighbourhoods Cut-off Control PanelPopulation per Neighbourhood 34,548 paxsPercentage of Neighbourhood Transactions Affected 33%Time-Value Penalty per Transaction Affected 8 minutesDaily Penalty per Neighbourhood $30,402Number of Neighbourhood Transactions per Person per Week 5 transactionsAnnual Penalty due to Neighbourhood being Cut-off $7.9 million per annum
Urban Freeway Social Cost Control PanelsLexcie Lu, MIT Center for Transportation Studies, 04/06/03Based on prior work by Steve Alpert, MIT Department of Civil Engineering
Value of Time for the Average Citizen $20 per hour

Steve M. Alpert & Lexcie Lu
1.011 Project Evaluation, Spring 2003Big Dig Seminar at Boston University, Metropolitan College
Slide 17 of 21
Estimating Social Benefits
• Ignore costs/benefits that have small values– e.g. two people on three occasions a year not
being able to launch their yacht isn’t a big deal
• Compare proposed with counterfactual
Urban Freeway Social Benefits Control PanelsLexcie Lu, MIT Center for Transportation Studies, 04/06/03Based on prior work by Steve Alpert, MIT Department of Civil Engineering
Value of Time for the Average Citizen $20 per hour
Traffic Flow Control PanelInitial Number of Vehicles per Day 70,000 vehs/dayMax Number of Vehicles per Day 160,000 vehs/dayNumber of Years to Reach Maximum Thoroughput 20 yearsEffective Increase in Highway Traffic per day per year 4,500 vehs/day added per year
Vehicle Speed on City Streets 25 mphVehicle Speed on Urban Freeway 50 mphTime Saved per Mile of Freeway per Vehicle 0.02 hoursAverage Vehicle Occupancy 1.3 paxs/vehiclePerson-Time Saved per Mile of Freeway per Vehicle 0.026 hours
Total Daily Time Value Saved per Mile Freeway per Day, First Year $28,000 per dayTotal Time Value Saved per Mile Freeway, First Year $10.22 million per mile per yea
Incremental Daily Time Value Saved per Day, Subsequent Years $2,340 per dayIncremental Time Value Saved per Mile Freeway, Subsequent Years $0.85 million per mile per yea
Nearby Property Value Apperciation Control PanelMinimum Mileage Either Side of Alignment 0.2 milesMaximum Mileage Either Side of Alignment 1 milesRamp Spacing Every x Miles 2 milesHousehold Impacted per Mile 11,055 householdsAssume Rent Value Increased by n% in These Households 3%Gain in Equity per Annum per Household $840 per annum per househoTotal Gain in Equity per Annum $9.3 million per annum

Steve M. Alpert & Lexcie Lu
1.011 Project Evaluation, Spring 2003Big Dig Seminar at Boston University, Metropolitan College
Slide 18 of 21
Urban Freeway Evaluation
• Use Net Present Value method• Negative social externalities are huge• But so are social benefits – compensate losers
Evaluation of Urban FreewaysLexcie Lu, MIT Center for Transportation Studies, 14/06/03Based on prior work by Steve Alpert, MIT Department of Civil Engineering
Interest Rate (i%) = 7%Inflation Rate = (j%) 3%Value of Time = $20 per hourTime Horizon = 100 years
Population Density Parameter Bronx Somerville Hicksville34,548 19,715 1,000(1950) (2000) (hypoth.)
Cost Items Present ValueDisplacement of Existing Residents -$240 -$140 -$7 millionOpportunity Cost of Land -$290 -$165 -$8 millionDevaluation of Immediately Adjacent Properties -$260 -$150 -$8 millionCutting of Neighborhoods in Half -$210 -$120 -$6 millionConstruction Cost -$25 -$25 -$25 million
Benefit Items Present ValueTime Savings for Passenger Vehicles $630 $440 $160 millionIncrease in Value of Properties $250 $120 $10 millionReduction of Accidents $20 $20 $20 millionLogistics Cost Savings for Freight $20 $15 $5 million
Benefits – Costs Present ValueTotal -$105 -$5 $141 million

Steve M. Alpert & Lexcie Lu
1.011 Project Evaluation, Spring 2003Big Dig Seminar at Boston University, Metropolitan College
Slide 19 of 21
Sensitivity Analysis
• Economic case for urban highways very sensitive to existing population density
• Net benefit low or negative in dense areas– Little economic development benefits– High opportunity cost of land
• Net benefit high in not-so-dense areas– Time saving remain the same, if highly utilized– Lower displacement and opportunity costs
• Most externalities are people-related (explains high sensitivity to pop. density)
• Toll the highways to pay the abutters
• Did Moses know this stuff?– Not really, he was mostly a philosopher– His vision was great everywhere except
downtown New York City

Steve M. Alpert & Lexcie Lu
1.011 Project Evaluation, Spring 2003Big Dig Seminar at Boston University, Metropolitan College
Slide 20 of 21
How to Build Urban Freeways
• Avoid dense neighbourhoods – detour– Retain time savings (Crotona Park alignment)
• Skirt existing conurbations – design– Land use pattern will adapt (I-95 Providence)
• Analyze costs and benefits explicitly• Relax Interstate standards if necessary
– Highway design could be economically driven– Urban or Mountain terrain:
• provide some access• lower design speed to lower externalities
– Elevated over existing alignments, or Praries:• low externalities permit higher engineering standards
• Sometimes a question of who got there first! (Value of existing infrastructure)
Steve M. Alpert & Lexcie Lu
1.011 Project Evaluation, Spring 2003Big Dig Seminar at Boston University, Metropolitan College
Slide 21 of 21
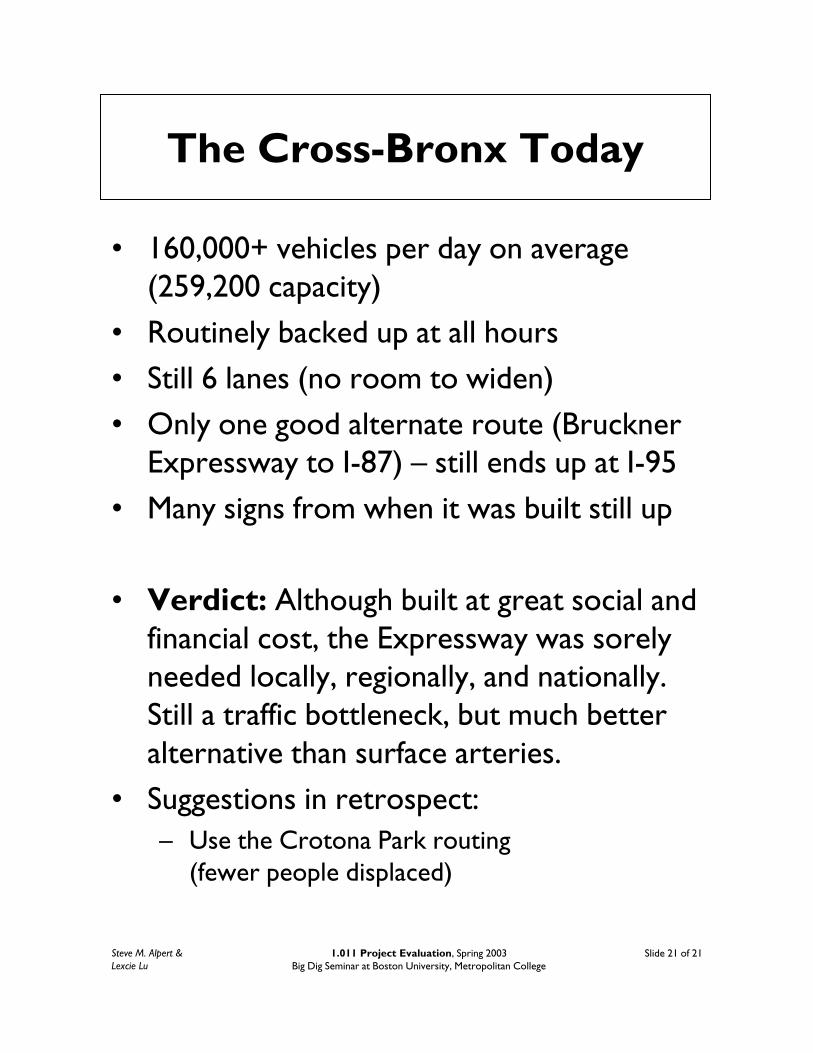
The Cross-Bronx Today
• 160,000+ vehicles per day on average (259,200 capacity)
• Routinely backed up at all hours• Still 6 lanes (no room to widen)• Only one good alternate route (Bruckner
Expressway to I-87) – still ends up at I-95• Many signs from when it was built still up
• Verdict: Although built at great social and financial cost, the Expressway was sorely needed locally, regionally, and nationally. Still a traffic bottleneck, but much better alternative than surface arteries.
• Suggestions in retrospect:– Use the Crotona Park routing
(fewer people displaced)

Steve M. Alpert & Lexcie Lu
1.011 Project Evaluation, Spring 2003Big Dig Seminar at Boston University, Metropolitan College
Slide 22 of 21
Acknowledgements
Carl D. Martland – 1.011 Project Evaluation(MIT Civil & Environmental Engineering)http://www.mit.edu/~1.011/
Sources: http://www.nycroads.com/, The New York Times, The Godfather of Sprawl (Atlantic Monthly)
Recommended


![[XLS] · Web viewAMEER ALI 2124 CROSS BRONX EXPRESSWAY 2000881 EAST 146 STREET 200985577 02329 KAMMY YAGHOUBIAN JOHNSTONE CONSTRUCTION LLC KY-146 REALTY LLC MATHEW LOUZZI 60 SACKETT](https://img.dokumen.tips/doc/110x75/5abe5e637f8b9ac0598d09e3/xls-viewameer-ali-2124-cross-bronx-expressway-2000881-east-146-street-200985577.jpg)