Clean Air VI ConferenceWorkshop on Clean Development Mechanism
“THE CLEAN DEVELOPMENT MECHANISM”A FRAMEWORK FOR CO-OPERATION
WITH DEVELOPING COUNTRIES
Maria Maria da Graça Carvalho da Graça Carvalho Neven DuicNeven Duic
LuísLuís Manuel Manuel AlvesAlves
InstitutoInstituto Superior Superior TécnicoTécnico, Technical University of Lisbon, Technical University of LisbonDept. Mechanical EngineeringDept. Mechanical Engineering
Av. Av. Rovisco PaisRovisco Pais, 1049, 1049--001 Lisbon, PORTUGAL001 Lisbon, PORTUGAL

OBJECTIVES OF TH PRESENTATION
To show how CDM may:
help Europe to fulfil the Kyoto Targets.promote European investment opportunities.enable European industry to disseminate European clean technologies in Developing Countries.attract the interest of investors, banks, private sectors and donors.raise public awareness for the successful implementation of the Kyoto requirements.

CONTENTS
The United Nations Framework Convention on Climate Change and the Kyoto Protocol.The current status of the negotiation process.The Kyoto Protocol Flexible Mechanisms.The Clean Development Mechanism.The strategy to implement CDM in Developing Countries:
Small Island Developing Country special case: Cape Verde, Islands of Santo Antão and Santiago;
Least Developed Country special case: Mozambique, South-Eastern Africa;
Developing Country special case: Brazil, South America.Conclusions - CDM: where to go from here.

THE CONVENTION FOR CLIMATE CHANGE
Commitments of the Parties - Developed Countries (Annex I), Countries with Economies in Transition and Developing Countries (non-Annex I) -for stabilization of greenhouse gas (GHG) concentrations in the atmosphere at a level that would prevent dangerous anthropogenicinterference with the climate system.Recognition of the role of the Annex I Parties to stabilise GHG emissions. Adoption by Annex I Parties of Policies and Measures for climatechange mitigation and commitments to assist non-Annex I Parties to achieve sustainable development - technology transfer, capacity building and financial resources.Recognition of the role of research and systematic observation, and education, training and public awareness.

COMMITMENTS OF ALL PARTIES
To reduce the impact of GHG emissions on the global climate, all Parties must:
Adopt national programs for the mitigation of the effects of climate change and develop strategies for adaptation;Take in consideration climate change issues into relevant social, economic and environment policies;Co-operate on scientific, technical and educational matters;Promote public education and information.
committing the Developed Country Parties (Annex I) to:Take measures to stabilise GHG emissions to the 1990 level by the year of 2000;Financially and technically support Developing Countries (Non-Annex I Parties).

THE KYOTO PROTOCOL
International agreement adopted on December 10, 1997, by the Parties participating on the third session of the Conference of the Parties, in Kyoto, Japan.
The Kyoto Protocol states that all 38 Parties included in Annex B shall, individually or jointly, reduce their aggregate anthropogenic carbon dioxide equivalent emissions of 6 GHG by at least 5% below 1990 levels in the commitment period 2008-2012.
This Protocol will enter into force when not less than 55 Parties to the Convention, incorporating Parties included in Annex I which accounted in total for at least 55% of the total carbon dioxide emissions for 1990 of the Parties included in Annex I, have deposited their instruments of ratification, acceptance, approval and accession.

CONTENTS OF THE KYOTO PROTOCOL
Policies and Measures;
Acquisition, monitoring and inventory of data - National Communications;
Compliance;
Relations with Developing Countries (Transfer of Technology);
Flexible Mechanisms - Emissions Trading (Article 17), Joint Implementation (Article 6) and CLEAN DEVELOPMENT MECHANISM (Article 12).

FLEXIBLE MECHANISMS
JI - for the purpose of meeting its commitments, any Annex I Party may transfer to, or acquire from, other such Party emission reduction units resulting from projects aimed at reducing anthropogenic emissions of GHG at any economic sector.ET - Annex B Parties may participate in emissions trading for the purposes of fulfilling their commitments, being this suplemental to domestic actions for the purpose of meeting quantified quantified emission limitation and reduction.CDM - to assist Parties non-Annex I Parties in achieving sustainable development and contributing to the ultimate objective of the Convention, and to assist Annex I Parties in achieve compliance with their quantified emission limitation andreduction commitments.
THE CLEAN DEVELOPMENT MECHANISM (CDM)
Will allow Annex I countries to invest in emission-saving projects in Developing Countries and gain credit for the savings achieved through the generation of Certified Emission Reductions that they can use to contribute to compliance of their commitments.Is designed to minimise significantly the cost of achieving Kyoto objectives.Is an effective tool for the promotion of the use of clean technologies by Developing Countries.
THE UNFCCC NEGOTIATION PROCESS
An agreement was not reached at CoP6, in the Hague (November 2000) on the President of CoP6 (Dutch Minister of Environment, Mr. Pronk) Document.Although the difficulties of the negotiations and the outcome from The Hague, the UNFCCC Parties held on continuing regular dialogues for the ratification of the Protocol.The President of CoP6 issued a new document (basis for agreement) on April 2001.The Parties agreed on meeting in Bonn (July 2001) to discuss theproposals of the document, in what is already known as CoP6-bis.Although President Bush latest declaration on the faith if USA Kyoto Protocol commitments, the great majority of the Parties, with EU and its Member States at the front platoon, still hold to ratify Kyoto.

EUROPEAN CLIMATE CHANGE PROGRAMME(ECCP)
ECCP was established in June 2000 to help identify the most envionmentally and cost effective additional measures enabling the EU to meet its target under the Kyoto Protocol, namely an 8% reduction in GHG from 1990 levels by 2008-2012.ECCP has been set as a multi-stakeholder consultative process focussed on energy, transport, industry, research and agriculture and the issue of ET within the EU.Seven technical Working Groups were established which work was co-ordinated with other on-going EU activities, such as Joint Expert Groups on Transport and Environment, and on Fiscal Measures, as well as the Sixth Environmental Action Programme and the EU Strategy for Sustainable Development.

EUROPEAN CLIMATE CHANGE PROGRAMME(ECCP)
ECCP investigated more than 40 measures and could identify cost-effective options totalling 664-765 MtCO2eq.ECCP Report was presented on July 2-3, 2001, in Brussels - the Report classifies the measures in 3 different categories, to allow a better indication of the short-term potential of cost-effective measures at the EU level:
measures at an advance stage of preparation - 8 measures representing an estimated 240 MtCO2eq cost-effective emission reduction potential;measures in the pipeline - 11 measures with an estimated cost-effective emission reduction potential of about 140 MtCO2eq;measures needing further work - 22 measures.

CDM - HOW TO GET THERE?
The Kyoto Protocol says little about how CDM should be designed and implemented- a number of functions will need to be performed:
International Functions:Certification of CDM eligible project activities;Emissions additionality and baseline setting;Quantification, certification and pricing of ERUs;Assistance for funding for certified projects;System to track ERU trades;Protecting vulnerable players.
National Functions:Domestic monitoring and verification of baselines;Registration of third-party certification entitiesCertification of projects;Setting national or sectoral emissions inventories.

EU CAPACITY BUILDING FOR CDM
Identification and elimination of structural and operational barriers.
Articulation of the public and private sectors.
Introducing CDM perspectives into financing policies for development at bilateral and multilateral levels.
Strengthen R&D Programmes directed to the needs of globalisationand measures to achieve Kyoto Objectives.
Reinforcement of technical, business, marketing, organisational know-how, legislative, regulatory and enforcing skills of both public and private sectors.
Improving SMEs capacities on risk analysis of environment friendly technology projects.

DEVELOPING COUNTRIES CAPACITY BUILDING FOR CDM
Identification and removal of institutional and other barriers.Creation of a framework for CDM implementation.Elaboration of a methodology to assess CDM project direct benefits and co-benefits.Identification of a methodology for mapping CDM potential.Identification of potential CDM projects.Elaboration of pre-feasibility studies on potential CDM project impacts.

IST PROJECTS AND PROPOSALS ON CAPACITY BUILDING AND CDM
Implemented projects:Analysis of the Power Market and the Potential for Market Penetration of EU Innovative Technologies in Cabo Verde Islands - EU Thermie Programme.Assistance to Energy Policy Implementation in Cabo Verde Islands - EU Synergy Programme.Assistance to Energy Policy Implementation in Mozambique- EU Synergy Programme.
On-going project:Facilitating the Kyoto Protocol Objectives by CDM in Small Island Developing States - EU DG Development.
Submitted proposals:FlexMechs - Integrating Flexible Mechanisms of the Kyoto Protocol into the Member States Energy and Environmental PoliciesEnabling Activities for the Implementation of CDM in South American Countries.

IST WORK FOR CDM DESIGNAND IMPLEMENTATION
Showing the potential influence of Kyoto Protocol Financial Mechanisms on Energy Planning and Energy Technology Transfer in Developing Countries.Showing potentials of assumed rules of CDM on influencing futureCO2 emissions.Illustrating the cases of:
Small Island Developing State - CDMSIDS project;Least Developing Country - Synergy Mozambique project;Developing Country: CDM Brazil.
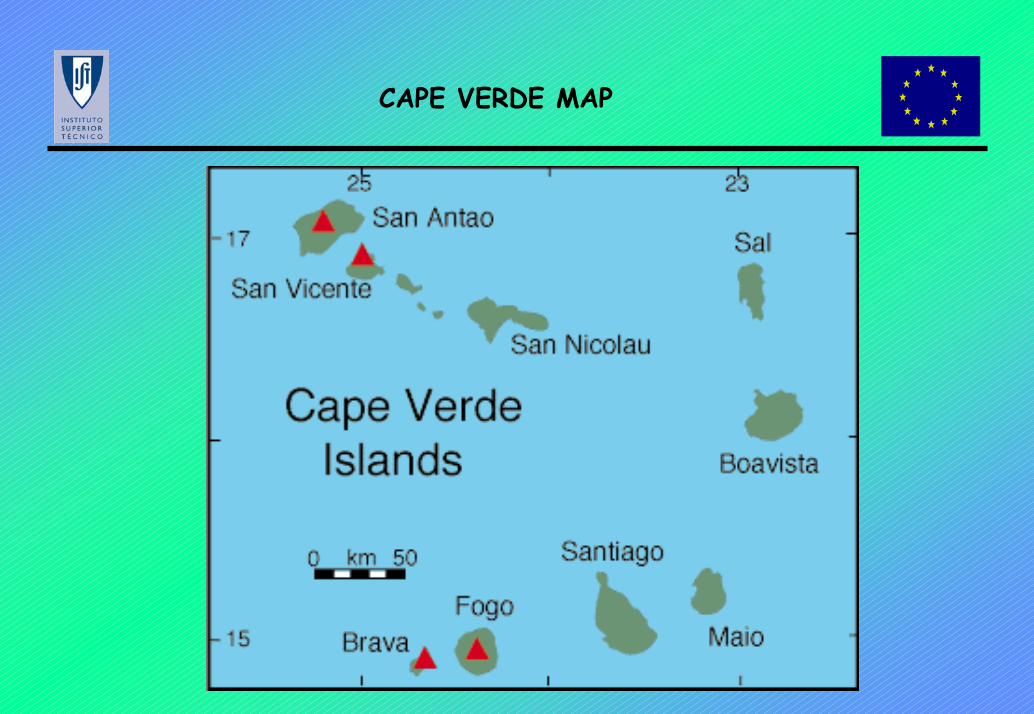
CAPE VERDE MAP

SMALL ISLANDS SPECIAL CASE
High price of small scale fossil fuel technology (diesel).
Possible competitiveness of renewable energy.
Cape Verde
Wind as competitive energy source in electricity production (8% of total).
High dependency on diesel in electricity production.
CASE: SANTO ANTÃO OBJECTIVES
showing particular case of a rural small island with low carbon intensity.
showing the potential of CDM on investing into clean energy technology in Developing Countries.

CASE: SANTO ANTÃO
Electricity production - island of Santo Antão Case for CDM
2000-2030
Scenario 1: Business as usual* – Diesel onlyScenario 2: 30% RE - 25% Wind + 5% PVScenario 3: 30% Wind energyScenario 4: as scenario 2 with declining prices of RET
* based on studies by Jansénio Delgado et al.: Perspectivas de desenvolvimento, Plano director de electricidade de Santo Antão, 1997, Cape Verde, and Diagnóstico de situação local, Plano director de electricidade de Santo Antão, 1997, Cape Verde
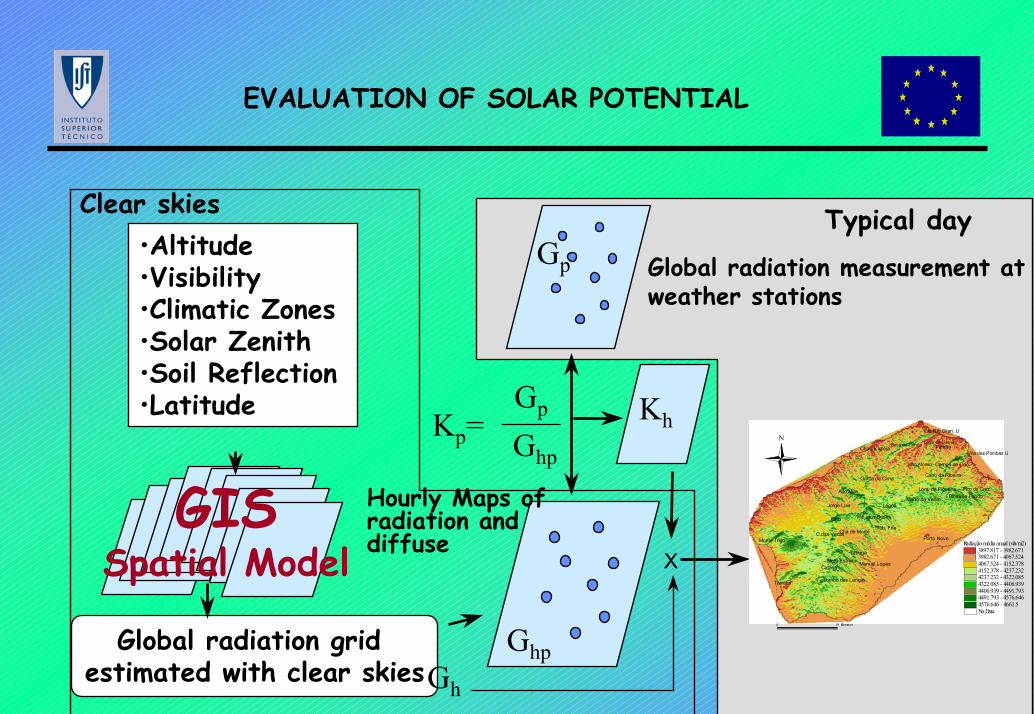
EVALUATION OF SOLAR POTENTIAL
•Altitude•Visibility•Climatic Zones •Solar Zenith•Soil Reflection•Latitude
Global radiation grid estimated with clear skies
SIGSIGSIGSIGSIGSIGGISSpatial Model
Global radiation measurement at weather stations
Ghp
Gp
Gp
GhpKp=
Kh
X
Clear skies Typical day
Hourly Maps of radiation and diffuse
Gh
#
#
#
#
#
#
#
#
#
#
#
#
#
##
#
#
#
#
#
#
#
#
#
#
#
#
##
#
#
#
##
#
#
#
##
#
#
#
#
# #
#
#
#
#
#
#
#
#
#
#
# #
#
#
##
#
#
#
#
#
#
#
#
Eito
Lagoa
Cirio
Pinhão
Catano
Tarrafal
Rib. Fria
Alto Mira
Jorge Luis
Porto NovoMonte Trigo
Cha de Morte
Manuel Lopes
Garca de Cima
Cha de igreja
Morro do Vento
Lombo das Lanças
Tabuga
C.das Vacas
Rib. dos Bodes
Lugar de Guene
João Afonso
Ribeirão FundoPico da Cruz
Vila das Pombas U
Campo de Cao
Cabo da Ribeira
Boca de Coruja
Vila Rib.Gran. U
Mato Estreito
Lom. de Figueira
Radiação média anual (wh/m2)3897.817 - 3982.6713982.671 - 4067.5244067.524 - 4152.3784152.378 - 4237.2324237.232 - 4322.0854322.085 - 4406.9394406.939 - 4491.7934491.793 - 4576.6464576.646 - 4661.5No Data
0 10 Kilometers
N
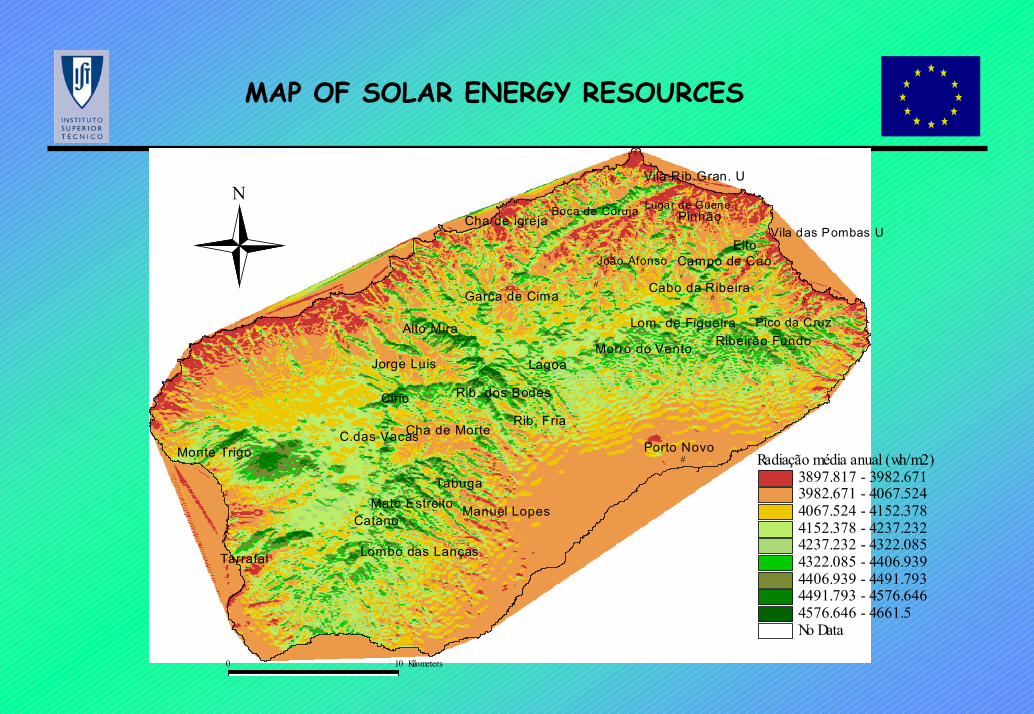
MAP OF SOLAR ENERGY RESOURCES
#
#
#
#
#
#
#
#
#
#
#
#
#
##
#
#
#
#
#
#
#
#
#
#
#
#
##
#
#
#
##
#
#
#
##
#
#
#
#
# #
#
#
#
#
#
#
#
#
#
#
# #
#
#
##
#
#
#
#
#
#
#
#
Eito
Lagoa
Cirio
Pinhão
Catano
Tarrafal
Rib. Fria
Alto Mira
Jorge Luis
Porto NovoMonte Trigo
Cha de Morte
Manuel Lopes
Garca de Cima
Cha de igreja
Morro do Vento
Lombo das Lanças
Tabuga
C.das Vacas
Rib. dos Bodes
Lugar de Guene
João Afonso
Ribeirão FundoPico da Cruz
Vila das Pombas U
Campo de Cao
Cabo da Ribeira
Boca de Coruja
Vila Rib.Gran. U
Mato Estreito
Lom. de Figueira
Radiação média anual (wh/m2)3897.817 - 3982.6713982.671 - 4067.5244067.524 - 4152.3784152.378 - 4237.2324237.232 - 4322.0854322.085 - 4406.9394406.939 - 4491.7934491.793 - 4576.6464576.646 - 4661.5No Data
0 10 Kilometers
N

ZONES WITH POTENTIAL FOR EXPLORATION OF SOLAR ENERGY
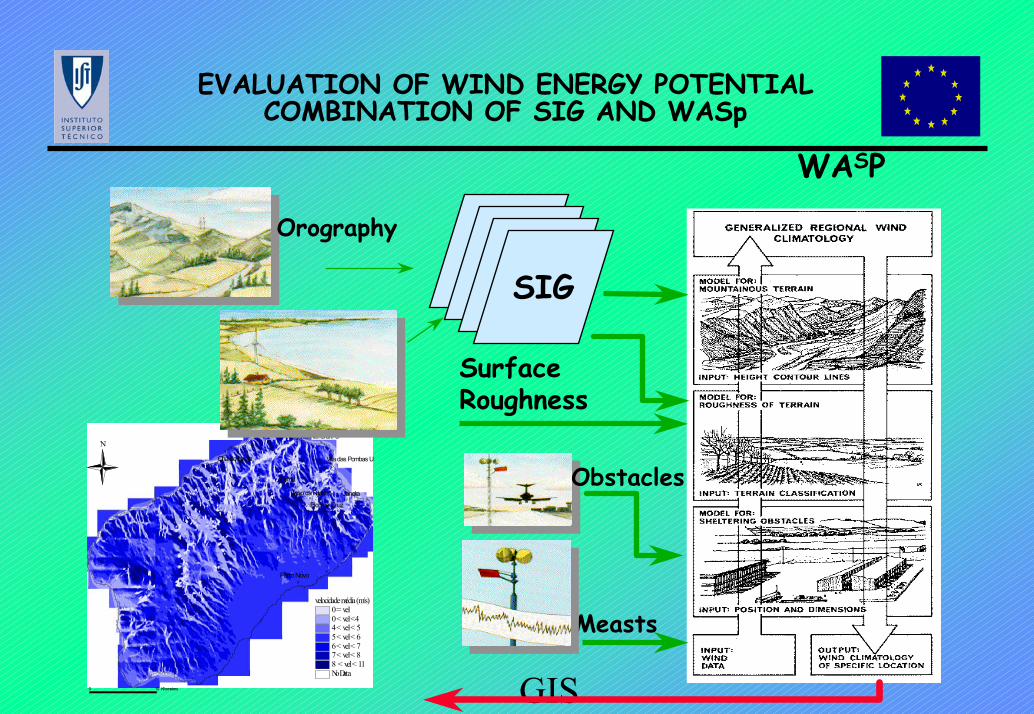
EVALUATION OF WIND ENERGY POTENTIALCOMBINATION OF SIG AND WASp
WASP
#
#
#
#
#
#
#
#
#
#
#
#
#
##
#
#
#
#
#
#
#
#
#
#
#
#
##
#
#
#
##
#
#
#
##
#
#
#
#
# #
#
#
#
#
#
#
#
#
#
#
# #
#
#
##
#
#
#
#
#
#
#
#
Janela
Porto Novo
Cha de igreja
Pico da Cruz
Corda
Vila Rib.Gran. U
Vila das Pombas U
Cabo da Ribeira
velocidade média (m/s)0 = vel0 < vel <44 < vel < 55 < vel < 66 < vel < 77 < vel < 88 < vel < 11No Data
N
0 10 Kilometers
Measts
GIS
SIGSIGSIGSIG
Obstacles
Orography
Surface Roughness
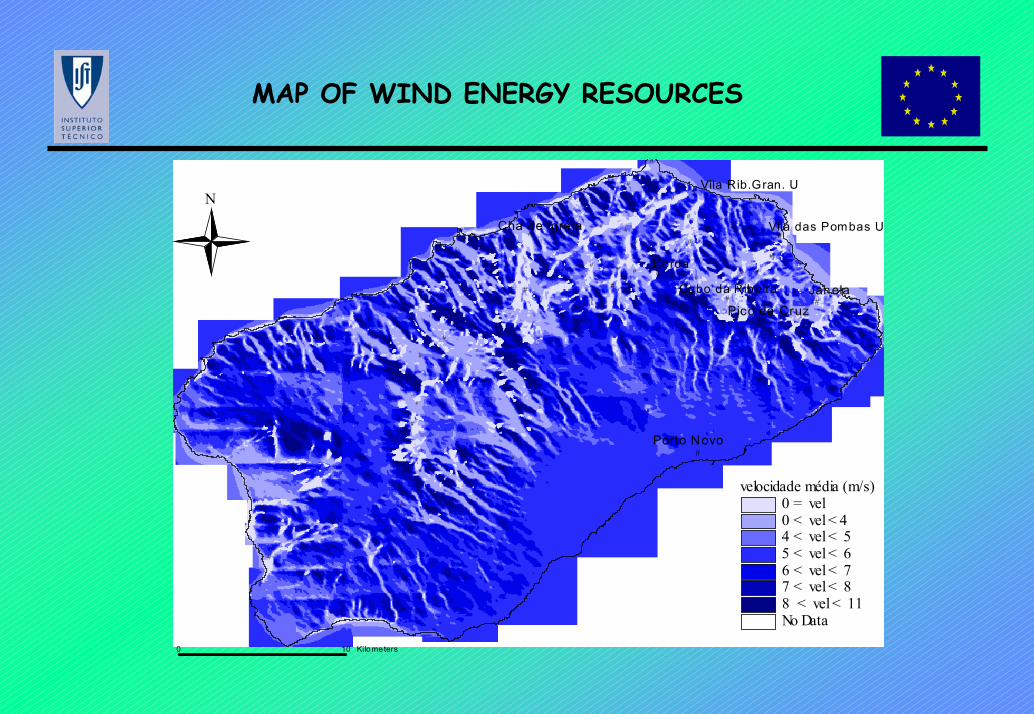
MAP OF WIND ENERGY RESOURCES
#
#
#
#
#
#
#
#
#
#
#
#
#
##
#
#
#
#
#
#
#
#
#
#
#
#
##
#
#
#
##
#
#
#
##
#
#
#
#
# #
#
#
#
#
#
#
#
#
#
#
# #
#
#
##
#
#
#
#
#
#
#
#
Janela
Porto Novo
Cha de igre ja
Pico da Cruz
Corda
Vila Rib.Gran. U
Vila das Pombas U
Cabo da Ribeira
velocidade média (m/s)0 = vel0 < vel < 44 < vel < 55 < vel < 66 < vel < 77 < vel < 88 < vel < 11No Data
N
0 10 Kilometers

ZONES WITH POTENTIAL FOR EXPLORATIONOF WIND ENERGY

TEMPERATURE OF OCEAN SURFACE
S Antão
CABO VERDE

CHEMICAL COMPOSITIONOF THERMAL SOURCES
Ribeira dos Órgãos K
Mg
Ca
Na
Cl
SO
HCO
NO
VarzinhaK
Mg
Ca
Na
Cl
SO
Lagedos K
Mg
Ca
Na
Cl
SO
HCO
NO
Ribeira dos Órgãos:prevalence of chloride typical of sea wtaer
Varzinha e Lagedos:water with high hydrocarbonate and Na+ ions contents typical of granitic water.

THERMAL SOURCES IN SANTO ANTÃO
TReservoir Temperature (Calcedónia)
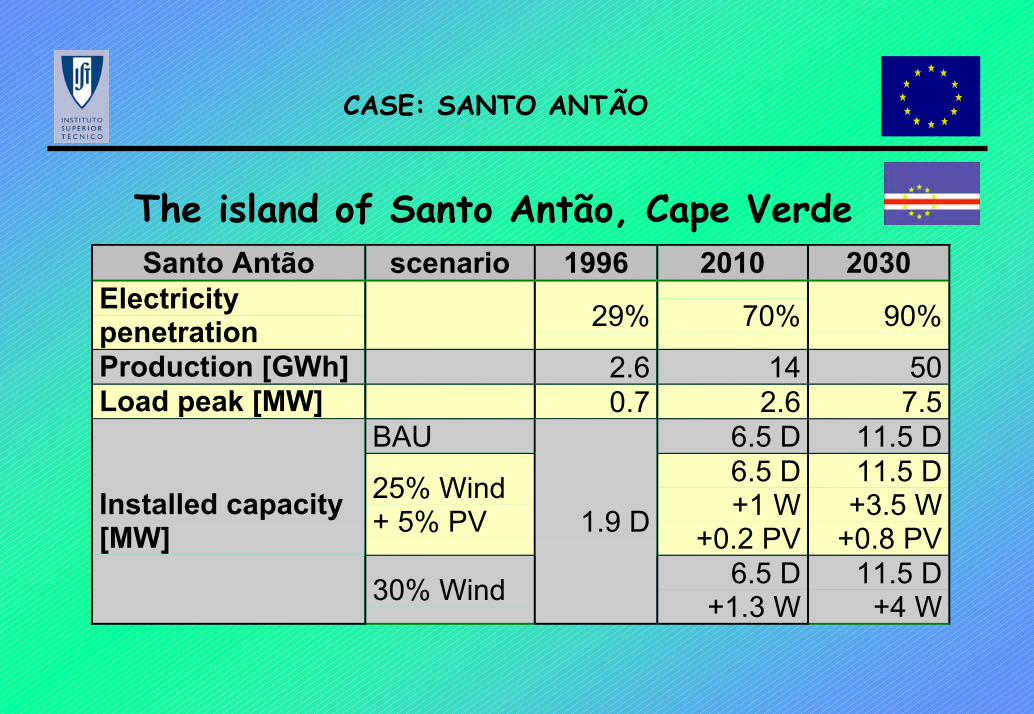
CASE: SANTO ANTÃO
The island of Santo Antão, Cape VerdeSanto Antão scenario 1996 2010 2030
Electricitypenetration 29% 70% 90%
Production [GWh] 2.6 14 50Load peak [MW] 0.7 2.6 7.5
BAU 6.5 D 11.5 D
25% Wind+ 5% PV
6.5 D+1 W
+0.2 PV
11.5 D+3.5 W
+0.8 PVInstalled capacity[MW]
30% Wind
1.9 D
6.5 D+1.3 W
11.5 D+4 W

CASE: SANTO ANTÃO
Installed capacities
• Wind does not reduce significantly the installed diesel capacity needed
02
46
810
1214
1618
1996 2000 2004 2008 2012 2016 2020 2024 2028
Year
MW
Business as usual
0
24
6
810
12
1416
18
1996 2000 2004 2008 2012 2016 2020 2024 2028
Year
MW
solarwinddiesel
30% of RE (Wind+PV)
0
24
68
1012
1416
18
1996 2000 2004 2008 2012 2016 2020 2024 2028
Year
MW
winddiesel
30% of Wind
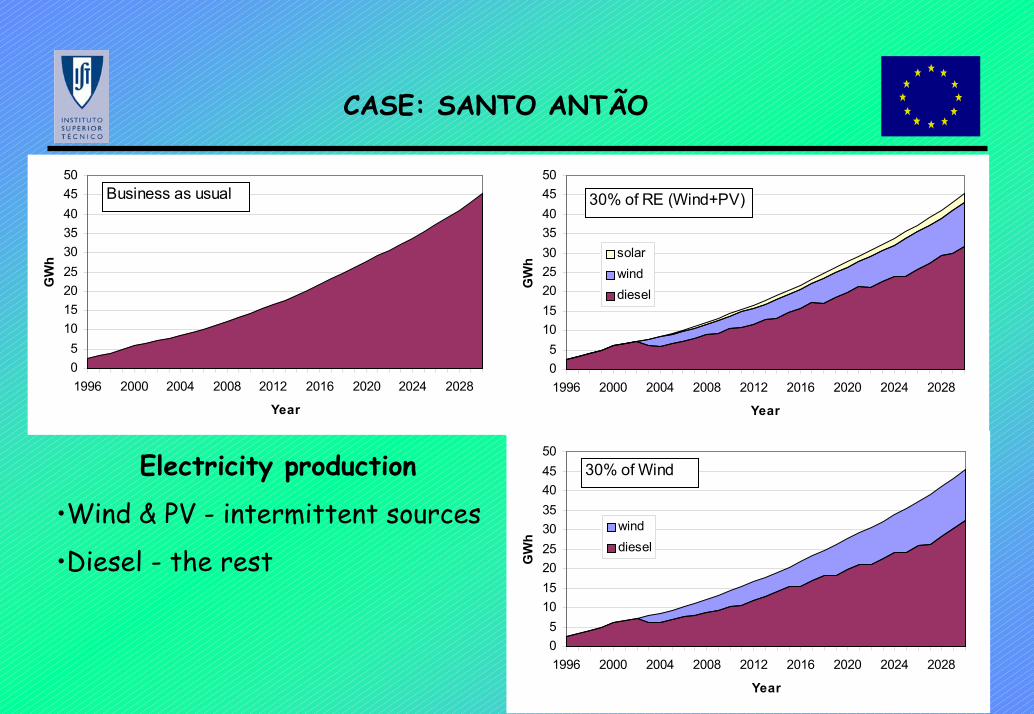
CASE: SANTO ANTÃO
Electricity production
•Wind & PV - intermittent sources
•Diesel - the rest
05
101520253035404550
1996 2000 2004 2008 2012 2016 2020 2024 2028
Year
GW
h
Business as usual
05
101520253035404550
1996 2000 2004 2008 2012 2016 2020 2024 2028
Year
GW
h
solarwinddiesel
30% of RE (Wind+PV)
05
101520253035404550
1996 2000 2004 2008 2012 2016 2020 2024 2028
Year
GW
hwinddiesel
30% of Wind
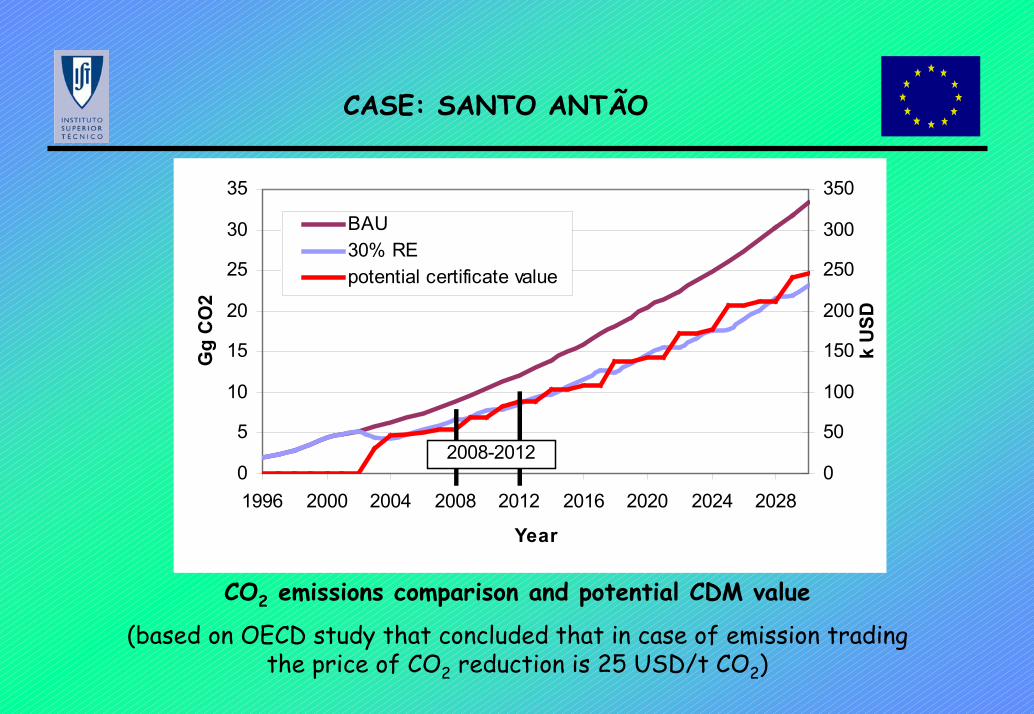
CASE: SANTO ANTÃO
CO2 emissions comparison and potential CDM value
(based on OECD study that concluded that in case of emission trading the price of CO2 reduction is 25 USD/t CO2)
0
5
10
15
20
25
30
35
1996 2000 2004 2008 2012 2016 2020 2024 2028
Year
Gg
CO
2
0
50
100
150
200
250
300
350
k U
SD
BAU30% REpotential certificate value
2008-2012

CASE: SANTO ANTÃO
Electricity cost:
Diesel (at 45% load) 8 US¢/kWhWind 7 US¢/kWhSolar PV 50 US¢/kWh

CASE: SANTO ANTÃO
• Santo Antão - wind + PV scenario is not viable with current costs
• CDM does not help much this scenario
• constant prices of RET0
2
4
6
8
10
12
14
16
1996 2000 2004 2008 2012 2016 2020 2024 2028Year
US˘
/kW
h
30% RE, w ind & solar PV30% RE, w ind & solar PV, including certif icatesBAU
Comparison of average electricity production price (1999 USD)
Scenarios 1-2: Business as usual and 30% RE, wind & solar PV

CASE: SANTO ANTÃO
• Santo Antão - wind scenario is not viable with current costs
• CDM could help to make it viable
• constant prices of RET0
2
4
6
8
10
12
14
16
1996 2000 2004 2008 2012 2016 2020 2024 2028Year
US˘
/kW
h
30% RE, w ind30% RE, w ind, including certif icatesBAU
Comparison of average electricity production price (1999 USD)
Scenarios 1 and 3: Business as usual and 30% wind

CASE: SANTO ANTÃO
• Most calculations of RET viability assume static relations between different technologies implied costs
• RET are extremely dynamic technologies costwise
Innovation brings fall in cost of RET
ABB: Renewable Energy, Status and Prospects, 1998

CASE: SANTO ANTÃO
• Scenarios 1, 2 and 4 - Influence of RET innovation
• Credibility of BAU as CDM baseline depends on declining prices
• Santo Antão - wind & PV scenario gets viable with falling prices
• CDM helps it to become viable sooner
• falling prices of RET -2% yearly price decline for wind and 5% price decline for PV
0
2
4
6
8
10
12
14
16
1996 2000 2004 2008 2012 2016 2020 2024 2028Year
USc
/kW
h
30% RE, w ind & solar PV
30% RE, falling prices30% RE, falling prices, including certif icates
BAU
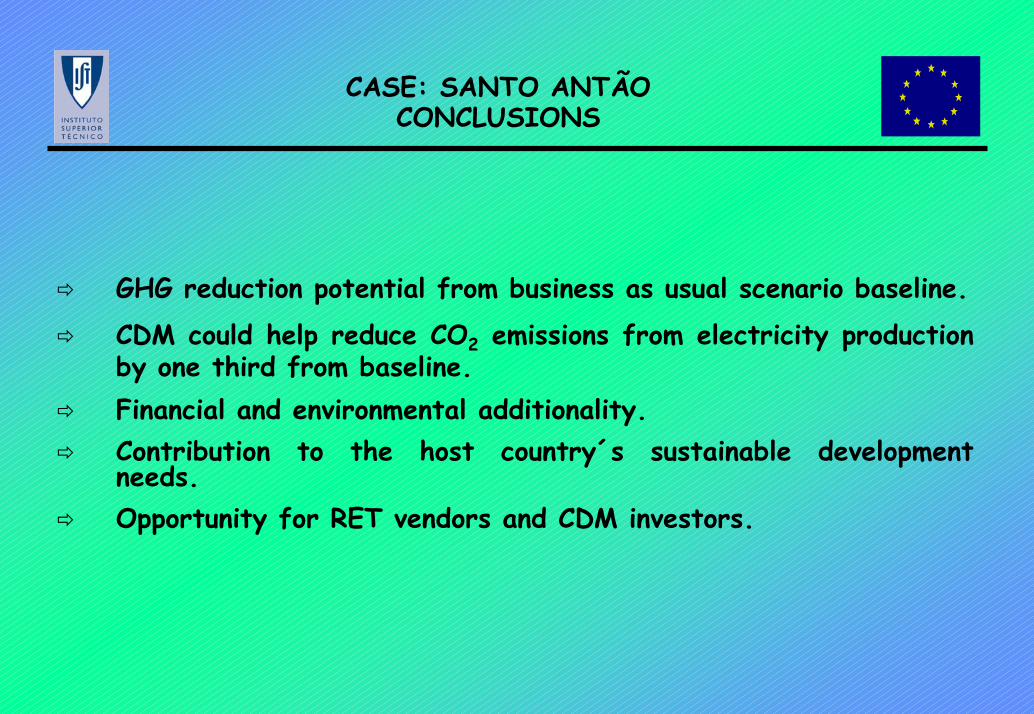
CASE: SANTO ANTÃOCONCLUSIONS
GHG reduction potential from business as usual scenario baseline.
CDM could help reduce CO2 emissions from electricity production by one third from baseline. Financial and environmental additionality. Contribution to the host country´s sustainable development needs.Opportunity for RET vendors and CDM investors.

CASE: SANTIAGO OBJECTIVES
showing particular case of the most populated island of Cape Verde, the island of Santiago.
showing potentials of assumed rules of CDM on influencing futureCO2 emissions.
showing the potentials for investment into RET and supply side energy efficiency technologies.
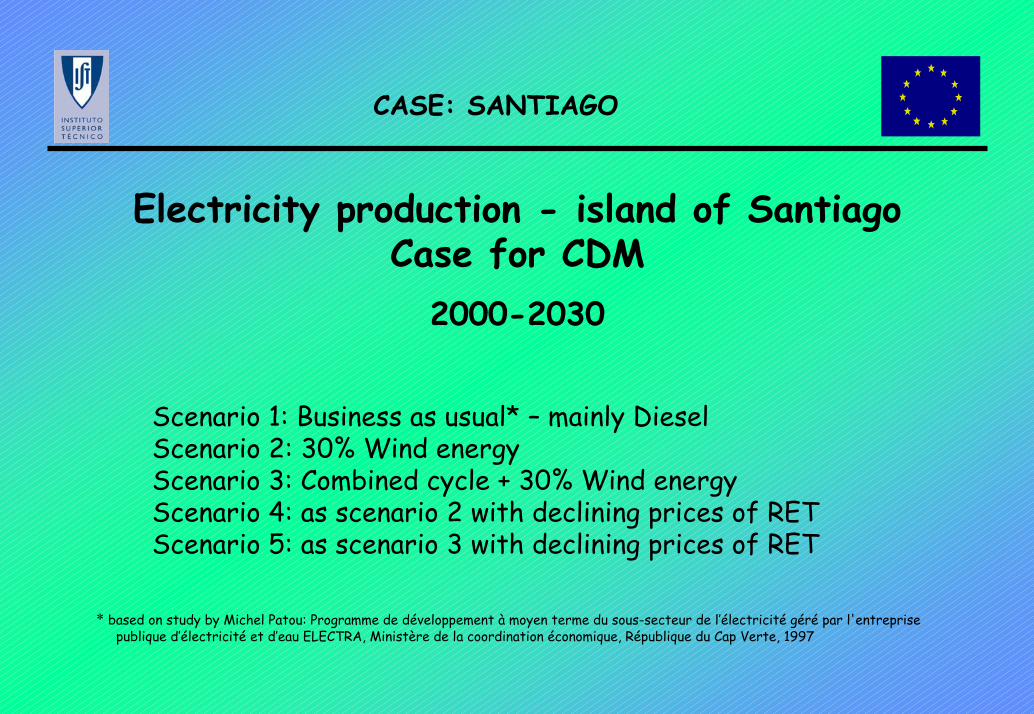
CASE: SANTIAGO
Electricity production - island of Santiago Case for CDM
2000-2030
Scenario 1: Business as usual* – mainly DieselScenario 2: 30% Wind energyScenario 3: Combined cycle + 30% Wind energyScenario 4: as scenario 2 with declining prices of RET Scenario 5: as scenario 3 with declining prices of RET
* based on study by Michel Patou: Programme de développement à moyen terme du sous-secteur de l’électricité géré par l'entreprise publique d’électricité et d’eau ELECTRA, Ministère de la coordination économique, République du Cap Verte, 1997

LEVELIZED ELECTRICITY COSTS IN PRAIA

CASE: SANTIAGO
The island of Santiago, Cape Verde
Santiago scenario 1996 2002 2030Population 206000 246000 436000Electricitypenetration 31% 37% 91%
Production [GWh] 46 97 1097Load peak [MW] 6.8 14.7 204
BAU 263 D
30% Wind 256 D+118 WInstalled capacity
[MW] Combinedcycle +30% Wind
10 D+0.9 W
30 D+2.7 W 164 D
+90 CC+118 W
Santiago scenario 1996 2010 2030Population 206000 293000 436000Electricitypenetration 31% 64% 91%
Production [GWh] 46 521 1100Load peak [MW] 6.8 33 204
BAU 50 D+2.7 W 263 D
30% Wind 50 D+20 W
256 D+118 WInstalled capacity
[MW] Combinedcycle +30% Wind
10 D+0.9 W 43 D
+10 CC+20 W
190 D+70 CC+118 W

CASE: SANTIAGO
Installed capacities
• Wind does not reduce significantly the installed diesel capacity needed
Business as usual
0
50
100
150
200
250
300
350
400
1996 2000 2004 2008 2012 2016 2020 2024 2028Year
Inst
alle
d [M
W]
WindDiesel
30% Wind
0
50
100
150
200
250
300
350
400
1996 2000 2004 2008 2012 2016 2020 2024 2028
Year
Inst
alle
d [M
W]
WindDiesel
Combined Cycle + 30% Wind
0
50
100
150
200
250
300
350
400
1996 2000 2004 2008 2012 2016 2020 2024 2028Year
Inst
alle
d [M
W]
WindDieselCombined

CASE: SANTIAGO
Electricity production
•Combined cycle - base load
•Diesel - peak load + reserve
Business as usual
0
200
400
600
800
1000
1200
1996 2000 2004 2008 2012 2016 2020 2024 2028
Year
Prod
uctio
n [G
Wh] Wind
Diesel
30% Wind
0
200
400
600
800
1000
1200
1996 2000 2004 2008 2012 2016 2020 2024 2028
Year
Prod
uctio
n [G
Wh]
WindDiesel
Combined cycle + 30% Wind
0
200
400
600
800
1000
1200
1996 2000 2004 2008 2012 2016 2020 2024 2028
Year
Prod
uctio
n [G
Wh]
WindDieselCombined
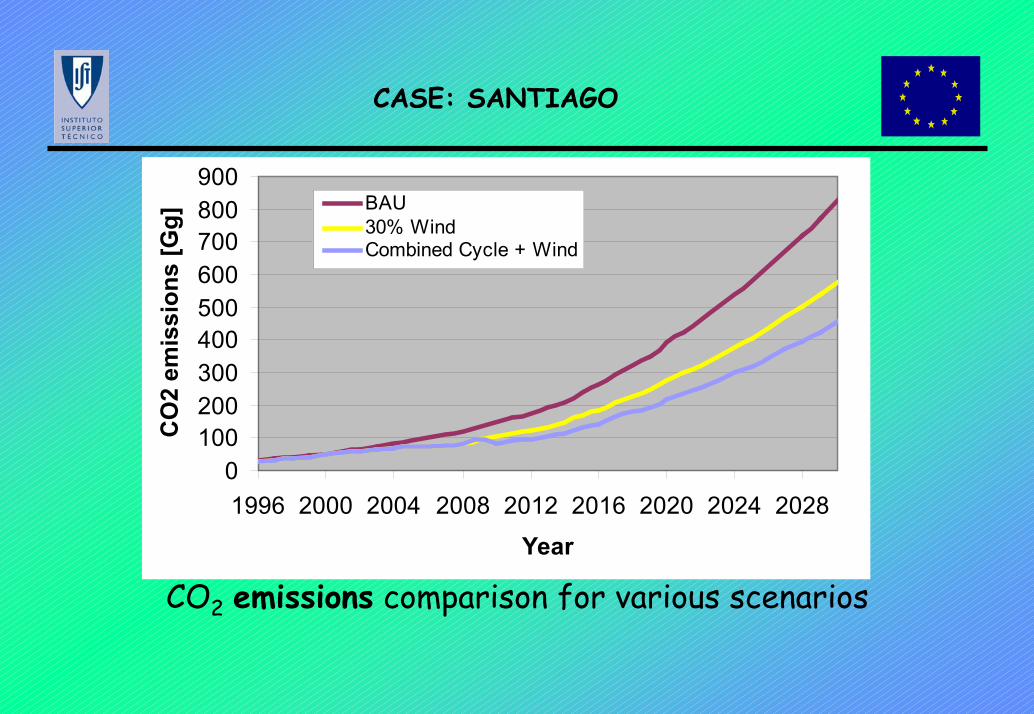
CASE: SANTIAGO
CO2 emissions comparison for various scenarios
0100200300400500600700800900
1996 2000 2004 2008 2012 2016 2020 2024 2028
Year
CO
2 em
issi
ons
[Gg]
BAU30% WindCombined Cycle + Wind
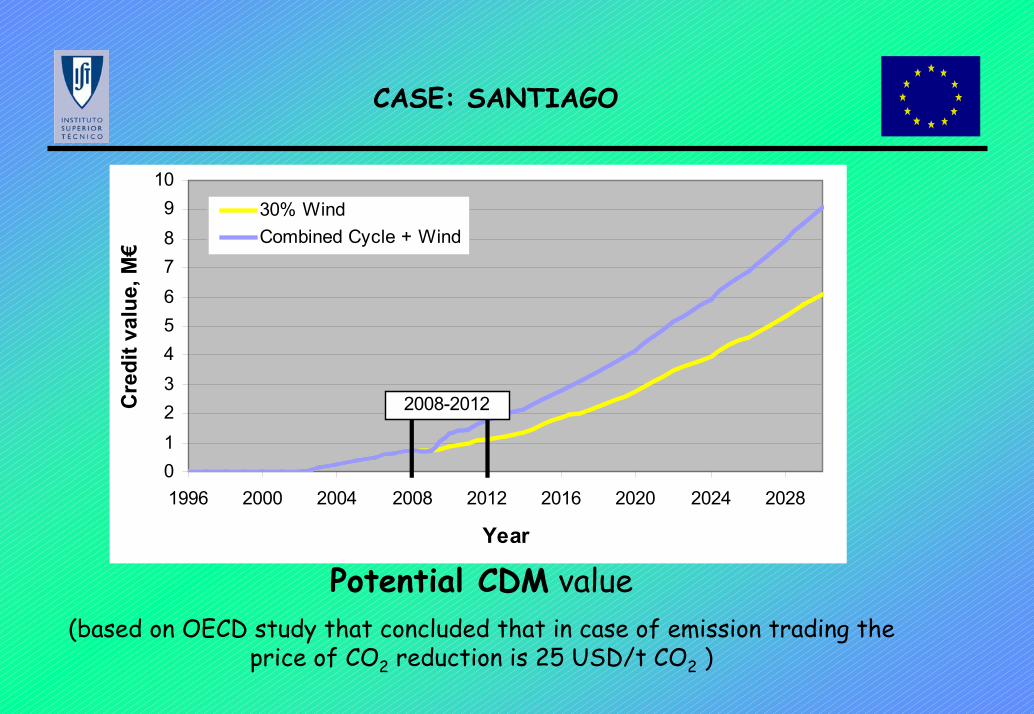
CASE: SANTIAGO
Potential CDM value(based on OECD study that concluded that in case of emission trading the
price of CO2 reduction is 25 USD/t CO2 )
0123456789
10
1996 2000 2004 2008 2012 2016 2020 2024 2028
Year
Cre
dit v
alue
, M€
30% WindCombined Cycle + Wind
2008-2012

CASE: SANTIAGO
Electricity cost:
Diesel 8 EU¢/kWhWind 9 EU¢/kWhCombined cycle 6 EU¢/kWh

CASE: SANTIAGO
• Santiago - wind is not viable with current costs
• Combined cycle will be viable later
• CDM could help wind to become viable
6.5
7.0
7.5
8.0
8.5
9.0
9.5
1995 2000 2005 2010 2015 2020 2025
Year
Ave
rage
ele
ctric
ity c
ost,
EU¢/
kWh
BAU30% WindCombined Cycle + Wind30% Wind + CDMCombined Cycle + Wind + CDM
Comparison of average electricity production price (1999 €)
Scenarios 1-3: Possible influence of CDM

CASE: SANTIAGO
6.5
7.0
7.5
8.0
8.5
9.0
9.5
1995 2000 2005 2010 2015 2020 2025
Year
Ave
rage
ele
ctric
ity c
ost,
EU¢/
kWh
BAU30% Wind30% Wind, DP30% Wind + CDM30% Wind + CDM, DP
6.5
7.0
7.5
8.0
8.5
9.0
9.5
1995 2000 2005 2010 2015 2020 2025
Year
Ave
rage
ele
ctric
ity c
ost,
EU¢/
kWh
BAUCombined Cycle + WindCombined Cycle + Wind, DPCombined Cycle + Wind + CDMCombined Cycle + Wind + CDM, DP
Scenarios 1, 2 and 4 Scenarios 1, 3 and 5
Influence of RET innovation - 1% declining prices for wind
Credibility of BAU as CDM baseline depends on declining prices
CASE: SANTIAGOCONCLUSIONS
CDM could help reduce CO2 emissions from electricity production to half baseline value.GHG reduction potential from business as usual scenario baseline.Financial and environmental additionality.Contribution to the host country´s sustainable development needs.Opportunity for RET vendors and CDM investors.

CASE: MOZAMBIQUE OBJECTIVES
showing particular case of the Least Developed Country, sparsely populated, with large distances, low energy consumption but richin resources.
discussing the assumed rules of CDM.
showing the potentials for investment into RET and supply side energy efficiency technologies.

MOZAMBIQUE SPECIAL CASE
Sparse population, large distances, low energy consumption, rich in resources - decentralised or integrated electricity system.
High price of small scale fossil fuel technology (diesel).
Mozambique
Competitiveness of large hydro energy.
Large hydro potential installed - 90% for export.
CASE: MOZAMBIQUE
Electricity production - Mozambique
Possible case for CDM
2000-2030
Scenario 1: Baseline – new power mainly DieselScenario 2: Natural gas – new power mainly GT or STScenario 3: Natural gas – new power mainly CC Scenario 4: Hydro - new power mainly coming from HPP
CASE: MOZAMBIQUE
0
5
10
15
20
25
30
1990 1995 2000 2005 2010 2015 2020 2025 2030
popu
laçã
o, m
ilhõe
sTotalUrbana
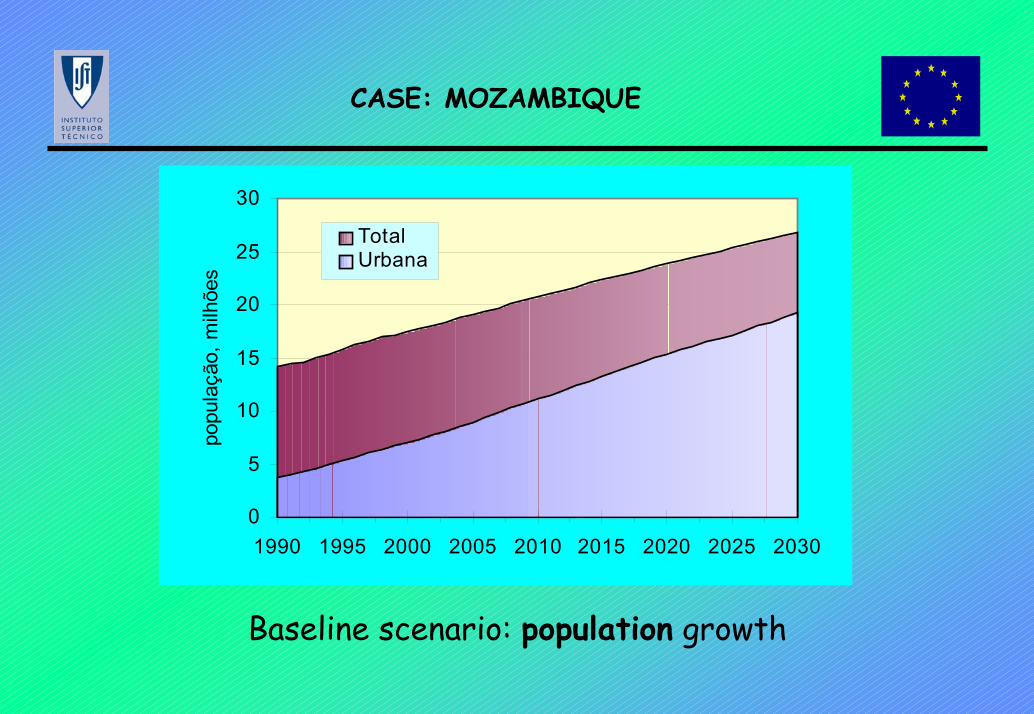
Baseline scenario: population growth

CASE: MOZAMBIQUE
0
500
1000
1500
2000
2500
3000
3500
4000
1990 1995 2000 2005 2010 2015 2020 2025 2030
PIB
PPP
, USD
/cap
0
20
40
60
80
PIB
PPP
, bilh
ões
USDPIB
PIB/cap
Baseline scenario: GDP PPP, and GDP/cap PPP
CASE: MOZAMBIQUE
0
2000
4000
6000
8000
10000
12000
14000
16000
1990 1995 2000 2005 2010 2015 2020 2025 2030
Con
s. d
e el
ectr
icid
ade,
GW
h
0
50
100
150
200
250
300
350
Con
s. fi
nal p
er c
apita
, kW
h/ca
p In
tens
idad
e, k
Wh/
100
USD
PIB
TotalFinalper capitaintensidade
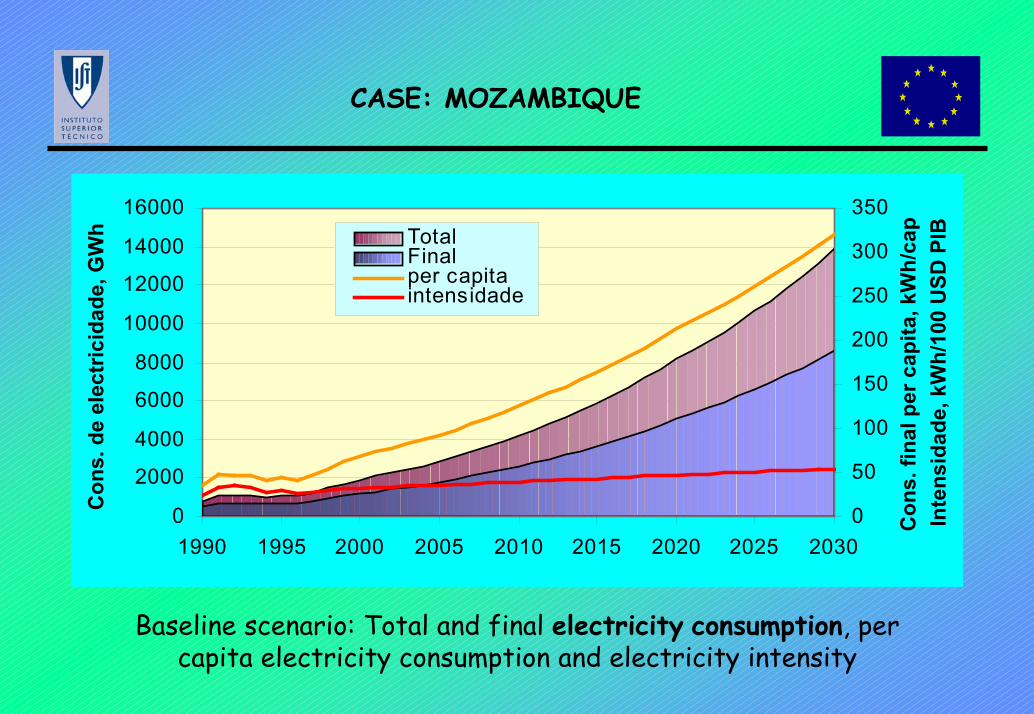
Baseline scenario: Total and final electricity consumption, per capita electricity consumption and electricity intensity
CASE: MOZAMBIQUE
0
2000
4000
6000
8000
10000
12000
14000
16000
1990 1995 2000 2005 2010 2015 2020 2025 2030
GW
h
ImportaçãoHídricaCarvãoGásGasóleo
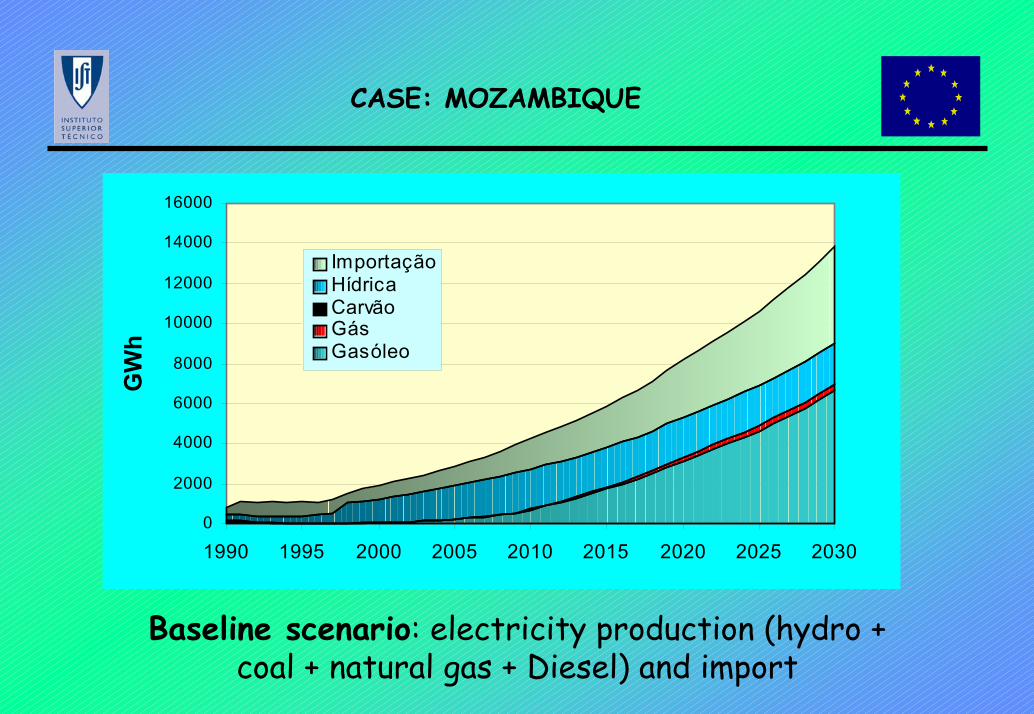
Baseline scenario: electricity production (hydro + coal + natural gas + Diesel) and import

CASE: MOZAMBIQUE
0
2000
4000
6000
8000
10000
12000
14000
16000
1990 1995 2000 2005 2010 2015 2020 2025 2030
GW
h
ImportaçãoHídricaCarvãoGásGasóleo
Natural gas scenario: electricity production (hydro + coal + natural gas + Diesel) and import
CASE: MOZAMBIQUE
0
2000
4000
6000
8000
10000
12000
14000
16000
1990 1995 2000 2005 2010 2015 2020 2025 2030
GW
h
ImportaçãoHídricaCarvãoGásGasóleo
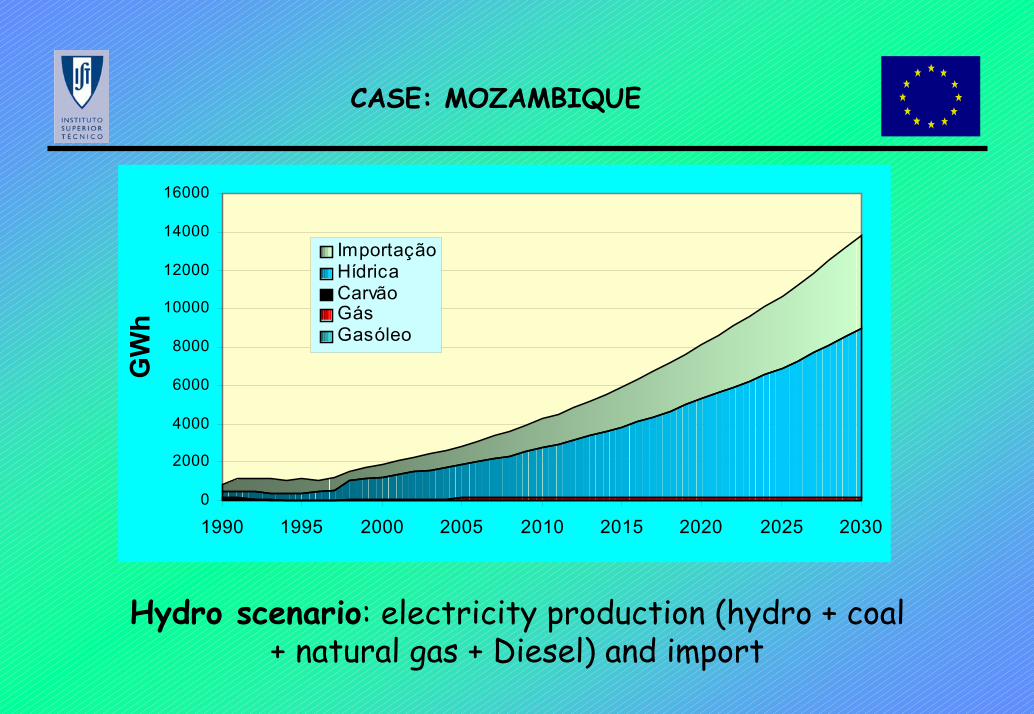
Hydro scenario: electricity production (hydro + coal + natural gas + Diesel) and import
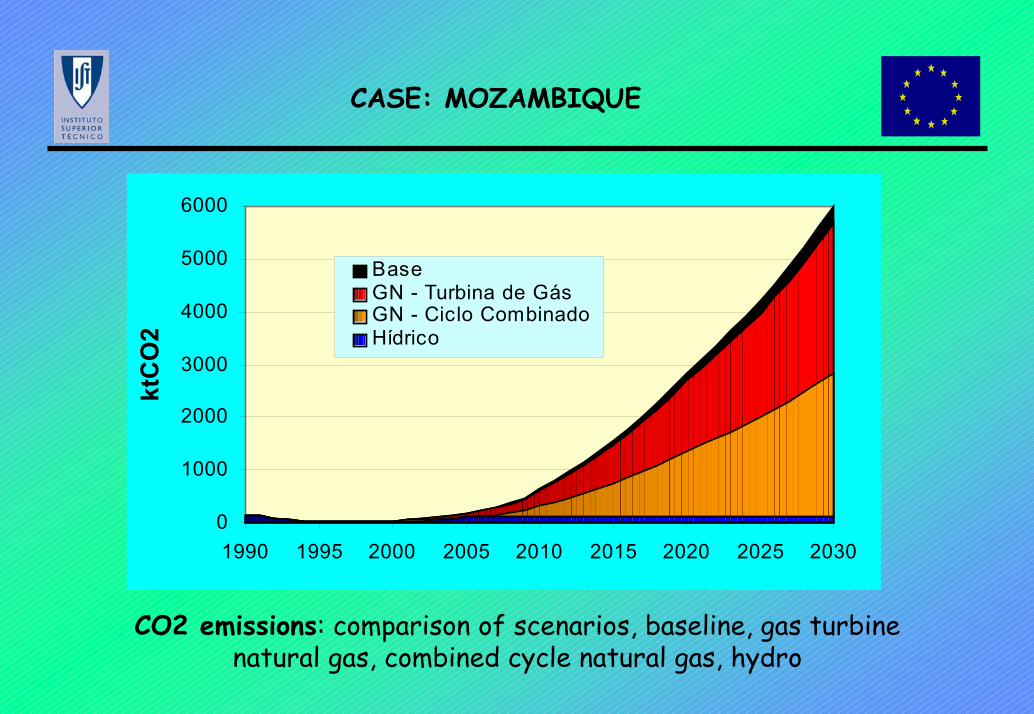
CASE: MOZAMBIQUE
0
1000
2000
3000
4000
5000
6000
1990 1995 2000 2005 2010 2015 2020 2025 2030
ktC
O2
BaseGN - Turbina de GásGN - Ciclo CombinadoHídrico
CO2 emissions: comparison of scenarios, baseline, gas turbine natural gas, combined cycle natural gas, hydro
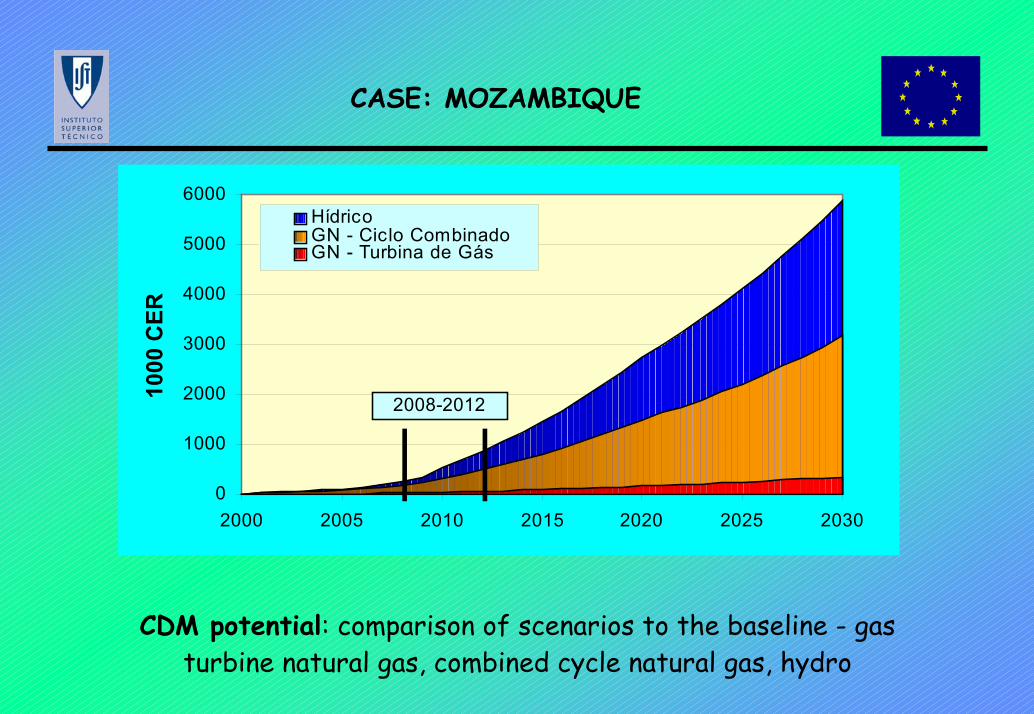
CASE: MOZAMBIQUE
0
1000
2000
3000
4000
5000
6000
2000 2005 2010 2015 2020 2025 2030
1000
CER
HídricoGN - Ciclo CombinadoGN - Turbina de Gás
2008-2012
CDM potential: comparison of scenarios to the baseline - gas turbine natural gas, combined cycle natural gas, hydro

CASE: MOZAMBIQUE
0
20
40
60
80
100
120
140
160
2000 2005 2010 2015 2020 2025 2030
MU
SDHídricoGN - Ciclo CombinadoGN - Turbina de Gás
2008-2012
Potential CDM value: comparison of scenarios to the baseline - gas turbine natural gas, combined cycle natural gas, hydro

CASE: MOZAMBIQUE
0
10
20
30
40
50
60
70
80
90
100
2000 2005 2010 2015 2020 2025 2030
MU
SD
HídricoGN - Ciclo CombinadoGN - Turbina de Gás
2008-2012
Potential CDM value (15 USD/tCO2): comparison of scenarios to the baseline - GT, CC, hydro

CASE: MOZAMBIQUECONCLUSIONS
Energy Planning methodology combined with consequences of the Kyoto Protocol were presented on the example of Mozambique.Additional advantage of integrated electricity system is higher share of cleaner energy technologies (CC + hydro) and the CDM potential.It is important for Mozambique that large Hydro be included in CDM.It is important for Mozambique that CDM does not include financial additionality condition.In case of using Natural Gas from the CDM point of view advantage is on Combined Cycle technology.Financial potential in CDM for energy projects.
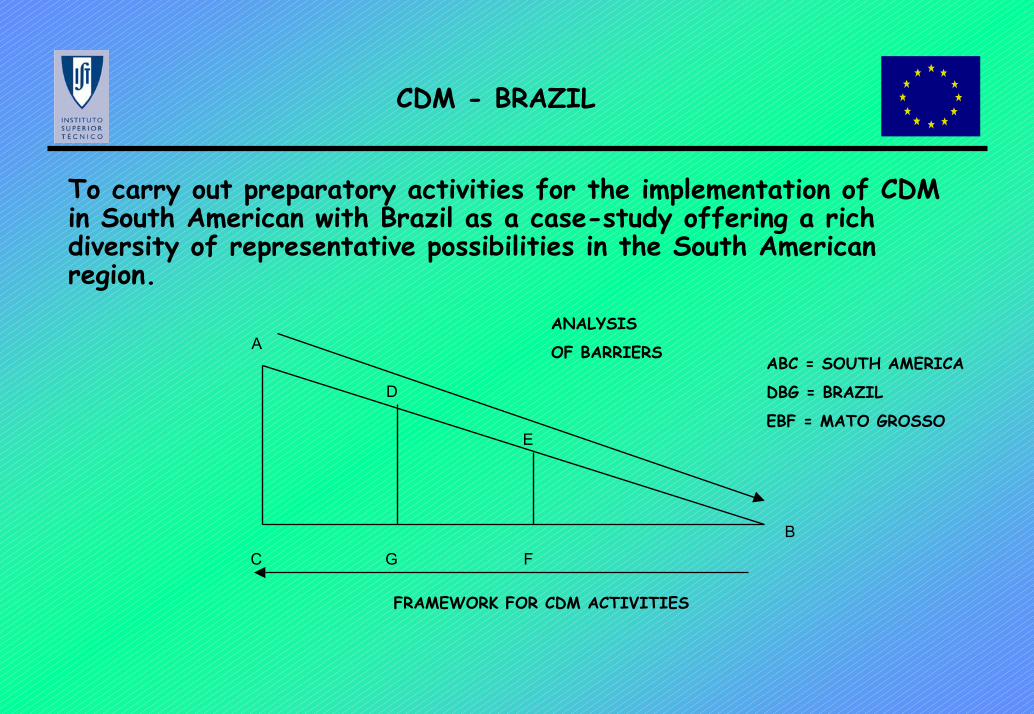
CDM - BRAZIL
To carry out preparatory activities for the implementation of CDM in South American with Brazil as a case-study offering a rich diversity of representative possibilities in the South American region.
D
E
ANALYSIS
OF BARRIERSABC = SOUTH AMERICA
DBG = BRAZIL
EBF = MATO GROSSO
A
B
C G F
FRAMEWORK FOR CDM ACTIVITIES

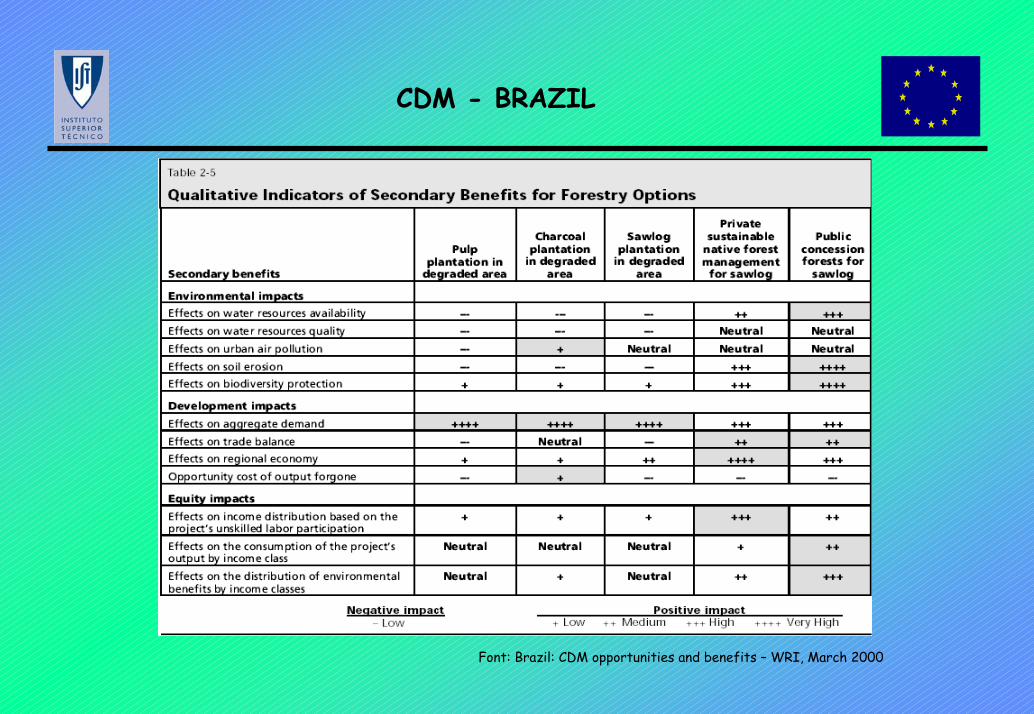
CDM - BRAZIL
Font: Brazil: CDM opportunities and benefits – WRI, March 2000
CDM - BRAZIL
Font: Brazil: CDM opportunities and benefits – WRI, March 2000

CONCLUSIONS
⇒Energy Planning should be done taking into account CDM.
⇒Large GHG reduction potential in Developing Countries.
⇒Opportunity for RET vendors and CDM investors.
⇒Contribution to the host country´s sustainable development needs.

CDM - WHERE TO GO FROM HERE
CDM is about:ENVIRONMENT, because it allows non-Annex I Parties to contribute to Kyoto objectives and assist Annex I Parties in meeting their emission limitation commitments;DEVELOPMENT, because it assist non-Annex I Parties in achieving sustainable development and in contributing to the ultimate objective of the UNFCCC;ECONOMY, because CDM projects create emission reduction units (ERUs) which can be purchased by Annex I Parties to contribute to their compliance with their emissions limitation obligations under the Protocol - CDM lowers compliance costs.
Recommended