1
Brewin et al.
1
THE CANADIAN GRAIN HANDLING SUPPLY CHAIN IN THE POST 1
CANADIAN WHEAT BOARD ERA 2
Derek Brewin 3
Dept. of Agribusiness and Agricultural Economics, University of Manitoba 5
Winnipeg, MB R3T 2N2 6
Ph. 204-474-8702 7
Fax: 204-261-7251 8
9
James Nolan 10
Dept. of Agricultural and Resource Economics, University of Saskatchewan 12
Saskatoon, SK Canada S7N 5A8 13
Ph. 306-966-8412 14
Fax: 306-966-8413 15
16
Richard Gray 17
Dept. of Agricultural and Resource Economics, University of Saskatchewan 19
Saskatoon, SK Canada S7N 5A8 20
Ph. 306-966-6512 21
Fax: 306-966-8413 22
23
Troy Schmitz 24
Morrison School of Agribusiness, Arizona State University 26
Mesa, AZ 85212 27
Ph. 480-727-1566 28
Fax: 480-727-1961 29
30
Andrew Schmitz 31
Dept. of Food and Resource Economics, University of Florida, P.O. Box 110240 33
Gainesville, FL 32611-0240 34
Ph. 352-294-7685 35
Fax: 352-846-0988 36
37
Date submitted – July 21, 2016. 38
Abstract – 87 words 39
Text – 4708 words 40
References – 951 words 41
4 figures and 3 tables 42
43
44

2
Brewin et al.
2
ABSTRACT 45
We explore firm behavior in the evolving Canadian grain handling sector. The current grain supply 46
chain for grain is characterized by regulatory shifts in one portion (rail) and full deregulation in 47
another portion (grain handling). Using several models of market structure, we offer that the current 48
system is likely hovering near a tipping point in market power for the grain companies. This situation 49
is in part driven by the potential for future deregulation of the railways, along with recent severe 50
production shocks in the supply chain. 51

3
Brewin et al.
3
INTRODUCTION 52
Canada’s grain production is concentrated in the northern prairie region of North America. Distances 53
in the Canadian grain supply chain are extreme, so it is very reliant on rail for transportation. The 54
grain industry in Canada moves a considerable amount of grain. Canada is expected to export about 55
39.7 million metric tonnes (mmt) of grain for the 2016/17 crop year (1). 56
The difference between the export price at port position and an average Prairie grain elevator price 57
(i.e. the “spread”) is known in Canada as the (export) basis. Basis measures how much producers pay 58
to get grain to port; the lower the basis, the better for farmers. Export bases for both wheat and canola 59
in Canada are estimated by the Quorum Corporation, acting as a monitor of the grain handling system 60
serving the Federal government. 61
At the end of the 2012/13 crop year, Quorum reported that the export basis for wheat was around 62
$54/t (2). However, by 2013/14 with a record grain crop being harvested, the wheat basis ultimately 63
increased to $133/t, a level never before seen. This basis level and the consequences of it on the 64
viability of the system led to a snap review by the Canadian government. This led to temporary 65
regulations in the system as overseen by the Minister of Agriculture and Agri-Food, including short 66
term car spot requirements as well as adjusted regulations to encourage rail competition for grain 67
moves (3). 68
The Canadian grain supply chain remains in major transition. A recent study suggested a competitive 69
outcome was achieved in the system over the transitional 2012/13 crop year, but subsequently the 70
system transitioned to a near cartel by 2013/14 (4). We analyze these markets by modeling grain 71
supply and demand relationships. Then we assess some game theoretic constructs that could be 72
applicable to the system, discussing these implications in the long run. 73
MOTIVATION AND INDUSTRY BACKGROUND 74
The dominant participants in Canada’s grain supply chain are farmers, grain companies, railways, 75
and finally grain companies (normally the same set of firms who buy grain on the Prairies) who 76
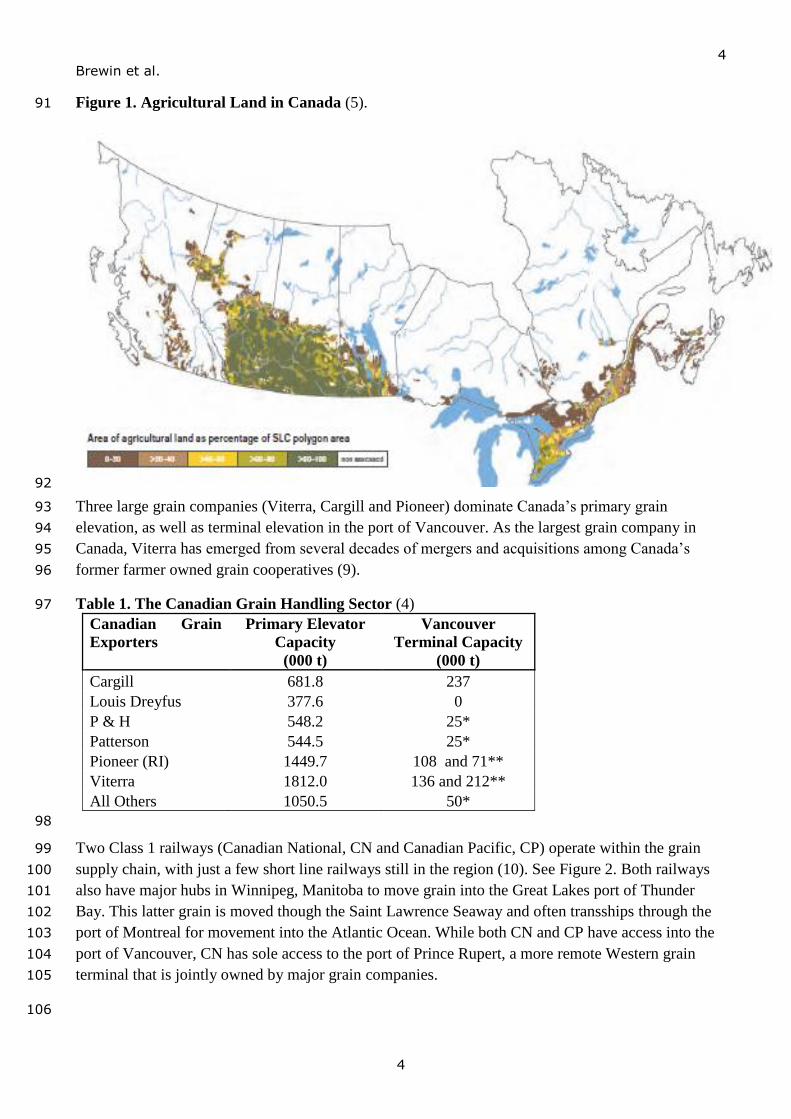
market Canadian grain to export buyers. About 82% of Canada’s crop land is located in the three 77
prairie provinces of Alberta, Saskatchewan and Manitoba (see Figure 1). By far the largest share of 78
agricultural exports (76%) come from wheat and canola grown on the Prairies (1). Large demand for 79
grains and oilseeds from Asia means much of the crop moves into export position through the port of 80
Vancouver. Table 1 lists the shares of interior primary elevator capacity in Canada, as well as port 81
terminal capacity in the primary port of Vancouver. 82
About 70,000 farms earn at least some of their income from grain and oilseed sales (6). Recent data 83
show that in Alberta, Saskatchewan and Manitoba, the average farm size is about 473, 675 and 460 84
hectares respectively (7). For example, a typical (Manitoba) grain farm has variable costs of about 85
$496 per hectare for wheat, with average yields of about 3.7 tonnes per hectare (8). Farmers plant 86
seed and fertilize in the spring, control weeds and irrigate (if available) in the summer and harvest 87
grain in the fall. Most of the grain harvested goes into on farm storage and is later moved (by truck) 88
once sold from the farm to the elevator. 89
90
4
Brewin et al.
4
Figure 1. Agricultural Land in Canada (5). 91
92
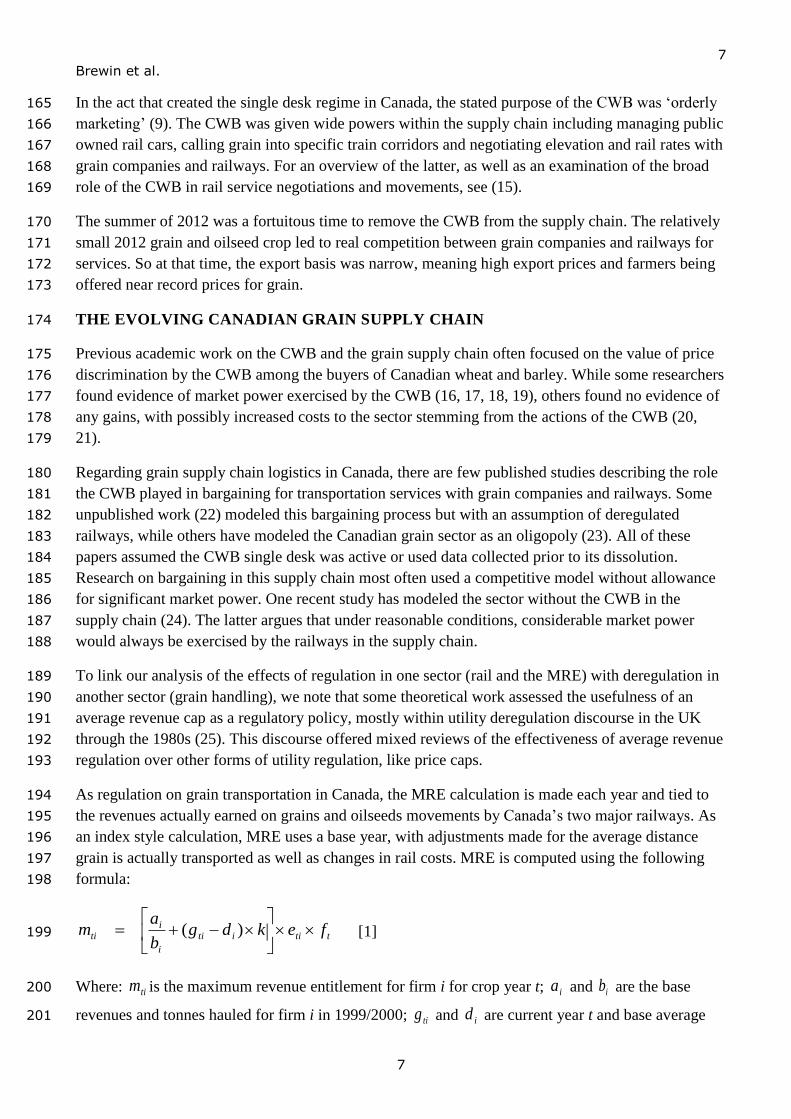
Three large grain companies (Viterra, Cargill and Pioneer) dominate Canada’s primary grain 93
elevation, as well as terminal elevation in the port of Vancouver. As the largest grain company in 94
Canada, Viterra has emerged from several decades of mergers and acquisitions among Canada’s 95
former farmer owned grain cooperatives (9). 96
Table 1. The Canadian Grain Handling Sector (4) 97
Canadian Grain
Exporters
Primary Elevator
Capacity
(000 t)
Vancouver
Terminal Capacity
(000 t)
Cargill 681.8 237
Louis Dreyfus 377.6 0
P & H 548.2 25*
Patterson 544.5 25*
Pioneer (RI) 1449.7 108 and 71**
Viterra 1812.0 136 and 212**
All Others 1050.5 50*
98
Two Class 1 railways (Canadian National, CN and Canadian Pacific, CP) operate within the grain 99
supply chain, with just a few short line railways still in the region (10). See Figure 2. Both railways 100
also have major hubs in Winnipeg, Manitoba to move grain into the Great Lakes port of Thunder 101
Bay. This latter grain is moved though the Saint Lawrence Seaway and often transships through the 102
port of Montreal for movement into the Atlantic Ocean. While both CN and CP have access into the 103
port of Vancouver, CN has sole access to the port of Prince Rupert, a more remote Western grain 104
terminal that is jointly owned by major grain companies. 105
106

5
Brewin et al.
5
Figure 2. Railway Network of Western Canada (11). 107
108
109
REGULATORY ISSUES IN THE CANADIAN GRAIN HANDLING SYSTEM 110
As part of the set of incentives to encourage individuals to settle western Canada in the late 1800’s, a 111
guaranteed “Crow Rate” was negotiated between the new Canadian Pacific Railway and the Federal 112
Government of Canada (10). This fixed low rates for grain and settlers’ goods in exchange for 113
mineral rights in the Crow’s Nest Pass in the Rocky Mountains. The Canadian National railway was 114
formed by the government as a crown corporation in 1917. CN also had to offer low rates for grain 115
movement, so the Crow’s Nest Pass rates were made statutory, by 1925 applying to all Canadian 116
railways. These statutory rates were gradually eliminated through regulatory reforms in 1985 (the 117
Western Grain Transportation Act); 1987 (the National Transportation Act); 1995 (Canadian 118
Transportation Act) and finally again in 1999 (as an amendment to the Canadian Transportation Act). 119
A rate cap for grain movement was applied as part of the 1996 Act for grain grown in Western 120
Canada. Under the rate cap, the maximum allowable rates for export-bound grain were prescribed 121
according to distance. While the cap was structured such that freight rates could theoretically be set 122
freely below the cap, upwards of 90% of rates under the rate cap regime were set at the maximum 123
allowable level (12). The major impact of this regulatory regime was that an average grain haul cost 124
shippers more than twice as much as under the former Crow regime. 125

6
Brewin et al.
6
In June 2000, Bill C-34 became law. This was a modification of the extant Canada Transportation 126
Act, stemming directly from an extensive system review process. Recommendation 7 from that 127
review recommended removal of the rate cap policy to be replaced with some form of regulation on 128
railway grain revenues. In effect, Bill C-34 replaced rate regulation with a policy known as the 129
maximum revenue entitlement (MRE). As designed, the MRE policy was intended to offset railway 130
market power but also give the railways more pricing flexibility than under the rate cap. 131
The MRE is a novel regulatory policy in transportation. It is effectively a cap on average revenue per 132
tonne for grain movement while allowing some price discrimination. The novelty of MRE meant that 133
it took some time for railways to fully understand how to make it work to their advantage (13). But 134
foremost, what was clear to the railways under MRE was the need to continually identify cost 135
reductions in grain movement in order to sustain or grow profitability. Under the MRE regime, 136
Canadian railways turned to new mechanisms to create cost efficiencies and generate greater profits. 137
One of the first such mechanisms was the development of grain car bidding programs, similar to the 138
Advance Ordering Systems or AOS developed in the US (13, 14). However until very recently and 139
for several reasons, grain bid car schemes have been put on the backburner in Canada. Bid car 140
programs are still used extensively for grain movement in the US, but with no revenue regulation. 141
Another method for generating cost savings in the MRE era has been the development of unit trains 142
for grain movement. If a shipper can assemble large volumes of grain, this can result in a very cost 143
efficient use of locomotives and crew. This engineering-based cost saving is why railways began to 144
offer reduced freight rates for 50 and 100 car blocks of grain cars. In addition, both major Canadian 145
railways continue to offer “shuttle” discounts, defined as long trains that move as a unit from a single 146
delivery point to export position and back again. All of these discounts typically fall somewhere 147
between 5 to 20 percent of what would be charged on a reference standard single car quoted rate. 148
Rate discounts represent some sharing with shippers of cost efficiencies associated with assembling a 149
unit train. However, because under the MRE average freight rates for a given year do not change, 150
smaller shippers delivering fewer grain cars often pay higher rates, effectively offsetting lower rates 151
to larger shippers who can deliver more grain cars. Judging by their continued use, under MRE large 152
unit train incentives remain important to rail operations and grain transportation planning. 153
No matter how long the MRE remains in place, it has forced the railways to seek additional cost 154
economies, generating incentives to assemble large unit grain trains. What is not well established at 155
present is the total amount of logistics and transportation cost savings a railway obtains from by 156
moving unit trains, and by extension, what portion of this total cost saving is passed on to other 157
participants in the supply chain. 158
Another major regulatory intervention in Canada’s grain supply chain was the Canadian Wheat 159
Board (CWB). The CWB was created in 1935 to coordinate wheat and barley marketing/movement 160
for Canada (9). From 1943 to 2012 the CWB was the ‘single desk’ marker of Canadian wheat and 161
barley for export or domestic human use. The CWB was never allowed to curtail farm production and 162
operated as a non-profit, and some of the justification for the CWB came from its ability to price 163
discriminate to major buyers of Canadian wheat. 164
7
Brewin et al.
7
In the act that created the single desk regime in Canada, the stated purpose of the CWB was ‘orderly 165
marketing’ (9). The CWB was given wide powers within the supply chain including managing public 166
owned rail cars, calling grain into specific train corridors and negotiating elevation and rail rates with 167
grain companies and railways. For an overview of the latter, as well as an examination of the broad 168
role of the CWB in rail service negotiations and movements, see (15). 169
The summer of 2012 was a fortuitous time to remove the CWB from the supply chain. The relatively 170
small 2012 grain and oilseed crop led to real competition between grain companies and railways for 171
services. So at that time, the export basis was narrow, meaning high export prices and farmers being 172
offered near record prices for grain. 173
THE EVOLVING CANADIAN GRAIN SUPPLY CHAIN 174
Previous academic work on the CWB and the grain supply chain often focused on the value of price 175
discrimination by the CWB among the buyers of Canadian wheat and barley. While some researchers 176
found evidence of market power exercised by the CWB (16, 17, 18, 19), others found no evidence of 177
any gains, with possibly increased costs to the sector stemming from the actions of the CWB (20, 178
21). 179
Regarding grain supply chain logistics in Canada, there are few published studies describing the role 180
the CWB played in bargaining for transportation services with grain companies and railways. Some 181
unpublished work (22) modeled this bargaining process but with an assumption of deregulated 182
railways, while others have modeled the Canadian grain sector as an oligopoly (23). All of these 183
papers assumed the CWB single desk was active or used data collected prior to its dissolution. 184
Research on bargaining in this supply chain most often used a competitive model without allowance 185
for significant market power. One recent study has modeled the sector without the CWB in the 186
supply chain (24). The latter argues that under reasonable conditions, considerable market power 187
would always be exercised by the railways in the supply chain. 188
To link our analysis of the effects of regulation in one sector (rail and the MRE) with deregulation in 189
another sector (grain handling), we note that some theoretical work assessed the usefulness of an 190
average revenue cap as a regulatory policy, mostly within utility deregulation discourse in the UK 191
through the 1980s (25). This discourse offered mixed reviews of the effectiveness of average revenue 192
regulation over other forms of utility regulation, like price caps. 193
As regulation on grain transportation in Canada, the MRE calculation is made each year and tied to 194
the revenues actually earned on grains and oilseeds movements by Canada’s two major railways. As 195
an index style calculation, MRE uses a base year, with adjustments made for the average distance 196
grain is actually transported as well as changes in rail costs. MRE is computed using the following 197
formula: 198
ttiiti
i
iti fekdg
b
am
)( [1] 199
Where: tim is the maximum revenue entitlement for firm i for crop year t; ia and ib are the base 200
revenues and tonnes hauled for firm i in 1999/2000; tig and id are current year t and base average 201

8
Brewin et al.
8
distance hauled for firm i; k is a constant derived from base costs of transporting grain longer 202
average distances; tie is the number of tonnes moved in year t by firm i; and tf is a cost adjustment 203
factor for the current year t that accounts for price changes across a range of major inputs used by the 204
railways. 205
According to (26), average grain haul distance has not changed significantly since the 206
implementation of the MRE, so we conclude there have been no systematic changes to move grain 207
longer or shorter distances on average. There have been significant adjustments to the cost factor in 208
the calculation, but this part of the calculation is beyond the control of the railways. For these reasons 209
let us ignore the terms tig , id , k and tf in the following discussion. To operationalize the MRE as a 210
constraint to a monopoly railway, tim can be interpreted as a constraint on the profit maximizing firm. 211
We will assume only two grain companies supply the railway and they generate different costs. In the 212
base year, average rates to move grain were fixed by the federal government and the volume moved 213
by the grain companies were part of car allocation schemes managed at that time by the CWB. Thus 214
the individual railways profit maximization can be described as choosing optimal amounts sourced 215
from either of two shippers (grain companies 1 and 2) with different cost structures: 216
ttq
tt
ttttm
tt
tt
ttttti
qqqqq
qpqp
qpqp
qcqcqq
qpqpL
21
21
2211
2010
200100
2211
21
2211
[2] 217
Where: tiL is the Lagrange value function for firm i for crop year t; jtp and jtq are the prices and 218
quantities for the grain shipper j in crop year t and base year is equal to 0, m and q are the shadow 219
values of the revenue cap and the fixed supply of grain to haul ( q ) and jc is the cost to the railway 220
of shipping from grain company j. 221
Note that if the costs are fixed for each shipper and 21 cc , the constrained profit is linear and 222
maximized when all of q is shipped to the lower cost shipper (#2), and the price of rail services is 223
the same as the base price 0p . 224
Given these broad railway incentives associated with the MRE policy, it is important to note that 225
while the role of the former CWB in grain handling and transportation was significant, in fact very 226
little academic research formally analyzed their potential contribution as a “countervail” to both 227
railway and grain company behavior. In this section, we motivate other models to better understand 228
the role played by the CWB in the supply chain. 229
Grain companies are now playing a more significant role. It has been suggested that grain companies 230
in Canada have now priced their services in the post-CWB era at near cartel levels (4). This situation 231
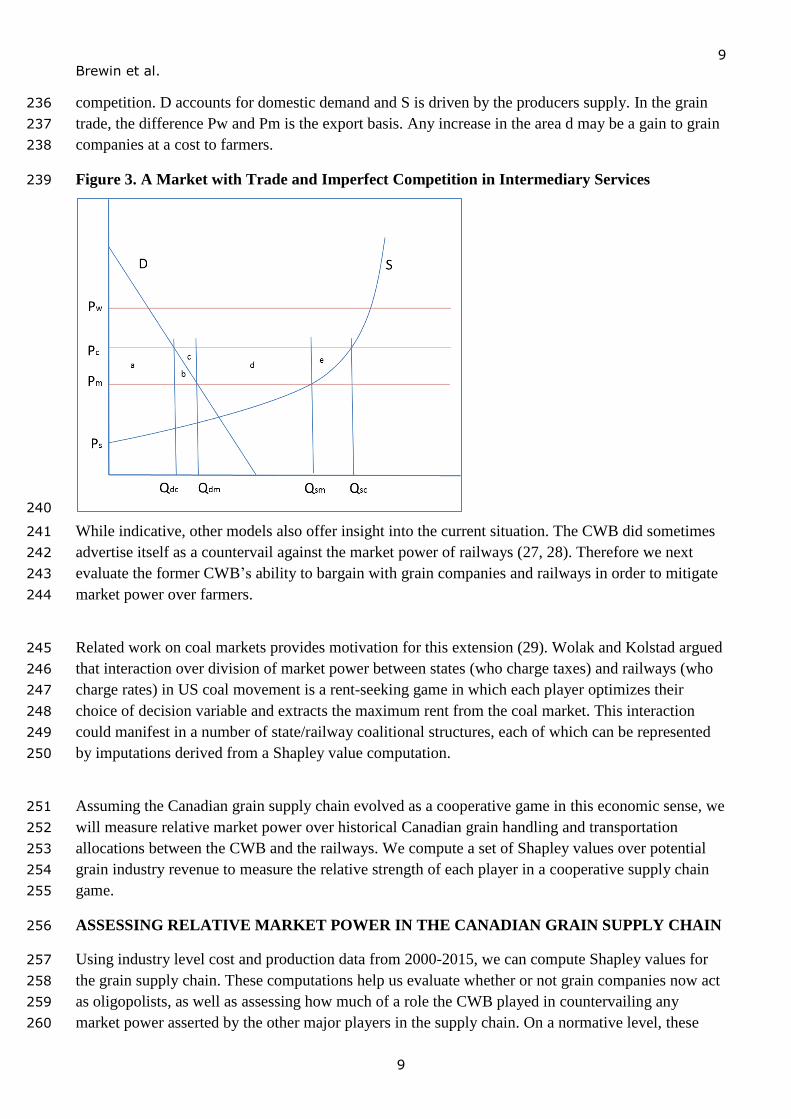
is illustrated in Figure 3. Pw is the world price available at the port, while Pc is the price offered to 232
domestic producers if the internal market chain is competing or free of regulatory distortions, and is 233
equal to Pw less the cost of moving goods through the chain. Pm is any price offered by handlers that 234
is lower than the world price, less their real costs. The difference between Pc and Pm is a measure of 235
9
Brewin et al.
9
competition. D accounts for domestic demand and S is driven by the producers supply. In the grain 236
trade, the difference Pw and Pm is the export basis. Any increase in the area d may be a gain to grain 237
companies at a cost to farmers. 238
Figure 3. A Market with Trade and Imperfect Competition in Intermediary Services 239
240
While indicative, other models also offer insight into the current situation. The CWB did sometimes 241
advertise itself as a countervail against the market power of railways (27, 28). Therefore we next 242
evaluate the former CWB’s ability to bargain with grain companies and railways in order to mitigate 243
market power over farmers. 244
Related work on coal markets provides motivation for this extension (29). Wolak and Kolstad argued 245
that interaction over division of market power between states (who charge taxes) and railways (who 246
charge rates) in US coal movement is a rent-seeking game in which each player optimizes their 247
choice of decision variable and extracts the maximum rent from the coal market. This interaction 248
could manifest in a number of state/railway coalitional structures, each of which can be represented 249
by imputations derived from a Shapley value computation. 250
Assuming the Canadian grain supply chain evolved as a cooperative game in this economic sense, we 251
will measure relative market power over historical Canadian grain handling and transportation 252
allocations between the CWB and the railways. We compute a set of Shapley values over potential 253
grain industry revenue to measure the relative strength of each player in a cooperative supply chain 254
game. 255
ASSESSING RELATIVE MARKET POWER IN THE CANADIAN GRAIN SUPPLY CHAIN 256
Using industry level cost and production data from 2000-2015, we can compute Shapley values for 257
the grain supply chain. These computations help us evaluate whether or not grain companies now act 258
as oligopolists, as well as assessing how much of a role the CWB played in countervailing any 259
market power asserted by the other major players in the supply chain. On a normative level, these 260

10
Brewin et al.
10
findings will shed light as to whether or not recent policies enacted in the grain handling sector have 261
been appropriate for ensuring that farmers get a “fair” share of rents that accrue to the grain supply 262
chain. 263
Table 2 lists relative shares of export values from 2000/01 to 2014/15. We are assuming that the 264
CWB is one player in a supply chain game, with the railways and grain companies also attempting to 265
manipulate grain movement and handling services. Note how the MRE era has seen rail rates 266
relatively static over time, while the grain companies have seen their relative value shares grow, 267
especially since the CWB left in 2012. Revenue division in the system changed over time because 268
system participants altered their behaviour over time. 269
Table 2. Approximate Shares of the Export Price of Wheat, 2000 to 20151 270
Average
rates Rail Rate Grain Co
CWB/Farmer
2000-2001 $ 25.8 $ 28.8 $ 154.8
2001-2002 $ 25.3 $ 27.6 $ 167.3
2002-2003 $ 24.5 $ 26.4 $ 198.3
2003-2004 $ 25.7 $ 31.4 $ 160.3
2004-2005 $ 25.9 $ 29.6 $ 152.3
2005-2006 $ 27.9 $ 34.0 $ 141.2
2006-2007 $ 29.8 $ 33.4 $ 156.0
2007-2008 $ 28.2 $ 39.4 $ 314.3
2008-2009 $ 30.9 $ 35.8 $ 253.1
2009-2010 $ 28.8 $ 37.1 $ 181.1
2010-2011 $ 30.6 $ 42.8 $ 286.2
2011-2012 $ 31.4 $ 43.4 $ 268.4
2012-2013 $ 34.0 $ 19.5 $ 275.3
2013-2014 $ 33.6 $ 98.8 $ 194.7
2014-2015 $ 35.3 $ 88.9 $ 199.2
271
GRAIN INDUSTRY DATA 272
As evidence of market power exertion, Equation [2] also suggests that under the MRE, the supply 273
chain should ultimately abandon more costly shipping points. Rail line abandonment began under the 274
former WGTA, but shifts in the sector that have occurred between the 1999/2000 crop year and 275
2014/15 are notable (26). For example, there have been: 276
67% reduction in primary elevators in Western Canada, from 976 to 326 elevators 277
1% increase in total storage capacity of all elevators, from 1.60 to 1.64 million tonnes 278
38% increase in turnover rate for the primary elevators, from 4.8 to 6.6 turns 279
98% increase in turnover rate for terminals, from 9.1 to 17.1 turns 280
67% increase in share of grain car rail movements in lots over 50 cars, from 50.4% to 84.2% 281
147% increase in total volume moved by rail, from 12.9 to 31.9 million tonnes 282
1 Sources: Canadian Transportation Agency revenue cap data (various years), Quorum Corporation reports
(various years).
11
Brewin et al.
11
111% increase in average incentives for 50 or more car movements, from $3.54 to $7.47/tn. 283
284
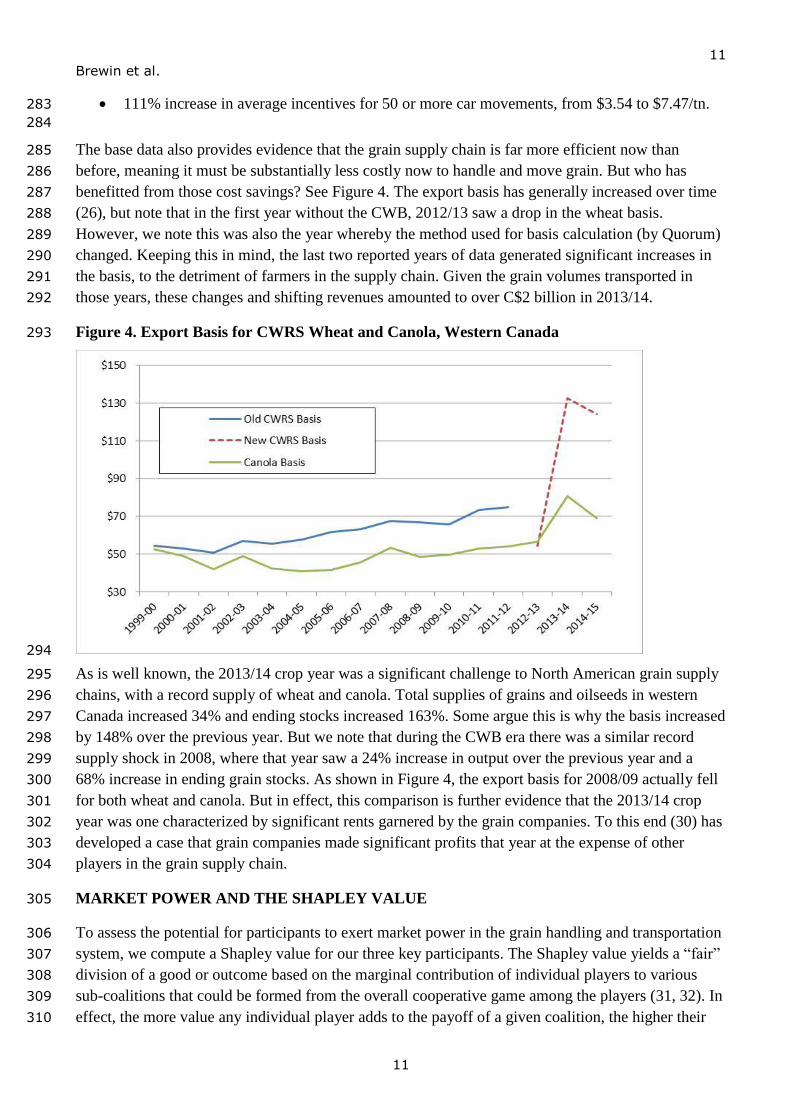
The base data also provides evidence that the grain supply chain is far more efficient now than 285
before, meaning it must be substantially less costly now to handle and move grain. But who has 286
benefitted from those cost savings? See Figure 4. The export basis has generally increased over time 287
(26), but note that in the first year without the CWB, 2012/13 saw a drop in the wheat basis. 288
However, we note this was also the year whereby the method used for basis calculation (by Quorum) 289
changed. Keeping this in mind, the last two reported years of data generated significant increases in 290
the basis, to the detriment of farmers in the supply chain. Given the grain volumes transported in 291
those years, these changes and shifting revenues amounted to over C$2 billion in 2013/14. 292
Figure 4. Export Basis for CWRS Wheat and Canola, Western Canada 293
294
As is well known, the 2013/14 crop year was a significant challenge to North American grain supply 295
chains, with a record supply of wheat and canola. Total supplies of grains and oilseeds in western 296
Canada increased 34% and ending stocks increased 163%. Some argue this is why the basis increased 297
by 148% over the previous year. But we note that during the CWB era there was a similar record 298
supply shock in 2008, where that year saw a 24% increase in output over the previous year and a 299
68% increase in ending grain stocks. As shown in Figure 4, the export basis for 2008/09 actually fell 300
for both wheat and canola. But in effect, this comparison is further evidence that the 2013/14 crop 301
year was one characterized by significant rents garnered by the grain companies. To this end (30) has 302
developed a case that grain companies made significant profits that year at the expense of other 303
players in the grain supply chain. 304
MARKET POWER AND THE SHAPLEY VALUE 305
To assess the potential for participants to exert market power in the grain handling and transportation 306
system, we compute a Shapley value for our three key participants. The Shapley value yields a “fair” 307
division of a good or outcome based on the marginal contribution of individual players to various 308
sub-coalitions that could be formed from the overall cooperative game among the players (31, 32). In 309
effect, the more value any individual player adds to the payoff of a given coalition, the higher their 310

12
Brewin et al.
12
relative position within the game and the greater their individual Shapley value. Formally, the 311
Shapley value for an n-player cooperative game is computed in the following way (33, 34); 312
Shap. Val. = Σ ζn(S)[ υ(S U{i}) - υ(S)] [3] 313
where ζn(S) is a weighting factor representing the likelihood that one of the players joins existing 314
coalition S and υ(.) is a general value function, defined by the specific game payoffs. The second 315
term in the Shapley computation is the marginal contribution to the value of the coalition which 316
includes the ith player to the coalition formerly defined by S (excluding player i, by definition). The 317
weighting or probability factor ζn(S) is essentially a combinatorical representation of how an n-player 318
coalition can be formed. This weighting factor is; 319
ζn(S) = [(s! (n-s-1)!)/n!] [4] 320
The data from Table 2 are used to compute Shapley values among supply chain participants. We 321
calculated vertical shares of export values in the grain supply chain. We note that in a system where 322
each set of firms relies on the same volume moving through a vertical chain, Shapley values will 323
ultimately collapse into the vertical share of the final price. But knowing this, if we assume that a 324
type of cooperative game is being played among the industry participants over grain export values, 325
our computed share value does indicate the relative coalitional strength of each participant in the 326
supply chain. 327
Table 3. Vertical Shares of Total Export Values for Wheat (f is for farmers without CWB) 328
Crop year CWB Railways Gran Co.
2000-2001 0.74 0.12 0.14
2001-2002 0.76 0.11 0.13
2002-2003 0.80 0.10 0.11
2003-2004 0.74 0.12 0.14
2004-2005 0.73 0.12 0.14
2005-2006 0.70 0.14 0.17
2006-2007 0.71 0.14 0.15
2007-2008 0.82 0.07 0.10
2008-2009 0.79 0.10 0.11
2009-2010 0.73 0.12 0.15
2010-2011 0.80 0.09 0.12
2011-2012 0.78 0.09 0.13
2012-2013 0.84f 0.10 0.06
2013-2014 0.60f 0.10 0.30
2014-2015 0.62f 0.11 0.27
329
Table 3 lists the (normalized) Shapley values as vertical shares of the export price. Some points about 330
these values are of interest. To start, it seems as if the CWB possessed greater coalitional power in 331
this market than any of the other players, during their existence. While it also appears that farmers 332
have retained significant market power over the most recent two years, we also see a significant shift 333

13
Brewin et al.
13
in coalitional strength from farmers to the grain companies. This finding is even more important 334
noting that farmer share can be further parsed into their input suppliers (often the grain companies). 335
Here, we also note that (8) reports current on farm grain operating costs are about 60% of wheat 336
prices. 337
Given the goals of the MRE policy, railway market power in the grain supply chain has clearly been 338
limited by the MRE. Railway share values in the supply chain over the interval consistently fall 339
between .08 and 0.14, considerably lower than the other players. We note that the transition away 340
from the CWB appears to have had little impact on the railways in this supply chain. In effect, the 341
major effect of the policy change seems to have been the sharing or division of system rents between 342
farmers and the grain companies. 343
While it is not clear theoretically what Shapley value is necessary to pass judgment as a dominant 344
player in the supply chain (35), it seems grain companies are at a point where further consolidation 345
will continue to buttress their position in the supply chain, potentially allowing them to garner even 346
more rents from within the system. And prior sections show that what happens with rail regulatory 347
policy will certainly affect their ability to do this. How the supply chain will evolve moving forward 348
remains a major policy question in Canada. 349
CONCLUSIONS 350
Several relevant factors have been necessarily left out of this discussion. For example, large increases 351
in the export basis could have been driven by higher storage costs, but with little changes in overall 352
storage capacity on the Prairies, there is historical evidence that the record turnover through the 353
elevators in 2013/14 should have been associated with decreased average costs as occurred in 354
2008/09. More data on actual firm level costs as incurred by the railways and the grain companies 355
would clearly improve our understanding of the changes occurring in the system. 356
Our evidence on the relative share of market power exercised by the CWB and railways suggests that 357
the CWB had significant countervailing market power in the supply chain. However, the implication 358
of the CWB’s coordinating role in grain movement is less clear. With the rise of canola and other 359
crops, the CWB was involved with a smaller share of all movements in terms of foreign sales but 360
maintained a historical influence on car allocation and elevator returns. Some evidence of this shows 361
up in the very tight export basis of the 2012/13 crop year, suggesting efficiency gains due to removal 362
of the single desk. 363
The grain companies also seem to have maneuvered so as to shift system rents from farmers since the 364
removal of the CWB. If grain industry consolidation continues, the former coordinating role of the 365
CWB in grain car allocations and foreign shipping logistics might ultimately be assumed by just one 366
or two of the current grain companies. As (36) notes, repeated rent taking from market intermediaries 367
will eventually reduce farmer investments and lead to a supply reduction or may trigger new entrants 368
and erode system rents. 369

14
Brewin et al.
14
REFERENCES 370
1. Agriculture and Agri-Food Canada (2016) Canada: Outlook for Principal Field Crops. 371
http://www.agr.gc.ca/resources/prod/doc/misb/mag-gam/fco-ppc/fco-ppc_2016-04-13-eng.pdf 372
(accessed May 16, 2016). 373
2. Quorum Corporation (2015) Annual Report 2013-14 Crop Year, Data Tables. 374
http://quorumcorp.net/Downloads/AnnualReports/AnnualReport201314English.pdf. (accessed May 375
1, 2016). 376
3. Nolan, J. and J. Skotheim (2008) “Spatial competition and regulatory change in the grain handling 377
and transportation system in western Canada”. The Annals of Regional Science, 42 (4), 929-944. 378
4. Brewin, D. (2016) “Competition in Canada's Agricultural Value Chains: The Case of Grain." 379
Canadian Journal of Agricultural Economics/Revue canadienne d'agroeconomie 64 (1), 5-19. 380
5. Eilers, W., R. MacKay, L. Graham, and A. Lefebvre (2010) Environmental sustainability of 381
Canadian agriculture: Agri-Environmental Indicator Report Series. Report #3. Ottawa, Ontario: 382
Agriculture and Agri-Food Canada. http://publications.gc.ca/collections/collection_2011/agr /A22-383
201-2010-eng.pdf (accessed May 16, 2016). 384
6. Statistics Canada (2016a) CANSIM Table 20048. Distribution of farms, by farm type and net 385
operating income group, incorporated and unincorporated sectors, Canada and provinces, annually. 386
Ottawa. http://dc.chass.utoronto.ca.uml.idm.oclc.org/cansimdim/ English/ (accessed May 1, 2016). 387
7. Statistics Canada (2016b) CANSIM Table : 40002. Census of Agriculture, total area of farms and 388
use of farm land, Canada and provinces, every 5 years. Ottawa. 389
http://dc.chass.utoronto.ca.uml.idm.oclc.org/cansimdim/ English/ (accessed May 1, 2016). 390
8. Manitoba Agriculture, Food and Rural Development (2016). Guidelines for Estimating Crop 391
Production Costs - 2016. http://www.gov.mb.ca/agriculture/business-and-economics/ financial-392
management/pubs/cop_crop_production.pdf (accessed May 2, 2016). 393
9. Brewin, D.G. (2014) "Limitations on the Market Power Generated by the Single Desk of the 394
Canadian Wheat Board." Canadian Journal of Agricultural Economics/Revue canadienne 395
d'agroeconomie. 62(4), 491-517. 396
10. Nolan, J. (2007) "Transportation.” in Saskatchewan: Geographic Perspectives. Edited by B. 397
Thraves, M. Lewry, J. Dale and H. Schlichtmann. Regina: Canadian Plains Research Center, 433-398
444. 399
11. Government of Alberta (2016) Railways (Business in Alberta, modern infrastructure). Available 400
at http://www.albertacanada.com/business/overview/railways.aspx (accessed April 17, 2016). 401
12. Vercammen, J. (1996). “An overview of changes in western grain transportation policy”. 402
Canadian Journal of Agricultural Economics/Revue canadienne d'agroeconomie, 44 (4), 397-402. 403
13. Riegle, J. (2001) “The Development of Western Grain Rates”. 2001, A Transportation Odyssey, 404
Proceedings of the 36th Annual Conference, Canadian Transportation Research Forum, Vancouver, 405
BC, 848-861. 406
14. Vachal, K. (2001) Comparison of guaranteed equipment programs, mimeo, Upper Great Plains 407
Transportation Institute (UGPTI), North Dakota State University, Fargo, ND. 408
409
15
Brewin et al.
15
15. Nolan, J. and W. Drew. (2002) “An update on regulatory change in the Canadian grain handling 410
and transportation industry”. Canadian Journal of Agricultural Economics/Revue canadienne 411
d'agroeconomie, 50(1), 85-98. 412
16. Kraft, D., W. Furtan, and E. Tyrchniewicz (1996) Performance Evaluation of the Canadian 413
Wheat Board. Winnipeg, MB, Canadian Wheat Board. 414
17. Schmitz, A., R. Gray, T. Schmitz and G. Storey (1997) The CWB and barley marketing: price 415
pooling and single-desk selling. Winnipeg, MB, Canadian Wheat Board. 416
18. Kraft, D. (1997) Analysis of Canadian Wheat Board Exports of Canadian Western Soft White 417
Spring. Winnipeg: Canadian Wheat Board. 418
19. Lavoie, N. (2005) “Price discrimination in the context of vertical differentiation: an application to 419
Canadian wheat exports”, American Journal of Agricultural Economics, 87(4), 835-854. 420
20. Carter, C., R. Loyns and D. Berwald (1998) “Domestic Costs of Statutory Marketing Authorities: 421
The Case of the Canadian Wheat Board.” American Journal of Agricultural Economics, 80(2), 313-422
324. 423
21. Charlebois, S. and R. Pedde (2008) A Bushel Half Full: Reforming the Canadian Wheat Board. 424
E-brief: C.D. Howe Institute, http://www.cdhowe.org/pdf/ebrief_68.pdf (accessed May 17, 2016). 425
22. Fulton, J. K. Baylis, H. Brooks and R. Gray (1998) The Impact of Deregulation on the Export 426
Basis in the Canadian Grain Handling and Transportation System, working paper, Dept. of 427
Agricultural Economics, U. of Saskatchewan, Saskatoon, SK. 428
23. Zhang, J., Goddard, E., and M Lehrol (2007) “Estimating pricing games in the wheat-handling 429
market in Saskatchewan: the role of a major co-operative”, in Advances in the Economic Analysis of 430
Participatory and Labor-Managed Firms Volume 1; Co-operative Firms in Global Markets: 431
Incidence, Viability and Economic Performance edited by S. Novkovic, and V. Sena, 151-184. 432
London: Elsevier. 433
24. Çakır, M., and J. Nolan. (2015) “Revisiting Concentration in Food and Agricultural Supply 434
Chains: The Welfare Implications of Market Power in a Complementary Input Sector”. Journal of 435
Agricultural and Resource Economics, 40(2), 203-219. 436
25. Bradley, I., and C. Price (1988) “The economic regulation of private industries by price 437
constraints”, The Journal of Industrial Economics, 37(1), 99-106. 438
26. Quorum Corporation (2016) Annual Report 2014-15 Crop Year, Data Tables. 439
http://quorumcorp.net/Downloads/AnnualReports/AnnualReport201415English.pdf. (accessed May 440
1, 2016). 441
27. Fulton, M. (2006) The Canadian Wheat Board in an Open Market: The Impact of Removing the 442
Single-Desk Selling Powers. Working paper, Dept. of Agricultural Economics, U. of Saskatchewan, 443
Saskatoon, SK, available on-line at www.kis.usask.ca. 444
28. Schmitz, A. and W. Furtan (2000) The Canadian Wheat Board: Marketing in the New Millenium. 445
Canadian Plains Research Center, Saskatoon, SK. 446
29. Wolak, F. and C. Kolstad (1988) “Measuring relative market power in the Western U.S. coal 447
market using Shapley values”, Resources and Energy, 10, 293-314. 448
449

16
Brewin et al.
16
30. Gray, R. (2016) The Economic Impacts of Elevated Export Basis Levels on Western Canadian 450
Grain Producers 2012/13, 2013/14 and 2014/15. Report for SaskWheat Commission, Saskatoon, SK. 451
http://www.saskwheatcommission.com/wp-content/uploads/2015/09/The-Economic-Impacts-Of-452
Elevated-Export-Basis-Levels-On-Western-Canadian-Grain-Producers-2012-2015.pdf. (accessed 453
May 17, 2016). 454
31. Shapley, L. (1953) “A Value for N-Person Games”, Contributions to the Theory of Games, V.2, 455
Edited by H. Kuhn and A. Tucker., Ann. Math Studies 28, Princeton University Press, Princeton NJ, 456
307-317. 457
32. Young, P. (1991) “Fair Division”. Ch. 2 in Negotiation Analysis, Edited by P. Young, University 458
of Michigan Press, Ann Arbor, MI. 459
33. Roth, A. (1988) “Introduction to the Shapley Value”, Ch. 1 in The Shapley Value: Essays in 460
Honor of Lloyd S. Shapley, Edited by A. Roth, Cambridge University Press, Boston, MA. 461
34. Intriligator, M. (1972) Mathematical Optimization and Economic Theory. Prentice Hall, 462
Englewood Cliffs, N.J. 463
35. D’Aspremont, C. and A. Jacquemin (1985) “Measuring the power to monopolize: A simple 464
game theoretic approach”, European Economic Review, 27, 57-74. 465
36. Sexton, R. (2013) “Market power, misconceptions, and modern agricultural markets”. American 466
Journal of Agricultural Economics, 95(2), 209-219. 467
468
469
Recommended