The Association of South African Quantity Surveyors (ASAQS)
Salary Survey March 2017 (Published in October 2017)
South African Construction Industry
Business Information Services | www.industryinsight.co.za | T +27 21 554 0886
Analysing | Planning |Focus | Prioritising | Monitoring
Table of Contents 1. General Background ...................................................................................................................................... 2
2. Salary Survey March 2016 ............................................................................................................................. 4
3. National Comparison by Qualification ........................................................................................................... 8
4. Provincial Comparison by Qualification......................................................................................................... 9
4.1. University ................................................................................................................................................ 9
4.2. University of Technology ...................................................................................................................... 10
4.3. No formal education ............................................................................................................................. 11
5. Remuneration Summary.............................................................................................................................. 11
5.1 National Remuneration Summary ......................................................................................................... 12
5.2 Provincial Remuneration Summary ....................................................................................................... 13
6. Graphs.......................................................................................................................................................... 18
1

1. General Background The results are based on an annual survey of salaried staff, conducted amongst quantity surveying practices in South Africa. The survey excludes information pertaining to the remuneration packages of the principals, partners, members of closed corporations and directors
Feedback will be provided to participating quantity surveying practices and the general public in a format that will ensure confidentiality of the individual returns
Gross Annual Remuneration includes:
• Basic salary and guaranteed annual bonus. • Fringe benefits not included in basic salary. • Income benefit for the private use of a motor vehicle as determined from time to time by the Inland
Revenue for income tax purposes. • Employer’s contribution to pension/provident fund. • Employer’s contribution to medical aid. • Group life assurance premium. • Workmen’s Compensation Fund and Unemployment Insurance Fund contributions and any other
statutory contributions or levies. • All other costs and benefits as per conditions of appointment but excluding any share in profit.
University qualification Means personnel with a university (or similar) qualification in quantity
surveying
University of Technology qualification
Means personnel with a University of Technology (formerly Technikon) (or similar) qualification in quantity surveying or building surveying
No formal qualification Means personnel with no formal qualification, but who perform quantity surveying services
Experience is taken from the following dates irrespective of when the individual passed the APC evaluation:
• Three year full-time university qualification (i.e. only BSc degree) - from one year after qualification. • Four year full-time university qualification (i.e. BSc Hons degree) - from date of qualification. • Five year university qualification of which two years are part time (i.e. BSc Hons degree) - from one year
before qualification. • Three year full-time university of technology qualification (i.e. National Diploma) - From one year after
qualification. • Four year full-time university of technology qualification (i.e. BTech degree) - from date of qualification. • Five year university of technology qualification of which two years are part time (i.e. BTech degree) - from
one year before qualification.
Median If a list contains an odd number of values, median returns the middle value. If a list contains an even number of values, median returns the arithmetic average of the two middle values.
2

Pure median Returns the median value in the list, ignore blank cells, labels and formulas that result in labels.
Standard deviation Standard deviation is the square root of the variance of all individual values from the mean. Deviation from the mean (that is the middle).
Please note that a standard deviation cannot be calculated on less than 2 fields.
3
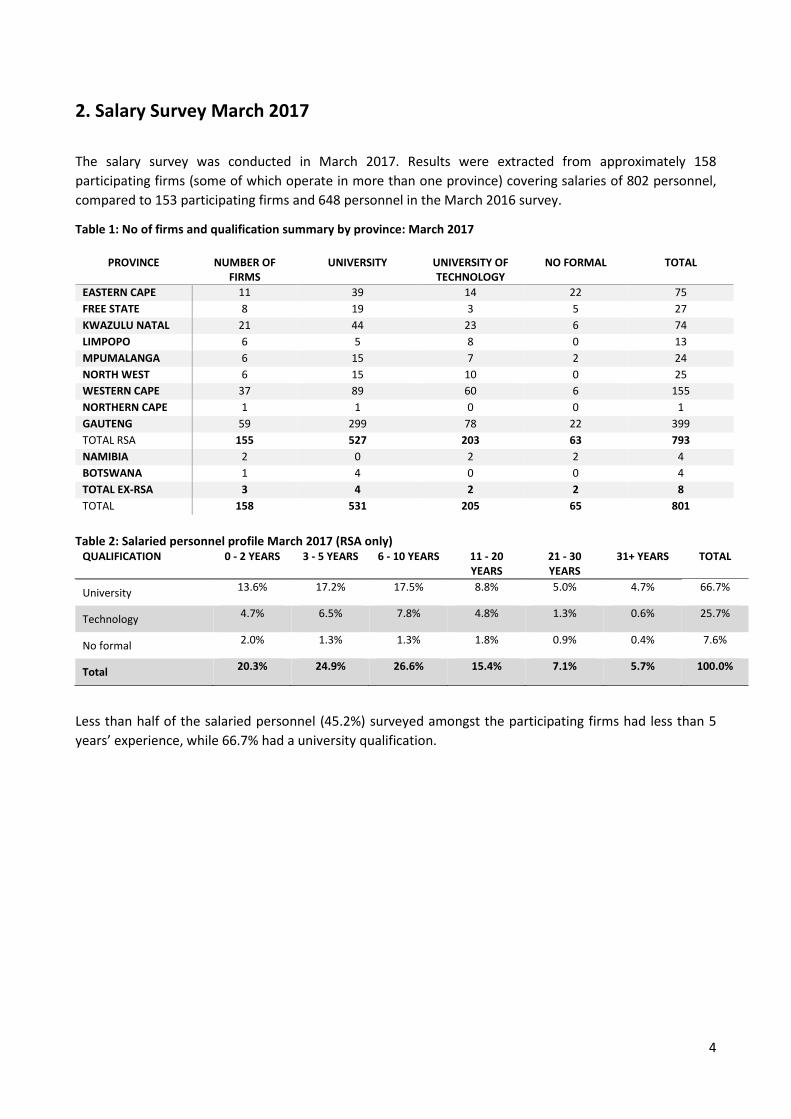
2. Salary Survey March 2017
The salary survey was conducted in March 2017. Results were extracted from approximately 158 participating firms (some of which operate in more than one province) covering salaries of 802 personnel, compared to 153 participating firms and 648 personnel in the March 2016 survey.
Table 1: No of firms and qualification summary by province: March 2017
PROVINCE NUMBER OF FIRMS
UNIVERSITY UNIVERSITY OF TECHNOLOGY
NO FORMAL TOTAL
EASTERN CAPE 11 39 14 22 75 FREE STATE 8 19 3 5 27 KWAZULU NATAL 21 44 23 6 74 LIMPOPO 6 5 8 0 13 MPUMALANGA 6 15 7 2 24 NORTH WEST 6 15 10 0 25 WESTERN CAPE 37 89 60 6 155 NORTHERN CAPE 1 1 0 0 1 GAUTENG 59 299 78 22 399 TOTAL RSA 155 527 203 63 793 NAMIBIA 2 0 2 2 4 BOTSWANA 1 4 0 0 4 TOTAL EX-RSA 3 4 2 2 8 TOTAL 158 531 205 65 801
Table 2: Salaried personnel profile March 2017 (RSA only)
QUALIFICATION 0 - 2 YEARS 3 - 5 YEARS 6 - 10 YEARS 11 - 20 YEARS
21 - 30 YEARS
31+ YEARS TOTAL
University 13.6% 17.2% 17.5% 8.8% 5.0% 4.7% 66.7%
Technology 4.7% 6.5% 7.8% 4.8% 1.3% 0.6% 25.7%
No formal 2.0% 1.3% 1.3% 1.8% 0.9% 0.4% 7.6%
Total 20.3% 24.9% 26.6% 15.4% 7.1% 5.7% 100.0%
Less than half of the salaried personnel (45.2%) surveyed amongst the participating firms had less than 5 years’ experience, while 66.7% had a university qualification.
4
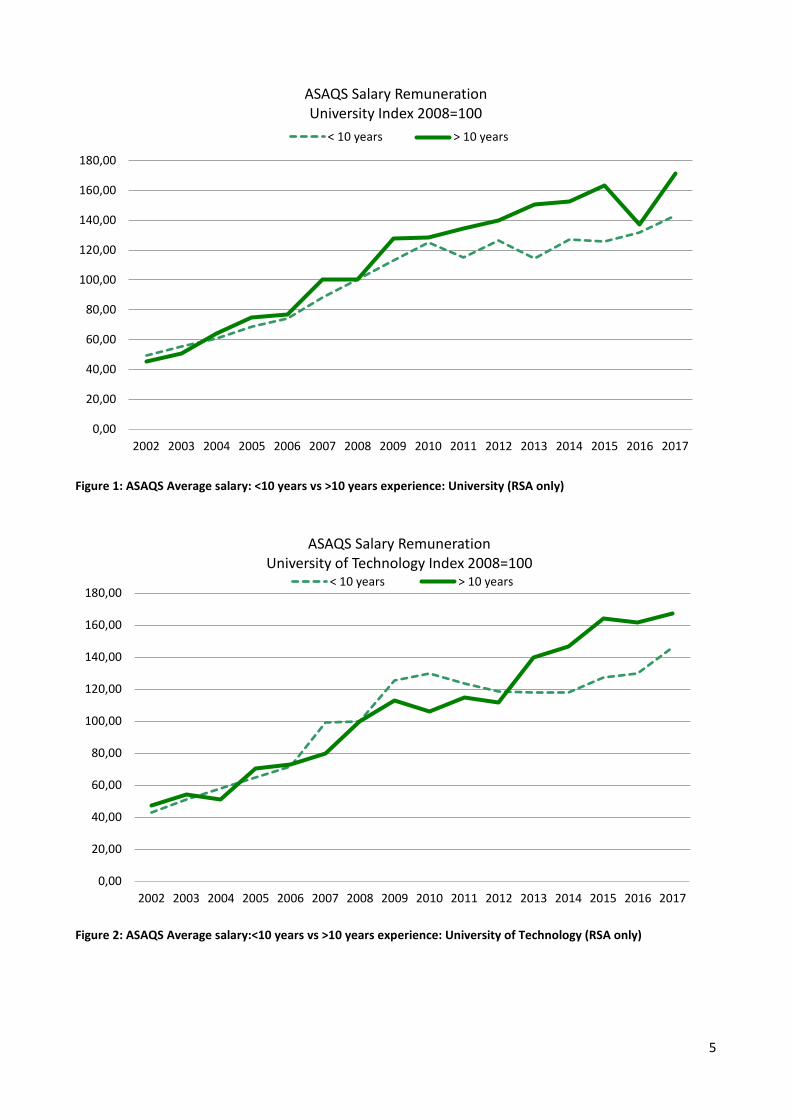
Figure 1: ASAQS Average salary: <10 years vs >10 years experience: University (RSA only)
Figure 2: ASAQS Average salary:<10 years vs >10 years experience: University of Technology (RSA only)
0,00
20,00
40,00
60,00
80,00
100,00
120,00
140,00
160,00
180,00
2002 2003 2004 2005 2006 2007 2008 2009 2010 2011 2012 2013 2014 2015 2016 2017
ASAQS Salary RemunerationUniversity Index 2008=100
< 10 years > 10 years
0,00
20,00
40,00
60,00
80,00
100,00
120,00
140,00
160,00
180,00
2002 2003 2004 2005 2006 2007 2008 2009 2010 2011 2012 2013 2014 2015 2016 2017
ASAQS Salary RemunerationUniversity of Technology Index 2008=100
< 10 years > 10 years
5
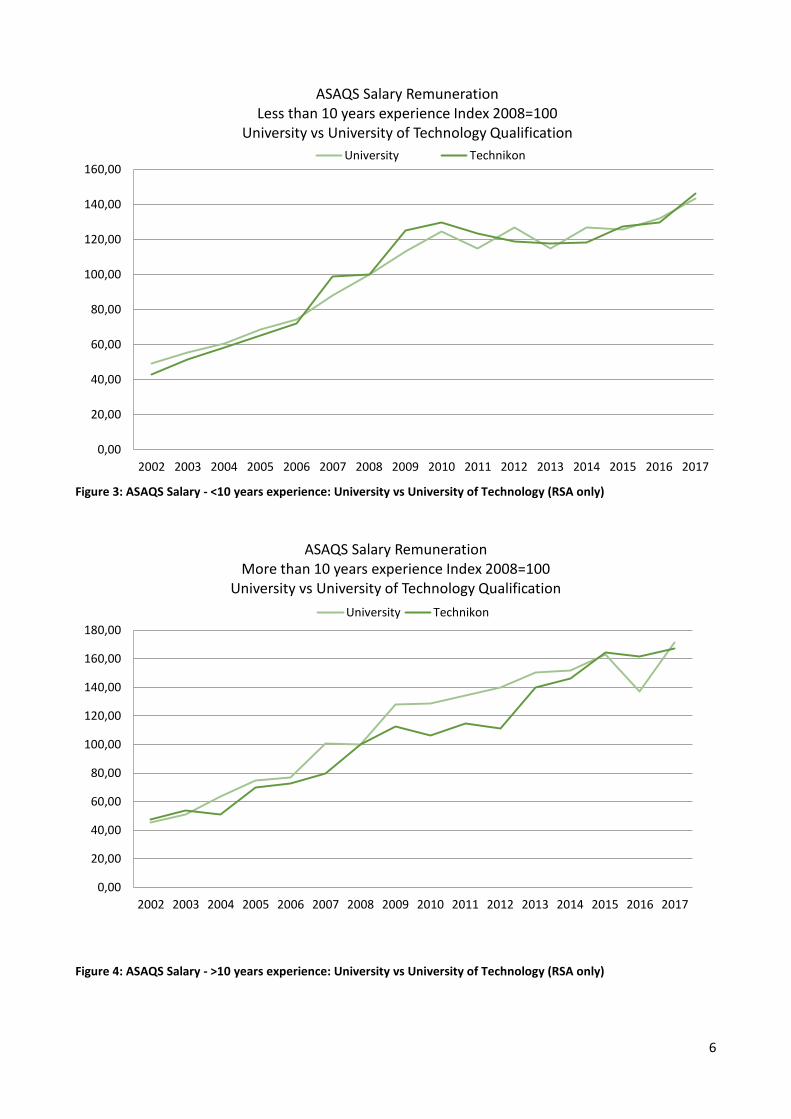
Figure 3: ASAQS Salary - <10 years experience: University vs University of Technology (RSA only)
Figure 4: ASAQS Salary - >10 years experience: University vs University of Technology (RSA only)
0,00
20,00
40,00
60,00
80,00
100,00
120,00
140,00
160,00
2002 2003 2004 2005 2006 2007 2008 2009 2010 2011 2012 2013 2014 2015 2016 2017
ASAQS Salary RemunerationLess than 10 years experience Index 2008=100
University vs University of Technology QualificationUniversity Technikon
0,00
20,00
40,00
60,00
80,00
100,00
120,00
140,00
160,00
180,00
2002 2003 2004 2005 2006 2007 2008 2009 2010 2011 2012 2013 2014 2015 2016 2017
ASAQS Salary RemunerationMore than 10 years experience Index 2008=100
University vs University of Technology QualificationUniversity Technikon
6

Figure 5: ASAQS Salary Index: University, by experience level (RSA only)
Figure 6: ASAQS Salary Index: University of Technology, by experience level (RSA only)
0,00
50,00
100,00
150,00
200,00
250,00
2002
2003
2004
2005
2006
2007
2008
2009
2010
2011
2012
2013
2014
2015
2016
2017
ASAQS Average Salary RemunerationUniversity Index 2008=100
0-5 YRS
6-10 YRS
11-20 YRS
21-30 YRS
30+ YRS
0,00
50,00
100,00
150,00
200,00
250,00
2002
2003
2004
2005
2006
2007
2008
2009
2010
2011
2012
2013
2014
2015
2016
2017
ASAQS Average Salary RemunerationUniversity of Technology Index 2008=100
0-5 YRS
6-10 YRS
11-20 YRS
21-30 YRS
30+
7

3. National Comparison by Qualification
Table 3: Median prices by qualification and experience: National RSA Only 0 - 2 YEARS 3 - 5 YEARS 6 - 10 YEARS 11 - 20 YEARS 21 - 30 YEARS 30+ YEARS
UNIVERSITY 242,382 356,500 484,967 832,322 875,000 720,000 UNIVERSITY OF TECHNOLOGY 182,000 286,000 397,960 600,000 686,244 830,000
NONE 111,000 121,776 169,356 351,189 343,980 482,650
8

4. Provincial Comparison by Qualification
4.1. University Table 4: University: Lowest R, Current prices
PROVINCE 0 - 2 YEARS 3 - 5 YEARS 6 - 10 YEARS 11 - 20 YEARS 21 - 30 YEARS 30+ YEARS
EASTERN CAPE 130,000 237,380 281,250 300,000 360,000 - FREE STATE 170,745 225,000 328,224 100,000 500,000 300,000 GAUTENG 48,000 162,000 180,000 180,000 420,000 540,000 KWAZULU NATAL 215,400 109,920 325,000 298,870 650,000 611,000
LIMPOPO 372,000 320,320 247,287 - - 518,700 MPUMALANGA 232,200 357,500 408,000 456,000 850,000 - NORTH WEST 200,000 294,337 334,400 490,000 - 555,600 NORTHERN CAPE - - 234,000 - - -
WESTERN CAPE 84,000 240,804 351,000 541,800 850,000 386,198 Table 5: University: Highest R, Current prices
PROVINCE 0 - 2 YEARS 3 - 5 YEARS 6 - 10 YEARS 11 - 20 YEARS 21 - 30 YEARS 30+ YEARS EASTERN CAPE 510,000 885,600 663,404 900,000 1,479,444 - FREE STATE 170,745 420,000 650,000 520,632 1,200,000 500,000 GAUTENG 600,000 860,000 1,170,000 1,481,430 1,601,600 1,627,040 KWAZULU NATAL 300,000 429,000 868,083 1,250,000 780,000 680,000
LIMPOPO 372,000 320,320 373,230 - - 518,700 MPUMALANGA 379,000 432,400 490,282 637,400 850,000 - NORTH WEST 252,000 384,000 714,317 720,700 - 600,000 NORTHERN CAPE - - 234,000 - - -
WESTERN CAPE 427,680 518,400 1,189,020 1,100,000 1,230,076 1,500,000 Table 6: University: Median R, Current prices
PROVINCE 0 - 2 YEARS 3 - 5 YEARS 6 - 10 YEARS 11 - 20 YEARS 21 - 30 YEARS 30+ YEARS EASTERN CAPE 199,303 360,000 429,000 480,000 651,286 - FREE STATE 170,745 294,840 433,107 500,000 726,000 400,000 GAUTENG 260,100 390,000 499,163 899,750 942,500 918,705 KWAZULU NATAL 219,050 280,000 378,400 420,000 660,000 645,500
LIMPOPO 372,000 320,320 310,259 - - 518,700 MPUMALANGA 379,000 379,000 420,000 456,000 850,000 - NORTH WEST 242,382 339,169 487,532 720,000 - 577,800 NORTHERN CAPE - - 234,000 - - -
WESTERN CAPE 216,000 350,000 550,000 844,843 1,075,000 787,491
9
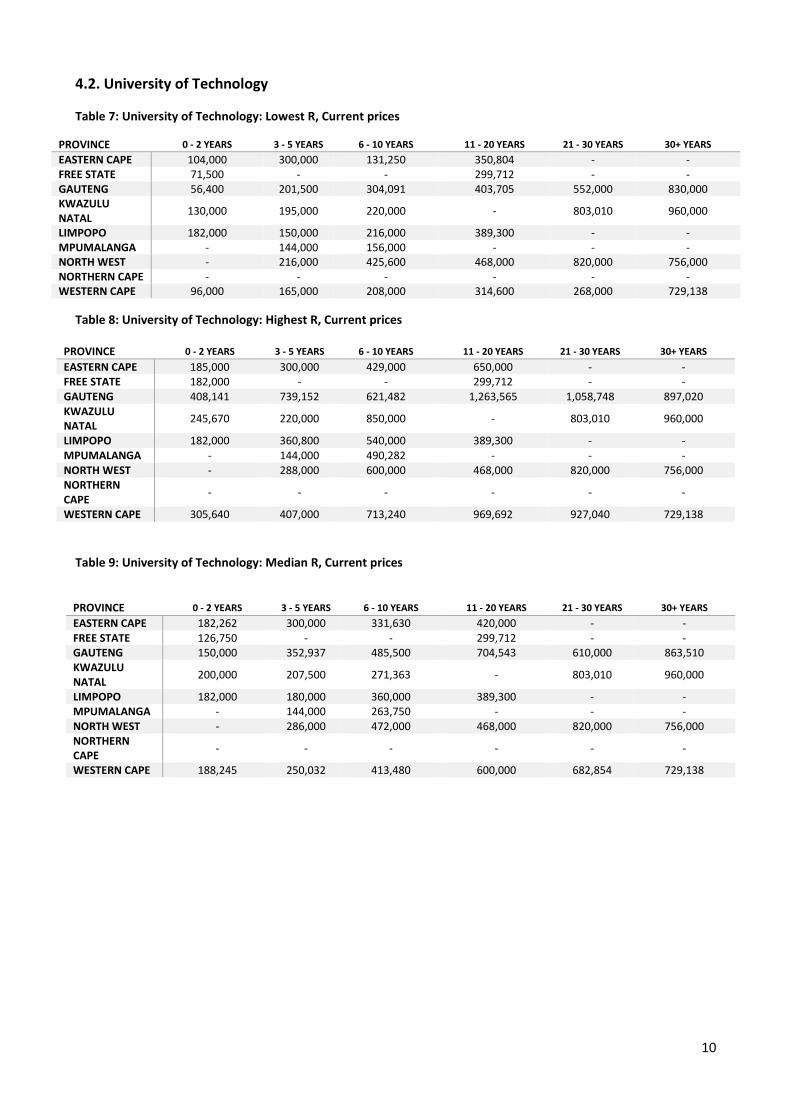
4.2. University of Technology Table 7: University of Technology: Lowest R, Current prices
PROVINCE 0 - 2 YEARS 3 - 5 YEARS 6 - 10 YEARS 11 - 20 YEARS 21 - 30 YEARS 30+ YEARS EASTERN CAPE 104,000 300,000 131,250 350,804 - - FREE STATE 71,500 - - 299,712 - - GAUTENG 56,400 201,500 304,091 403,705 552,000 830,000 KWAZULU NATAL 130,000 195,000 220,000 - 803,010 960,000
LIMPOPO 182,000 150,000 216,000 389,300 - - MPUMALANGA - 144,000 156,000 - - - NORTH WEST - 216,000 425,600 468,000 820,000 756,000 NORTHERN CAPE - - - - - - WESTERN CAPE 96,000 165,000 208,000 314,600 268,000 729,138
Table 8: University of Technology: Highest R, Current prices
PROVINCE 0 - 2 YEARS 3 - 5 YEARS 6 - 10 YEARS 11 - 20 YEARS 21 - 30 YEARS 30+ YEARS EASTERN CAPE 185,000 300,000 429,000 650,000 - - FREE STATE 182,000 - - 299,712 - - GAUTENG 408,141 739,152 621,482 1,263,565 1,058,748 897,020 KWAZULU NATAL 245,670 220,000 850,000 - 803,010 960,000
LIMPOPO 182,000 360,800 540,000 389,300 - - MPUMALANGA - 144,000 490,282 - - - NORTH WEST - 288,000 600,000 468,000 820,000 756,000 NORTHERN CAPE - - - - - -
WESTERN CAPE 305,640 407,000 713,240 969,692 927,040 729,138 Table 9: University of Technology: Median R, Current prices
PROVINCE 0 - 2 YEARS 3 - 5 YEARS 6 - 10 YEARS 11 - 20 YEARS 21 - 30 YEARS 30+ YEARS EASTERN CAPE 182,262 300,000 331,630 420,000 - - FREE STATE 126,750 - - 299,712 - - GAUTENG 150,000 352,937 485,500 704,543 610,000 863,510 KWAZULU NATAL 200,000 207,500 271,363 - 803,010 960,000
LIMPOPO 182,000 180,000 360,000 389,300 - - MPUMALANGA - 144,000 263,750 - - - NORTH WEST - 286,000 472,000 468,000 820,000 756,000 NORTHERN CAPE - - - - - -
WESTERN CAPE 188,245 250,032 413,480 600,000 682,854 729,138
10

4.3. No formal education Table 10: No formal education: Lowest R, Current prices
PROVINCE 0 - 2 YEARS 3 - 5
YEARS 6 - 10 YEARS 11 - 20 YEARS 21 - 30 YEARS 30+ YEARS
EASTERN CAPE 28,846 43,560 17,000 72,100 - - FREE STATE - 97,332 - 221,130 343,980 188,695 GAUTENG 50,000 69,558 170,712 165,461 152,758 482,650 KWAZULU NATAL 78,000 120,000 168,000 - 182,000 -
LIMPOPO - - - - - - MPUMALANGA - 123,552 153,400 - - - NORTH WEST - - - - - - NORTHERN CAPE - - - - - -
WESTERN CAPE 47,875 196,512 130,813 400,584 364,000 -
Table 11: No formal education: Highest R, Current prices PROVINCE 0 - 2 YEARS 3 - 5
YEARS 6 - 10 YEARS 11 - 20 YEARS 21 - 30 YEARS 30+ YEARS
EASTERN CAPE 214,450 180,000 240,000 355,242 - - FREE STATE - 97,332 - 285,493 343,980 188,695 GAUTENG 187,000 177,606 736,484 834,420 400,000 578,000 KWAZULU NATAL 78,000 120,000 180,000 - 540,000 -
MPUMALANGA - 123,552 153,400 - - - NORTH WEST - - - - - - NORTHERN CAPE - - - - - -
WESTERN CAPE 47,875 196,512 143,604 400,584 364,000 -
Table 12: No formal education: Median R, Current prices
PROVINCE 0 - 2 YEARS 3 - 5 YEARS 6 - 10 YEARS 11 - 20 YEARS 21 - 30
YEARS 30+ YEARS
EASTERN CAPE 128,738 137,719 128,500 253,220 - - FREE STATE - 97,332 - 253,312 343,980 188,695 GAUTENG 92,100 123,582 215,000 541,632 333,788 530,325 KWAZULU NATAL
78,000 120,000 174,000 - 361,000 -
LIMPOPO - - - - - - MPUMALANGA - 123,552 153,400 - - - NORTH WEST - - - - - - NORTHERN CAPE
- - - - - -
WESTERN CAPE 400,584 196,512 137,209 364,000 364,000 -
11

5. Remuneration Summary
5.1 National Remuneration Summary
Table 13: Remuneration summary: March 2017 – National (RSA Only)
0 - 2 years
3 - 5 years
6 - 10 years
11 - 20 years
21 - 30 years
30+ years
University
Number 521 107 134 138 69 38 35
Lowest 48,000 109,920 180,000 100,000 360,000 300,000
Highest 600,000 885,600 1,189,020 1,481,430 1,601,600 1,627,040
Average 249,771 374,191 532,116 782,243 906,948 861,501
Median 242,382 356,500 484,967 832,322 875,000 720,000
Stand Dev 95,290 123,564 192,810 295,096 314,765 341,789
University of Technology
Number 200 37 51 59 38 10 5
Lowest 56,400 144,000 131,250 299,712 268,000 729,138
Highest 408,141 739,152 850,000 1,263,565 1,058,748 960,000
Average 181,859 305,575 411,192 643,815 695,715 834,432
Median 182,000 286,000 397,960 600,000 686,244 830,000
Stand Dev 82,119 122,249 157,363 235,671 222,576 96,102
None
Number 60 16 10 10 14 7 3
Lowest 28,846 43,560 17,000 72,100 152,758 188,695
Highest 214,450 196,512 736,484 834,420 540,000 578,000
Average 103,473 128,356 215,501 396,154 330,932 416,448
Median 111,000 121,776 169,356 351,189 343,980 482,650
Stand Dev 54,873 51,442 192,396 222,395 131,452 202,920
Note: Where salaried personnel are 2 or less in a specific qualification and experience category data may be unreliable for comparison purposes
12

5.2 Provincial Remuneration Summary Table 14: Remuneration summary: March 2017 – Eastern Cape
QUALIFICATION EXPERIENCE
0 - 2 years 3 - 5 years 6 - 10 years
11 - 20 years
21 - 30 years 31+ years
University
Number 36 10 9 11 3 3 - Lowest 130,000 237,380 281,250 300,000 360,000 - Highest 510,000 885,600 663,404 900,000 1,479,444 - Average 262,517 416,495 459,174 560,000 830,243 - Median 199,303 360,000 429,000 480,000 651,286 - Stand Dev 146,795 201,869 110,634 307,896 580,782 -
University of Technology
Number 13 3 1 5 4 - - Lowest 104,000 300,000 131,250 350,804 - - Highest 185,000 300,000 429,000 1,200,000 - - Average 157,087 300,000 281,576 655,201 - - Median 182,262 300,000 331,630 420,000 - - Stand Dev 45,995 - 131,108 385,058 - -
None
Number 20 10 4 2 4 - - Lowest 28,846 43,560 17,000 72,100 - - Highest 214,450 180,000 240,000 355,242 - - Average 110,849 124,750 128,500 233,446 - - Median 128,738 137,719 128,500 253,220 - - Stand Dev 57,297 63,721 157,685 123,862 - -
Note: Where salaried personnel are 2 or less in a specific qualification and experience category data may be unreliable for comparison purposes
Table 15: Remuneration summary: March 2017 – Free State
QUALIFICATION EXPERIENCE
0 - 2 years 3 - 5 years 6 - 10 years
11 - 20 years
21 - 30 years 31+ years
University
Number 19 1 3 6 3 4 2 Lowest 170,745 225,000 328,224 100,000 500,000 300,000 Highest 170,745 420,000 650,000 520,632 1,200,000 500,000 Average 170,745 313,280 464,906 373,544 788,000 400,000 Median 170,745 294,840 433,107 500,000 726,000 400,000 Stand Dev - 98,799 110,114 237,121 331,445 141,421
University of Technology
Number 4 2 - - 2 - - Lowest 71,500 - - 299,712 - - Highest 182,000 - - 1,200,000 - - Average 126,750 - - 749,856 - - Median 126,750 - - 299,712 - - Stand Dev 78,135 - - 636,600 - -
None
Number 5 - 1 - 2 1 1 Lowest - 97,332 - 221,130 343,980 188,695 Highest - 97,332 - 285,493 343,980 188,695 Average - 97,332 - 253,312 343,980 188,695 Median - 97,332 - 253,312 343,980 188,695 Stand Dev - - - 45,512 - -
Note: Where salaried personnel are 2 or less in a specific qualification and experience category data may be unreliable for comparison purposes
13

Table 16: Remuneration summary: March 2017 – Gauteng
QUALIFICATION EXPERIENCE
0 - 2 years 3 - 5 years 6 - 10 years 11 - 20 years
21 - 30 years 31+ years
University
Number 297 58 78 78 39 23 21 Lowest 48,000 162,000 180,000 180,000 420,000 540,000 Highest 600,000 860,000 1,170,000 1,481,430 1,601,600 1,627,040 Average 249,811 395,173 560,881 901,786 941,357 927,455 Median 260,100 390,000 499,163 899,750 942,500 918,705 Stand Dev 99,942 127,307 205,083 261,542 317,550 301,041
University of Technology
Number 79 15 22 22 15 3 2 Lowest 56,400 201,500 304,091 403,705 552,000 830,000 Highest 408,141 739,152 621,482 1,263,565 1,058,748 897,020 Average 179,389 383,034 471,843 795,831 740,249 863,510 Median 150,000 352,937 485,500 704,543 610,000 863,510 Stand Dev 112,430 132,081 89,906 280,752 277,348 47,390
None
Number 21 4 2 3 7 3 2 Lowest 50,000 69,558 170,712 165,461 152,758 482,650 Highest 187,000 177,606 736,484 834,420 400,000 578,000 Average 105,300 123,582 374,065 529,310 295,515 530,325 Median 92,100 123,582 215,000 541,632 333,788 530,325 Stand Dev 61,431 76,401 314,644 232,393 127,987 67,423
Note: Where salaried personnel are 2 or less in a specific qualification and experience category data may be unreliable for comparison purposes
Table 17: Remuneration summary: March 2017 – KwaZulu Natal
QUALIFICATION EXPERIENCE
0 - 2 years 3 - 5 years 6 - 10 years 11 - 20 years
21 - 30 years 31+ years
University
Number 44 5 13 12 9 3 2
Lowest 215,400 109,920 325,000 298,870 650,000 611,000 Highest 300,000 429,000 868,083 1,250,000 780,000 680,000 Average 241,300 284,493 439,418 558,213 696,667 645,500
Median 219,050 280,000 378,400 420,000 660,000 645,500 Stand Dev 36,206 86,620 150,489 308,071 72,342 48,790
University of Technology
Number 23 6 2 12 1 1 1
Lowest 130,000 195,000 220,000 1,200,000 803,010 960,000 Highest 245,670 220,000 850,000 1,200,000 803,010 960,000
Average 200,223 207,500 376,015 1,200,000 803,010 960,000 Median 200,000 207,500 271,363 - 803,010 960,000 Stand Dev 43,523 17,678 228,546 - - -
None
Number 6 1 1 2 - 2 -
Lowest 78,000 120,000 168,000 - 182,000 -
Highest 78,000 120,000 180,000 - 540,000 - Average 78,000 120,000 174,000 - 361,000 - Median 78,000 120,000 174,000 - 361,000 -
Stand Dev - - 8,485 - 253,144 - Note: Where salaried personnel are 2 or less in a specific qualification and experience category data may be unreliable for comparison purposes
14
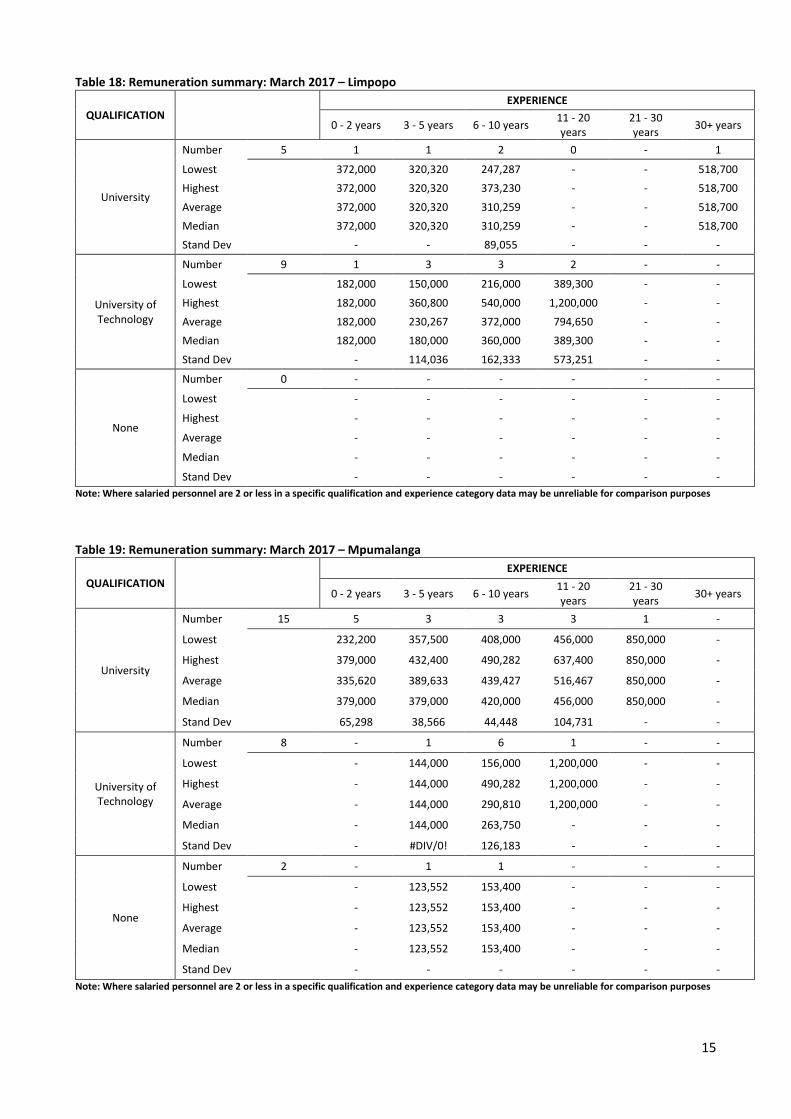
Table 18: Remuneration summary: March 2017 – Limpopo
QUALIFICATION EXPERIENCE
0 - 2 years 3 - 5 years 6 - 10 years 11 - 20 years
21 - 30 years 30+ years
University
Number 5 1 1 2 0 - 1
Lowest 372,000 320,320 247,287 - - 518,700 Highest 372,000 320,320 373,230 - - 518,700
Average 372,000 320,320 310,259 - - 518,700 Median 372,000 320,320 310,259 - - 518,700 Stand Dev - - 89,055 - - -
University of Technology
Number 9 1 3 3 2 - -
Lowest 182,000 150,000 216,000 389,300 - -
Highest 182,000 360,800 540,000 1,200,000 - - Average 182,000 230,267 372,000 794,650 - - Median 182,000 180,000 360,000 389,300 - -
Stand Dev - 114,036 162,333 573,251 - -
None
Number 0 - - - - - -
Lowest - - - - - -
Highest - - - - - -
Average - - - - - -
Median - - - - - -
Stand Dev - - - - - - Note: Where salaried personnel are 2 or less in a specific qualification and experience category data may be unreliable for comparison purposes
Table 19: Remuneration summary: March 2017 – Mpumalanga
QUALIFICATION EXPERIENCE
0 - 2 years 3 - 5 years 6 - 10 years 11 - 20 years
21 - 30 years 30+ years
University
Number 15 5 3 3 3 1 -
Lowest 232,200 357,500 408,000 456,000 850,000 -
Highest 379,000 432,400 490,282 637,400 850,000 -
Average 335,620 389,633 439,427 516,467 850,000 -
Median 379,000 379,000 420,000 456,000 850,000 -
Stand Dev 65,298 38,566 44,448 104,731 - -
University of Technology
Number 8 - 1 6 1 - -
Lowest - 144,000 156,000 1,200,000 - -
Highest - 144,000 490,282 1,200,000 - -
Average - 144,000 290,810 1,200,000 - -
Median - 144,000 263,750 - - -
Stand Dev - #DIV/0! 126,183 - - -
None
Number 2 - 1 1 - - -
Lowest - 123,552 153,400 - - -
Highest - 123,552 153,400 - - -
Average - 123,552 153,400 - - -
Median - 123,552 153,400 - - -
Stand Dev - - - - - - Note: Where salaried personnel are 2 or less in a specific qualification and experience category data may be unreliable for comparison purposes
15
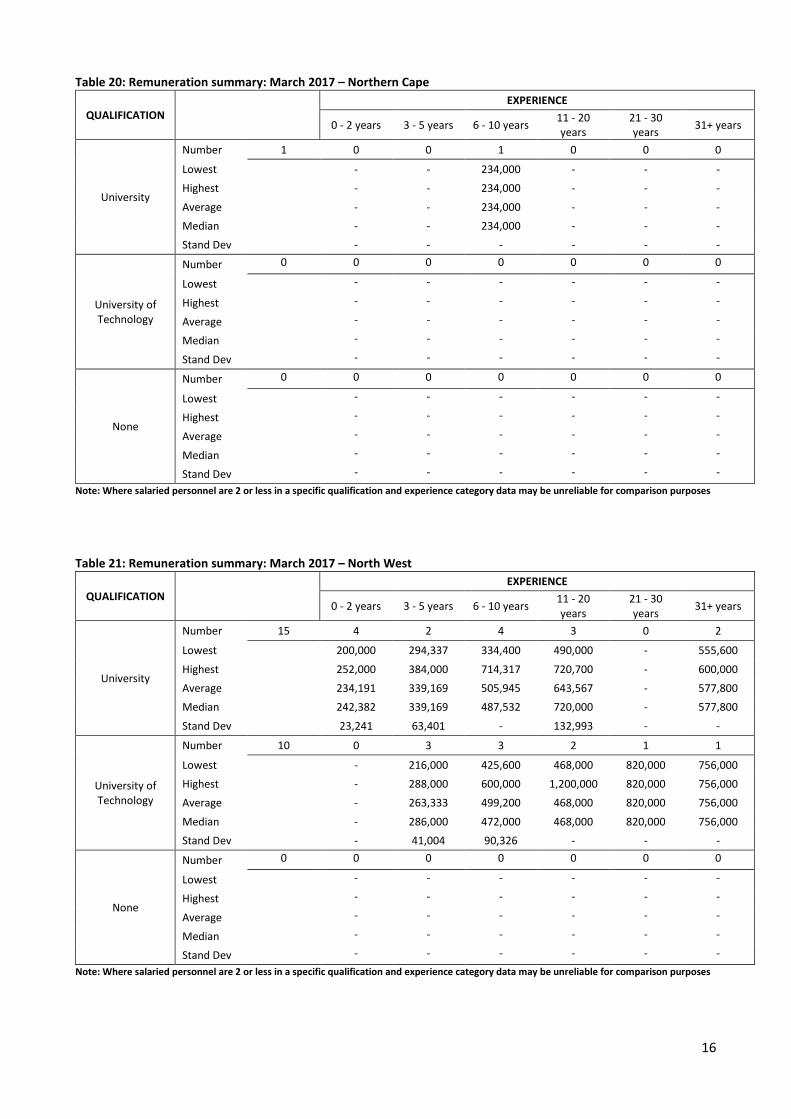
Table 20: Remuneration summary: March 2017 – Northern Cape
QUALIFICATION EXPERIENCE
0 - 2 years 3 - 5 years 6 - 10 years 11 - 20 years
21 - 30 years 31+ years
University
Number 1 0 0 1 0 0 0
Lowest - - 234,000 - - - Highest - - 234,000 - - -
Average - - 234,000 - - - Median - - 234,000 - - - Stand Dev - - - - - -
University of Technology
Number 0 0 0 0 0 0 0
Lowest
- - - - - -
Highest
- - - - - -
Average
- - - - - -
Median
- - - - - -
Stand Dev
- - - - - -
None
Number 0 0 0 0 0 0 0
Lowest
- - - - - -
Highest
- - - - - -
Average
- - - - - -
Median
- - - - - -
Stand Dev
- - - - - - Note: Where salaried personnel are 2 or less in a specific qualification and experience category data may be unreliable for comparison purposes
Table 21: Remuneration summary: March 2017 – North West
QUALIFICATION EXPERIENCE
0 - 2 years 3 - 5 years 6 - 10 years 11 - 20 years
21 - 30 years 31+ years
University
Number 15 4 2 4 3 0 2
Lowest 200,000 294,337 334,400 490,000 - 555,600
Highest 252,000 384,000 714,317 720,700 - 600,000 Average 234,191 339,169 505,945 643,567 - 577,800 Median 242,382 339,169 487,532 720,000 - 577,800
Stand Dev 23,241 63,401 - 132,993 - -
University of Technology
Number 10 0 3 3 2 1 1
Lowest - 216,000 425,600 468,000 820,000 756,000 Highest - 288,000 600,000 1,200,000 820,000 756,000 Average - 263,333 499,200 468,000 820,000 756,000
Median - 286,000 472,000 468,000 820,000 756,000 Stand Dev - 41,004 90,326 - - -
None
Number 0 0 0 0 0 0 0
Lowest
- - - - - -
Highest
- - - - - -
Average
- - - - - -
Median
- - - - - -
Stand Dev
- - - - - - Note: Where salaried personnel are 2 or less in a specific qualification and experience category data may be unreliable for comparison purposes
16

Table 22: Remuneration summary: March 2017 – Western Cape
QUALIFICATION EXPERIENCE
0 - 2 years 3 - 5 years 6 - 10 years 11 - 20 years
21 - 30 years 31+ years
University
Number 89 23 25 21 9 4 7
Lowest 84,000 240,804 351,000 541,800 850,000 386,198 Highest 427,680 518,400 1,189,020 1,100,000 1,230,076 1,500,000
Average 228,139 350,551 589,204 833,387 1,057,519 987,239 Median 216,000 350,000 550,000 844,843 1,075,000 787,491 Stand Dev 68,607 80,089 199,846 177,523 186,817 435,166
University of Technology
Number 60 10 19 8 17 5 1
Lowest 96,000 165,000 208,000 314,600 268,000 729,138
Highest 305,640 407,000 713,240 969,692 927,040 729,138 Average 192,983 253,568 450,156 628,336 622,679 729,138 Median 188,245 250,032 413,480 600,000 682,854 729,138
Stand Dev 62,117 74,563 154,845 181,857 241,058 -
None
Number 6 1 1 2 1 1 -
Lowest 47,875 196,512 130,813 400,584 364,000 - Highest 47,875 196,512 143,604 400,584 364,000 - Average 47,875 196,512 137,209 400,584 364,000 -
Median 400,584 196,512 137,209 364,000 364,000 - Stand Dev - - 9,045 - - -
Note: Where salaried personnel are 2 or less in a specific qualification and experience category data may be unreliable for comparison purposes
17

6. Graphs
Figure7: Min / Max rates: University by experience, National (RSA Only)
Figure 8: Min / Max rates: University of Technology by experience, National (RSA only)
-
200 000
400 000
600 000
800 000
1 000 000
1 200 000
1 400 000
1 600 000
1 800 000
0 - 2 years 3 - 5 years 6 - 10 years 11 - 20 years 21 - 30 years 30+ years
University Salary levels by experience | March 2017
Lowest Highest
-
200 000
400 000
600 000
800 000
1 000 000
1 200 000
1 400 000
0 - 2 years 3 - 5 years 6 - 10 years 11 - 20 years 21 - 30 years 30+ years
University of TechnologySalary levels by experience | March 2017
Lowest Highest
18

Figure 9: Min / Max rates: No formal education by experience, National (RSA only)
Figure 10: Average annual remuneration, University, National (RSA Only)
-
100 000
200 000
300 000
400 000
500 000
600 000
700 000
800 000
900 000
0 - 2 years 3 - 5 years 6 - 10 years 11 - 20 years 21 - 30 years 31+ years
No formalSalary levels by experience | March 2017
Lowest Highest
0-5 YRS 6-10 YRS 11-20 YRS 21-30 YRS 30+ YRS
2009 229 477 436 511 590 135 694 298 622 652
2010 249 655 485 056 614 505 691 060 609 926
2011 233 477 443 971 592 206 686 646 724 640
2012 244 310 500 876 658 783 664 858 763 613
2013 249 809 425 205 639 779 790 301 814 143
2014 264 644 483 386 678 568 838 273 751 188
2015 265 171 475 346 715 878 826 638 890 642
2016 280 250 496 753 654 382 728 647 663 730
2017 311 981 532 116 782 243 906 948 861 501
0
100 000
200 000
300 000
400 000
500 000
600 000
700 000
800 000
900 000
1 000 000
Rand
, cur
rent
pric
es
Qualification: UniversityAverage remuneration by experience
19

Figure 11: Average annual remuneration: University of Technology, National (RSA only)
Figure 12: Average annual remuneration: No formal education, National (RSA only)
0-5 YRS 6-10 YRS 11-20 YRS 21-30 YRS 30+ YRS
2009 194 284 366 878 457 409 449 262 578 664
2010 199 358 381 357 455 761 396 060 521 578
2011 178 124 376 445 451 645 467 855 498 351
2012 165 606 366 302 451 121 443 252 344 500
2013 171 045 357 058 559 986 561 684 422 644
2014 208 275 320 824 521 739 653 037 840 000
2015 201 908 369 799 564 688 752 667 820 829
2016 222 167 358 094 539 130 759 338 758 532
2017 243 717 411 192 643 815 695 715 834 432
0
100 000
200 000
300 000
400 000
500 000
600 000
700 000
800 000
900 000Ra
nd, c
urre
nt p
rices
Qualification: University of TechnologyAverage remuneration by experience
0-5 YRS 6-10 YRS 11-20 YRS 21-30 YRS 30+ YRS
2009 129 051 159 886 226 978 370 528 506 968
2010 135 661 178 667 318 159 430 500 276 919
2011 108 031 192 780 228 944 367 719 363 422
2012 107 239 262 183 253 250 91 682 289 126
2013 127 920 248 033 290 366 226 842 391 182
2014 170 315 268 836 480 000 873 600 401 529
2015 166 973 205 433 339 674 507 966 390 038
2016 194 608 295 815 297 372 566 220 399 678
2017 115 914 215 501 396 154 330 932 416 448
0100 000200 000300 000400 000500 000600 000700 000800 000900 000
1 000 000
Rand
, cur
rent
pric
es
Qualification: No formal educationAverage remuneration by experience
20
Recommended