The anti-mitotic agents PTC-028 and PTC596 display potentactivity in pre-clinical models of multiple myeloma but chal-lenge the role of BMI-1 as an essential tumour gene
Arnold Bolomsky,1 Jos�ephine
Muller,2 Kathrin Stangelberger,1
Margaux Lejeune,2 Elodie Duray,2
Helene Breid,1 Louise Vrancken,2
Christina Pfeiffer,1 Wolfgang H€ubl,3
Martin Willheim,3 Marla Weetall,4 Art
Branstrom,4 Niklas Zojer,1 Jo Caers2
and Heinz Ludwig1
1Department of Medicine I, Wilhelminen
Cancer Research Institute,
Wilhelminenspital, Vienna, Austria,2Laboratory of Hematology, GIGA-I3,
University of Li�ege, Li�ege, Belgium,3Department of Laboratory Medicine,
Wilhelminenspital, Vienna, Austria, and4PTC Therapeutics Inc, South Plainfield,
NJ, USA
Received 3 October 2019; accepted for
publication 2 March 2020
Correspondence: Heinz Ludwig, Department of
Medicine I, Wilhelminen Cancer Research
Institute, Wilhelminenhospital, Montleartstraße
37, 1160 Vienna, Austria.
E-mail: [email protected]
Summary
Future progress in the treatment of multiple myeloma (MM) requires both
the characterisation of key drivers of the disease and novel, innovative
approaches to tackle these vulnerabilities. The present study focussed on
the pre-clinical evaluation of a novel drug class, BMI-1 modulators, in
MM. We demonstrate potent activity of PTC-028 and PTC596 in a com-
prehensive set of in vitro and in vivo models, including models of drug
resistance and stromal support. Treatment of MM cells with PTC-028 and
PTC596 downregulated BMI-1 protein levels, which was found to correlate
with drug activity. Surprisingly, BMI-1 was dispensable for the activity of
BMI-1 modulators and MM cell growth. Our data rather point to mitotic
arrest accompanied by myeloid cell leukaemia-1 (MCL-1) loss as key anti-
MM mechanisms and reveal impaired MYC and AKT signalling activity
due to BMI-1 modulator treatment. Moreover, we observed a complete
eradication of MM after PTC596 treatment in the 5TGM.1 in vivo model
and define epigenetic compounds and B cell leukaemia/lymphoma 2
homology domain 3 (BH3) mimetics as promising combination partners.
These results bring into question the postulated role of BMI-1 as an essen-
tial MM gene and confirm BMI-1 modulators as potent anti-mitotic agents
with encouraging pre-clinical activity that supports their rapid translation
into clinical trials.
Keywords: BMI-1, myeloma, pre-clinical, PTC-028, PTC596.
Introduction
Although intensified research efforts throughout the last dec-
ade have led to a striking extension in the clinical armamen-
tarium to combat multiple myeloma (MM), MM remains a
difficult to treat disease, particularly in the relapsed/refrac-
tory setting.1 This is at least in part attributed to the fact that
several known drivers of MM cannot be effectively targeted.
Although innovative strategies such as proteolysis targeting
chimeras (PROTACs) raise hope to hit several neoplastic key
factors in the near future, these novel drugs are currently
only available for a limited number of targets (most notably
bromodomain-containing protein 4 [BRD4]).2 Many other
established drivers of MM, and human malignancies in gen-
eral, remain currently ‘undruggable’.
The polycomb group protein BMI-1 represents a promi-
nent intrinsic driver without a suitable clinical grade
inhibitor. BMI-1 was discovered as an accelerator of MYC-
driven lymphomas3 and subsequent studies revealed its pleio-
tropic function in several cellular processes (e.g. cell cycle,
DNA damage, apoptosis, senescence, and self-renewal of stem
cells).4 BMI-1 was also shown to play a central role in cancer
stem cell growth and survival in various neoplasia.4-7 Mecha-
nistically, BMI-1 acts as part of the polycomb repressive
complex 1 (PRC1), which represses gene expression via
mono-ubiquitination of histone H2A at lysine 119. This pro-
cess is tightly coupled with PRC2-mediated histone H3 lysine
27 (H3K27)-trimethylation and initiates the recruitment of
DNA methyltransferases (DNMTs) for stable silencing of dis-
tinct chromatin regions.8 More recent insights challenged this
hierarchical model by revealing PRC2-independent recruit-
ment of PRC1, which led to the classification of the diverse
PRC1 functions into canonical and non-canonical mecha-
nisms.9 Regarding myeloma, BMI-1 overexpression was
research paper
ª 2020 British Society for Haematology and John Wiley & Sons LtdBritish Journal of Haematology, 2020, 190, 877–890
First published online 30 March 2020doi: 10.1111/bjh.16595

linked to the pathogenesis of MM more than a decade ago.10
Silencing of BMI-1 with short-hairpin RNAs (shRNAs) was
shown to impair the outgrowth of myeloma cells in vitro and
in vivo via modulation of B-cell leukaemia/lymphoma 2 (Bcl-
2) family members (i.e. Bim and Bax).11,12 These findings
established its role as an essential MM gene.
We and others recently confirmed BMI-1 overexpression
as a hallmark of MM and its putative role as a drug target
using the small molecule inhibitor PTC-209.13,14 Based on
these observations, in the present study, we explored the
anti-myeloma efficacy of the first-in-class BMI-1 modulators
PTC-028 and PTC596. BMI-1 modulators have been
described to target BMI-1 in an indirect manner via inhibi-
tion of the anaphase promoting complex (APC/C)CDC20 lead-
ing to persistent cyclin-dependent kinase (CDK)1/2 activity
and BMI-1 hyper-phosphorylation, as well as reduced PRC1
activity.15 However, recent data questioned the role of BMI-1
for the activity of PTC596 and rather pointed to BMI-1
modulators as potent microtubule polymerisation inhibi-
tors.16 Importantly, these compounds are active at low
nanomolar concentrations and differ from other agents of
this drug class by the lack of neurotoxicity, making them
interesting candidates for clinical programmes, which is
underlined by several early phase trials that are currently
examining the potency of the lead compound PTC596 in
solid tumours (ClinicalTrials.gov Identifiers: NCT02404480,
NCT03206645, NCT03605550, NCT03761095).
Patients and Methods
Patient samples
Primary MM cells were purified from patients with MM
undergoing routine bone marrow (BM) aspiration at the
Department of Medicine I (Wihelminenspital, Vienna). Writ-
ten informed consent for the use of material for scientific
studies was obtained from these patients according to institu-
tional guidelines. Mononuclear cells were isolated by Ficoll-
Hypaque density sedimentation and MM cells were purified
using the EasySepTM Human CD138 Positive Selection Kit
(Stemcell Technologies Inc., Cologne, Germany) and used
for co-culture experiments as previously described.17
Flow cytometry
The measurement of apoptosis by Annexin V/7-amino-acti-
nomycin (AAD) staining, JC-1 assay, detection of cleaved
poly-[ADP-ribose]-polymerase (PARP), as well as cell cycle
analysis have been previously described.14,17 For the evalua-
tion of co-culture experiments MM cells were distinguished
from BM stromal cell (BMSC) telomerase reverse tran-
scriptase (TERT)+ cells via green fluorescent protein (GFP)
expression in stromal cells.18 Intracellular staining of BMI-
1 (phycoerthyrin [PE] mouse anti-human BMI-1 antibody
#562528; PE mouse immunoglobulin (Ig)G1j isotype
control: #554680) was performed using the BD Transcrip-
tion Factor Buffer Set according to the manufacturer’s
instructions (BD Biosciences, San Jose, CA, USA). BMI-1
negativity by flow cytometry was defined by the concurrent
use of the isotype control and displayed as relative shift
after BMI-1 modulator treatment
( BMI1 negative cells post treatmentBMI1 negative cells without drug exposure). Histone 3 phospho-Serine-28
levels were analysed with a commercially available antibody
(BD Biosciences) according to the manufacturer’s instruc-
tions. Analyses were performed on a FACScan and FACS
Canto II (BD Biosciences).
Cytotoxicity, colony formation and cell growth assays
Viability and colony formation was determined using Cell
Counting Kit 8 (GERBU Biotechnik, Heidelberg, Germany)
and MethoCult Classic medium (StemCell Technologies,
Cologne, Germany) as previously described.14 For the evalua-
tion of MM cell growth post-transduction with BMI-1
shRNAs or overexpression vectors, MM cells (50 000/ml)
were seeded in 24-well plates and cell numbers were deter-
mined over a period of 8 days using a Z2 Cell and Particle
Counter (Beckman Coulter, Brea, CA, USA). In brief, cells
were re-suspended at the indicated days and 20 µl cell sus-pension per well was used for the determination of total cell
numbers.
In vivo studies
In vivo experiments were performed using the 5TGM.1 mur-
ine model of myeloma as previously described.19 These
experiments were approved by the ethical committee for ani-
mal experiments of the University of Li�ege (ULg license #16-
1897). Treatment was initiated 1 day after the injection of
myeloma cells (9-week-old female mice were injected i.v.
with 5�0 9 105 5TGM.1GFP + cells). After tumour inocula-
tion, the mice were followed and examined on a daily sched-
ule, evaluating (i) their mobility and movements, (ii) their
posture and global attitude, (iii) social behavior and (iv)
their pilosity (Table S5). Because tumour take is homoge-
nous, the number of mice to be included can be reduced to
five mice per group. Mice were randomly divided into a
na€ıve (healthy controls), a vehicle-treated (5TGM.1 mye-
loma-bearing mice receiving vehicle solution) and a treat-
ment group (5TGM.1 myeloma-bearing mice receiving
PTC596). PTC596 was dissolved in 0�5% HP-methylcellulose
and 0�1% Tween-80 and administered by oral gavage at
either 7�5 mg/kg/biweekly, 15 mg/kg/biweekly, or 30 mg/kg/
weekly. When mice showed signs of active myeloma, that is,
paraplegia, all mice within a cohort were humanely killed. At
the end of the treatment period (day 29 in this study) the
efficacy of PTC596 was determined by quantifying BM mye-
loma cell infiltration via flow cytometry (GFP + 5TGM.1)
and comparing IgG serum concentrations. This experiment
was repeated twice.
A. Bolomsky et al.
878 ª 2020 British Society for Haematology and John Wiley & Sons LtdBritish Journal of Haematology, 2020, 190, 877–890

Statistical analysis
A two-tailed unpaired t-test was performed for the compar-
ison of two means and Kruskal–Wallis test followed by a
Dunn’s test for multiple comparisons for the comparison of
more than two means by GraphPad Prism 6 (GraphPad Soft-
ware Inc., La Jolla, CA, USA). P values < 0�05 were consid-
ered to be statistically significant. Drug combinations were
analysed with CompuSyn software (www.combosyn.com).
Combination index (CI) values of < 0�8, 0�8–1�2, and >1�2were interpreted as synergistic, additive, and antagonistic
drug activity, respectively. Dependency scores for BMI-1,
MYC and interferon regulatory factor 4 (IRF4) were obtained
from the depmap project webportal of the BroadInstitute
(Q4, 2018 release). All graphs represent the mean � SD of
three independent biological replicates, each with three tech-
nical replicates, unless otherwise indicated.
A detailed description of additional materials and methods
used is provided in the Online Supplement of the manuscript.
Results
BMI-1 modulators target BMI-1 and impair MM cellviability
Given the non-direct impact of BMI-1modulators on BMI-1 func-
tion and protein levels, we first investigated whether PTC-028 and
PTC596 target BMI-1 in myeloma cells. Both compounds induced
a time-dependent reduction of BMI-1 protein levels (Fig 1A).
Dose-response curves demonstrated a significant impact on MM
cell (but not BMSC) viability at low nanomolar concentrations
(Fig 1B). The median half-maximal inhibitory concentration
(IC50) levels 96 h after treatment (PTC-028: 39�6 nM, range:
11�7–102�3; PTC596: 57�2 nM; range: 16�9–137�2 nM) were sig-
nificantly lower compared to the previously reported BMI-1 inhi-
bitor PTC-209 (median IC50 680 nM, range: 207–5676, P < 0�05)(Fig S1). Similar potency was observed in ixazomib- and carfil-
zomib-resistant cell line variants (Fig S2). Importantly, the 96-h
IC50 levels correlated with the accumulation of BMI-1-negative
cells 24 h after treatment. Five out of seven MM cell lines analysed
displayed a relative shift of BMI-1-negative cells at the single cell
level (flow cytometry) 24 h after treatment. The median (range)
percentage of BMI-1-negative cells increased from 32�2 (21�1–61�8)% in untreated cells to 43�3 (27�4–54�6)% and 40�2 (26�9–58�7)% in PTC-028- and PTC596-treated cells, respectively. This
suggests that early fluctuations of BMI-1 protein levels in a sub-
fraction of tumour cells could serve as a predictive biomarker in
future clinical programmes (Fig 1C). No association was seen
between baseline BMI-1 mRNA or protein expression and IC50
levels (not shown).
BMI-1 is dispensable for the activity of BMI-1modulators and MM cell growth
To analyse whether BMI-1 degradation is responsible for the
activity of PTC-028 and PTC596, we generated BMI-1
overexpressing cell lines. There was no difference between
the growth of control (EGFP overexpression) and BMI-1
overexpressing cells (Figs S3A). In addition, we observed no
rescue effect against BMI-1 modulators in cell lines with
BMI-1 overexpression, suggesting that other mechanisms are
responsible for their potent anti-MM activity (Figs S3B).
To strengthen this finding, we generated stable BMI-1
knockdown variants using five BMI-1 shRNAs in four
human multiple myeloma cell lines (HMCLs) with distinct
genomic background (Fig 2A). Again, PTC-028 and PTC596
activity did not differ between cells expressing scrambled or
BMI-1-specific shRNAs (Fig 2B). In contrast to a previous
report,12 similar findings were made for bortezomib, which
was confirmed in an independent dataset (Figs S4). Surpris-
ingly, we also did not observe any long-term impact on the
growth of BMI-1-silenced MM cells. We successfully gener-
ated 19 out of 20 BMI-1 shRNA transduced cell line variants
21 days after transduction (exception: RPMI8226, shRNA
#20155). Although there was a minor delay on the outgrowth
of BMI-1 silenced compared to control cell lines immediately
after transduction (not shown), we observed no major differ-
ence in the growth characteristics of stable selected control
or BMI-1-silenced cell lines (Fig 2C). Findings from colony
formation assays supported these results. A significant impact
(73% reduction in colony numbers, P = 0�006) was only
noted with one of two BMI1-shRNAs in RPMI8226, but not
OPM2 and KMS12BM cells (Fig 2D). This indicates a non-
essential role of BMI-1 for MM cell growth and survival.
To confirm this unexpected finding we analysed publi-
cally available Clustered Regularly Interspaced Short Palin-
dromic Repeats (CRISPR)/Cas9 data.20,21 Although BMI-1
expression was higher in MM cell lines compared to all
other tumour cell line models (Figs S5), BMI-1 was clearly
indicated as non-essential gene in 18/18 MM cell lines
(median dependency score 0�06, range: �0�17 to 0�33). On
the contrary, dependency scores for IRF4 and MYC were
<�1 underlining their established role as key MM genes
(Fig 2E). This suggests that complete loss of BMI-1 is sim-
ilarly ineffective to impair MM cell survival and that BMI-
1 is likely not a key molecule for BMI-1 modulator activ-
ity.
BMI-1 modulators induce mitotic arrest that isaccompanied by loss of myeloid cell leukaemia-1 (MCL-1) and subsequent induction of apoptosis in myelomacells
Based on the recent disclosure of PTC596 as microtubule
inhibitor,16 we studied the effect of PTC-028 and PTC596 on
the MM cell cycle to clarify their mode of action. A signifi-
cant accumulation of Cyclin B1 protein levels indicated
mitotic arrest (Fig 3A), which was further confirmed via
May-Giemsa Gr€unwald stainings, cell cycle analysis, as well
as assessment of phospho-Serine 28 levels of Histone H3 via
flow cytometry (Fig 3B–D). The induction of mitotic arrest
BMI-1 modulators in myeloma
ª 2020 British Society for Haematology and John Wiley & Sons Ltd 879British Journal of Haematology, 2020, 190, 877–890

was in concert with upregulation of mitotic genes at the
mRNA level [e.g. Cyclin B1 (CCNB1), aurora kinase A
(AURKA), baculoviral IAP repeat containing 5 (BIRC5)]. In
addition, although not reaching statistical significance, MCL-
1 mRNA expression was downregulated suggesting loss of
MCL-1 (and thus reduced viability) in response to mitotic
arrest (Table S4).
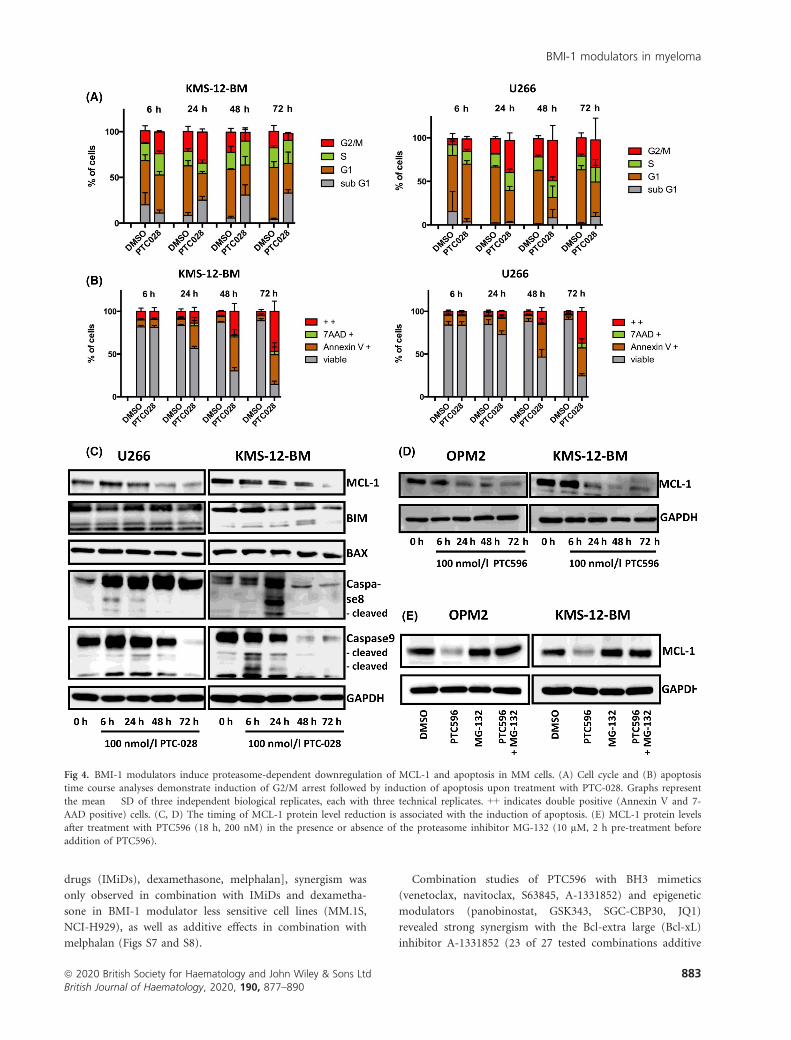
Serial assessment of MM cell lines KMS-12-BM and U266
after PTC-028 treatment clearly showed that the induction of
apoptosis is preceded by G2/M cell cycle arrest (Fig 4A, B).
Fig 1. BMI-1 modulators target BMI-1 and myeloma cell viability. (A) BMI-1 protein levels after PTC-028 and PTC596 treatment. (B) Viability
curves 96 h after PTC-028 and PTC596 treatment in a panel of human MM cell lines and BM stromal cells (BMSCs). Graphs represent the
mean � SD of three independent biological replicates, each with three technical replicates. (C) Intracellular determination of BMI-1 protein levels
via flow cytometry. Linear regression analysis demonstrated a significant association between the accumulation of BMI-1 negative cells (relative to
untreated control cells) 24 h after treatment and PTC-028 or PTC596 IC50 levels. Y-axis indicates the relative increase of BMI-1 negative cells in
treated compared to untreated MM cells ( BMI 1 negative cells post treatmentBMI1 negative cells without drug exp osure). Corresponding Pearson correlation coefficients and P values are shown
in the graphs.
A. Bolomsky et al.
880 ª 2020 British Society for Haematology and John Wiley & Sons LtdBritish Journal of Haematology, 2020, 190, 877–890

Fig 2. BMI-1 is dispensable for the activity of BMI-1 modulators and myeloma cell growth. (A) Protein expression of stable selected cell line vari-
ants transduced with five distinct shRNAs targeting BMI-1 in four MM cell lines. (B) PTC596 and PTC-028 are similar effective in BMI-1-si-
lenced and control (scrambled shRNA) MM cell line variants. Viability assessment was performed 96 h after BMI-1 modulator treatment. (C) No
difference was observed between the cell growth of control (scrambled shRNA) and BMI-1-silenced MM cell line variants. Cell numbers were
determined at the indicated time points using a coulter counter. Graphs represent the mean � SD of three independent biological replicates, each
with three technical replicates. (D) Colony formation assays with three MM cell lines transduced with either control or BMI-1-specific shRNAs.
(E) CRISPR data demonstrate that BMI-1 is a non-essential gene in MM. IRF4 and MYC served as control (dependency score of zero indicates
non-essential genes, Dependency score of �1 indicates common essential tumour genes). The graph displays median dependency scores � in-
terquartile range of 18 MM cell lines.
BMI-1 modulators in myeloma
ª 2020 British Society for Haematology and John Wiley & Sons Ltd 881British Journal of Haematology, 2020, 190, 877–890

The decrease in MCL-1 protein levels was coupled to this
process and linked to the presence of cleaved caspase 8 and 9
at 6–48 h after treatment (Fig 4C, D). In accordance with
the reported proteasomal degradation of MCL-1 during pro-
longed mitosis,22 we found that BMI-1 modulator induced
loss of MCL-1 depends on proteasome activity (Fig 4E).
Dose-dependent induction of apoptosis was subsequently
confirmed in additional MM cell lines and shown to be pre-
ceded by the presence of cleaved PARP and loss of the mito-
chondrial membrane potential (Fig 5A–C). Importantly,
BMI-1 modulators were active in colony formation assays, in
the presence of stromal support, as well as in primary MM
cells (Fig 5D–F).
BMI-1 modulators affect MYC and AKT signallingactivity
BMI-1 was initially reported to promote MYC-driven lym-
phomagenesis.3 Hence, we explored whether BMI-1 modula-
tors interfere with the activity of MYC and indeed observed
reduced MYC protein expression in response to PTC-028
and PTC596 (Fig 6A). This was corroborated by MYC activ-
ity assays showing significantly reduced DNA binding activity
24 h after treatment (Fig 6B). In addition, we observed loss
of Forkhead box protein M1 (FOXM1) protein levels (Fig
S6), another factor implicated in high-risk MM,23 as well as
reduced AKT signalling activity due to a loss of total AKT1
levels (Fig 6C). No impact was found on extracellular signal-
regulated kinase (ERK) or glycogen synthase kinase-3 beta
(GSK3b) signalling activity (not shown).
BMI-1 modulation in combination with BH3 mimeticsor enhancer of zeste homologue 2 (EZH2) inhibition issynergistic
To define combination partners for BMI-1 modulators in the
clinical setting, we tested a diverse set of approved and
experimental anti-MM agents. Among approved anti-MM
drugs [proteasome inhibitors, immunomodulatory imide
Fig 3. BMI-1 modulators induce a potent mitotic arrest in myeloma
cells. (A) Cyclin B1 protein levels after PTC-028 and PTC596 treat-
ment. (B) Mitotic arrest assessed by May-Giemsa Gr€unwald staining.
Representative images (960 magnification) of KMS-12-BM cells 24 h
after treatment with PTC-028 are shown (green arrowheads indicate
mitotic cells). (C) Cell cycle analysis via flow cytometry indicated
BMI-1 modulator induced accumulation of MM cells in mitosis 24 h
after treatment (brown: G1 phase, green: S phase, and red: G2/M
phase). (D) Histone H3 phospho-Serine 28 levels were assessed by flow
cytometry to further confirm the induction of mitotic arrest 24 h after
treatment with either PTC-028 or PTC596 at 100 nM, respectively.
Graphs represent the mean � SD of three independent biological
replicates, each with three technical replicates (n = 4 four biological
replicates in case of pS28 H3 evaluation). P values indicate significance
in comparison with untreated (0�1% dimethyl sulphoxide [DMSO])
cells.
A. Bolomsky et al.
882 ª 2020 British Society for Haematology and John Wiley & Sons LtdBritish Journal of Haematology, 2020, 190, 877–890
drugs (IMiDs), dexamethasone, melphalan], synergism was
only observed in combination with IMiDs and dexametha-
sone in BMI-1 modulator less sensitive cell lines (MM.1S,
NCI-H929), as well as additive effects in combination with
melphalan (Figs S7 and S8).
Combination studies of PTC596 with BH3 mimetics
(venetoclax, navitoclax, S63845, A-1331852) and epigenetic
modulators (panobinostat, GSK343, SGC-CBP30, JQ1)
revealed strong synergism with the Bcl-extra large (Bcl-xL)
inhibitor A-1331852 (23 of 27 tested combinations additive
Fig 4. BMI-1 modulators induce proteasome-dependent downregulation of MCL-1 and apoptosis in MM cells. (A) Cell cycle and (B) apoptosis
time course analyses demonstrate induction of G2/M arrest followed by induction of apoptosis upon treatment with PTC-028. Graphs represent
the mean � SD of three independent biological replicates, each with three technical replicates. ++ indicates double positive (Annexin V and 7-
AAD positive) cells. (C, D) The timing of MCL-1 protein level reduction is associated with the induction of apoptosis. (E) MCL-1 protein levels
after treatment with PTC596 (18 h, 200 nM) in the presence or absence of the proteasome inhibitor MG-132 (10 µM, 2 h pre-treatment before
addition of PTC596).
BMI-1 modulators in myeloma
ª 2020 British Society for Haematology and John Wiley & Sons Ltd 883British Journal of Haematology, 2020, 190, 877–890

Fig 5. Dose-dependent induction of apoptosis is linked to mitochondrial membrane depolarisation and persists in the presence of stromal sup-
port and colony formation assays. (A) Dose-dependent induction of apoptosis (Annexin V/7-AAD staining) in a panel of MM cell lines 72 h after
treatment. (B) Detection of cleaved PARP and (C) loss of the mitochondrial membrane potential 48 h after BMI-1 modulator treatment, respec-
tively. (D) BMI-1 modulators induce apoptosis in MM cells in the presence of stromal support (BMSCs) 72 h after treatment. (E) PTC-028
impairs clonogenic replication of MM cells in colony formation assays. (F) The efficacy of PTC-028 and PTC596 was assessed in primary MM
cells in the presence of BMSC TERT+ cells. Viable cells were determined 72 h after treatment initiation. Experiments with primary cells were
repeated once. All other graphs represent the mean � SD of three independent biological replicates, each with three technical replicates. P values
indicate significance in comparison with untreated (0�1% dimethyl sulphoxide [DMSO]) cells.
A. Bolomsky et al.
884 ª 2020 British Society for Haematology and John Wiley & Sons LtdBritish Journal of Haematology, 2020, 190, 877–890

Fig 6. BMI-1 modulators impair MYC and AKT signalling activity. (A) MYC protein levels after PTC-028 and PTC596 treatment. (B) MYC
DNA binding activity 24 h after PTC-028 treatment. (C) Phospho-Serine 473, total and phospho/total AKT activity 24 h after treatment with
PTC-028. Graphs represent the mean � SD of three independent biological replicates, each with three technical replicates. P values indicate sig-
nificance in comparison with untreated (0�1% DMSO) cells.
BMI-1 modulators in myeloma
ª 2020 British Society for Haematology and John Wiley & Sons Ltd 885British Journal of Haematology, 2020, 190, 877–890

or synergistic) and the EZH2 inhibitor GSK343 in OPM2
and KMS12BM cells at high-dose levels. Panobinostat tended
to enhance the efficacy of PTC596 when both drugs were
used at the highest dose (Figs S9). In addition, we observed
additive activity in combination with the MCL-1 inhibitor
S63845 in KMS-12-BM cells (median CI: 0�86, range: 0�31–1�76), as well as synergistic and additive activity with the Bcl-
2 inhibitor venetoclax in OPM2 and KMS12BM cells, respec-
tively (OPM2: median CI 0�40, range: 0�21–11�05; KMS-12-
BM: 1�11, 0�69–1�50) (Figs S9B-S10A). No synergistic effect
was noted with JQ1 and CBP30 (Figs S10B).
To strengthen these findings, we analysed the induction of
apoptosis in HMCLs treated with PTC596 � GSK343 (EZH2
inhibitor), A-1331852 (Bcl-xL inhibitor) or panobinostat
used at sub-optimal concentrations in mono- and co-culture.
All three drug combinations were significantly more effective
than the corresponding monotherapies and/or the only treat-
ment condition that significantly reduced viable cell numbers
compared to control. Importantly, this effect persisted in the
co-culture setting (Fig 7).
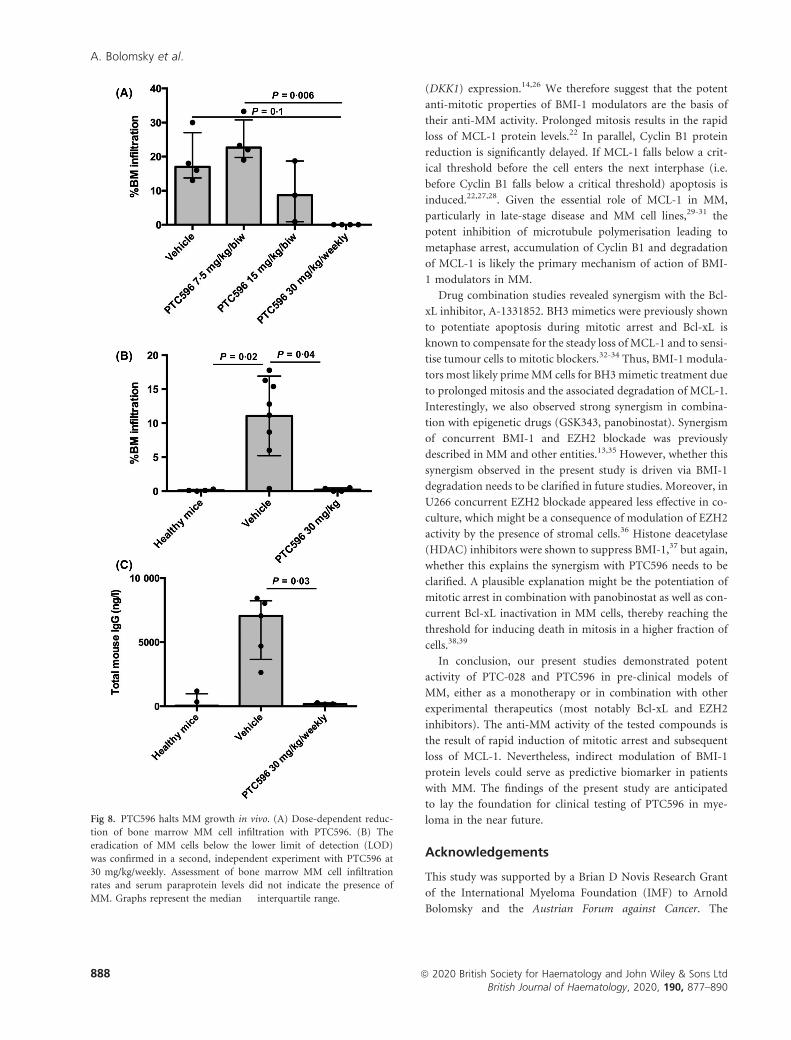
PTC596 shows potent in vivo activity
Finally, we explored the activity of the clinical lead com-
pound PTC596 in the 5TGM.1 model of MM. In accordance
with our in vitro findings, we observed a dose-dependent
reduction of BM MM cell infiltration. Twice weekly adminis-
tration of PTC596 at 15 mg/kg led to a 48�9% reduction of
MM-BM infiltration (P > 0�05) and weekly treatment with
PTC596 at a dose of 30 mg/kg led to a complete eradication
(i.e. <lower limit of detection, LOD) of MM cells (P = 0�1).These impressive results were confirmed in a second, inde-
pendent experiment demonstrating a normalisation of para-
protein levels (P = 0�03) and absence of MM cells in the BM
with PTC596 at 30 mg/kg/weekly (P = 0�04) (Fig 8, Fig S11).
Toxicological analysis demonstrated no statistically significant
impact on white blood cell counts, neutropenia or anaemia.
Similarly, we did not observe any impact of PTC596 on body
weight; and the performance score (based on the presence
and severity of paraplegia, altered posture and diminished
activity) completely normalised in mice treated with 30 mg/
kg PTC596 (Fig S12, Table 6).
Discussion
The achievement of long-term disease control has evolved as
a major treatment goal in MM. To further increase the frac-
tion of patients with prolonged progression-free and overall
survival rates, novel treatment opportunities are needed for
late-stage (e.g. penta-refractory patients) and high-risk dis-
ease. This is most likely realised by targeting well-established
key players of MM pathophysiology. BMI-1 is a prominent
example of oncogenic factors against which active inhibitors
are not available as yet. We therefore analysed the
pre-clinical activity of the first-in-class BMI-1 modulators
PTC-028 and PTC596.
Both compounds demonstrated striking in vitro activity
with significantly reduced IC50 levels (> 10-fold reduction)
compared to PTC-209 in treatment na€ıve, as well as protea-
some inhibitor-resistant MM cell line models. In vivo, we
observed complete eradication of MM cells in two indepen-
dent experiments, with no severe impact on animal health
(stable body weight, improved performance score). The asso-
ciation between IC50 levels and BMI-1 depletion in MM cells
suggests that BMI-1 levels before and shortly after treatment
(e.g. in circulating tumour cells) could serve as a predictive
marker. However, we have to note that this requires access
to clinically validated and standardised reagents (antibodies).
BMI-1 modulators induce hyper-phosphorylation of BMI-
115,24 and only reagents that adequately reflect BMI-1 levels
in the presence of post-translational modifications can lead
to the definition of clinically useful results.
Mechanistically, BMI-1 modulators induced a potent
mitotic arrest, followed by loss of MCL-1 and induction of
apoptosis. This is in accordance with previous studies analys-
ing the activity of APC/CCDC20 inhibitors in MM or the effi-
cacy of PTC596 in pre-clinical tumour models.16,24,25
Regarding the role of BMI-1 for the growth of MM, cell
growth and colony formation assays showed a significant
impact of BMI-1 silencing in only one cell line (RPMI8226).
Intriguingly, the postulation of BMI-1 as an essential MM
gene was mainly based on work with RPMI8226. Re-inter-
preting this study with the data from our present work in
mind highlights the less pronounced activity of BMI-1-
shRNAs in KMS-12-BM and LP-1 cells (<30% apoptotic cells
after doxycycline-inducible BMI-1 silencing).11 Accordingly,
we only observed a slight delay in the outgrowth of BMI-1-
shRNA versus control-shRNA transduced cells immediately
post-transduction (not shown), but no impact 14 days post-
transduction. This indicates that BMI-1 silencing might have
a minor transient effect, but also exemplifies that the term
‘essential gene’ should be used with more caution and only
for targets that truly result in a complete inhibition of
tumour cell growth. This is supported by publically available
CRISPR data from 18 MM cell lines clearly demonstrating
the non-essential role of BMI-1 in MM. Similar findings were
made in pancreatic ductal adenocarcinoma models.16 In
addition, our present data do not support the reported asso-
ciation between BMI-1 expression and sensitivity to borte-
zomib.12 However, we cannot exclude a putative essential
role for BMI-1 in certain circumstances/disease states (e.g.
tumour initiation, tumour propagating cells, drug resistance,
distinct stress situations) or in tumour cells embedded in the
BM niche where they are faced with different conditions
compared to routine in vitro culture (e.g. hypoxia). Hence,
the specific role of BMI-1 in MM needs to be clarified in
future studies that go beyond the routine in vitro culture of
bulk tumour cell populations.
A. Bolomsky et al.
886 ª 2020 British Society for Haematology and John Wiley & Sons LtdBritish Journal of Haematology, 2020, 190, 877–890

BMI-1 modulators are not direct inhibitors of BMI-1.15,16
We therefore explored whether BMI-1 is required for the
activity of BMI-1 modulators. In line with our observation
that BMI-1 is a non-essential gene, modulation of BMI-1
expression had no impact on the activity of PTC-028 or
PTC596 suggesting that BMI-1 is not required for drug activ-
ity. This is strongly supported by similar results from an
independent study in BMI-1 knockout cells.16 The non-direct
impact of PTC-028 and PTC596 on BMI-1 is also reflected
by several in vitro findings obtained during the present study
that contrast previous reports on BMI-1 silencing or inhibi-
tion.3,11,14 For instance, here, we noted a G2/M versus
expected G1 cell cycle arrest or stable versus expected upregu-
lation of Dickkopf WNT signalling pathway inhibitor 1
Fig 7. Potentiation of BMI-1 modulator activity with BH3 mimetics and epigenetic compounds. Induction of apoptosis was assessed by Annexin
V and 7-AAD staining 72 h after treatment in MM cell mono- and co-culture with BMSCs. All graphs represent the mean � SD of three inde-
pendent biological replicates, each with three technical replicates. Multiple comparisons were performed by Kruskal–Wallis and Dunn’s multiple
comparisons test of pooled results (mono + co-culture, significant differences are indicated by P values), as well as within mono- or co-culture
experiments (a, P < 0�05; b, P < 0�01 vs control cells, i.e. 0�1% dimethyl sulphoxide [DMSO]).
BMI-1 modulators in myeloma
ª 2020 British Society for Haematology and John Wiley & Sons Ltd 887British Journal of Haematology, 2020, 190, 877–890
(DKK1) expression.14,26 We therefore suggest that the potent
anti-mitotic properties of BMI-1 modulators are the basis of
their anti-MM activity. Prolonged mitosis results in the rapid
loss of MCL-1 protein levels.22 In parallel, Cyclin B1 protein
reduction is significantly delayed. If MCL-1 falls below a crit-
ical threshold before the cell enters the next interphase (i.e.
before Cyclin B1 falls below a critical threshold) apoptosis is
induced.22,27,28. Given the essential role of MCL-1 in MM,
particularly in late-stage disease and MM cell lines,29-31 the
potent inhibition of microtubule polymerisation leading to
metaphase arrest, accumulation of Cyclin B1 and degradation
of MCL-1 is likely the primary mechanism of action of BMI-
1 modulators in MM.
Drug combination studies revealed synergism with the Bcl-
xL inhibitor, A-1331852. BH3 mimetics were previously shown
to potentiate apoptosis during mitotic arrest and Bcl-xL is
known to compensate for the steady loss of MCL-1 and to sensi-
tise tumour cells to mitotic blockers.32-34 Thus, BMI-1 modula-
tors most likely primeMM cells for BH3mimetic treatment due
to prolonged mitosis and the associated degradation of MCL-1.
Interestingly, we also observed strong synergism in combina-
tion with epigenetic drugs (GSK343, panobinostat). Synergism
of concurrent BMI-1 and EZH2 blockade was previously
described in MM and other entities.13,35 However, whether this
synergism observed in the present study is driven via BMI-1
degradation needs to be clarified in future studies. Moreover, in
U266 concurrent EZH2 blockade appeared less effective in co-
culture, which might be a consequence of modulation of EZH2
activity by the presence of stromal cells.36 Histone deacetylase
(HDAC) inhibitors were shown to suppress BMI-1,37 but again,
whether this explains the synergism with PTC596 needs to be
clarified. A plausible explanation might be the potentiation of
mitotic arrest in combination with panobinostat as well as con-
current Bcl-xL inactivation in MM cells, thereby reaching the
threshold for inducing death in mitosis in a higher fraction of
cells.38,39
In conclusion, our present studies demonstrated potent
activity of PTC-028 and PTC596 in pre-clinical models of
MM, either as a monotherapy or in combination with other
experimental therapeutics (most notably Bcl-xL and EZH2
inhibitors). The anti-MM activity of the tested compounds is
the result of rapid induction of mitotic arrest and subsequent
loss of MCL-1. Nevertheless, indirect modulation of BMI-1
protein levels could serve as predictive biomarker in patients
with MM. The findings of the present study are anticipated
to lay the foundation for clinical testing of PTC596 in mye-
loma in the near future.
Acknowledgements
This study was supported by a Brian D Novis Research Grant
of the International Myeloma Foundation (IMF) to Arnold
Bolomsky and the Austrian Forum against Cancer. The
Fig 8. PTC596 halts MM growth in vivo. (A) Dose-dependent reduc-
tion of bone marrow MM cell infiltration with PTC596. (B) The
eradication of MM cells below the lower limit of detection (LOD)
was confirmed in a second, independent experiment with PTC596 at
30 mg/kg/weekly. Assessment of bone marrow MM cell infiltration
rates and serum paraprotein levels did not indicate the presence of
MM. Graphs represent the median � interquartile range.
A. Bolomsky et al.
888 ª 2020 British Society for Haematology and John Wiley & Sons LtdBritish Journal of Haematology, 2020, 190, 877–890

authors would like to thank Julia Huber and Waltraud
Scherbler for excellent technical assistance.
Author contributions
Arnold Bolomsky designed the study, performed experiments,
analysed the data and wrote the paper. Jos�ephine Muller,
Kathrin Stangelberger, Margaux Lejeune, Elodie Duray, Helene
Breid, Christina Pfeiffer and Louise Vrancken designed and
performed experiments, as well as analysed the results. Wolf-
gang H€ubl, Martin Willheim, Marla Weetall, Art Branstrom,
Niklas Zojer, Jo Caers and Heinz Ludwig participated in the
design of experiments. All authors interpreted the data, revised
and approved the final version of the manuscript.
Conflicts of interest
This study was supported by a Brian D. Novis Research
Grant of the International Myeloma Foundation (IMF) to
Arnold Bolomsky. Marla Weetall and Art Branstrom are
employees of PTC Therapeutics Inc. All other authors declare
no relevant conflicts of interests. PTC-028 and PTC596 were
kindly provided by PTC Therapeutics Inc.
Supporting Information
Additional supporting information may be found online in
the Supporting Information section at the end of the article.
Table SI. TaqMan assays used for quantitative polymerase
chain reaction (qPCR) experiments.
Table SII. Antibodies used for Western Blot experiments.
Table SIII. List of shRNAs used for BMI-1 silencing
experiments.
Table SIV. mRNA expression analysis of selected candi-
date genes in KMS-12-BM cells 6 and 24 hours post PTC-
028 or PTC596 treatment.
Table SV. Performance score evaluation during in vivo
studies. After tumour inoculation, the mice were followed
and examined on a daily schedule, evaluating (1) their
mobility and movements, (2) their posture and global atti-
tude (3) social behavior and (4) their pilosity as indicated in
the table.
Table SVI. Scoring results (performance score) of in vivo
studies. Treatment with PTC596 was well tolerated by mice
that showed no difficulties in their mobility or posture, while
the vehicle-treated mice displayed paraplegia or abnormal
postures. The table below shows the evolution of the weight
and scoring of the treated mice. The only mice that showed
clinical signs were the vehicle and low dose (7�5 mg/kg) trea-
ted with paraplegia and presence of a hunchback, both
related to myeloma development.
Fig S1. IC50 levels of PTC596 and PTC-028 are signifi-
cantly reduced compared to PTC-209. Median IC50 levels
(based on seven MM cell lines) of PTC596 and PTC-028 are
significantly reduced compared to those of PTC-209
(P < 0�05 compared to median PTC-209 IC50). The graph
displays median IC50 levels �interquartile range.
Fig S2. PTC596 and PTC-028 are similar active in models
of proteasome inhibitor resistance. The activity of (A) PTC-
028 and (B) PTC596 did not differ between proteasome inhi-
bitor sensitive and the corresponding ixazomib or carfil-
zomib resistant cell line variants. Viability was assessed 96
hours post-treatment. Graphs represent the mean � SD of
three independent experiments performed in triplicates.
Fig S3. BMI-1 overexpression does not affect MM cell
growth rates and BMI-1 modulator activity.
Fig S4. BMI-1 expression does not impact on bortezomib
sensitivity.
Fig S5. BMI-1 expression in a diverse panel of cancer cell
line models.
Fig S6. BMI-1 modulators downregulate FOXM1 protein
expression.
Fig S7. Drug combination studies of PTC-028 with estab-
lished anti-myeloma agents.
Fig S8. Drug combination studies of PTC596 with estab-
lished anti-myeloma agents.
Fig S9. PTC596 in combination with panobinostat,
GSK343, ABT199, and A-1331852.
Fig S10. PTC596 in combination with S63845, navitoclax,
CBP30, and JQ1.
Fig S11. Representative flow cytometry images of MM
bone marrow infiltration in the 5TGM.1 murine model.
Fig S12. Toxicological and well-being data of in vivo
experiments. No significant impact of PTC596 treatment was
observed on the indicated clinical parameters.
References
1. Rajkumar SV. Multiple myeloma: 2016 update on diagnosis, risk-stratifica-
tion and management. Am J Hematol. 2016;91:719–34.
2. Winter GE, Buckley DL, Paulk J, Roberts JM, Souza A, Dhe-Paganon S,
et al. DRUG DEVELOPMENT. Phthalimide conjugation as a strategy for
in vivo target protein degradation. Science (New York, N Y.), 348, 2015;
p. 1376–81.
3. Jacobs JJ, Scheijen B, Voncken JW, Kieboom K, Berns A, van Lohuizen M.
Bmi-1 collaborates with c-Myc in tumorigenesis by inhibiting c-Myc-in-
duced apoptosis via INK4a/ARF. Genes & Development. 1999;13:2678–90.
4. Bhattacharya R, Banerjee Mustafi S, Street M, Dey A, Dwivedi SK. Bmi-1:
At the crossroads of physiological and pathological biology. Genes Dis.
2015;2:225–39.
5. Bakhshinyan D, Venugopal C, Adile AA, Garg N, Manoranjan B, Hallett
R, et al. BMI1 is a therapeutic target in recurrent medulloblastoma. Onco-
gene. 2019;38:1702–16.
6. Mariani SA, Minieri V, De Dominici M, Iacobucci I, Peterson LF, Cal-
abretta B. CDKN2A-independent role of BMI1 in promoting growth and
survival of Ph+ acute lymphoblastic leukemia. Leukemia. 2016;30:1682–90.
7. Sengupta A, Ficker AM, Dunn SK, Madhu M, Cancelas JA. Bmi1 repro-
grams CML B-lymphoid progenitors to become B-ALL-initiating cells.
Blood. 2012;119:494–502.
8. Sparmann A, van Lohuizen M. Polycomb silencers control cell fate, devel-
opment and cancer. Nat Rev Cancer. 2006;6:846–56.
9. Gil J, O’Loghlen A. PRC1 complex diversity: where is it taking us? Trends
Cell Biol. 2014;24:632–41.
BMI-1 modulators in myeloma
ª 2020 British Society for Haematology and John Wiley & Sons Ltd 889British Journal of Haematology, 2020, 190, 877–890

10. De Vos J, Thykjaer T, Tarte K, Ensslen M, Raynaud P, Requirand G, et al.
Comparison of gene expression profiling between malignant and normal
plasma cells with oligonucleotide arrays. Oncogene. 2002;21:6848–57.
11. Jagani Z, Wiederschain D, Loo A, He D, Mosher R, Fordjour P, et al. The
Polycomb group protein Bmi-1 is essential for the growth of multiple
myeloma cells. Cancer Res. 2010;70:5528–38.
12. Wu SQ, Xu ZZ, Niu WY, Huang HB, Zhan R. ShRNA-mediated Bmi-1
silencing sensitizes multiple myeloma cells to bortezomib. Int J Mol Med.
2014;34:616–23.
13. Alzrigat M, P�arraga AA, Majumder MM, Ma A, Jin J, €Osterborg A, et al.
The polycomb group protein BMI-1 inhibitor PTC-209 is a potent anti-
myeloma agent alone or in combination with epigenetic inhibitors target-
ing EZH2 and the BET bromodomains. Oncotarget. 2017;8:103731–43.
14. Bolomsky A, Schlangen K, Schreiner W, Zojer N, Ludwig H. Targeting of
BMI-1 with PTC-209 shows potent anti-myeloma activity and impairs the
tumour microenvironment. J Hematol Oncol. 2016;9:17. DOI: 10.1186/
s13045-016-0247-4.
15. Kim MJ, Cao L, Sheedy J, Risher N, Dumble M, Lee CS, et al. Abstract
5517: PTC596-induced Bmi1 hyper-phosphorylation via Cdk1/2 activation
resulting in tumor stem cell depletion. Cancer Res. 2014;74:5517.
16. Eberle-Singh JA, Sagalovskiy I, Maurer HC, Sastra SA, Palermo CF, Decker
AR, et al. Effective delivery of a microtubule polymerization inhibitor syn-
ergizes with standard regimens in models of pancreatic ductal adenocarci-
noma. Clin Cancer Res. 2019;25:5548–60.
17. Bolomsky A, Heusschen R, Schlangen K, Stangelberger K, Muller J, Schreiner
W, et al. Maternal embryonic leucine zipper kinase is a novel target for prolif-
eration-associated high-risk myeloma.Haematologica. 2018;103:325–35.
18. Mihara K, Imai C, Coustan-Smith E, Dome JS, Dominici M, Vanin E,
et al. Development and functional characterization of human bone mar-
row mesenchymal cells immortalized by enforced expression of telomerase.
Br J Haematol. 2003;120:846–9.
19. Muller J, Bolomsky A, Dubois S, Duray E, Stangelberger K, Plougonven E,
et al. Maternal embryonic leucine zipper kinase inhibitor OTSSP167 has
preclinical activity in multiple myeloma bone disease. Haematologica.
2018;103:1359–68.
20. DepMap B. DepMap Achilles 19Q1 Public., 2019. Available at: https://fig
share.com/articles/DepMap_Achilles_19Q1_Public/7655150 Accessed May
2, 2019.
21. Meyers RM, Bryan JG, McFarland JM, Weir BA, Sizemore AE, Xu H,
et al. Computational correction of copy number effect improves specificity
of CRISPR-Cas9 essentiality screens in cancer cells. Nature Genetics.
2017;49:1779–84.
22. Millman SE, Pagano M. MCL1 meets its end during mitotic arrest. EMBO
Reports. 2011;12:384–5.
23. Gu C, Yang Y, Sompallae R, Xu H, Tompkins VS, Holman C, et al.
FOXM1 is a therapeutic target for high-risk multiple myeloma. Leukemia.
2016;30:873–82.
24. Nishida Y, Maeda A, Kim MJ, Cao L, Kubota Y, Ishizawa J, et al. The
novel BMI-1 inhibitor PTC596 downregulates MCL-1 and induces p53-in-
dependent mitochondrial apoptosis in acute myeloid leukemia progenitor
cells. Blood Cancer J. 2017;7:e527.
25. Lub S, Maes A, Maes K, De Veirman K, De Bruyne E, Menu E, et al.
Inhibiting the anaphase promoting complex/cyclosome induces a meta-
phase arrest and cell death in multiple myeloma cells. Oncotarget.
2016;7:4062–76.
26. Cho JH, Dimri M, Dimri GP. A Positive Feedback Loop Regulates the
Expression of Polycomb Group Protein BMI1 via WNT Signaling Path-
way. J Biol Chem. 2013;288:3406–18.
27. Clarke PR, Allan LA, Skowyra A. Timed degradation of Mcl-1 controls
mitotic cell death. Mol Cell Oncol. 2018;5:e1516450.
28. Gascoigne KE, Taylor SS. Cancer cells display profound intra- and inter-
line variation following prolonged exposure to antimitotic drugs. Cancer
Cell. 2008;14:111–22.
29. Gomez-Bougie P, Maiga S, Tessoulin B, Bourcier J, Bonnet A, Rodriguez
MS, et al. BH3-mimetic toolkit guides the respective use of BCL2 and
MCL1 BH3-mimetics in myeloma treatment. Blood. 2018;132:2656–69.
30. Gong JN, Khong T, Segal D, Yao Y, Riffkin CD, Garnier JM, et al. Hierar-
chy for targeting prosurvival BCL2 family proteins in multiple myeloma:
pivotal role of MCL1. Blood. 2016;128:1834–44.
31. Wuill�eme-Toumi S, Robillard N, Gomez P, Moreau P, Le Gouill S,
Avet-Loiseau H, et al. Mcl-1 is overexpressed in multiple myeloma
and associated with relapse and shorter survival. Leukemia.
2005;19:1248–52.
32. Bennett A, Sloss O, Topham C, Nelson L, Tighe A, Taylor SS. Inhibition
of Bcl-xL sensitizes cells to mitotic blockers, but not mitotic drivers. Open
Biol. 2016;6:160134.
33. Shi J, Zhou Y, Huang HC, Mitchison TJ. Navitoclax (ABT-263) accelerates
apoptosis during drug-induced mitotic arrest by antagonizing Bcl-xL. Can-
cer Res. 2011;71:4518–26.
34. Sloss O, Topham C, Diez M, Taylor S. Mcl-1 dynamics influence mitotic
slippage and death in mitosis. Oncotarget. 2016;7:5176–92.
35. Jin X, Kim LJY, Wu Q, Wallace LC, Prager BC, Sanvoranart T, et al. Tar-
geting glioma stem cells through combined BMI1 and EZH2 inhibition.
Nat Med. 2017;23:1352–61.
36. Kikuchi J, Koyama D, Wada T, Izumi T, Hofgaard PO, Bogen B, et al.
Phosphorylation-mediated EZH2 inactivation promotes drug resistance in
multiple myeloma. J Clin Investigat 2015;125:4375–90.
37. Grant S. HDAC inhibitors repress the polycomb protein BMI1. Cell Cycle.
2010;9:2722–30.
38. Gabrielli B, Chia K, Warrener R. Finally, how histone deacetylase inhibi-
tors disrupt mitosis! Cell Cycle. 2011;10:2658–61.
39. Ramakrishnan VG, Miller KC, Macon EP, Kimlinger TK, Haug J, Kumar
S, et al. Histone deacetylase inhibition in combination with MEK or BCL-
2 inhibition in multiple myeloma. Haematologica. 2019;104:2061–74.
A. Bolomsky et al.
890 ª 2020 British Society for Haematology and John Wiley & Sons LtdBritish Journal of Haematology, 2020, 190, 877–890
Recommended