The Annual Public Debt Report
for the
2018 Financial Year
Submitted to Parliament
on
Friday, 29th March, 2019
by
Ken Ofori-Atta
Minister for Finance
In Fulfilment of the Requirements of Section 72 of the
Public Financial Management Act, 2016 (Act 921)

Annual Public Debt Report for the
2018 Financial Year

The 2018 Annual Public Debt Report
2
To purchase copies of the Report, kindly contact the Public Relations Office of the Ministry
Ministry of Finance
Public Relations Office
New Building, Ground Floor, Room 001 and 003
P. O. Box MB 40
Accra – Ghana
The 2018 Annual Public Debt Report is also available on the internet at:
www.mofep.gov.gh

The 2018 Annual Public Debt Report
3
Acronyms and Abbreviations
ABED - Arab Bank for Economic Development
ABN AMRO - ABN Amro Bank N.V.
ABSA - ABSA Bank Ltd.
ACRPL - Accra Compost & Recycling Plant Limited
ADB - Agricultural Development Bank
ADF - African Development Fund
ATM - Average Time to Maturity
ATR - Average Time to Re-fixing
BAAG - Bank Austria AG
BADB - Banco do Brasil
BBNV - Belfius Bank NV/SA
BBP - Barclays Bank Plc
BELG - Government of Belgium
BHI - Bank Hapoalim
BMH - Mees Pierson NV
BNDS - Banco Nacionale de Desenvolvimento Economico E Sociale
BNP - Banque National de Paris
BoG - Bank of Ghana
BoP - Balance of Payments
BOST - Bulk Oil Storage and Transportation Company Ltd
BPA - Bui Power Authority
CAL - CAL Bank Limited
CBG - Consolidated Bank Ghana Limited
CCAB - Credit Agricole
CCMA - Cape Coast Metropolitan Assembly
CCRB - Coöperatieve Central Raifffeisen-Bank (RaboBank)
CDB - China Development Bank Corporation
CITI - Citi Group Bank
CMBK - Commerzbank
CNY - Chinese Renminbi
CSD - Central Securities Depository (GH) Limited
CSI - Credit Suisse International
CWE - China International Water & Electric Corporation
DBI - Deutsche Bank, Italy
DBSA - Deutsche Bank S.A. (Brazil)
DESA - Deutsche Bank New York
DOD - Disbursed Outstanding Debt
DSA - Debt Sustainability Analysis
DSRA - Debt Service Reserve Accounts
EBID - ECOWAS Bank for International Development
ECA - Export Credit Agency
ECBT - Export Credit Bank of Turkey

The 2018 Annual Public Debt Report
4
ECF - Extended Credit Facility
ECG - Electricity Company of Ghana
ECOWAS - Economic Community of West African States
EDI - Euroget de Invest S.A.
EIB - European Investment Bank
EM - Emerging Markets
EMEA - Europe, Middle East and Africa
EUR - Euro
EXIC - Export-Import Bank of China
EXIM - Export-Import Bank of India
EXUS - Export-Import Bank of U.S.A.
FPSO - Floating Production Storage and Offloading
FRG - Government of the Federal Republic of Germany
FRGN - Government of France
FX - Foreign Currency
GACL - Ghana Airports Company Limited
GBP - British Pound Sterling
GCB - GCB Bank Limited
GDN - Global Depository Note
GDP - Gross Domestic Product
GH¢ - Ghana Cedi
GHS - Ghana Health Service
GIFMIS - Ghana Integrated Financial Management Information System
GFIM - Ghana Fixed Income Market
GoG - Government of Ghana
GPHA - Ghana Ports and Harbours Authority
GPRC - Government of the People's Rep. of China
GRIDCo - Ghana Grid Company Limited
GRK - Government of the Republic of Korea
GSS - Ghana Statistical Service
GWCL - Ghana Water Company Limited
HIPC - Heavily Indebted Poor Countries
HSBC - HSBC Bank Plc
ICBC - Industrial & Commercial Bank of China
ICM - International Capital Market
IDA - International Development Association
IFAD - International Fund for Agric. Development
IMF - International Monetary Fund
INDG - Government of India
ING - Internationale Nederlanden Bank
IPO - Initial Public Offering
ITG - Government of Italy
JBRs - Joint Book Runners
JICA - Japan International Cooperation Agency
JPY - Japanese Yen
The 2018 Annual Public Debt Report
5
KBCB - KBC Bank n.v
KFED - Kuwait Fund for Arab Economic Development
KMA - Kumasi Metropolitan Assembly
LIBOR - London Interbank Offer Rate
MDAs - Ministries, Departments and Agencies
MMDAs - Metropolitan, Municipal and District Assemblies
MMTL - Metro Mass Transit Limited
MoF - Ministry of Finance
MoH - Ministry of Health
MoT - Ministry of Transport
MPR - Monetary Policy Rate
MTDS - Medium Term Debt Management Strategy
NCBL - Nedcor Bank Limited
NDF - Net Domestic Financing
NIC - National Insurance Commission
NITA - National Information Technology Agency
NORB - Nordbanken International Division
NPLs - Non-Performing Loans
NPRA - National Pensions Regulatory Authority
NTF - Nigeria Trust Fund
o/w - of which
ODA - Official Development Assistance
OFID - OPEC Fund for International Development
OPEC - Organization of the Petroleum Exporting Countries
PDs - Primary Dealers
PFM - Public Financial Management
PGIS - Power Generation & Infrastructure Support Account
PPP - Public Private Partnership
PTIC - Poly Technologies Inc. China
RZB - Raiffeisen ZentralBank Osterreich AG
S&P - Standard & Poor's
SARG - Government of Saudi Arabia
SCB - Standard Chartered Bank.
SDR - Special Drawing Rights
SEC - Securities Exchange Commission
SOE - State-Owned Enterprise
SOGE - Societe Generale
SPAG - Government of Spain
SPV - Special-Purpose Vehicle
SSNIT - Social Security and National Insurance Trust
STC - State Transport Corporation
T-Bill - Treasury Bill
TDRL - TOR Debt Recovery Levy
TDMD - Treasury and Debt Management Division
TOR - Tema Oil Refinery

The 2018 Annual Public Debt Report
6
UMaT - University of Mines and Technology
UMB - Universal Merchant Bank
UNCM - Unicredit Bank AG Munich
UNCR - Unicredit Bank of Austria
USD - United States Dollar
VRA - Volta River Authority
VTB - VTB Bank
WEO - World Economic Outlook

The 2018 Annual Public Debt Report
7
Table of Contents
Acronyms and Abbreviations ............................................................................................... 3
Table of Contents ................................................................................................................ 7
List of Tables ....................................................................................................................... 9
List of Figures .................................................................................................................... 10
List of Appendices ............................................................................................................. 11
Foreword ............................................................................................................................ 12
Executive Summary ........................................................................................................... 14
Section One: Introduction .................................................................................................. 16
Section Two: Macroeconomic Developments for 2018 ...................................................... 18
Global Developments ..................................................................................................... 18
Domestic Developments ................................................................................................. 18
Section Three: 2018 Medium-Term Debt Management Strategy ....................................... 23
Section Four: Government Borrowing and Financing Operations ...................................... 26
Section Five: Gross Public Debt ........................................................................................ 28
Public Debt Dynamics .................................................................................................... 29
External Debt Stock ........................................................................................................ 30
Domestic Debt Stock ...................................................................................................... 37
Section Six: Liability Management Operations ................................................................... 46
Section Seven: Contingent Liabilities ................................................................................. 47
Recoveries On On-Lent Facilities ................................................................................... 47
Defunct Loans On Government Books ........................................................................... 47
Guarantees ..................................................................................................................... 48
Public Private Partnerships............................................................................................. 48
Credit Risk Assessment ................................................................................................. 49
Financial Sector Bailout .................................................................................................. 49
Section Eight: Other Finance Arrangements ...................................................................... 50
Energy Sector Bond ....................................................................................................... 50
Section Nine: 2019-2022 MTDS ........................................................................................ 52
Section Ten: Public Debt Management Reforms and Initiatives ........................................ 53

The 2018 Annual Public Debt Report
8
Section Eleven: Conclusion ............................................................................................... 56
Glossary ............................................................................................................................. 58
Appendices ........................................................................................................................ 62
The 2018 Annual Public Debt Report
9
List of Tables
Table 2. 1: Recent Macroeconomic Performance, 2014 – 2018 ........................................ 19
Table 3. 1: Cost and Risk Indicators of Existing Debt Portfolio, 2016 – 2018 .................... 24 Table 3. 2: Performance Indicators of 2018 MTDS ............................................................ 25 Table 4. 1: Summary of Government Financing Operations, 2017 & 2018 ........................ 26 Table 4. 2: Gross Domestic Issuance, 2017 & 2018 .......................................................... 27
Table 5. 1: Gross Public Debt, 2014 – 2018 ...................................................................... 28 Table 5. 2: Annual Public Debt Ratios, 2014 – 2018 ........................................................ 28 Table 5. 3: Summary of Ghana’s Outstanding Eurobond Issuances, end 2018................. 33 Table 5. 4: Summary of 10-Year and 30-Year Eurobond Issuances in 2018 ..................... 33 Table 5. 5: External Loan Disbursements by Creditor Category, 2017 & 2018 .................. 35 Table 5. 6: External Debt Service by Creditor Category, 2017 & 2018 .............................. 36 Table 5. 7: Holders of Domestic Debt (excl. Standard Loans), 2017 & 2018 ..................... 39 Table 5. 8: Volume of Trade on Secondary Market, 2017 & 2018 ..................................... 41 Table 5. 9: Holders of Outstanding Domestic US Dollar Bond, 2017 & 2018..................... 42 Table 5. 10: Performance of Primary Dealers in Government Securities Market in 2018 .. 44
Table 6. 1: Government of Ghana Buyback Operations in 2018 ........................................ 46
Table 7. 1: Recoveries on On-Lent Facilities in 2018 ........................................................ 47 Table 7. 2: List of Outstanding Guarantees, end 2018 ...................................................... 48
Table 8. 1: Initial Issuance for ESLA Bond in 2017 ............................................................ 50 Table 8. 2: Additional Issuances (Tap/Re-open) of ESLA 10-Year Bond, 2018 ................. 50 Table 8. 3: Holders of Outstanding Stock of ESLA Bonds as at end 2018 ........................ 51 Table 8. 4: Distribution of Outstanding Debt Stock in ESLA by Investor Type ................... 51
The 2018 Annual Public Debt Report
10
List of Figures
Figure 2. 1: Inflation, MPR, Interbank Wgtd. Avg. & 91-Day T-Bill Rates, 2014 – 2018 ..... 20 Figure 2. 2: Fiscal and Primary Balances, 2014 – 2018..................................................... 22
Figure 4. 1: Domestic Planned versus Actual Issuances in 2018 ...................................... 27
Figure 5. 1: Gross Public Debt Developments, 2014 – 2018 ............................................. 29 Figure 5. 2: Gross Public Debt Developments, 2014 – 2018 ............................................. 30 Figure 5. 3: Currency Composition of External Debt Stock, 2017 & 2018.......................... 31 Figure 5. 4: External Debt Stock by Creditor Category, 2017 & 2018 ................................ 31 Figure 5. 5: Interest Rate Structure of External Debt Stock, 2017 & 2018 ......................... 32 Figure 5. 6: Evolution of Ghana’s Eurobond Yields, 2013 – 2018 ...................................... 35 Figure 5. 7: Evolution of Ghana’s Sovereign Ratings, 2003 – 2018 ................................... 37 Figure 5. 8: Domestic Debt by Category, 2014 – 2018 ...................................................... 38 Figure 5. 9: Domestic Debt by Tenor (Marketable Instruments), 2017 & 2018 .................. 39 Figure 5. 10: Domestic Yield Curve (at Constant Maturity), 2017 & 2018 .......................... 40 Figure 5. 11: Secondary Market Yield Curve, 2017 & 2018 ............................................... 42 Figure 5. 12: Loans Signed in 2018 ................................................................................... 45

The 2018 Annual Public Debt Report
11
List of Appendices
Appendix 1A: Gross Public Debt (in millions of GH¢), 2014 – 2018 .................................. 63
Appendix 1B: Gross Public Debt (in millions of US$), 2014 – 2018 ................................... 63
Appendix 2: Debt-to-GDP Ratios (based on Old and New GDP Series), 2014 – 2018……64
Appendix 3: List of Outstanding External Loans as at end 2018 ........................................ 65
Appendix 4: List of Loans Signed in 2018 .......................................................................... 72
Appendix 5A: List of Loan Balances (Below Threshold of GH¢5,000.0) Recommended for
Write-Off ............................................................................................................................ 75
Appendix 5B: List of Loan Balances (Above Threshold of GH¢5,000.0) Recommended for
Write-Off ............................................................................................................................ 76

The 2018 Annual Public Debt Report
12
Foreword
In fulfilment of Section 72 of the Public Financial Management (PFM) Act, 2016 (Act 921), I
hereby present the 3rd edition of the Annual Public Debt Report. This report, like the previous
ones, is aimed at enhancing transparency in the management and reporting of Ghana’s
public debt operations.
The Ministry of Finance (MoF) of Ghana, as the fiscal agent of Government, is responsible
for the management of public debt. Accordingly, in 2018, the Ministry continued to engage
in activities relating to the issuance, servicing, management and reporting of domestic and
foreign debt on behalf of Government. This is a challenging task, not necessarily because
of the size of the debt stock which stands at GH¢173.1 billion as at 31st December 2018, but
as it requires the mobilization of funds on timely basis to meet Government’s financing
requirements at the lowest possible cost, and at a prudent degree of risk, while operating in
both the domestic and global macroeconomic environment.
Government in 2018 took several measures to ensure efficient and effective management
of public debt in compliance with the debt management strategy approved by Cabinet and
in line with the financing requirement, as stipulated in the 2018 Budget Statement and
Economic Policy. The key objectives of such measures were to lengthen the maturity profile
by issuing long-term benchmark Government securities, reduce the refinancing risk
embedded in the debt portfolio, diversify the investor base, and contribute to the
improvement of the country’s sovereign rating.
As a Government, we have made significant strides in macroeconomic stability and debt
management, notably:
According to the International Monetary Fund (IMF), Ghana’s return to the international
debt capital markets earlier in May 2018 proved very popular with international
institutional investors, allowing Ghana to print US$2.0 billion dual tranche 10-year and
30-year amortising bonds, which was the country’s largest transaction at the time;
An upgrade in Ghana’s rating from B- to B with a stable outlook in September 2018 by
Standard & Poor's Global Ratings (S&P), the first up-grade in over a 10-year period of
rating downgrades and volatility;
Accelerated fiscal consolidation with deficit contraction from 6.5 percent of rebased
Gross Domestic Product (GDP) at end-December 2016 to 3.9 percent by end-December
2018;
A pro-active debt management strategy that reduced debt-to-GDP ratio to 57.9 percent
of GDP (including financial sector bailout) and 54.7 percent of GDP, excluding the cost
of financial sector clean up, by the end of 2018;
An improvement in solvency ratios in the latest Debt Sustainability Analysis (DSA), albeit
challenges in liquidity ratios;
The 2018 Annual Public Debt Report
13
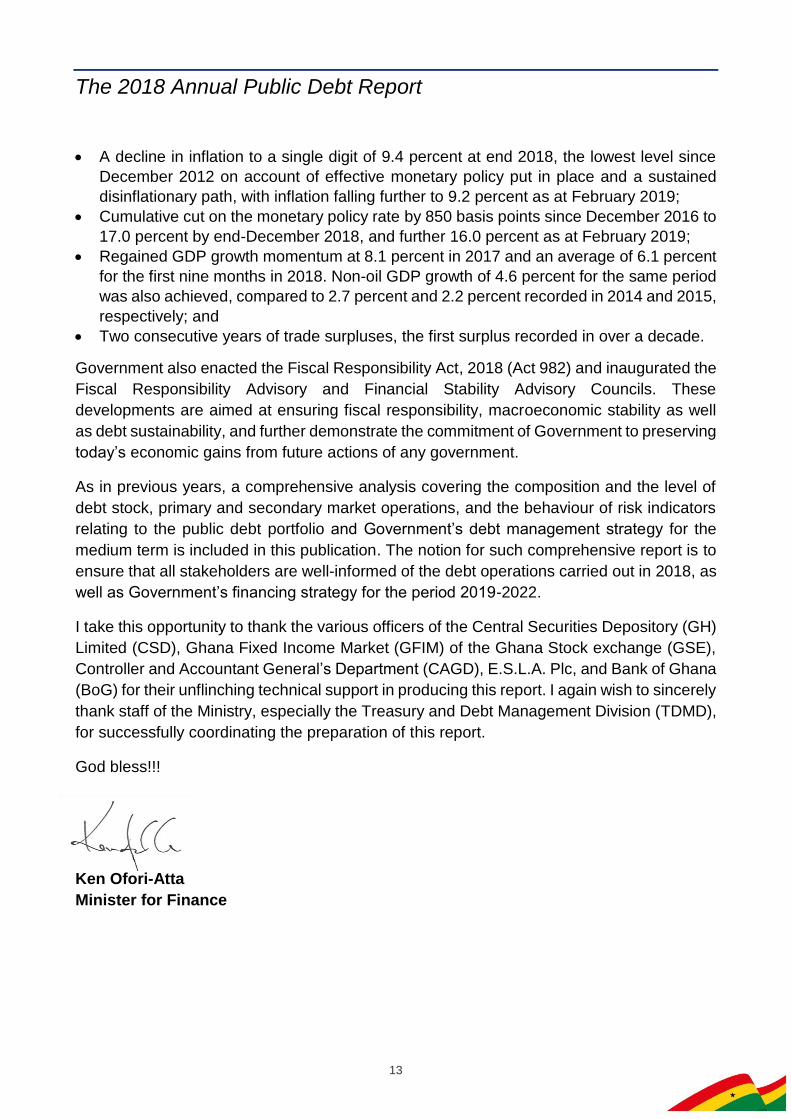
A decline in inflation to a single digit of 9.4 percent at end 2018, the lowest level since
December 2012 on account of effective monetary policy put in place and a sustained
disinflationary path, with inflation falling further to 9.2 percent as at February 2019;
Cumulative cut on the monetary policy rate by 850 basis points since December 2016 to
17.0 percent by end-December 2018, and further 16.0 percent as at February 2019;
Regained GDP growth momentum at 8.1 percent in 2017 and an average of 6.1 percent
for the first nine months in 2018. Non-oil GDP growth of 4.6 percent for the same period
was also achieved, compared to 2.7 percent and 2.2 percent recorded in 2014 and 2015,
respectively; and
Two consecutive years of trade surpluses, the first surplus recorded in over a decade.
Government also enacted the Fiscal Responsibility Act, 2018 (Act 982) and inaugurated the
Fiscal Responsibility Advisory and Financial Stability Advisory Councils. These
developments are aimed at ensuring fiscal responsibility, macroeconomic stability as well
as debt sustainability, and further demonstrate the commitment of Government to preserving
today’s economic gains from future actions of any government.
As in previous years, a comprehensive analysis covering the composition and the level of
debt stock, primary and secondary market operations, and the behaviour of risk indicators
relating to the public debt portfolio and Government’s debt management strategy for the
medium term is included in this publication. The notion for such comprehensive report is to
ensure that all stakeholders are well-informed of the debt operations carried out in 2018, as
well as Government’s financing strategy for the period 2019-2022.
I take this opportunity to thank the various officers of the Central Securities Depository (GH)
Limited (CSD), Ghana Fixed Income Market (GFIM) of the Ghana Stock exchange (GSE),
Controller and Accountant General’s Department (CAGD), E.S.L.A. Plc, and Bank of Ghana
(BoG) for their unflinching technical support in producing this report. I again wish to sincerely
thank staff of the Ministry, especially the Treasury and Debt Management Division (TDMD),
for successfully coordinating the preparation of this report.
God bless!!!
Ken Ofori-Atta
Minister for Finance
The 2018 Annual Public Debt Report
14
Executive Summary
The 2018 Annual Public Debt Report is one of the deliverables of the Ministry of Finance
(MoF) with the primary objective of disseminating information on public debt operations
carried out by Government of Ghana (GoG) during the 2018 financial year.
The importance of sound public debt management as a central part in preventing economic
crises has become increasingly evident, and has further emphasized the need for strong
coordination between fiscal, debt and monetary policies. Over the years, revenue shortfalls
and expenditure overruns led to widening fiscal deficits which were financed mainly through
debt, highlighting the growing need for prudent debt management to ensure the greater
ability to finance increasing fiscal deficits. However, the Fiscal Responsibility Law which was
passed in 2018 is expected to minimise the impact of the residual fiscal balance on the
public debt.
In 2018, macroeconomic fundamentals on the domestic front strengthened due to
improvement in the trade balance, a decline in the fiscal deficit, upgrade in Ghana’s
sovereign ratings and a resilient financial sector.
On the international scene, however, emerging markets were faced with economic
challenges attributed to increasing oil prices, rising US Federal Reserve policy rates and an
appreciating United States Dollar (USD), amidst international trade tensions, Brexit
uncertainties and geopolitical conflicts. These factors created bigger challenges on public
debt management, especially for countries with high external financing requirements. As a
result, there were significant outflows of foreign holdings in domestic instruments, which
ultimately triggered local currency depreciation against the USD in these countries.
Ghana was also affected by these global economic and financial uncertainties. However,
despite these challenges, GoG maintained its debt management objective of ensuring that
Government’s financing needs were met on a timely basis and at the lowest possible cost,
consistent with a prudent degree of risk, while promoting the development of Ghana’s
domestic debt market.
At the operational level, in 2018, focus was on reducing the growth of short-term domestic
debt and lengthening the maturity profile of the domestic debt in order to reduce refinancing
risk and diversify the investor base of the domestic debt portfolio.
The total public debt stock on a nominal basis increased from GH¢142.6 billion at end-
December 2017 to GH¢173.1 billion at end-December 2018. The external debt stock
increased from GH¢75.8 billion to GH¢86.2 billion over the period under review. Similarly,
the domestic component increased from GH¢66.8 billion in 2017 to GH¢86.9 billion in 2018.
As a percentage of GDP, domestic debt increased from 26.0 percent in 2017 to 29.1 percent
in 2018. However, external debt as a percentage of GDP decreased from 29.6 percent in
2017 to 28.9 percent in 2018.

The 2018 Annual Public Debt Report
15
The implementation of the Medium Term Debt Management Strategy (MTDS) faced
significant challenges in 2018 due to external vulnerabilities, which led to investor pull-outs
from the domestic market. To address the external contagion effect of the sell-offs in
emerging countries, which affected the participation of non-resident investors in the
domestic market and put pressure on the Ghana Cedi against major trading currencies, the
approved strategy was redirected to focus on increased Government support to the proper
functioning of the secondary market. For this, Government had to use its buffers to help
improve liquidity and stabilize the market.
In light of the above developments, it is imperative that Government continues to pursue its
tight fiscal consolidation measures to ensure a sustainable level of public debt, while
safeguarding macroeconomic stability. This will require continuous commitment to fiscal
discipline, as well as adherence to prudent debt management.
The 2018 Annual Public Debt Report
16
Section One: Introduction
1. The 2018 Annual Public Debt Report is prepared in fulfilment of the legal requirement under
Section 72 of the Public Financial Management Act, 2016 (Act 921). The Law mandates the
Ministry for Finance to submit the Annual Public Debt Report to the Parliament of Ghana no
later than the 31st of March of the following year, in respect of the preceding year.
2. Per the Law, the Public Debt Office of the Ministry has the responsibility for the preparation
of this Annual Public Debt Report. This report, the third in the series, provides a
comprehensive summary of public debt management activities for 2018 and includes the
following:
Government borrowings and other debt management operations;
guarantee and on-lending activities of Government and other financing arrangements
entered into by Government;
debt management strategy and the rationale for the strategy;
list of outstanding Government debt;
list of outstanding Government guarantees, the amount and beneficiaries of the
guarantees, and an assessment of the fiscal risk embedded in the guarantees; and
list of on-lending operations, including outstanding amounts and beneficiaries of the
loans, and an assessment of the inherent credit risk of the on-lent loans.
3. For the year under review, the MTDS was to finance the budget deficit using domestic
securities (preferably long-term bonds) and external financing, including the International
Capital Market (ICM). The implementation of the 2018 MTDS faced implementation
challenges as a result of global market developments which led to investor sell-offs in
emerging markets.
4. To address the external contagion effect of the investor pull-out from emerging countries
which affected non-resident investors participation in the domestic markets and posed
unanticipated pressure on the Ghana Cedi, the approved strategy was redirected to focus
on increased engagement with domestic investors and more active Government support for
the functioning of the secondary market.
5. On the whole, Government has made significant strides in economic and debt management,
namely; Ghana issued its largest Eurobond at the time in the international debt capital
markets in May 2018, which proved very popular with international institutional investors;
S&P upgraded Ghana from B- to B in September 2018; the deficit contracted from 6.5
percent of GDP in 2016 to 3.9 percent in 2018; debt-to-GDP ratio reduced to 57.9 percent
at end-December 2018; solvency ratios in the latest DSA improved; the disinflationary path
was sustained on account of effective monetary policy; inflation declined to a single digit of
9.4 percent at end-December 2018; the monetary policy rate declined to 17.0 percent at
end-December 2018; and the trade balance recorded a surplus for two consecutive years
for the first time in over a decade.
The 2018 Annual Public Debt Report
17
6. The purpose of this report is to disseminate information on Ghana’s public debt portfolio and
debt management activities carried out over the past year to stakeholders, including lenders
and investors in Government securities, as well as the general public.
7. The rest of the Report is organised as follows: Section 2 discusses recent global, regional
and national macroeconomic developments, while Section 3 examines the implementation
of the MTDS in 2018. Section 4 provides details on Government borrowing and financing
operations in 2018. An analysis of the public debt portfolio is presented in Section 5. Section
6 examines Government’s liability management operations and re-profiling programme.
Government guarantees and on-lending activities, including the status of indebtedness of
some State-Owned Enterprises (SOEs), are detailed in Section 7. Sections 8 and 9 present
other financing arrangements by Government and their implications for the public debt stock
and a summary of the 2019-2022 MTDS. Section 10 reviews the recent public debt reforms
and initiatives. The Report ends in Section 11 with a summary of the pertinent issues
discussed and the way forward.
The 2018 Annual Public Debt Report
18
Section Two: Macroeconomic Developments for 2018
Global Developments
8. Global growth momentum moderated in the first half of 2018. The January 2019 update of
the World Economic Outlook (WEO) projected global growth in 2018 to remain at the 2017
level of 3.7 percent, a 0.2 percentage point downward revision from the April 2018 WEO
forecast of 3.9 percent for both years. Some of the downside risks highlighted in the April
2018 WEO—such as rising trade barriers and a reversal of capital flows to emerging market
economies with weaker fundamentals and higher political risk—became more pronounced
or materialized partially in 2018.
9. Inflation in advanced economies, as well as in emerging economies remained elevated
during the first half of 2018 following a rebound of world energy prices. Rising oil prices,
higher US Fed policy rates, appreciation of the USD, coupled with trade tensions and
geopolitical conflict resulted in several emerging markets experiencing external shocks from
the beginning of the second quarter of 2018. Countries with high foreign currency
denominated debt and high external financing requirements were the most affected due to
significant outflows and local currency depreciation vis-à-vis the USD.
10. Economic activities, however, strengthened in sub-Saharan Africa in 2018, reflecting gains
from higher commodity prices, accommodative external financing, and domestic policy
adjustments, including lower inflation and contained fiscal imbalances. According to the
World Bank, growth in the region increased from 2.3 percent in 2017 to an estimated rate of
2.7 percent in 2018. Though this represented an improvement following the 2015-2016
economic slowdown, the progress was still below expectation. This requires policymakers
to abreast themselves with new tools required for the effective management of new risks
arising from changes in the composition of capital flows and debt.
11. This global development, according to the IMF is showing a softening momentum and
greater uncertainty affected debt dynamics in emerging and frontier countries of which
Ghana’s is a part.
Domestic Developments
12. On the domestic front, macroeconomic performance remained robust as the growth
momentum stayed buoyant and strong in the first three quarters of 2018 (Table 2.1). The
year under review witnessed:
an average real GDP growth of 6.1 percent in the first three quarters of 2018;
end-period inflation continued the downward trend from 11.8 percent at end-December
2017 to 9.4 percent at end-December 2018, the first single-digit inflation since December
2012;
a decline in the fiscal deficit from 4.8 percent of GDP in 2017 to a provisional figure of
3.9 percent of GDP in 2018;

The 2018 Annual Public Debt Report
19
a provisional positive primary balance equivalent to 1.4 percent of GDP, up from 0.5
percent of GDP in 2017, for the second consecutive year;
an improvement in the trade balance to a provisional surplus of 2.7 percent of GDP, also
for the second consecutive year, following years of negative balances;
a decline in the current account deficit from 3.4 percent of GDP in 2017 to 3.2 percent of
GDP in 2018;
Gross International Reserves of 3.6 months of import cover, higher than the target of 3.5
months;
an upgrade in Ghana’s sovereign ratings by S&P ratings from B- to B with a stable
outlook, for the first time in 10 years; and
a successful financial sector clean-up and reforms.
Table 2. 1: Recent Macroeconomic Performance, 2014 – 2018
Description 2014 2015 2016 2017 Prov.
2018 Target
2018 Prov.
Nominal GDP (GH¢'bn) 155.4 180.4 215.1 256.7 298.7 298.7**
Real GDP Growth (%) 2.9 2.2 3.4 8.1 5.6 6.1*
Non-oil GDP (GH¢'bn) 146.4 175.7 214.0 248.2 285.9 285.9**
Non-oil GDP (%) 2.7 2.2 4.6 4.6 5.8 4.6*
Year-on-year Inflation (%) 17.0 17.7 15.4 11.8 8.9 9.4
Fiscal Balance on cash basis (% of GDP) (7.4) (4.9) (6.5) (4.8) (3.7) (3.9)
Primary Balance (% of GDP) (2.9) (0.3) (1.1) 0.5 1.4 1.4
Gross Public Debt (% of GDP) 51.2 55.6 56.8 55.5 N/A
57.9 54.7***
Interest Rate (91-day bill) (%) 25.8 24.5 16.8 13.3 N/A 14.6
Monetary Policy Rate (%) 21.0 26.0 25.5 20.0 N/A 17.0
Broad Money (M2+) 36.8 26.1 22.0 16.7 N/A 24.1
Current Account Balance (% of GDP) (9.6) (7.8) (6.6) (3.4) N/A (3.2)
Gross International Reserves (US$'bn) 5.5 5.9 6.2 7.6 N/A 7.0
Gross International Reserves (months of import cover) 3.8 3.5 3.5 4.3 ≥3.5 3.6
Exchange Rate Depreciation (GH¢/US$) (31.3) (15.7) (9.7) (4.9) N/A (8.4)
Source: Ministry of Finance, Bank of Ghana and Ghana Statistical Service *Average 2018 Q1 to Q3 **Projected end year estimates ***Excludes financial sector clean-up cost
Real Sector Performance
13. In September 2018, the Ghana Statistical Service (GSS) reviewed the base year for the
national accounts series from 2006 to 2013. The rebasing of the GDP resulted in an
expansion of the economy by 24.6 percent in 2017, increasing the nominal GDP from
GH¢205,914.0 million to GH¢256,671.0 million. Preliminary estimates for the first three
quarters of 2018 show that overall GDP growth was an average of 6.1 percent, compared
with 8.1 percent at the end of 2017. On the other hand, non-oil GDP grew by 4.6 percent
compared to the annual target of 5.8 percent.

The 2018 Annual Public Debt Report
20
Inflation
14. In line with developments in the sub-region, inflation declined modestly to 9.4 percent at
end-December 2018 from 11.8 percent at end-December 2017, well within the inflation
target band of 8±2 percent and reflective of a well-anchored disinflationary path consistent
with the relatively tight stance of monetary policy. This is the lowest single digit inflation
figure reported since December 2012, largely due to tight monetary policy, fiscal
consolidation and dynamics in demand and supply, inter alia.
15. The easing of inflationary pressures and gradual improvements in the macroeconomic
fundamentals contributed towards the downward revision of the Monetary Policy Rate
(MPR) by the Central Bank. The MPR reduced cumulatively by 300 basis points from 20.0
percent at end-December 2017 to 17.0 percent as at end-December 2018, the lowest rate
since February 2014 (Figure 2.1).
Figure 2. 1: Inflation, MPR, Interbank Wgtd. Avg. & 91-Day T-Bill Rates, 2014 – 2018
Source: Ministry of Finance
16. In line with the reduction in the MPR, the interbank weighted average lending rate also
declined from 19.3 percent to 16.1 percent between December 2017 and December 2018.
However, rates on most treasury securities eased upwards at both the short-term and
medium-term segments of the market. The rate on the 91-day and 182-day treasury bills
rose slightly from 13.3 percent and 13.8 percent as at end 2017 to 14.6 percent and 15.0
percent respectively at the end of 2018. Similarly, interest rates on the 1-year note, 2-year
note and 3-year bond increased by 50, 200 and 100 basis points to 15.50 percent, 19.50
percent, and 19.50 percent, respectively. Yields on the 5-year, 7-year and 10-year bonds,
however, declined by 110, 350, and 150 basis points to 16.50 percent, 16.25 percent, and
17.50 percent, respectively, during the same period, while that of the 15-year bond remained
unchanged at 19.75 percent. More details are outlined in Section 5 of this report.
0.00
5.00
10.00
15.00
20.00
25.00
30.00
2014 2015 2016 2017 2018 Prov.
In P
erc
en
t (%
)
Inflation 91-Day T-bill Interbank Wgt. Av. Rate MPR

The 2018 Annual Public Debt Report
21
External Sector Performance
17. The trade balance for the period recorded a second consecutive surplus of US$1,778.8
million by December 2018 (2.7% of GDP) compared to US$1,187.1 million (2.0% of GDP),
mainly on account of high export earnings from oil, gold and cocoa which led to strong
reserve build-up. This translated into a further narrowing of the current account deficit to 3.2
percent of GDP in 2018 from 3.4 percent of GDP in 2017. The current account outturn,
together with lower net capital inflows, resulted in an overall Balance of Payments (BoP)
deficit of US$671.5 million (1.0% of GDP) for the year 2018 compared to a surplus of
US$1,091.4 million (1.9% of GDP) in 2017. Consequently, the stock of Gross International
Reserves declined to US$7,025.0 million at end-December 2018 (equivalent to 3.6 months
of import cover), compared to US$7,554.8 million at end-December 2017 (equivalent to 4.3
months of import cover).
Exchange Rate Developments
18. The Ghana Cedi recorded a cumulative depreciation of 8.4 percent against the USD as at
the end of 2018, compared to 4.9 percent in 2017. This was largely driven by domestic
demand pressures as well as external factors, in particular the strengthening of the USD
and rising yields on US Treasury instruments, which adversely impacted the currency
markets in emerging market and frontier economies, including Ghana. However, the Cedi
depreciated more moderately against other major foreign currencies, recording a cumulative
depreciation of 3.9 percent against the Euro (EUR) and 3.3 percent against the British Pound
Sterling (GBP), compared with 16.2 percent and 12.9 percent, respectively, during the same
period in 2017.
Fiscal Performance
19. Provisional data on Government’s fiscal operations in 2018 indicate an overall deficit (on a
cash basis) of GH¢11,672.7 million (3.9% of GDP) against a target of GH¢10,971.1 million
(3.7% of GDP), a reduction from the 2017 deficit of GH¢15,608.0 million (4.8% of GDP).
20. Total Revenue and Grants amounted to GH¢47,636.7 million (15.9% of GDP), and was 2.9
percent below the target of GH¢49,059.0 million (16.4% of GDP). Total Expenditure
(including arrears clearance) amounted to GH¢59,309.5 million (19.9% of GDP), and was
1.2 percent lower than the Budget provision of GH¢60,030.2 million (20.1% of GDP). The
containment of expenditures, as well as the mid-year revenue measures that boosted
domestic revenue mobilisation, resulted in a second consecutive year of positive primary
balance equivalent to 1.4 percent of GDP.

The 2018 Annual Public Debt Report
22
Figure 2. 2: Fiscal and Primary Balances, 2014 – 2018
Source: Ministry of Finance
21. Public debt stock as at end-December 2018 was GH¢173,068.7 million (US$35,888.5
million), representing 57.9 percent of rebased GDP. A large part of the 2018 debt additions
resulted from the financial sector bailout programme of Government1. The cost incurred by
Government to clean the financial sector impairments resulted in the public debt increasing
by 3.2 percentage points of GDP in 2018. Excluding the bailout costs, however, the stock of
debt amounts to GH¢163,487.5 million (US$33,901.7 million), representing 54.7 percent of
GDP as at end-December 2018.
1 Costs incurred in bailout of the seven local banks which were either resolved or consolidated as part of the banking sector clean-up. Bonds amounting to GH¢9.8 billion have been issued in the process. Details are outlined in Section 6.
(7.4)
(4.9)
(6.5)
(4.8)
(3.9)
(2.9)
(0.3)
(1.1)
0.5
1.4
(8.0)
(7.0)
(6.0)
(5.0)
(4.0)
(3.0)
(2.0)
(1.0)
-
1.0
2.0
2014 2015 2016 2017 2018 Prov.
Perc
ent of G
DP
Fiscal balance Primary balance
The 2018 Annual Public Debt Report
23
Section Three: 2018 Medium-Term Debt Management
Strategy
22. The 2018-2021 Medium-Term Debt Management Strategy (MTDS) implemented in 2018
sought primarily to accelerate Government’s commitment to develop the domestic debt
market by issuing more longer-dated benchmark instruments to help improve secondary
market trading and ensure a resilient financial sector. Accordingly, the strategy focused on
reducing the growth of short-term domestic debt and lengthening the maturity profile of the
domestic debt in order to reduce refinancing risk and diversify the investor base of the
domestic debt portfolio.
23. The 2018 debt management strategy envisaged the issuance of medium-term and long-
term bonds and made provision of GH¢1,000.0 million for possible contingent liabilities that
may arise. The strategy also envisaged the issuance of a sovereign bond with proceeds of
about US$1,000.0 million to fund the budget and US$1,500.0 million to be used for liability
management, as well as the planned annual issuance of a USD-denominated bond on the
domestic market.
24. In line with the strategy, Government issued 3-year, 5-year 7-year and 10-year bonds to
lengthen the maturity profile of domestic debt. About GH¢9,801.3 million (representing about
3.2 percent of the rebased GDP) was also issued by Government to cover the bailout of
seven banks. Government issued a bond of GH¢2,201.3 million at 12.0 percent to cover the
net liabilities of the two banks2 which were taken over by GCB Bank. An additional bond of
GH¢7,600.0 billion was issued to cover the gap between the liabilities and good assets of
the five banks3 which were merged to form the Consolidated Bank Ghana Limited (CBG).
The CBG bond was issued in two tranches of GH¢3,200.0 million and GH¢4,400.0 billion at
17.0 percent and 11.65 percent, respectively. The total cost involved in the bailout was,
however, significantly above the provision of GH¢1,000.0 million made in the strategy for
possible contingent, posing a risk to the implementation of the strategy.
25. A total of US$2,000.0 million in 10-year and 30-year Eurobonds was raised on the ICM,
US$500 million below the amount of US$2,500.0 million initially budgeted for (see Section
5 for more information). The implementation of the strategy is evidenced in the costs and
risks indicators of the public debt portfolio (Table 3.1).
2 UT Bank and Capital Bank 3 Beige Capital, Sovereign Bank, Construction Bank, uniBank and Royal Bank
The 2018 Annual Public Debt Report
24
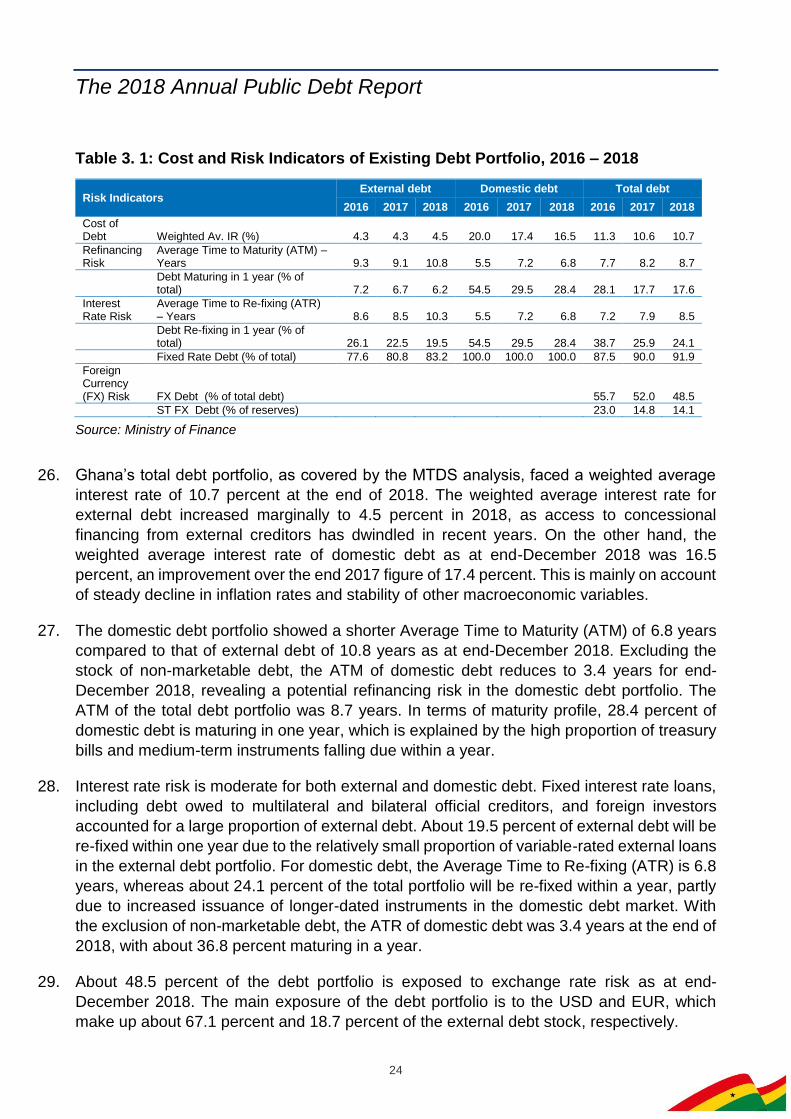
Table 3. 1: Cost and Risk Indicators of Existing Debt Portfolio, 2016 – 2018
Risk Indicators External debt Domestic debt Total debt
2016 2017 2018 2016 2017 2018 2016 2017 2018
Cost of Debt Weighted Av. IR (%) 4.3 4.3 4.5 20.0 17.4 16.5 11.3 10.6 10.7
Refinancing Risk
Average Time to Maturity (ATM) –Years 9.3 9.1 10.8 5.5 7.2 6.8 7.7 8.2 8.7
Debt Maturing in 1 year (% of total) 7.2 6.7 6.2 54.5 29.5 28.4 28.1 17.7 17.6
Interest Rate Risk
Average Time to Re-fixing (ATR) – Years 8.6 8.5 10.3 5.5 7.2 6.8 7.2 7.9 8.5
Debt Re-fixing in 1 year (% of total) 26.1 22.5 19.5 54.5 29.5 28.4 38.7 25.9 24.1
Fixed Rate Debt (% of total) 77.6 80.8 83.2 100.0 100.0 100.0 87.5 90.0 91.9
Foreign Currency (FX) Risk FX Debt (% of total debt) 55.7 52.0 48.5
ST FX Debt (% of reserves) 23.0 14.8 14.1
Source: Ministry of Finance
26. Ghana’s total debt portfolio, as covered by the MTDS analysis, faced a weighted average
interest rate of 10.7 percent at the end of 2018. The weighted average interest rate for
external debt increased marginally to 4.5 percent in 2018, as access to concessional
financing from external creditors has dwindled in recent years. On the other hand, the
weighted average interest rate of domestic debt as at end-December 2018 was 16.5
percent, an improvement over the end 2017 figure of 17.4 percent. This is mainly on account
of steady decline in inflation rates and stability of other macroeconomic variables.
27. The domestic debt portfolio showed a shorter Average Time to Maturity (ATM) of 6.8 years
compared to that of external debt of 10.8 years as at end-December 2018. Excluding the
stock of non-marketable debt, the ATM of domestic debt reduces to 3.4 years for end-
December 2018, revealing a potential refinancing risk in the domestic debt portfolio. The
ATM of the total debt portfolio was 8.7 years. In terms of maturity profile, 28.4 percent of
domestic debt is maturing in one year, which is explained by the high proportion of treasury
bills and medium-term instruments falling due within a year.
28. Interest rate risk is moderate for both external and domestic debt. Fixed interest rate loans,
including debt owed to multilateral and bilateral official creditors, and foreign investors
accounted for a large proportion of external debt. About 19.5 percent of external debt will be
re-fixed within one year due to the relatively small proportion of variable-rated external loans
in the external debt portfolio. For domestic debt, the Average Time to Re-fixing (ATR) is 6.8
years, whereas about 24.1 percent of the total portfolio will be re-fixed within a year, partly
due to increased issuance of longer-dated instruments in the domestic debt market. With
the exclusion of non-marketable debt, the ATR of domestic debt was 3.4 years at the end of
2018, with about 36.8 percent maturing in a year.
29. About 48.5 percent of the debt portfolio is exposed to exchange rate risk as at end-
December 2018. The main exposure of the debt portfolio is to the USD and EUR, which
make up about 67.1 percent and 18.7 percent of the external debt stock, respectively.

The 2018 Annual Public Debt Report
25
30. As shown in Table 3.2, refinancing risk indicators improved compared to the targets set, with
debt maturing in 1 year and ATM being 17.6 percent and 8.7 years, respectively, as at end-
December 2018, against targets of between 15 percent and 20 percent and above 7.8 years,
respectively. Debt re-fixing in 1 year, which looks at variable rate debt in the portfolio
(including short-term domestic debt and floating rate debt in the external debt portfolio), was
24.1 percent and was within the target of less or equal to 30 percent. All of the proposed
targets were achieved.
Table 3. 2: Performance Indicators of 2018 MTDS
Risk Indicators Target 2018 Prov.
Refinancing Risk Debt Maturing in 1 year (% of total) 15 - 20 17.6
Average Time to Maturity (ATM) - Years ≥ 7.8 8.7
Interest Rate Risk Debt Refixing in 1 year (% of total) ≤ 30 24.1
Floating Rate Debt (% of total external debt) 15 - 20 16.9
FX Risk USD debt (% of external debt) 70 ± 5 67.1
Source: Ministry of Finance
The 2018 Annual Public Debt Report
26
Section Four: Government Borrowing and Financing
Operations
31. In line with the 2018 MTDS, Government financing operations for the 2018 financial year
were guided by the 2018 budget deficit target of GH¢10,971.2 million (3.7% of GDP). The
provisional budget deficit outturn for 2018 (excluding the financial sector bailout) was
GH¢11,672.4 million (3.9% of GDP), slightly higher than target on account of lower than
expected revenues relative to expenditure. Including financial sector clean-up costs,
however, the provisional budget deficit outturn was GH¢21,474.0 million (7.2% of GDP).
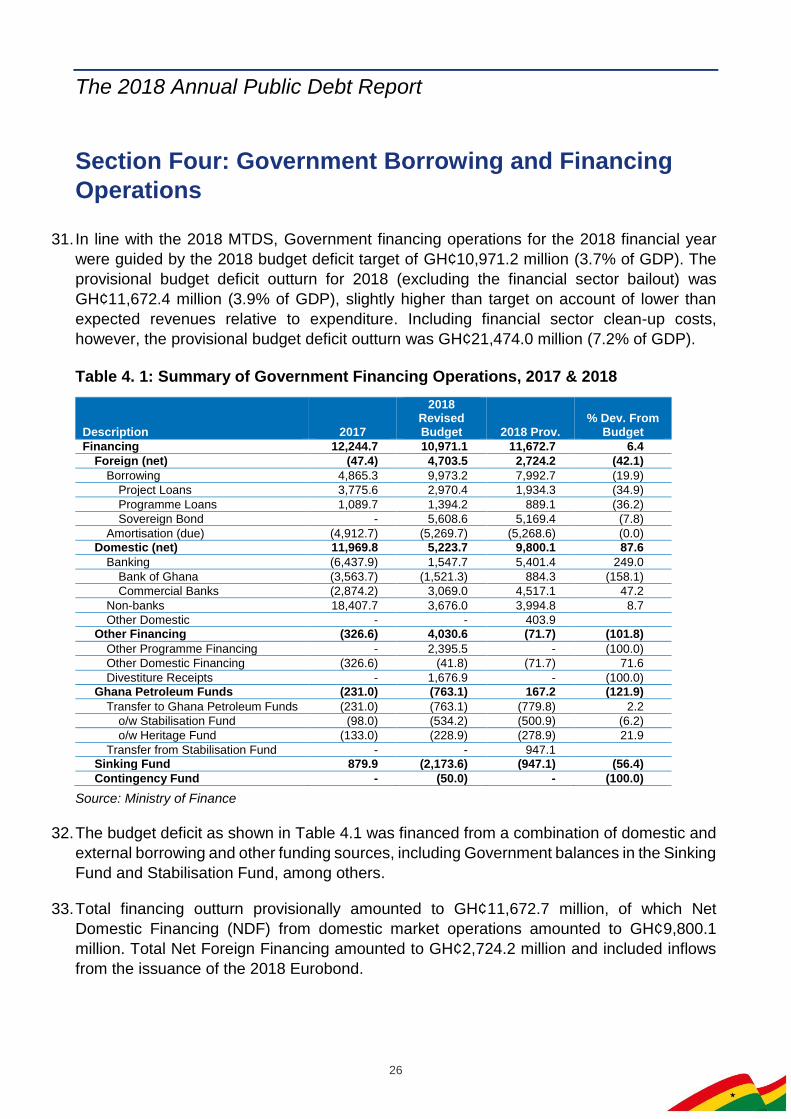
Table 4. 1: Summary of Government Financing Operations, 2017 & 2018
Description 2017
2018 Revised Budget 2018 Prov.
% Dev. From Budget
Financing 12,244.7 10,971.1 11,672.7 6.4
Foreign (net) (47.4) 4,703.5 2,724.2 (42.1)
Borrowing 4,865.3 9,973.2 7,992.7 (19.9)
Project Loans 3,775.6 2,970.4 1,934.3 (34.9)
Programme Loans 1,089.7 1,394.2 889.1 (36.2)
Sovereign Bond - 5,608.6 5,169.4 (7.8)
Amortisation (due) (4,912.7) (5,269.7) (5,268.6) (0.0)
Domestic (net) 11,969.8 5,223.7 9,800.1 87.6
Banking (6,437.9) 1,547.7 5,401.4 249.0
Bank of Ghana (3,563.7) (1,521.3) 884.3 (158.1)
Commercial Banks (2,874.2) 3,069.0 4,517.1 47.2
Non-banks 18,407.7 3,676.0 3,994.8 8.7
Other Domestic - - 403.9 Other Financing (326.6) 4,030.6 (71.7) (101.8)
Other Programme Financing - 2,395.5 - (100.0)
Other Domestic Financing (326.6) (41.8) (71.7) 71.6
Divestiture Receipts - 1,676.9 - (100.0)
Ghana Petroleum Funds (231.0) (763.1) 167.2 (121.9)
Transfer to Ghana Petroleum Funds (231.0) (763.1) (779.8) 2.2
o/w Stabilisation Fund (98.0) (534.2) (500.9) (6.2)
o/w Heritage Fund (133.0) (228.9) (278.9) 21.9
Transfer from Stabilisation Fund - - 947.1 Sinking Fund 879.9 (2,173.6) (947.1) (56.4)
Contingency Fund - (50.0) - (100.0)
Source: Ministry of Finance
32. The budget deficit as shown in Table 4.1 was financed from a combination of domestic and
external borrowing and other funding sources, including Government balances in the Sinking
Fund and Stabilisation Fund, among others.
33. Total financing outturn provisionally amounted to GH¢11,672.7 million, of which Net
Domestic Financing (NDF) from domestic market operations amounted to GH¢9,800.1
million. Total Net Foreign Financing amounted to GH¢2,724.2 million and included inflows
from the issuance of the 2018 Eurobond.

The 2018 Annual Public Debt Report
27
Gross Debt Issuance in the Domestic Market
34. Total gross issuance at face value on the domestic market reduced in 2018 by 32.7 percent
to GH¢49,168.40 million from the 2017 outturn of GH¢73,009.3 million (Table 4.2). This was
largely due to the decline in outstanding maturities for 2018. It is important to note that
Government’s debt re-profiling objective was met, resulting in a significant reduction of
outstanding short-term maturing instruments.
Table 4. 2: Gross Domestic Issuance, 2017 & 2018
Description 2017 2018 Prov.
(in millions of GH¢)
Gross Domestic Issuance 73,009.3 49,168.4
o/w Maturities 59,432.3 38,145.8
o/w Net Issuance 13,577.0 11,022.6
Source: Ministry of Finance
35. Financing in 2018 was achieved through the issuance of both short-term and medium-to-
long-term instruments. The proportion of short-term borrowing was higher at 60.6 percent
due market pressures, while medium and long-term instruments accounted for 39.4 percent.
Government, however, remained committed to its debt strategy of lengthening the maturity
profile in the medium to long-term.
36. For the year 2018, Government’s actual issuance was in excess of the issuance calendar
target by 9.2 percent on account of higher than expected revenue shortfalls. However,
although Government experienced many uncovered auctions in the course of the year, this
was cushioned through re-opens or tapped issuances, particularly in the 2-year and 3-year
bonds. Figure 4.1 shows the variation between the target and actual issuance.
Figure 4. 1: Domestic Planned versus Actual Issuances in 2018
Source: Ministry of Finance
-
5.0
10.0
15.0
20.0
91-Day 182-Day 1-Year 2-Year 3-Year 5-Year 7-Year 10-Year 15-Year
Issuance Calendar Target Actual Issuance

The 2018 Annual Public Debt Report
28
Section Five: Gross Public Debt
37. Ghana’s public debt stock in nominal terms as at end-December 2018 stood at
GH¢173,068.7 million (US$35,888.5 million), comprising external and domestic debt of
GH¢86,169.0 million (US$17,868.5 million) and GH¢86,899.7 million (US$18,020.0 million),
respectively (Table 5.1). Appendices 1A and 1B provide details on the total stock of debt.
Table 5. 1: Gross Public Debt, 2014 – 2018
Debt Type 2014 2015 2016 2017 2018 Prov.
(in millions of GHȼ)
External Debt 44,530.0 59,912.8 68,859.6 75,847.5 86,169.0
Domestic Debt 35,040.2 40,322.1 53,403.4 66,769.1 86,899.7
Total Public Debt 79,570.2 100,234.9 122,263.0 142,616.6 173,068.7
(in millions of US$)
External Debt 13,871.8 15,781.9 16,461.0 17,174.1 17,868.5
Domestic Debt 10,915.6 10,621.4 12,766.2 15,118.4 18,020.0
Total Public Debt 24,787.4 26,403.3 29,227.1 32,292.5 35,888.5
Source: Ministry of Finance
38. External debt and domestic debt accounted for approximately 49.7 percent and 50.3 percent
of the total public debt stock, respectively, by end-December 2018. The external debt portion
has dominated policymakers’ attention over the years, partly on account of Ghana’s active
presence in the ICM and exchange rate depreciation which increased the Cedi equivalent
amount outstanding (Table 5.2). The issuance of domestic debt to support the financial
sector bailout, however, significantly increased the share of domestic debt, thus making it
dominant in the portfolio by the end of 2018.
Table 5. 2: Annual Public Debt Ratios, 2014 – 2018
Debt Type 2014 2015 2016 2017 2018 Prov.
(as % of GDP)
External Debt 28.6 33.2 32.0 29.6 28.8
Domestic Debt 22.5 22.4 24.8 26.0 29.1
Total Public Debt 51.2 55.6 56.8 55.6 57.9
(as % of Total)
External Debt 56.0 59.8 56.3 53.2 49.8
Domestic Debt 44.0 40.2 43.7 46.8 50.2
Total Public Debt 100.0 100.0 100.0 100.0 100.0
Source: Ministry of Finance
39. The overall rate of debt accumulation in 2018 was 21.2 percent, driven significantly by the
costs of the financial sector clean-up. The rate of debt accumulation without the financial
sector bailout was 14.5 percent (see Figure 5.1).

The 2018 Annual Public Debt Report
29
Figure 5. 1: Gross Public Debt Developments, 2014 – 2018
Source: Ministry of Finance
Public Debt Dynamics
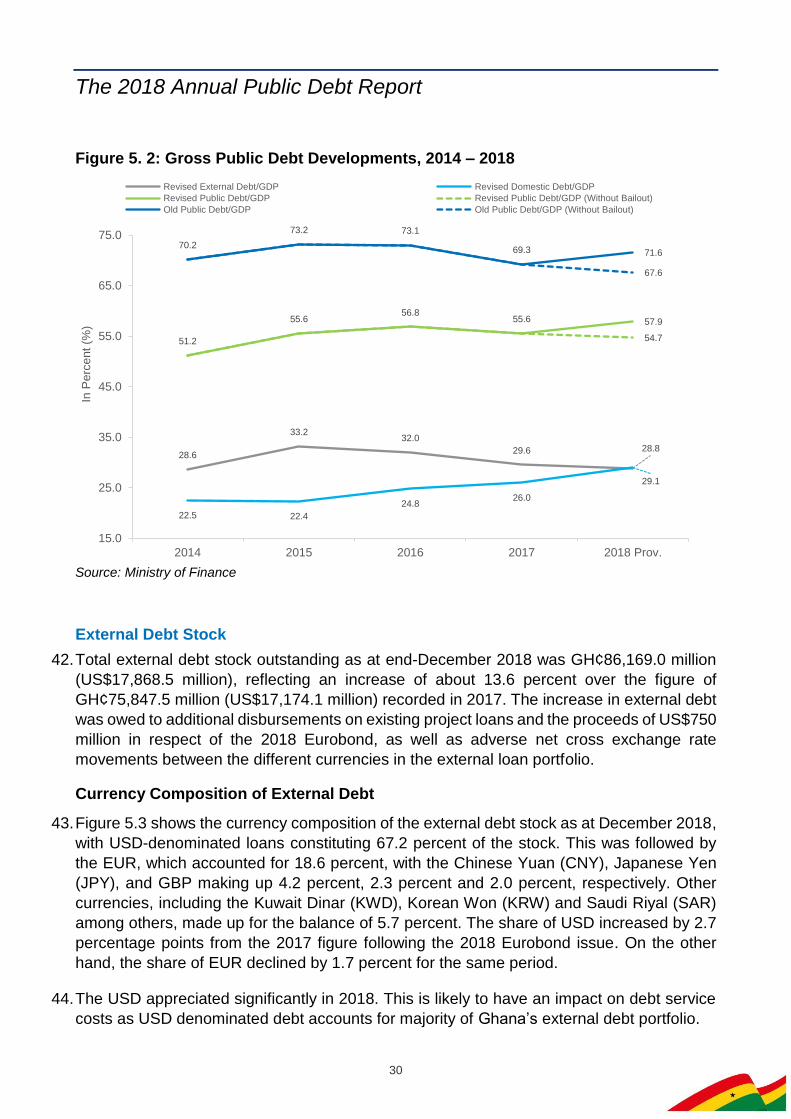
40. Using the old national accounts series which had 2006 as the base year, the debt-to-GDP
ratio as at December 2018 stood at 71.7 percent. At the end of 2017, the ratio was 69.3
percent, indicating a slight surge in the debt. This increase was mainly as a result of the
bailout of some distressed banks and some exchange rate depreciation in December 2018.
The bank bailout alone accounted for circa 4.0 percent of the old GDP. However, when the
bailout is expunged from the debt stock, the core debt-to-GDP ratio based on the old series
was 67.6 percent as at end-December 2018.
41. Following the rebasing of Ghana’s GDP by the GSS in 2018, the debt-to-GDP ratio was re-
calibrated, resulting in a reduction of debt ratios (See details in Appendix 2). Debt-to-GDP
with financial bailout stood at 57.9 percent and without the bailout was also at 54.7 percent,
in 2018 (Figure 5.2). In addition to this development, Ghana was able to build-up significant
debt service reserves from the sinking fund and other escrow accounts to redeem maturing
debt amortization and for liability management operations.
50.0%
26.0%
22.0%
16.6%
21.4%
14.5%
0.0%
10.0%
20.0%
30.0%
40.0%
50.0%
60.0%
-
20.0
40.0
60.0
80.0
100.0
120.0
140.0
160.0
180.0
200.0
2014 2015 2016 2017 2018 Prov.
Rate
of
Debt
Accum
ula
tion
Nom
inal A
mount (G
H¢'b
illio
n)
External Debt Domestic Debt Bailout Debt Accumulation Debt Accumulation (Without Bailout)
Cost of Financial Sector Bailout
The 2018 Annual Public Debt Report
30
Figure 5. 2: Gross Public Debt Developments, 2014 – 2018
Source: Ministry of Finance
External Debt Stock
42. Total external debt stock outstanding as at end-December 2018 was GH¢86,169.0 million
(US$17,868.5 million), reflecting an increase of about 13.6 percent over the figure of
GH¢75,847.5 million (US$17,174.1 million) recorded in 2017. The increase in external debt
was owed to additional disbursements on existing project loans and the proceeds of US$750
million in respect of the 2018 Eurobond, as well as adverse net cross exchange rate
movements between the different currencies in the external loan portfolio.
Currency Composition of External Debt
43. Figure 5.3 shows the currency composition of the external debt stock as at December 2018,
with USD-denominated loans constituting 67.2 percent of the stock. This was followed by
the EUR, which accounted for 18.6 percent, with the Chinese Yuan (CNY), Japanese Yen
(JPY), and GBP making up 4.2 percent, 2.3 percent and 2.0 percent, respectively. Other
currencies, including the Kuwait Dinar (KWD), Korean Won (KRW) and Saudi Riyal (SAR)
among others, made up for the balance of 5.7 percent. The share of USD increased by 2.7
percentage points from the 2017 figure following the 2018 Eurobond issue. On the other
hand, the share of EUR declined by 1.7 percent for the same period.
44. The USD appreciated significantly in 2018. This is likely to have an impact on debt service
costs as USD denominated debt accounts for majority of Ghana’s external debt portfolio.
28.6
33.232.0
29.6 28.8
22.5 22.4
24.826.0
29.1
51.2
55.656.8
55.6 57.9
54.7
70.2
73.2 73.1
69.3 71.6
67.6
15.0
25.0
35.0
45.0
55.0
65.0
75.0
2014 2015 2016 2017 2018 Prov.
In P
erc
en
t (%
)
Revised External Debt/GDP Revised Domestic Debt/GDP
Revised Public Debt/GDP Revised Public Debt/GDP (Without Bailout)
Old Public Debt/GDP Old Public Debt/GDP (Without Bailout)

The 2018 Annual Public Debt Report
31
Figure 5. 3: Currency Composition of External Debt Stock, 2017 & 2018
Source: Ministry of Finance
Composition of External Debt by Creditor Category
45. Commercial debt accounted for the largest share of external debt in 2018, representing 50.6
percent of the total external debt portfolio. The six outstanding Eurobonds accounted for
27.9 percent of the stock of commercial debt, while Export Credit Agencies (ECAs)
represented 6.9 percent of the commercial debt stock. The remaining portion of the external
debt comes from multilateral and bilateral sources. Multilateral debt, which are mostly on
concessional terms, accounted for about 35.8 percent of external debt, while bilateral debt
constituted 13.7 percent (Figure 5.4).
Figure 5. 4: External Debt Stock by Creditor Category, 2017 & 2018
Source: Ministry of Finance
EUR20.4%
GBP2.3%
YEN2.4%
CNY4.5%
Others5.9%
USD64.5%
2017
EUR18.6%
GBP2.0%
YEN2.3%
CNY4.2%
Others5.7%
USD67.2%
2018
0.0%
10.0%
20.0%
30.0%
40.0%
50.0%
60.0%
Commercial Multilateral Bilateral
Sh
are
of E
xte
rna
l D
eb
t
2017 2018

The 2018 Annual Public Debt Report
32
Interest Rate Structure of External Debt
46. The external debt portfolio is composed of interest-free, fixed rate and variable rate debt.
End-December 2018 figures indicate that about 82.1 percent of external debt attracted fixed
interest rate while variable rate and interest-free debt accounted for 16.9 percent and 1.0
percent of the external debt portfolio, respectively. The interest-free debt consists largely of
subsidised loans from a few bilateral creditors, while multilateral and bilateral debt, and
some commercial debt such as the Eurobonds, accounted for a large proportion of the fixed
interest rate debt (Figure 5.5).
Figure 5. 5: Interest Rate Structure of External Debt Stock, 2017 & 2018
Source: Ministry of Finance
Ghana’s Eurobond Issuances
47. Since 2007, Ghana has issued 7 Eurobonds on the ICM. The maiden 10-year bond which
was issued in October 2007 was paid off in October 2017. As seen Table 5.3, Ghana has
continued to maintain her presence in the market, raising various amounts to implement
Government’s debt strategy partly for budget support and for liability management
operations.
48. As at end-December 2018, the total maturity value of Eurobond instruments stood at
US$5,750.0 million, of which Government through its liability management programme
bought-back about US$771.9 million, leaving an outstanding balance of US$4,978.1 million.
Variable19.1%
Interest-Free1.2%
Fixed79.7%
2017
Variable16.9%
Interest-Free1.0%
Fixed82.1%
2018
The 2018 Annual Public Debt Report
33
Table 5. 3: Summary of Ghana’s Outstanding Eurobond Issuances, end 2018
Instruments Issuance Date Maturity
Amount Issued
(US$’m)
Coupon Rate (%)
Outstanding Amount (US$’m)
6-year September, 2016 2022 750.0 9.25 48.0
10-year August, 2013 2023 1,000.0 7.88 1,000.0
10-year July, 2014 2026 1,000.0 8.13 1,000.0
10-year May, 2018 2029 1,000.0 7.625 1,000.0
15-year August, 2015 2030 1,000.0 10.75 930.1
30-year May, 2018 2049 1,000.0 8.627 1,000.0
Total 5,750.0 4,978.1
Source: Ministry of Finance
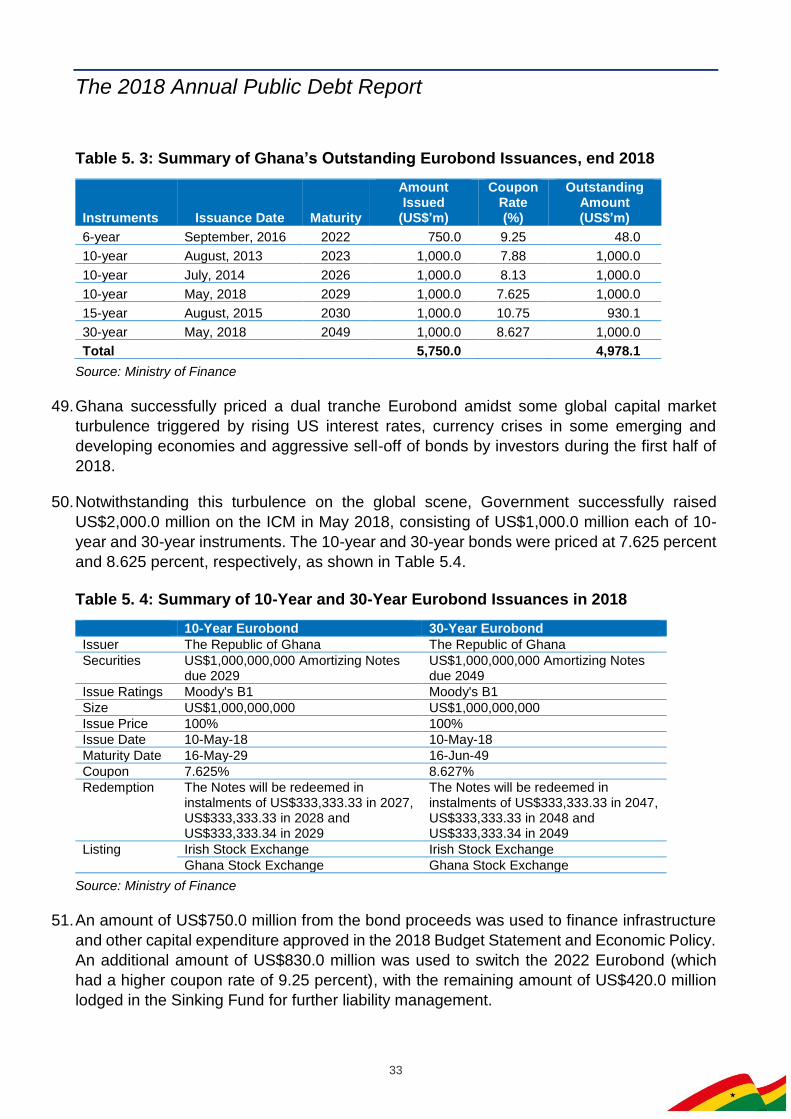
49. Ghana successfully priced a dual tranche Eurobond amidst some global capital market
turbulence triggered by rising US interest rates, currency crises in some emerging and
developing economies and aggressive sell-off of bonds by investors during the first half of
2018.
50. Notwithstanding this turbulence on the global scene, Government successfully raised
US$2,000.0 million on the ICM in May 2018, consisting of US$1,000.0 million each of 10-
year and 30-year instruments. The 10-year and 30-year bonds were priced at 7.625 percent
and 8.625 percent, respectively, as shown in Table 5.4.
Table 5. 4: Summary of 10-Year and 30-Year Eurobond Issuances in 2018
10-Year Eurobond 30-Year Eurobond
Issuer The Republic of Ghana The Republic of Ghana
Securities US$1,000,000,000 Amortizing Notes due 2029
US$1,000,000,000 Amortizing Notes due 2049
Issue Ratings Moody's B1 Moody's B1
Size US$1,000,000,000 US$1,000,000,000
Issue Price 100% 100%
Issue Date 10-May-18 10-May-18
Maturity Date 16-May-29 16-Jun-49
Coupon 7.625% 8.627%
Redemption The Notes will be redeemed in instalments of US$333,333.33 in 2027, US$333,333.33 in 2028 and US$333,333.34 in 2029
The Notes will be redeemed in instalments of US$333,333.33 in 2047, US$333,333.33 in 2048 and US$333,333.34 in 2049
Listing Irish Stock Exchange Irish Stock Exchange
Ghana Stock Exchange Ghana Stock Exchange
Source: Ministry of Finance
51. An amount of US$750.0 million from the bond proceeds was used to finance infrastructure
and other capital expenditure approved in the 2018 Budget Statement and Economic Policy.
An additional amount of US$830.0 million was used to switch the 2022 Eurobond (which
had a higher coupon rate of 9.25 percent), with the remaining amount of US$420.0 million
lodged in the Sinking Fund for further liability management.

The 2018 Annual Public Debt Report
34
52. Ghana achieved a landmark success with this issuance as the first B-rated Sub-Saharan
African country to price a sovereign bond with strong investor participation. This remarkable
transaction was a momentous achievement in many aspects as it was:
the largest deal size ever raised by Ghana in the Eurobond markets;
the largest liability management exercise ever conducted by Ghana; and
the longest tenor ever achieved by Ghana in the Eurobond markets.
53. Figure 5.6 illustrates the movement in the yields on Ghana’s outstanding Eurobonds as at
end-December 2018.
Box 1: Ghana’s 2018 Eurobond Issuance Ghana once again continued to maintain its presence on the ICM, issuing a total of US$2.0 billion in 10-year and 30-year Eurobonds of $1.0 billion each in May 2018. This issue was Ghana’s sixth appearance on the ICM since her debut in 2007. The 10-year bond was priced at 7.625 percent while the 30-year bond was priced at 8.627 percent. The 30-year tenor tranche was the longest tenor ever achieved by Ghana in the Eurobond markets. Ghana achieved this in what turned out to be a week of very turbulent global capital markets. The market weakness was triggered by, among others, rising US interest rates and a currency crisis in Argentina, resulting in an aggressive sell-off of bonds across the board by investors. The offering was of RegS/144A. format with a maturity period of 10 years. Lead advisors for the sale were Bank of America Merrill Lynch, Citigroup, JP Morgan and Standard Chartered. Meanwhile, Fidelity Group and IC Securities acted as co-managers. Ghana was rated B3 by Moody’s/B- by Standard & Poor’s/B by Fitch for this issue. Prior to the launching of the offer, Ghana conducted a series of meetings with investors in London, Boston and New York in order to update investors in the capital market. Initial price guidance was set at 7.75 to 7.875 percent for the May 2029 bond whilst the May 2049 was in the 8.75 percent to 8.875 percent range. Order book peaked at US$7.5 billion before ending closer to US$5.0 billion, despite a very volatile backdrop and even after a massive price tightening of 62.5 basis points from initial price guidance levels, allowing Ghana to price the bonds at 7.625 percent and 8.625 percent respectively at lower yields. Over 300 high quality global accounts participated. Distribution was very well diversified, among Asia, Europe and North America. Part proceeds of the US$2.0 billion dual tranche RegS/144A Eurobond offering, in an amount of US$830.0 million, was used to switch the 2022 Eurobond and part of the proceeds was used for budget support (US$750.0 million) and lodged in the Sinking Fund (US$420.0 million).

The 2018 Annual Public Debt Report
35
Figure 5. 6: Evolution of Ghana’s Eurobond Yields, 2013 – 2018
Source: Bloomberg
External Loan Disbursements
54. A total of US$2,650.3 million external loan disbursements was received, including the
US$2,000.00 million Eurobond proceeds from the ICM, a significant increase of US$1,781.1
million over the end 2017 figure of US$869.2 million. The increase is largely as a result of
the Eurobond proceeds (Table 5.5). The list of outstanding external loans as at end-
December 2018 is provided in Appendix 3.
Table 5. 5: External Loan Disbursements by Creditor Category, 2017 & 2018
2017 2018 Prog.
2018 Prov.
Dev. from Prog.
(in millions of US$)
Project Loans 619.7 584.1 460.7 (123.4)
Multilateral 178.3 139.7 128.7 (11.0)
Bilateral 143.5 106.7 79.4 (27.3)
Commercial 297.9 337.7 252.7 (85.0)
Programme Loans 249.5 1,479.1 2,189.6 710.5
Multilateral 249.5 479.1 189.6 (289.5)
Bilateral - - - -
Commercial - 1,000.0 2,000.0 1,000.0
Total 869.2 2,063.2 2,650.3 587.1
(as % of Total) % Dev.
Project Loans 71.3 28.3 17.4 (21.0)
Programme Loans 28.7 71.7 82.6 121.0
Total Disbursement 100.0 100.0 100.0 100.0
Source: Ministry of Finance
4.0
6.0
8.0
10.0
12.0
14.0
16.0
Au
g-1
3
Oct-
13
Dec-1
3
Feb
-14
Ap
r-1
4
Ju
n-1
4
Au
g-1
4
Oct-
14
Dec-1
4
Feb
-15
Ap
r-1
5
Ju
n-1
5
Au
g-1
5
Oct-
15
Dec-1
5
Feb
-16
Ap
r-1
6
Ju
n-1
6
Au
g-1
6
Oct-
16
Dec-1
6
Feb
-17
Ap
r-1
7
Ju
n-1
7
Au
g-1
7
Oct-
17
Dec-1
7
Feb
-18
Ap
r-1
8
Ju
n-1
8
Au
g-1
8
Oct-
18
Dec-1
8
Yie
ld (
%)
2022 Eurobond 2023 Eurobond 2026 Eurobond 2029 Eurobond 2030 Eurobond 2049 Eurobond

The 2018 Annual Public Debt Report
36
External Debt Service
55. Total external debt service on Central Government debt amounted to US$2,493.8 million in
2018, compared to an outturn of US$1,679.3 million in 2017 (Table 5.6). Principal payments,
which constituted about 68.7 percent of the total debt service in 2018, exceeded the budget
provision, largely due to the liability management operation carried out on the 2022
Eurobond.
Table 5. 6: External Debt Service by Creditor Category, 2017 & 2018
2017 2018 Prog. 2018 Prov.
Dev. from Prog.
(in millions of US$)
Principal 1,107.8 1,090.3 1,712.2 621.9
Bilateral 159.3 212.0 168.7 (43.3)
Multilateral 53.1 55.2 63.8 8.6
Commercial 895.4 823.1 1,479.6 656.6
Interest and charges 571.5 569.9 781.7 211.8
Bilateral 34.4 40.8 42.0 1.2
Multilateral 44.9 48.1 52.6 4.4
Commercial 492.2 481.0 687.1 206.1
Total debt service on govt. & govt.-guaranteed debt 1,679.3 1,660.2 2,493.8 833.6
Bilateral 193.7 252.8 210.7 (42.1)
Multilateral 98.0 103.3 116.4 13.1
Commercial 1,387.6 1,304.1 2,166.8 862.7
Source: Ministry of Finance
56. Interest payments, also, increased from US$571.5 million in 2017 to US$781.7 million in
2018. The deviation of US$211.8 million was mainly due to the interest paid on the 2018
Eurobond which was issued earlier than anticipated. Interest cost as a share of total external
debt service cost in 2018 was 31.3 percent.
57. A breakdown of the creditor category of external debt service recipients in 2018 shows that
the external commercial creditor category, which includes the Eurobonds, was the largest
recipient of debt service payment from Ghana, followed by bilateral creditors and multilateral
creditors.
Credit Ratings
58. In 2018, Government continued with its strategy of committing to frequent engagement with
the rating agencies and consistently updating them on Ghana’s economic transformation
successes. These engagements helped in improving the rating agency perceptions of
Ghana and that consequently reflected in their assessment of Ghana.
59. Ghana achieved a rapid turnaround in its sovereign ratings after several years, with S&P
upgrading Ghana’s rating to B/stable, in line with Fitch’s rating of B/stable, whereas Moody’s
affirmed its rating at B3/stable outlook. This turnaround is due to macroeconomic stability,

The 2018 Annual Public Debt Report
37
institutional reforms with irreversibility policies4 and focused rating strategies, which have
yielded favourable results. Figure 5.7 depicts the trends in Ghana’s sovereign ratings over
the period.
Figure 5. 7: Evolution of Ghana’s Sovereign Ratings, 2003 – 2018
Source: Ministry of Finance
Domestic Debt Stock
60. The value of total domestic debt outstanding stock amounted to GH¢86,899.7 million at the
end of 2018, compared to GH¢66,769.1 million at end 2017, reflecting a nominal increase
of 30.2 percent.
Domestic Debt by Category
61. Figure 5.8 shows that 73.4 percent of the total domestic debt stock in 2018 was sourced
through marketable debt5, about 5.4 percentage points lower than the level in 2017. Non-
4 Institutionalising irreversibility of structural reforms to ensure permanency of the stringent policies Government is implementing over the
medium-to-long term. These policies are codified into laws that are designed to promote fiscal discipline and ensure debt sustainability. For example, the Fiscal Responsibility Act and Public Financial Management Act. 5 Marketable debt consists of financial securities and instruments that are traded and can be bought or sold on the secondary market.
S & P
Fitch
Moody's
B- / Negative
B- / Stable
B- / Positive
B / Negative
B / Stable
B / Positive
B+ / Negative
B+ / Stable
B+ / Positive
200
3
200
4
200
5
200
6
200
7
200
8
200
9
201
0
201
1
201
2
201
3
201
4
201
5
201
6
201
7
201
8
So
ve
reig
n R
atin
g

The 2018 Annual Public Debt Report
38
marketable securities6 accounted for 26.5 percent of total domestic debt, up from 20.9
percent in 2017, while the share of domestic standard loans fell by 20 basis points to 0.1
percent in 2018.
Figure 5. 8: Domestic Debt by Category, 2014 – 2018
Source: Ministry of Finance
Domestic Debt by Tenor
62. The proportion of the short-term debt7 in the portfolio of domestic marketable debt declined
from 22.4 percent in 2017 to 17.3 percent in 2018 (Figure 5.9). This was in line with
Government’s debt strategy target of short-term debt of between 15 to 20 percent. On the
other hand, the proportion of medium-term debt8 increased from 68.1 percent to 75.2 percent
in 2018. The proportion of the long-term debt9, like short-term debt, decreased from 9.1
percent in 2017 to 7.5 percent in 2018 as no new bonds with maturities longer than 15 years
were issued during the period.
6 Non-marketable securities include financial securities and instruments that are not transferable and cannot be bought or sold on the secondary market. 7 Short-term instruments: 91-day and 182-day bills, and 1-year notes 8 Medium-term instruments: 2-year notes, and 3-year, 5-year, and 10-year bonds 9Long-term instruments: 15-year bond
22.5% 22.4%
24.8%26.0%
29.1%
0.0%
5.0%
10.0%
15.0%
20.0%
25.0%
30.0%
35.0%
0%
10%
20%
30%
40%
50%
60%
70%
80%
90%
100%
2014 2015 2016 2017 2018
Share
of
GD
P
Sh
are
of D
om
estic D
eb
t
Marketable Debt Non-Marketable Debt Standard Loans Domestic Debt-to-GDP

The 2018 Annual Public Debt Report
39
Figure 5. 9: Domestic Debt by Tenor (Marketable Instruments), 2017 & 2018
Source: Ministry of Finance
Holding Structure of Domestic Debt
63. Table 5.7 shows the stock of Government debt by holder as at the end of December 2018.
The banking sector held about 44.7 percent of the total domestic debt stock, showing a
significant increase from the 35.5 percent share in 2017. The increase was due to the
issuance of GCB and CBG stocks to support the bailout of the financial sector.
Table 5. 7: Holders of Domestic Debt (excl. Standard Loans), 2017 & 2018
2017 2018
GH¢'m % of Total GH¢'m % of Total
Banking Sector 23,619.3 35.5 38,779.2 44.7
Bank of Ghana 13,002.6 19.5 17,133.3 19.7
Banks 10,616.7 16.0 21,645.9 24.9
Non-Bank Sector 17,256.2 25.9 21,919.6 25.3
Individual Investors 4,705.4 7.1 5,671.8 6.5
Firms & Institutions 10,807.8 16.2 14,577.0 16.8
Rural Banks - - 412.8 0.5
Insurance Companies 340.5 0.5 462.4 0.5
SSNIT 1,402.6 2.1 795.6 0.9
Foreign Sector 25,665.6 38.6 26,076.2 30.1
Foreign Investors 25,665.6 38.6 26,076.2 30.1
Total 66,541.2 100.0 86,775.0 100.0
Source: Ministry of Finance & Bank of Ghana
64. Holdings by the non-bank sector reduced slightly from 25.9 percent in 2017 to 25.3 percent
in 2018. Foreign sector holdings also saw a significant reduction from 38.6 percent in 2017
to 30.1 percent in 2018.
Short-Term22.8%
Medium-Term68.1%
Long-Term9.1%
2017
Short-Term17.3%
Medium-Term75.2%
Long-Term7.5%
2018
The 2018 Annual Public Debt Report
40
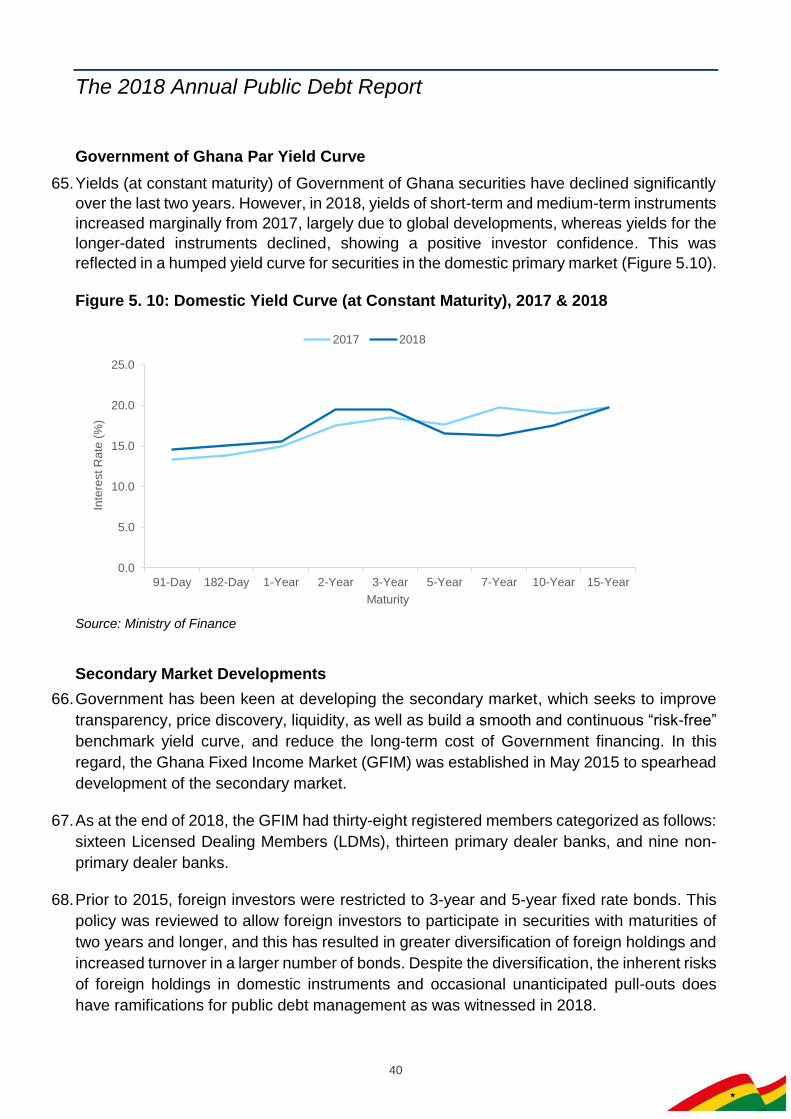
Government of Ghana Par Yield Curve
65. Yields (at constant maturity) of Government of Ghana securities have declined significantly
over the last two years. However, in 2018, yields of short-term and medium-term instruments
increased marginally from 2017, largely due to global developments, whereas yields for the
longer-dated instruments declined, showing a positive investor confidence. This was
reflected in a humped yield curve for securities in the domestic primary market (Figure 5.10).
Figure 5. 10: Domestic Yield Curve (at Constant Maturity), 2017 & 2018
Source: Ministry of Finance
Secondary Market Developments
66. Government has been keen at developing the secondary market, which seeks to improve
transparency, price discovery, liquidity, as well as build a smooth and continuous “risk-free”
benchmark yield curve, and reduce the long-term cost of Government financing. In this
regard, the Ghana Fixed Income Market (GFIM) was established in May 2015 to spearhead
development of the secondary market.
67. As at the end of 2018, the GFIM had thirty-eight registered members categorized as follows:
sixteen Licensed Dealing Members (LDMs), thirteen primary dealer banks, and nine non-
primary dealer banks.
68. Prior to 2015, foreign investors were restricted to 3-year and 5-year fixed rate bonds. This
policy was reviewed to allow foreign investors to participate in securities with maturities of
two years and longer, and this has resulted in greater diversification of foreign holdings and
increased turnover in a larger number of bonds. Despite the diversification, the inherent risks
of foreign holdings in domestic instruments and occasional unanticipated pull-outs does
have ramifications for public debt management as was witnessed in 2018.
0.0
5.0
10.0
15.0
20.0
25.0
91-Day 182-Day 1-Year 2-Year 3-Year 5-Year 7-Year 10-Year 15-Year
Inte
rest R
ate
(%
)
Maturity
2017 2018

The 2018 Annual Public Debt Report
41
69. Difficulties faced by emerging markets from the second half of 2018 affected non-resident
investor participation in the domestic debt market and posed some stress on the exchange
rate. As a result, Government utilised its buffers including proceeds from the Sinking Fund
to help stabilise the domestic market.
70. Going forward Government aims to redirect its strategy increase local participation in the
domestic debt market in order to reduce the risk in foreign investor holdings, which is in line
with the medium-term debt strategy of Government.
71. At end-December 2018, the total outstanding Government securities on the secondary
market amounted to GH¢62,685.0 million as against GH¢51,211.0 million in 2017,
representing a 22.4 percent year-on-year growth. This growth was largely seen on the 2-
year tenor securities which increased from GH¢6,401.0 million in 2017 to GH¢13,050.0
million in 2018.
Secondary Market Trading of Government Securities
72. Trading of Government securities on the secondary market deepened during the period
under review. In 2018, the total volume of trade on the secondary market increased by 23.3
percent from GH¢30,703.7 million at end-December 2017 to GH¢37,865.3 million at end-
December 2018. On the Central Securities Depository (GH) Limited (CSD) platform, it
increased by 18.7 percent to end the year at GH¢34,266.1 million. Similarly, on the
Bloomberg platform it registered an increase of 95.6 percent, to end the reporting year at
GH¢3,599.2 million (Table 5.8).
Table 5. 8: Volume of Trade on Secondary Market, 2017 & 2018
Trading Platform 2017 2018 % Change
(in millions of GH¢)
CSD 28,864.1 34,266.1 18.7
o/w Bloomberg 1,839.6 3,599.2 95.6
Total 30,703.7 37,865.3 23.3
Source: Central Securities Depository and Bloomberg
Government of Ghana Secondary Market Yield Curve
73. Figure 5.11 demonstrates the yield curve for securities in the domestic secondary market.
Generally, yields increased across the curve in 2018 but shows a normal curve, compared
to the 2017 curve which was flat. This indicates that investors’ activities in the secondary
market responded towards Government’s decision in 2017 to re-profile the domestic debt
stock to reduce over reliance on short-term borrowing to finance its budget.

The 2018 Annual Public Debt Report
42
Figure 5. 11: Secondary Market Yield Curve, 2017 & 2018
Source: Bloomberg
Ghana’s Domestic US Dollar Bond
74. The outstanding stock of locally-issued Government USD-denominated securities as at end-
December 2018 was US$221.4 million, representing the 3-year USD bond issued in
November 2017 at a coupon rate of 6.25 percent, with a remaining maturity of approximately
two years as at end 2018. The bond is wholly-held by domestic investors with no foreign
holding (Table 5.9) and is held primarily by commercial banks.
Table 5. 9: Holders of Outstanding Domestic US Dollar Bond, 2017 & 2018
2017 2018
US$'m % of Total US$'m % of Total
Deposit Money Banks 208.4 94.1 195.1 88.1
Firms & Institutions 4.5 2.0 6.8 3.1
Insurance Companies - - 0.9 0.4
Others 8.6 3.9 18.6 8.4
Total 221.4 100.0 221.4 100.0
Source: Central Securities Depository
75. It is worth noting that the maiden domestic US Dollar bond issued in 2016 at a face value of
US$94.6, million and with a maturity of two years, was fully paid off in October 2018.
14.5
15.5
16.5
17.5
18.5
19.5
20.5
21.5
22.5
Inte
rest R
ate
(%
)
Maturity
2017 2018

The 2018 Annual Public Debt Report
43
Secondary Market Trading on Domestic US Dollar Bonds
76. With regards to trading on domestic US Dollar bonds, in 2017 a total of US$26.5 million was
traded, while in 2018 the trade value amounted to US$90.6 million, representing an increase
of nearly 242 percent.
Primary Dealer System
77. The Ghana Primary Dealer (PD) System was established in 1996 with the purpose of
broadening the investor base, and improving transparency and liquidity in the secondary
markets, by giving certain rights and obligations to a group of professional intermediaries.
The Primary Dealer System is regulated by “The Guidelines and the Requirements and
Responsibilities of Primary Dealers, 2015”.
78. Currently, the short-term securities which are discounted bills (91-day and 182-day bills), as
well as the 1-year note, are issued via auctions, while the 2-year note and bonds with longer
tenors are issued via a book-building process. These two types of auctions are occasionally
supplemented with private placements targeted at specific groups of investors. Most local
investors mainly purchase T-bills and short-dated bonds, while non-residents buy medium-
term and long-term bonds.
79. PDs are individually required to purchase a minimum 70 percent of their pro rata share of
bidding at all primary auctions over a rolling six-month period. For the placement of medium-
term and long-term securities, the MoF engages Joint Book Runners (JBRs). Successful
JBRs are appointed for a period of two years, following an open tender.
80. There were a total of thirteen PDs in Ghana at end-December 2018, as listed in Box 2.
81. Out of these thirteen PDs, ten outperformed their targets in 2018. However, the other three
PDs, namely CAL, UMB and CBG, did not meet the minimum requirement and, therefore,
registered various shortfalls as seen in Table 5.10.
Box 2: List of Primary Dealers in Ghana in 2018 1) Access Bank (Ghana) Plc (ABG) 2) ARB Apex Bank Limited (APEX) 3) Barclays Bank of Ghana Limited (BBG) 4) Cal Bank Limited (CAL) 5) Consolidated Bank Ghana Limited (CBG) 6) Ecobank Ghana Limited (EBG) 7) Fidelity Bank Limited (FBG) 8) GCB Bank Limited (GCB) 9) Guaranty Trust Bank (Ghana) Limited (GTB) 10) Societe General Ghana Limited (SGB) 11) Stanbic Bank Ghana Limited (SBG) 12) Standard Chartered Bank (Ghana) Limited (SCB) 13) Universal Merchant Bank Limited (UMB)
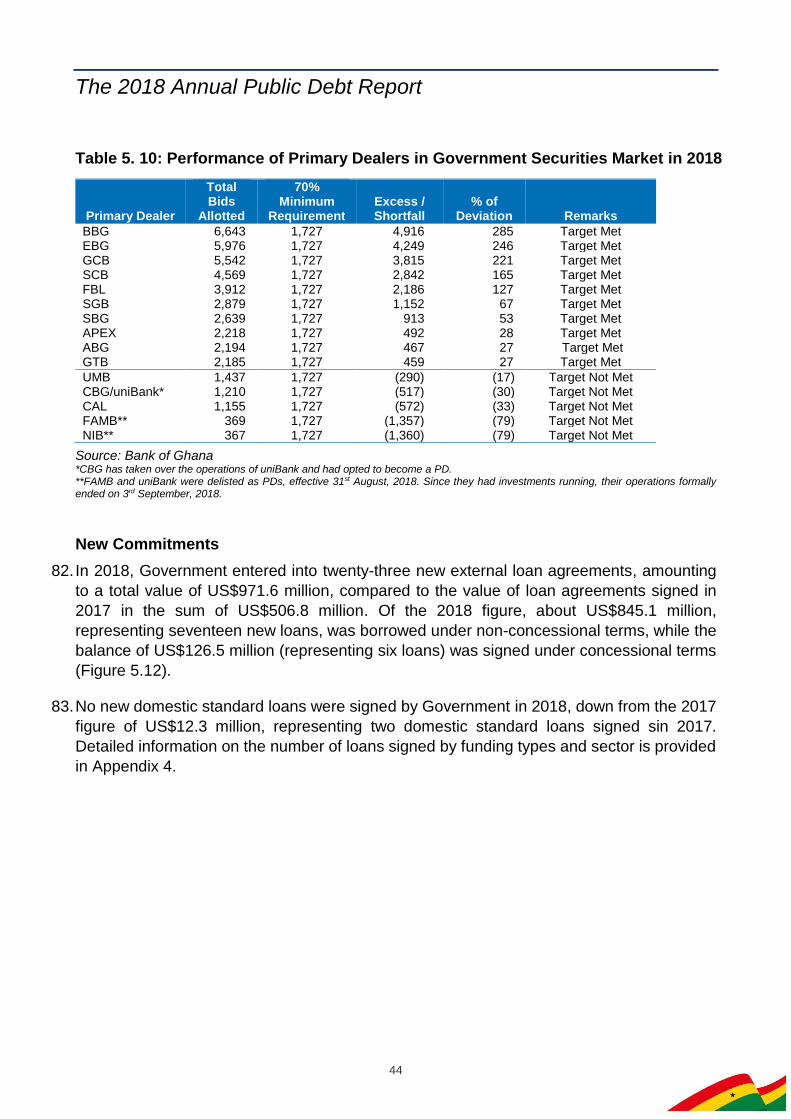
The 2018 Annual Public Debt Report
44
Table 5. 10: Performance of Primary Dealers in Government Securities Market in 2018
Primary Dealer
Total Bids
Allotted
70% Minimum
Requirement Excess / Shortfall
% of Deviation Remarks
BBG 6,643 1,727 4,916 285 Target Met EBG 5,976 1,727 4,249 246 Target Met GCB 5,542 1,727 3,815 221 Target Met SCB 4,569 1,727 2,842 165 Target Met FBL 3,912 1,727 2,186 127 Target Met SGB 2,879 1,727 1,152 67 Target Met SBG 2,639 1,727 913 53 Target Met APEX 2,218 1,727 492 28 Target Met ABG 2,194 1,727 467 27 Target Met GTB 2,185 1,727 459 27 Target Met
UMB 1,437 1,727 (290) (17) Target Not Met CBG/uniBank* 1,210 1,727 (517) (30) Target Not Met CAL 1,155 1,727 (572) (33) Target Not Met FAMB** 369 1,727 (1,357) (79) Target Not Met NIB** 367 1,727 (1,360) (79) Target Not Met
Source: Bank of Ghana *CBG has taken over the operations of uniBank and had opted to become a PD. **FAMB and uniBank were delisted as PDs, effective 31st August, 2018. Since they had investments running, their operations formally ended on 3rd September, 2018.
New Commitments
82. In 2018, Government entered into twenty-three new external loan agreements, amounting
to a total value of US$971.6 million, compared to the value of loan agreements signed in
2017 in the sum of US$506.8 million. Of the 2018 figure, about US$845.1 million,
representing seventeen new loans, was borrowed under non-concessional terms, while the
balance of US$126.5 million (representing six loans) was signed under concessional terms
(Figure 5.12).
83. No new domestic standard loans were signed by Government in 2018, down from the 2017
figure of US$12.3 million, representing two domestic standard loans signed sin 2017.
Detailed information on the number of loans signed by funding types and sector is provided
in Appendix 4.

The 2018 Annual Public Debt Report
45
Figure 5. 12: Loans Signed in 2018
Source: Ministry of Finance
Concessional loans19.7% Domestic
standard loans2.4%
Non-concessional loans77.8%
2017
Concessional loans13.0%
Non-concessional loans87.0%
2018

The 2018 Annual Public Debt Report
46
Section Six: Liability Management Operations
84. In 2018, Government continued the implementation of its liability management and domestic
debt re-profiling programme to actively manage the public debt portfolio by redeeming
benchmark size bonds before maturity with the view to minimise refinancing risk.
85. Government earmarked a total amount of US$1,250.0 million from the proceeds of the two-
tranche Eurobond issued in May 2018 for its liability management programme. Of this
amount, Government made a total tender offer of US$830.0 million to buy-back part of the
2022 Eurobond which was issued in 2016 at a coupon rate of 9.25 percent. This reduced
the outstanding stock on the 2022 Eurobond from US$750.0 million to US$48.0 million.
86. On the domestic front, Government conducted buybacks totalling GH¢309.0 million
(US$64.1 million) to help smoothen the maturity profile of public domestic debt and to reduce
refinancing risk (Table 6.1).
Table 6. 1: Government of Ghana Buyback Operations in 2018
Description Instrument Settlement
Date Offer Price
Yield (%)
Nominal Amount (GH¢'m)
GHGB 18 ¼ 07/25/22 5-Year Bond 9/14/2018 97.14579 19.3 150.0
GHGB 16 1/2 02/06/23 5-Year Bond 10/11/2018 89.98320 20.0 30.0
GHGB 19 3/4 03/25/24 7-Year Bond 10/11/2018 99.13700 20.0 48.0
GHGB 16 1/4 04/07/25 7-Year Bond 10/11/2018 86.52180 20.0 55.0
GHGB 19 11/02/26 10-Year Bond 10/11/2018 96.00380 20.0 18.0
GHGB 17 1/2 05/29/28 10-Year Bond 10/11/2018 93.35180 19.0 8.0
Total 309.0
Source: Ministry of Finance
87. Government also, in October 2018, fully redeemed the maturing 2-year domestic US Dollar
bond of US$94.6 million. The remaining amount was used to cover shortfalls as a result of
uncovered auctions experienced in the course of the year.
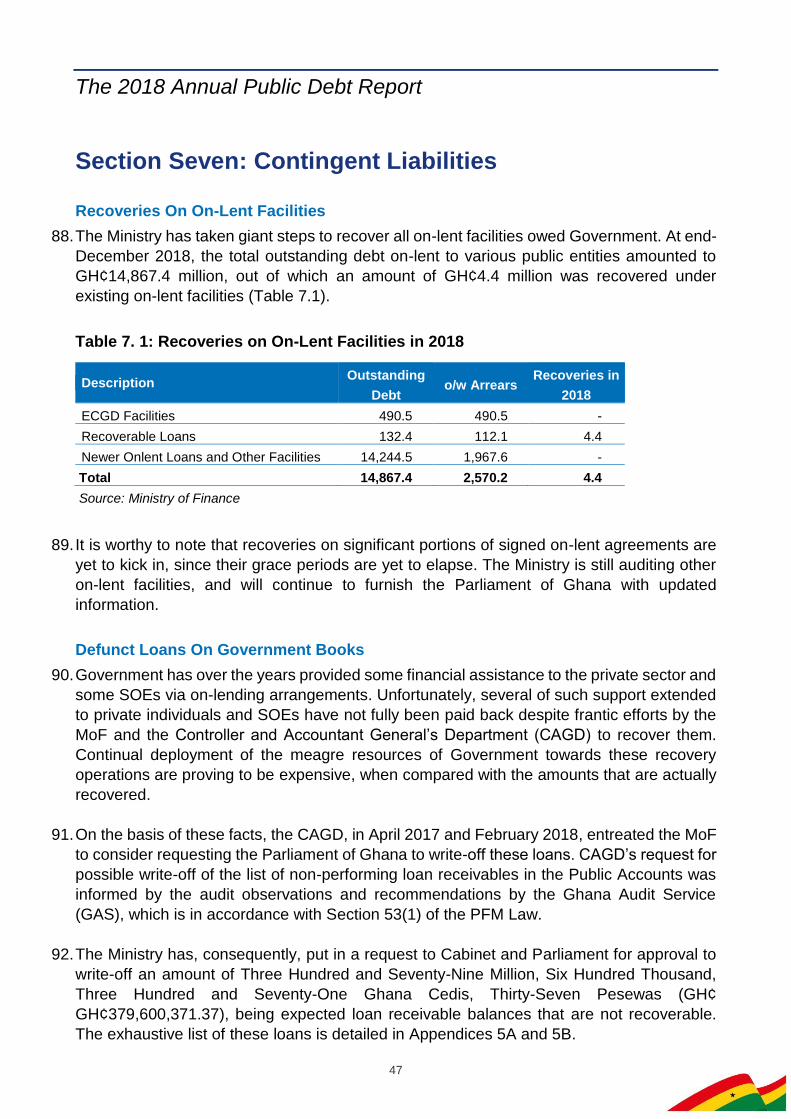
The 2018 Annual Public Debt Report
47
Section Seven: Contingent Liabilities
Recoveries On On-Lent Facilities
88. The Ministry has taken giant steps to recover all on-lent facilities owed Government. At end-
December 2018, the total outstanding debt on-lent to various public entities amounted to
GH¢14,867.4 million, out of which an amount of GH¢4.4 million was recovered under
existing on-lent facilities (Table 7.1).
Table 7. 1: Recoveries on On-Lent Facilities in 2018
Description Outstanding
Debt o/w Arrears
Recoveries in
2018
ECGD Facilities 490.5 490.5 -
Recoverable Loans 132.4 112.1 4.4
Newer Onlent Loans and Other Facilities 14,244.5 1,967.6 -
Total 14,867.4 2,570.2 4.4
Source: Ministry of Finance
89. It is worthy to note that recoveries on significant portions of signed on-lent agreements are
yet to kick in, since their grace periods are yet to elapse. The Ministry is still auditing other
on-lent facilities, and will continue to furnish the Parliament of Ghana with updated
information.
Defunct Loans On Government Books
90. Government has over the years provided some financial assistance to the private sector and
some SOEs via on-lending arrangements. Unfortunately, several of such support extended
to private individuals and SOEs have not fully been paid back despite frantic efforts by the
MoF and the Controller and Accountant General’s Department (CAGD) to recover them.
Continual deployment of the meagre resources of Government towards these recovery
operations are proving to be expensive, when compared with the amounts that are actually
recovered.
91. On the basis of these facts, the CAGD, in April 2017 and February 2018, entreated the MoF
to consider requesting the Parliament of Ghana to write-off these loans. CAGD’s request for
possible write-off of the list of non-performing loan receivables in the Public Accounts was
informed by the audit observations and recommendations by the Ghana Audit Service
(GAS), which is in accordance with Section 53(1) of the PFM Law.
92. The Ministry has, consequently, put in a request to Cabinet and Parliament for approval to
write-off an amount of Three Hundred and Seventy-Nine Million, Six Hundred Thousand,
Three Hundred and Seventy-One Ghana Cedis, Thirty-Seven Pesewas (GH¢
GH¢379,600,371.37), being expected loan receivable balances that are not recoverable.
The exhaustive list of these loans is detailed in Appendices 5A and 5B.
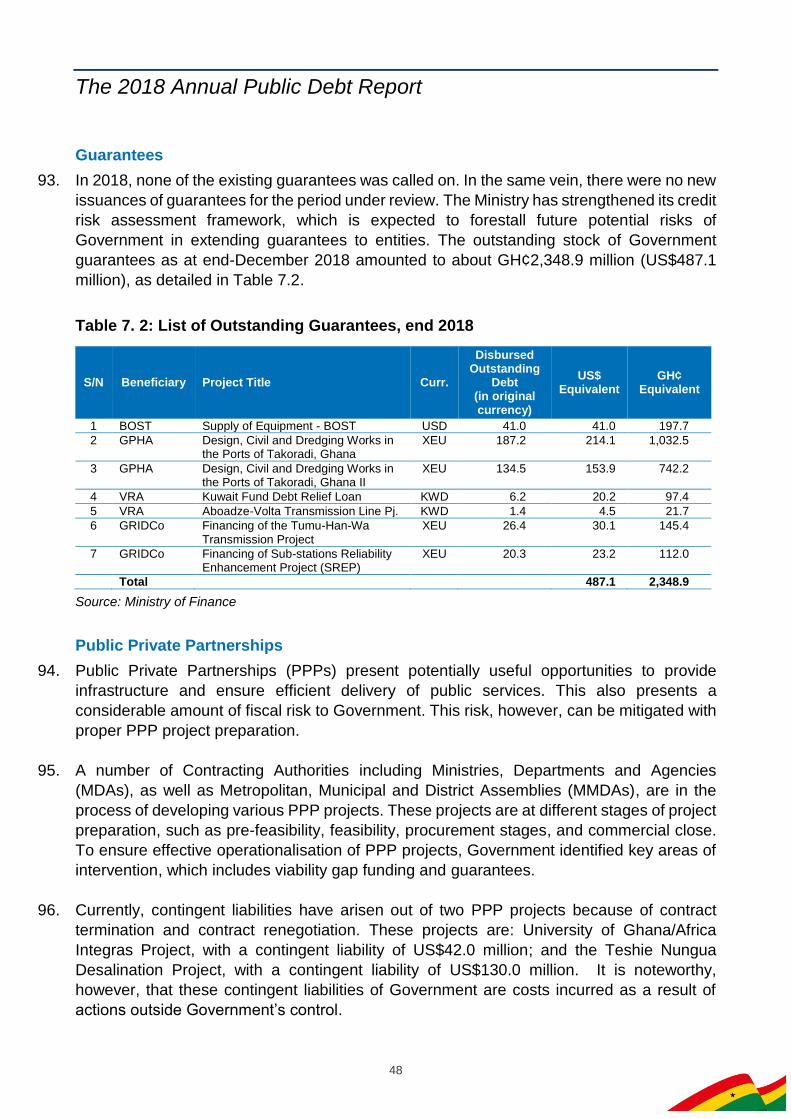
The 2018 Annual Public Debt Report
48
Guarantees
93. In 2018, none of the existing guarantees was called on. In the same vein, there were no new
issuances of guarantees for the period under review. The Ministry has strengthened its credit
risk assessment framework, which is expected to forestall future potential risks of
Government in extending guarantees to entities. The outstanding stock of Government
guarantees as at end-December 2018 amounted to about GH¢2,348.9 million (US$487.1
million), as detailed in Table 7.2.
Table 7. 2: List of Outstanding Guarantees, end 2018
S/N Beneficiary Project Title Curr.
Disbursed Outstanding
Debt (in original currency)
US$ Equivalent
GH¢ Equivalent
1 BOST Supply of Equipment - BOST USD 41.0 41.0 197.7
2 GPHA Design, Civil and Dredging Works in the Ports of Takoradi, Ghana
XEU 187.2 214.1 1,032.5
3 GPHA Design, Civil and Dredging Works in the Ports of Takoradi, Ghana II
XEU 134.5 153.9 742.2
4 VRA Kuwait Fund Debt Relief Loan KWD 6.2 20.2 97.4
5 VRA Aboadze-Volta Transmission Line Pj. KWD 1.4 4.5 21.7
6 GRIDCo Financing of the Tumu-Han-Wa Transmission Project
XEU 26.4 30.1 145.4
7 GRIDCo Financing of Sub-stations Reliability Enhancement Project (SREP)
XEU 20.3 23.2 112.0
Total 487.1 2,348.9
Source: Ministry of Finance
Public Private Partnerships
94. Public Private Partnerships (PPPs) present potentially useful opportunities to provide
infrastructure and ensure efficient delivery of public services. This also presents a
considerable amount of fiscal risk to Government. This risk, however, can be mitigated with
proper PPP project preparation.
95. A number of Contracting Authorities including Ministries, Departments and Agencies
(MDAs), as well as Metropolitan, Municipal and District Assemblies (MMDAs), are in the
process of developing various PPP projects. These projects are at different stages of project
preparation, such as pre-feasibility, feasibility, procurement stages, and commercial close.
To ensure effective operationalisation of PPP projects, Government identified key areas of
intervention, which includes viability gap funding and guarantees.
96. Currently, contingent liabilities have arisen out of two PPP projects because of contract
termination and contract renegotiation. These projects are: University of Ghana/Africa
Integras Project, with a contingent liability of US$42.0 million; and the Teshie Nungua
Desalination Project, with a contingent liability of US$130.0 million. It is noteworthy,
however, that these contingent liabilities of Government are costs incurred as a result of
actions outside Government’s control.

The 2018 Annual Public Debt Report
49
Credit Risk Assessment
97. As part of Government’s effort to manage fiscal risk arising from issuance of guarantees and
on-lent facilities to public entities, a credit risk assessment framework was developed and
operationalised. The current framework is used to assess new requests for guarantees and
on-lending facilities, and was applied to some selected energy sector entities in 2018. In
addition, an assessment was conducted on selected financial institutions seeking
Government support towards the implementation of a Cedi-denominated mortgage and
housing scheme.
98. In all, six entities and five banks were assessed during the year under review, based on
different request lines. The results of these assessments serve as a guide to Government
in providing financial support to beneficiary entities, in line with the Sections 66 and 67 of
the PFM Law.
Financial Sector Bailout
99. The banking sector in Ghana has, in the past few years, been undergoing some challenges
because of inadequate capital, high levels of non-performing loans (NPLs), poor liquidity
and weak corporate governance structures.
100. To address these challenges, Bank of Ghana (BoG), acting as the regulator of the banking
sector, issued a directive in 2017 requiring all universal banks to increase their stated capital
from a minimum of GH¢120.0 million to GH¢400.0 million, effective end-December 2018.
101. This directive affected seven banks because of their inability to meet this requirement.
Government, therefore, intervened to protect about 1.5 million depositors, including
institutional depositors and pension funds. The specific actions taken include: the revocation
of the licenses of two insolvent banks10 in 2017; consolidation of five banks11 to form CBG
in 2018; the capitalisation of CBG with a cash amount of GH¢450.0 million and the issuance
of a medium to long-term bond to cover net liabilities assumed by the new bank.
102. The bonds were issued to GCB after the purchase and assumption of two failed banks, as
well as to CBG under the consolidated arrangement. The fiscal cost of these interventions
in 2018 amounted to GH¢9,800.1 million (3.2% of GDP).
10 The insolvent banks are UT Bank and Capital Bank 11 The consolidated banks are Beige Capital, Sovereign Bank, Construction Bank, uniBank and Royal Bank

The 2018 Annual Public Debt Report
50
Section Eight: Other Finance Arrangements
Energy Sector Bond
103. As part of Government’s effort to deal with the energy sector legacy debts owed by utility
and downstream petroleum service providers to banks and trade creditors, E.S.L.A. Plc was
incorporated in September 2017 as an independent special purpose vehicle to, among other
things, issue debt securities for the purpose of refinancing the Energy Sector Debt.
Initial Issuance 104. E.S.L.A. Plc, supported by MoF, successfully issued one of the biggest local currency
corporate bonds in October 2017. Two bonds were issued—a 7-year bond and a 10-year
bond—at coupon rates of 19.0 percent and 19.5 percent, respectively (Table 8.1).
Table 8. 1: Initial Issuance for ESLA Bond in 2017
Instrument Amount (GH¢'m)
Coupon Rate (%)
7-Year Bond 2,408.6 19.0
10-Year Bond 2,375.4 19.5
Total 4,784.0
Source: Ministry of Finance and E.S.L.A. Plc.
Additional Issuance
105. In January and August 2018, re-openings (tap-ins) on the 10-year Bond were effected with
GH¢615.9 million and GH¢264.8 million, respectively, bringing the total additional value of
the bond to GH¢880.7 million as at end-December 2018 (Table 8.2).
Table 8. 2: Additional Issuances (Tap/Re-open) of ESLA 10-Year Bond, 2018
Issue Date Debt Description Amount Issued
(GH¢'m)
24-Jan-18 10-Year Bond Re-opened/Tapped 468.6
12-Jan-18 10-Year Bond Re-opened/Tapped 147.3
29-Aug-18 10-Year Bond Re-opened/Tapped 46.5
31-Aug-18 10-Year Bond Re-opened/Tapped 218.3
Total Amount 880.7
Source: Central Securities Depository
Outstanding Debt Stock in ESLA Bonds
106. The outstanding debt stock for the ESLA bonds (face value) of 7-year and 10-year bonds
as at the end of December 2018 stood at GH¢5,664.7 million (Table 8.3).

The 2018 Annual Public Debt Report
51
Table 8. 3: Holders of Outstanding Stock of ESLA Bonds as at end 2018
Investor Type
ESLA 10-Year Bond
ESLA 7-Year Bond
Total % Holdings
(in millions of GH¢)
Deposit Money Banks 1,136.5 1,168.3 2,304.8 40.7
Firms and Institutions 981.5 753.5 1,735.0 30.6
Pension Investments (Incl. SSNIT) 442.5 291.1 733.6 12.9
Individual Investors 614.1 110.4 724.5 12.8
Insurance Companies 50.4 34.1 84.4 1.5
Foreign Investors 31.1 51.4 82.5 1.5
Total 3,256.1 2,408.6 5,664.7 100.0
Source: Central Securities Depository
107. Of the outstanding stock amount, foreign investors held close to GH¢82.5 million (1.5%),
whereas the remaining face value of GH¢5,582.2 million was held by domestic investors
(Table 8.4).
Table 8. 4: Distribution of Outstanding Debt Stock in ESLA by Investor Type
Tenor Foreign
Investors Domestic Investors
Total
(in millions of GH¢)
7-Year Bond 51.4 2,357.2 2,408.6
10Year Bond 31.1 3,225.0 3,256.1
Total 82.5 5,582.2 5,664.7
Source: Central Securities Depository
108. Bond holders received interest payments amounting to GH¢1,043.3 million as at 31st
December 2018, and cash held in excess of ESLA Debt Service Reserve amount was
transferred to a Lockbox Account for the benefit of bond holders. Following the issuance of
the bonds, SOE debts amounting to approximately GH¢5,453.2 million had been settled as
at 31st December, 2018.
109. In June 2018, E.S.L.A. Plc’s Bond issuance was adjudged the best restructuring deal in
Europe, Middle East and Africa at the 10th Anniversary edition of the EMEA Finance
Achievement Awards 2017. These awards are organised by EMEA Finance, a premier
finance magazine in the Europe, Middle East and Africa Region.
Secondary Market Trading in ESLA Bonds
110. In 2017, total settlements in ESLA bonds on the secondary market stood at GH¢1,063.3
million. However, in 2018, the value traded increased to GH¢4,659.0 million, representing
over 338 percent increase when compared with 2017 settlements.

The 2018 Annual Public Debt Report
52
Section Nine: 2019-2022 MTDS
111. The 2019-2022 MTDS sets out the debt strategy of the country over the medium-term with
respect to borrowing from external and domestic sources. This is a rolling plan, which is
subject to review, in line with issues and challenges that may arise. Accordingly, the debt
management strategy for 2019-2022 was formulated and clearly articulated in the 2019
Budget Statement and Economic Policy, in line with the Medium-Term Fiscal Framework.
112. The debt management strategy was developed to propose financing for the 2019-2022
medium-term and intends to achieve the following specific objectives:
Meet Government’s funding needs on a timely basis and at a relatively lower cost subject
to prudent levels of risk;
Promote the development of efficient primary and secondary markets; and
Pursue any other action considered to impact to positively on the public debt stock.
113. The financing strategy for 2019 best responds to Government’s intention to diversify the
investor base and currency structure. The strategy also seeks to continue the on-going
liability management programme to manage the risks embedded in the public debt portfolio
and develop the domestic debt market.
114. As part of the strategy, Government will explore the possibility of issuing new financing
instruments such as Century bond, Green bond, Samurai bond and Panda bond, among
many others, to diversify the investor base.
115. The strategy envisages the continuous issuance of medium-term bonds (especially 5-year
bonds) and longer-dated bonds (7-year, 10-year & 15-year bonds) in the domestic market
over the strategy period. The strategy assumes a sovereign bond issue of up to US$3.0
billion on the ICM, with proceeds of about US$2.0 billion to fund the budget and US$1.0
billion to be used for liability management. The strategy also envisions the issuance of
domestic debt against possible contingent liabilities that may arise in 2019.
116. The strategic risk benchmarks set out in the 2019-2022 MTDS are aimed at monitoring and,
ultimately, reducing foreign currency risk, interest rate risk, and refinancing risk embedded
in the public debt portfolio. For the external debt portfolio, a benchmark of 70 percent (±5%)
exposures to the USD will be pursued.
117. The management of refinancing risk will be pursued to avoid bunching of debt service
obligations and/or rollover risks, which may lead to liquidity crisis and/or excessive increase
in the cost of debt servicing. Over the medium-term, the share of floating rate debt in total
external debt is expected to be within a range of 15-20 percent, while the share of the entire
public debt portfolio facing interest rate resetting in a year is not expected to be more than
30 percent. The ATM of the total public debt portfolio is expected not to be less than 7.8
years.

The 2018 Annual Public Debt Report
53
Section Ten: Public Debt Management Reforms and
Initiatives
Partial Securitisation of Mineral Royalties
118. The 2018 Budget Statement and Economic Policy stated Government’s plan to adopt a
policy for leveraging the future proceeds from mineral royalties to support current
developmental needs. This was to be accomplished through an up-front payment
instrument.
119. In line with this policy, the Minerals Income Investment Fund (MIIF) Act, 2018 (Act 978),
which seeks to establish the Ghana Minerals Investment Income Fund, was passed by
Parliament in September 2018. The objective of the Fund is to hold and manage the equity
interests of the Government in mining companies, receive mineral royalties and rents due
to Government, and manage and invest the assets of the Fund. Accordingly, the Fund can
raise resources by way of an Initial Public Offering (IPO) and listing on the Ghana Stock
Exchange, and any other stock exchange market.
120. The MoF, on behalf of Government, is still in the process of establishing the Fund. An inter-
ministerial committee, made up of stakeholder government institutions and led by MoF, has
been set up to see to the establishment of the Fund.
Liability Management Operations
121. Government will continue the currently on-going liability management and debt re-profiling
programme, which has so far contributed to improving the debt mix and lowered domestic
interest payments to help manage the risks embedded in the debt portfolio.
122. To mitigate the forex risk associated with bond redemptions, which arises from high
exposures to foreign currency, buybacks will be conducted to smoothen both the redemption
profile and any associated forex risk from the repatriation of offshore flows. Government will
undertake bond exchanges and buyback operations to manage roll-over and refinancing risk
by consolidating the large number of outstanding securities into fewer and more liquid lines.
123. Government will also continue its benchmark policy to re-open existing bonds to create large
sized benchmarks to increase market liquidity and facilitate more efficient market making.
Re-opens will, however, be executed prudently at key maturities, preferably of not less than
one year, to avoid increasing roll-over risk at maturity. Building sufficient cash buffers to
support debt management operations will also be a key goal of Government over the
medium-term.
Primary Dealer System
124. To enhance efforts to develop the primary and secondary domestic markets, and facilitate
a more efficient PD system, Government will embark on reforms to the current primary
dealer structure to enhance its effectiveness. These include, but are not limited to the
following:

The 2018 Annual Public Debt Report
54
revising the documentation to ensure PD obligations and privileges are well-balanced,
feasible and enforceable;
stronger oversight of PD support of the secondary market, including disciplinary
measures for non-performance; and
replacing Joint Book Runners (JBRs) with a Bond Market Specialist group under much
stricter rules, requirements, and obligations with regards to marketing, selling,
distributing, and trading in Government bonds.
125. These reforms will help to reveal current inconsistencies between PD rights and obligations
and incentivize those who really want to put more effort into domestic market development.
Secondary Market
126. To promote price discovery, Government will introduce classic repos to hedge risk of
unwanted exposures to reduce volatility in the secondary market.
127. To support the market and prevent squeezes in the price of sought-after bonds, Government
will introduce an official Repo facility. The terms and conditions of the facility will specify
maximum amounts and length of the repos as well as fees to be charged for providing such
a service.
Communication with Market Participants
128. Government will continue to actively engage investors and market participants through
monthly and quarterly town hall meetings, conference calls, and investor presentations with
PDs and key market players. The meetings will focus on market developments, financing
plans, financing operations and investor views, as well as performance of the PD system.
Regular meetings will also be held with pension fund managers and insurance companies,
as well as regulators of the financial sector, such as BoG, SEC, NPRA and NIC.
129. Government will also embark of periodic domestic roadshows to strengthen the investor
base and allow local investors to build their domestic market presence. In addition, all
notices and data related to Government securities will be made available on the Ministry’s
website and updated regularly to improve communication with market players, and ensure
ease of access to vital information.
Credit Risk Policy
130. To minimize the occurrence and impact of contingent liabilities, Government intends to
extend the credit risk assessment to cover financial institutions. Accordingly, credit risk
guidelines covering the financial sector will be developed and published to facilitate effective
risk management and to identify, measure, monitor, and mitigate risk emanating from the
financial institutions.
National Borrowing Guidelines
131. As stated in the 2018 Budget Statement and Economic Policy, National Borrowing
Guidelines have been prepared and stakeholder consultations are on-going. The guidelines,

The 2018 Annual Public Debt Report
55
when finalised, will regulate acquisition of loans by Ministries, Departments and Agencies,
Local Authorities and SOEs.
Limits on Commercial Borrowing
132. As part of Government efforts to bring debt to sustainable levels, Government intends to
place annual ceilings on contracting or guaranteeing of non-concessional external debt for
projects for which concessional financing is not available.
Annual Borrowing Plan
133. To effectively implement the debt management strategy in 2019, Government will prepare
and publish an Annual Borrowing Plan (ABP) based on the approved MTDS to inform
investors, in line with Section 60 of the PFM Act.
Global Depository Notes
134. For continued market access, and in the view of recent risk-off sentiments in EM credit
markets, it is comforting to note that Ghana has parliamentary approval to also consider
issuing Cedi-denominated Global Depositary Notes (GDNs) listed offshore.
135. The relevant operational protocols required to facilitate the issuance and cancellation of
GDNs is now in place. In December 2018, CSD obtained the necessary approvals from the
Securities and Exchange Commission (SEC) for the operationalisation of the free-of-
payment transfers which is central to GDN concept.

The 2018 Annual Public Debt Report
56
Section Eleven: Conclusion
136. On account of Government’s sound macroeconomic policies implemented during the year
under review, Ghana recorded an improved primary surplus of 1.4 percent of GDP at the
end of 2018. Furthermore, the trade balance, for the second consecutive time, recorded a
surplus equivalent to 2.7 percent of GDP.
137. Government’s implementation of the debt management strategy was in line with the
objectives of lengthening the maturity profile, diversifying the investor base and building a
resilient financial sector to facilitate economic growth.
138. In line with the strategy was the issuance of a landmark Eurobond, amidst some turbulence
on the global scene. Government successfully issued US$2,000.0 million in May 2018,
consisting of US$1,000.0 million each of 10-year and 30-year instruments. The 10-year and
30-year bonds were priced at 7.625 percent and 8.625 percent, respectively
139. In addition to the above achievements was the significant increase in the average time to
maturity of the total public debt portfolio from 8.2 percent in 2017 to 8.7 years in 2018, as a
result of the issuance of more medium-term and long-term instruments, thus reducing the
refinancing risk in the debt portfolio. Government also successfully carried out a cash tender,
which reduced the outstanding stock on the 2022 Eurobond from US$750.0 million to
US$48.0 million.
140. Despite these achievements, some challenges and risk factors remain within the public debt
portfolio which require attention. Among other things, this includes the need to broaden the
investor base domestically to minimise the current dominant presence of foreign investors
by actively engaging local investors. This is expected to minimize the effect of foreign
investors pulling out of the domestic debt market on the stability of the secondary market
and the entire macroeconomic framework.
141. There is also the need to improve the coordination roles among key institutions whose
actions, in one way or the other, affect public debt management. The need for accurate and
reliable data, especially on the full obligations of Government’s on-lent facilities and
guarantees must be improved. The accuracy of such information will enable Government to
correctly and adequately forecast possible implicit liabilities arising from actions outside the
control of Government.
142. In addition, in view of the high rate of default in debt servicing by SOEs, there is the need to
tighten approval mechanisms to ensure that only the most bankable projects are considered
for guarantees and on-lending facilities. This includes ensuring that credit risk assessments
are conducted on beneficiary entities before approval is granted. The Ministry shall also
enforce Sections 66(8) and 67(7) of the PFM Act and take necessary actions to ensure that
entities comply with the terms and conditions of the agreements and honour their debt
service obligations to Government.
The 2018 Annual Public Debt Report
57
143. It is also noteworthy that the Annual Public Debt Report has, for the past three years, served
as a critical document of Government that seeks to improve communication and
transparency in the annual reporting of public debt operations. This report is a demonstration
of Government’s commitment to ensuring that citizens’ participation in the governance
process, by way of information sharing, is not impeded.
144. MoF has always strived to ensure that the quality of the Annual Public Debt Report improves
over time, while expanding the coverage to incorporate relevant debt issues that must be
reported on under the PFM Law. Stakeholder engagements leading to the production of the
report have also improved and are reflected in the quality of this year’s edition.

The 2018 Annual Public Debt Report
58
Glossary
Amortisation Repayments of principal on a loan, excluding interest payments.
Average Time to Maturity The average time to maturity measures the weighted average time to
maturity of all the principal payments in the portfolio.
Bilateral Debt Debt contracted from sovereign countries.
Bonds Debt securities that give holders unconditional right to fixed income or
contractually determined payments on a specified date or dates.
Buy-back The repurchase by a debtor government of all or a portion of its
external debt at a discount on face value.
Commercial Debt Short-term borrowing from banking institutions other than Official
Development Assistance (ODA).
Concessional loans Loans that are extended on terms substantially generous than loans
contracted on the open market.
Contingent Liability Obligations that do not arise unless a particular, discrete event(s)
occurs in the future.
Coupon The annual interest rate paid on a bond, expressed as a percentage
of the face value.
Credit Rating A rating based on an assessment of the credit worthiness of the
borrower. Credit ratings of Government are done by credit rating
agencies such as Standard and Poor’s (S&P), Moody’s or Fitch.
Credit Risk Credit risk refers to the risk that a borrower may not repay a loan and
that the lender may lose the principal of the loan or the interest
associated with it.
Debt Relief Any form of debt reorganization that reduces the overall burden of
debt.
Debt Re-profiling A relatively light form of sovereign debt restructuring in which the tenor
of a government’s liabilities is extended in maturity, but coupons and
principal are not affected.
Debt Service Debt payments in respect of both principal and interest.
Debt-to-GDP Ratio of a country’s gross public debt (in nominal terms) to a country’s
gross domestic product (also in nominal terms).
The 2018 Annual Public Debt Report
59
Disbursed Outstanding Debt The amount, at any given time disbursed and outstanding less
principal repayments.
Disbursement The transfer of the committed loan amount from the lender to the
borrower, once contractual conditions are fulfilled.
Dollar-Denominated Bond A bond issued in USD outside the United States.
Domestic Debt Debt issued on the domestic capital market.
Escrow Account Account into which proceeds are lodged to pay off future debt service.
ESLA The Energy Sector Levy Act, 2015 (Act 899) is an Act to consolidate
existing energy sector levies to promote prudent and efficient
utilization of the proceeds generated from the levies, impose a price
stabilisation and recoveries levy, facilitate sustainable long-term
investments in the energy sector and to provide for related matters.
E.S.L.A. Plc A Special Purpose Vehicle (SPV), incorporated as a public limited
liability company, to issue long-term bonds to resolve energy sector
debts due banks and trade creditors.
Eurobond Bond issued by a borrower in a foreign country, denominated in a
Eurocurrency (e.g. US Dollar, Canadian Dollar, Yen, Euro), under-
written and sold by an international syndicate of financial institutions.
External Debt Debt issued to foreigners outside the domestic capital market.
Fiscal Responsibility Act The Fiscal Responsibility Act, 2018 (Act 982) is an Act to provide for
fiscal responsibility rules to ensure macroeconomic stability and debt
sustainability.
Global Depository Note Emulate terms of a particular local currency-dominated bond;
however, they trade, settle and pay interest and principal in US Dollars.
Gross Domestic Financing New debt issuance required to partly fund the budget deficit from
domestic sources, including maturities.
Gross Domestic Product The market value of all final goods and services produced within a
country in a given period. The GDP is determined using data for
production, expenditures, or income and is presented in current or
constant prices.
Gross Public Debt The cumulative aggregate of the net of all government borrowings
(drawdowns) less principal repayments, and denominated in a single
reporting currency as of the end of a reporting period.

The 2018 Annual Public Debt Report
60
Guarantee An undertaking to answer for the payment of another person's debt or
obligation in the event of a default by the person primarily responsible
for it.
Initial Public Offering The process of offering shares in a private co-operation to the public
for the first time.
Interest Payment The amount paid periodically over a period to a lender as
compensation for use of capital.
Interest Rate The cost or price of borrowing, or the gain from lending, normally
expressed as an annual percentage amount.
International Capital Market Financial markets for selling and buying of long-term debt or equity-
backed securities.
Maturity The remaining time until the expiration or the repayment of the
instrument.
MIIF Act Minerals Income Investment Fund (MIIF) Act, 2018 (Act 978) is an Act
to establish a Fund to manage the equity interests of the Republic in
mining companies, to receive mineral royalties and other related
income due the Republic from mining operations, to provide for the
management and investment of the assets of the Fund and for related
matters.
Monetary Police Rate The rate at which Ghana’s Central Bank lends to commercial banks.
MTDS A debt management strategy planned to be implemented over the
medium-term (usually three to five years) in order to achieve a
composition of a desired debt portfolio with regards to the cost-risk
trade-off.
Multilateral Debt Debt contracted from multilateral financial institutions such as World
Bank, IMF and development banks.
Net Borrowing The difference between Issuance and Redemption.
Net Domestic Financing New debt issuance required to partly fund the budget deficit from
domestic sources less maturities.
Net Public Debt Gross public debt less the assets of Government
On-lending Government borrowed funds lent to SOEs and other institutions.
Government would generally do this as a measure to promote strategic
policy implementation.
The 2018 Annual Public Debt Report
61
PFM Act The Public Financial Management Act, 2016 (Act 921) is an Act to
regulate the financial management of the public sector within a
macroeconomic and fiscal framework; and to define responsibilities of
persons entrusted with the management and control of public funds,
assets, liabilities and resources.
Primary Dealer A firm that buys Government securities directly from the Government
with the intention of re-selling them to others.
Principal Repayment Payment made towards reducing disbursed outstanding debt.
Public Debt Total debt obligations of Government and guarantees extended to
public sector companies, institutions and agencies.
Publicly Guaranteed Debt Debt liabilities of public and private entities, the servicing of which is
contractually guaranteed by Government.
Refinancing Risk The risk associated with a borrower not being able to borrow to repay
existing debt.
Roll Over The extension or transfer of debt from one period to the next.
Secondary Market A market where previously issued financial instruments such as bonds
are bought and sold; a market that investors sell to other investors.
Special Purpose Vehicle A subsidiary company with an asset or liability structure and legal
status that makes its obligations secure even if the parent company
goes bankrupt.
Short-Term Debt Outstanding debt with a maturity of less than one year.
Sinking Fund A fund created by a borrower for the purpose of settling debt
obligations.
State-Owned Enterprise A legal entity partially or wholly owned by Government in order to
conduct business on or on behalf of Government.
Yield The return on an investment or interest received from holding a
particular security. The yield is usually expressed as an annual
percentage rate based on the investment's cost, current market value
or face value.
Yield Curve A graph that shows the mathematical relationship between yield and
maturity computed across all government securities (or other
securities).

The 2018 Annual Public Debt Report
62
Appendices
Appendix 1A: Gross Public Debt (in millions of GH¢), 2014 – 2018
S/N Item 2014 2015 2016 2017 2018
Gross Public Debt
1 External Debt 44,530.0 59,912.8 68,859.6 75,847.5 86,169.0
2 Domestic Debt 35,040.2 40,322.1 53,403.4 66,769.1 86,899.7
3 Total Public Debt 79,570.2 100,234.9 122,263.0 142,616.6 173,068.7
External Debt Stock
4 Multilateral 15,731.8 20,422.0 23,208.2 28,427.7 30,817.4
5 Bilateral 7,339.1 8,627.5 10,255.9 11,800.2 11,768.4
6 Commercial 21,459.1 30,863.3 35,395.5 35,619.7 43,583.3
7 Total External Debt 44,530.0 59,912.8 68,859.6 75,847.5 86,169.0
Domestic Debt Stock
8 A. Marketable Debt 24,535.8 29,103.5 38,667.5 52,606.6 63,752.7
9 Short-Term Instruments 13,686.1 18,244.1 20,105.2 11,996.8 11,031.9
10 91-Day Treasury Bill 7,939.4 9,317.9 10,477.6 5,444.7 5,576.6
11 182-Day Treasury Bill 4,493.4 8,149.6 7,112.4 2,867.0 3,049.8
12 1-Year Treasury Note 1,253.3 776.6 2,515.3 3,685.2 2,405.5
13 Medium-Term Instruments 10,849.7 10,859.4 18,562.3 35,816.0 47,927.0
14 2-Year Fixed Treasury Note 2,746.2 2,086.3 4,227.0 6,400.6 13,049.8
15 2-Year USD Domestic Bond - - 395.9 418.0 -
16 3-Year USD Domestic Bond - - - 977.8 1,067.7
17 3-Year Floating Treasury Note 202.5 - - - -
18 3-Year Fixed Rate Bond 4,909.0 5,062.8 6,658.6 7,255.5 10,930.3
19 5-Year GoG Bond 2,790.2 3,508.6 6,480.0 11,204.0 12,160.7
20 7-Year GoG Bond 201.7 201.7 201.7 2,150.5 2,857.4
21 10-Year GoG Bond - - 599.0 7,409.6 7,861.2
22 Long-Term Instruments - - - 4,793.8 4,793.8
23 15-Year GoG Bond - - - 4,793.8 4,793.8
24 B. Non-Marketable Debt 9,932.7 10,798.8 14,247.9 13,934.6 23,022.3
25 3-Year Stock (SBG) - - - - -
26 3-Year Stock (SSNIT) 1,281.8 1,073.6 1,137.0 881.8 502.9
27 Long-Term Govt Stock 7,417.4 8,491.6 11,987.4 11,987.4 11,987.4
28 Long-Term Govt Stock (Bank Bailout) - - - - 9,581.2
29 GoG Petroleum Financed Bonds 80.0 80.0 80.0 80.0 80.0
30 TOR Bonds 682.0 682.0 572.0 514.8 400.4
31 NPRA Stock - - - - -
32 Revaluation Stock 361.1 361.1 361.1 361.1 361.1
33 Other Government Stock 1.0 1.0 1.0 - -
34 Telekom Malaysia Stocks 109.5 109.5 109.5 109.5 109.5
35 C. Standard Loans 571.7 419.9 488.0 227.9 124.7
36 Total Domestic Debt (A+B+C) 35,040.2 40,322.1 53,403.4 66,769.1 86,899.7
Holders of Domestic
37 A. Banking System 18,386.9 20,354.6 27,834.4 23,619.3 39,192.1
38 Bank of Ghana 8,496.7 9,925.4 13,056.2 13,002.6 13,933.3
39 Deposit Money Banks 9,890.2 10,429.1 14,778.2 10,616.7 25,258.8
40 B. Non-Bank Sector 10,106.9 12,830.3 13,486.6 17,256.2 21,506.8
41 SSNIT 1,563.3 1,502.6 1,463.4 1,402.6 795.6
42 Insurance Companies 63.3 80.9 179.0 340.5 462.4
43 Other Holders 8,480.3 11,246.8 11,844.1 15,513.2 20,248.8
44 C. Foreign Sector 5,974.7 6,717.4 11,594.4 25,665.6 26,076.2
45 D. Other Standard Loans 571.7 419.9 488.0 227.9 124.7
46 Total (A+B+C+D) 35,040.2 40,322.1 53,403.4 66,769.1 86,899.7
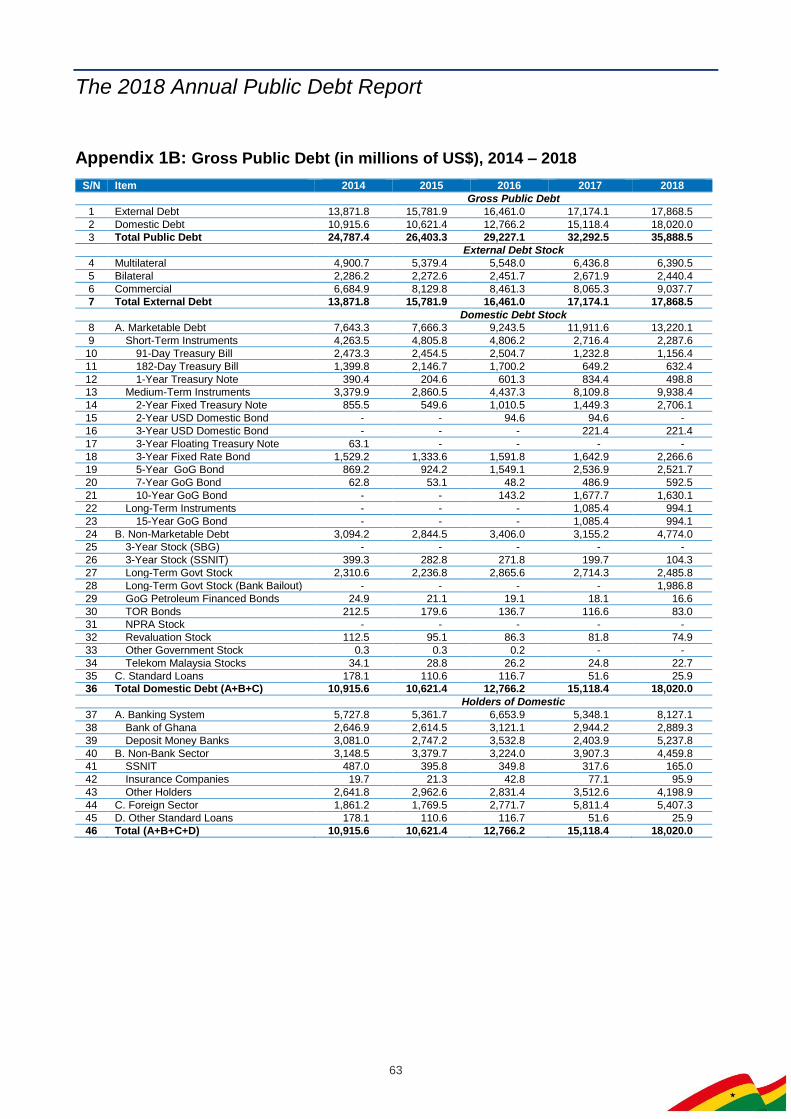
The 2018 Annual Public Debt Report
63
Appendix 1B: Gross Public Debt (in millions of US$), 2014 – 2018
S/N Item 2014 2015 2016 2017 2018
Gross Public Debt
1 External Debt 13,871.8 15,781.9 16,461.0 17,174.1 17,868.5
2 Domestic Debt 10,915.6 10,621.4 12,766.2 15,118.4 18,020.0
3 Total Public Debt 24,787.4 26,403.3 29,227.1 32,292.5 35,888.5
External Debt Stock
4 Multilateral 4,900.7 5,379.4 5,548.0 6,436.8 6,390.5
5 Bilateral 2,286.2 2,272.6 2,451.7 2,671.9 2,440.4
6 Commercial 6,684.9 8,129.8 8,461.3 8,065.3 9,037.7
7 Total External Debt 13,871.8 15,781.9 16,461.0 17,174.1 17,868.5
Domestic Debt Stock
8 A. Marketable Debt 7,643.3 7,666.3 9,243.5 11,911.6 13,220.1
9 Short-Term Instruments 4,263.5 4,805.8 4,806.2 2,716.4 2,287.6
10 91-Day Treasury Bill 2,473.3 2,454.5 2,504.7 1,232.8 1,156.4
11 182-Day Treasury Bill 1,399.8 2,146.7 1,700.2 649.2 632.4
12 1-Year Treasury Note 390.4 204.6 601.3 834.4 498.8
13 Medium-Term Instruments 3,379.9 2,860.5 4,437.3 8,109.8 9,938.4
14 2-Year Fixed Treasury Note 855.5 549.6 1,010.5 1,449.3 2,706.1
15 2-Year USD Domestic Bond - - 94.6 94.6 -
16 3-Year USD Domestic Bond - - - 221.4 221.4
17 3-Year Floating Treasury Note 63.1 - - - -
18 3-Year Fixed Rate Bond 1,529.2 1,333.6 1,591.8 1,642.9 2,266.6
19 5-Year GoG Bond 869.2 924.2 1,549.1 2,536.9 2,521.7
20 7-Year GoG Bond 62.8 53.1 48.2 486.9 592.5
21 10-Year GoG Bond - - 143.2 1,677.7 1,630.1
22 Long-Term Instruments - - - 1,085.4 994.1
23 15-Year GoG Bond - - - 1,085.4 994.1
24 B. Non-Marketable Debt 3,094.2 2,844.5 3,406.0 3,155.2 4,774.0
25 3-Year Stock (SBG) - - - - -
26 3-Year Stock (SSNIT) 399.3 282.8 271.8 199.7 104.3
27 Long-Term Govt Stock 2,310.6 2,236.8 2,865.6 2,714.3 2,485.8
28 Long-Term Govt Stock (Bank Bailout) - - - - 1,986.8
29 GoG Petroleum Financed Bonds 24.9 21.1 19.1 18.1 16.6
30 TOR Bonds 212.5 179.6 136.7 116.6 83.0
31 NPRA Stock - - - - -
32 Revaluation Stock 112.5 95.1 86.3 81.8 74.9
33 Other Government Stock 0.3 0.3 0.2 - -
34 Telekom Malaysia Stocks 34.1 28.8 26.2 24.8 22.7
35 C. Standard Loans 178.1 110.6 116.7 51.6 25.9
36 Total Domestic Debt (A+B+C) 10,915.6 10,621.4 12,766.2 15,118.4 18,020.0
Holders of Domestic
37 A. Banking System 5,727.8 5,361.7 6,653.9 5,348.1 8,127.1
38 Bank of Ghana 2,646.9 2,614.5 3,121.1 2,944.2 2,889.3
39 Deposit Money Banks 3,081.0 2,747.2 3,532.8 2,403.9 5,237.8
40 B. Non-Bank Sector 3,148.5 3,379.7 3,224.0 3,907.3 4,459.8
41 SSNIT 487.0 395.8 349.8 317.6 165.0
42 Insurance Companies 19.7 21.3 42.8 77.1 95.9
43 Other Holders 2,641.8 2,962.6 2,831.4 3,512.6 4,198.9
44 C. Foreign Sector 1,861.2 1,769.5 2,771.7 5,811.4 5,407.3
45 D. Other Standard Loans 178.1 110.6 116.7 51.6 25.9
46 Total (A+B+C+D) 10,915.6 10,621.4 12,766.2 15,118.4 18,020.0

The 2018 Annual Public Debt Report
64
Appendix 2: Debt-to-GDP Ratios (based on Old and New GDP Series), 2014 – 2018
2014 2015 2016 2017 2018
New GDP Series ( %)
Gross External Debt/GDP 28.6 33.2 32.0 29.6 28.8
Gross Domestic Debt/GDP 22.5 22.4 24.8 26.0 29.1
Gross Public Debt/GDP 51.2 55.6 56.8 55.6 57.9
Old GDP Series (%)
Gross External Debt/GDP 39.3 43.7 41.1 36.8 35.6
Gross Domestic Debt/GDP 30.9 29.4 31.9 32.4 36.0
Gross Public Debt/GDP 70.2 73.2 73.1 69.3 71.6
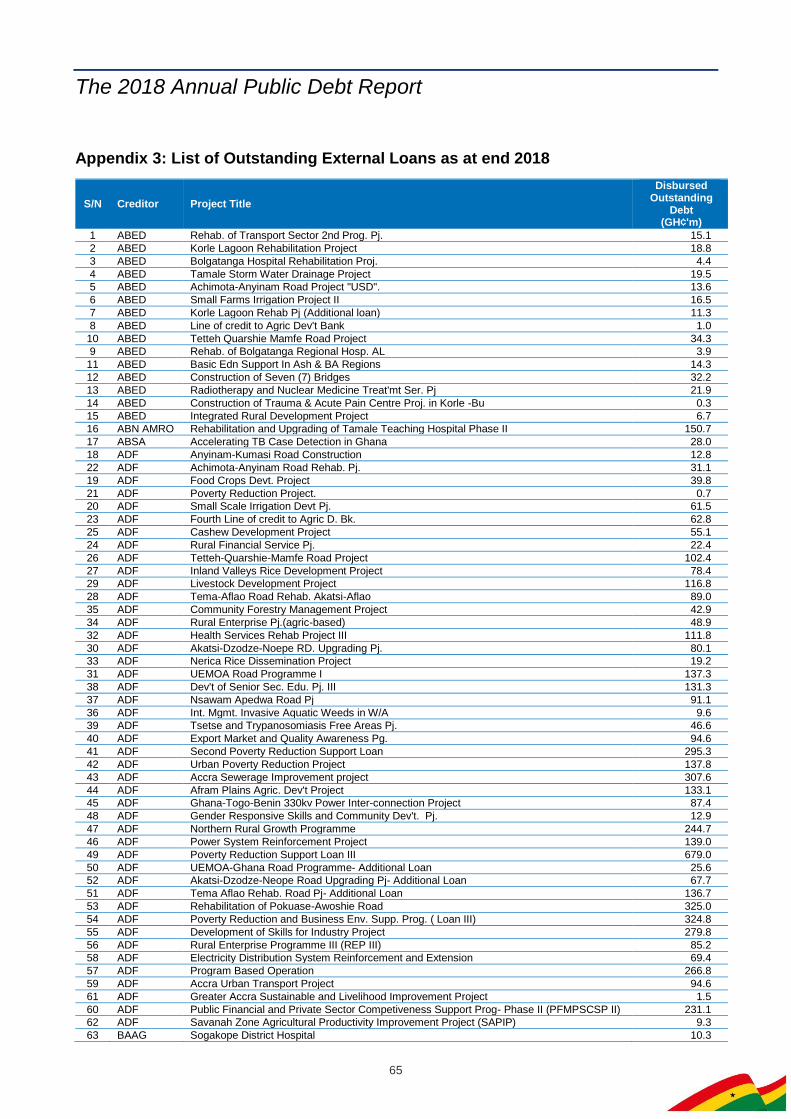
The 2018 Annual Public Debt Report
65
Appendix 3: List of Outstanding External Loans as at end 2018
S/N Creditor Project Title
Disbursed Outstanding
Debt (GH¢'m)
1 ABED Rehab. of Transport Sector 2nd Prog. Pj. 15.1
2 ABED Korle Lagoon Rehabilitation Project 18.8
3 ABED Bolgatanga Hospital Rehabilitation Proj. 4.4
4 ABED Tamale Storm Water Drainage Project 19.5
5 ABED Achimota-Anyinam Road Project "USD". 13.6
6 ABED Small Farms Irrigation Project II 16.5
7 ABED Korle Lagoon Rehab Pj (Additional loan) 11.3
8 ABED Line of credit to Agric Dev't Bank 1.0
10 ABED Tetteh Quarshie Mamfe Road Project 34.3
9 ABED Rehab. of Bolgatanga Regional Hosp. AL 3.9
11 ABED Basic Edn Support In Ash & BA Regions 14.3
12 ABED Construction of Seven (7) Bridges 32.2
13 ABED Radiotherapy and Nuclear Medicine Treat'mt Ser. Pj 21.9
14 ABED Construction of Trauma & Acute Pain Centre Proj. in Korle -Bu 0.3
15 ABED Integrated Rural Development Project 6.7
16 ABN AMRO Rehabilitation and Upgrading of Tamale Teaching Hospital Phase II 150.7
17 ABSA Accelerating TB Case Detection in Ghana 28.0
18 ADF Anyinam-Kumasi Road Construction 12.8
22 ADF Achimota-Anyinam Road Rehab. Pj. 31.1
19 ADF Food Crops Devt. Project 39.8
21 ADF Poverty Reduction Project. 0.7
20 ADF Small Scale Irrigation Devt Pj. 61.5
23 ADF Fourth Line of credit to Agric D. Bk. 62.8
25 ADF Cashew Development Project 55.1
24 ADF Rural Financial Service Pj. 22.4
26 ADF Tetteh-Quarshie-Mamfe Road Project 102.4
27 ADF Inland Valleys Rice Development Project 78.4
29 ADF Livestock Development Project 116.8
28 ADF Tema-Aflao Road Rehab. Akatsi-Aflao 89.0
35 ADF Community Forestry Management Project 42.9
34 ADF Rural Enterprise Pj.(agric-based) 48.9
32 ADF Health Services Rehab Project III 111.8
30 ADF Akatsi-Dzodze-Noepe RD. Upgrading Pj. 80.1
33 ADF Nerica Rice Dissemination Project 19.2
31 ADF UEMOA Road Programme I 137.3
38 ADF Dev't of Senior Sec. Edu. Pj. III 131.3
37 ADF Nsawam Apedwa Road Pj 91.1
36 ADF Int. Mgmt. Invasive Aquatic Weeds in W/A 9.6
39 ADF Tsetse and Trypanosomiasis Free Areas Pj. 46.6
40 ADF Export Market and Quality Awareness Pg. 94.6
41 ADF Second Poverty Reduction Support Loan 295.3
42 ADF Urban Poverty Reduction Project 137.8
43 ADF Accra Sewerage Improvement project 307.6
44 ADF Afram Plains Agric. Dev't Project 133.1
45 ADF Ghana-Togo-Benin 330kv Power Inter-connection Project 87.4
48 ADF Gender Responsive Skills and Community Dev't. Pj. 12.9
47 ADF Northern Rural Growth Programme 244.7
46 ADF Power System Reinforcement Project 139.0
49 ADF Poverty Reduction Support Loan III 679.0
50 ADF UEMOA-Ghana Road Programme- Additional Loan 25.6
52 ADF Akatsi-Dzodze-Neope Road Upgrading Pj- Additional Loan 67.7
51 ADF Tema Aflao Rehab. Road Pj- Additional Loan 136.7
53 ADF Rehabilitation of Pokuase-Awoshie Road 325.0
54 ADF Poverty Reduction and Business Env. Supp. Prog. ( Loan III) 324.8
55 ADF Development of Skills for Industry Project 279.8
56 ADF Rural Enterprise Programme III (REP III) 85.2
58 ADF Electricity Distribution System Reinforcement and Extension 69.4
57 ADF Program Based Operation 266.8
59 ADF Accra Urban Transport Project 94.6
61 ADF Greater Accra Sustainable and Livelihood Improvement Project 1.5
60 ADF Public Financial and Private Sector Competiveness Support Prog- Phase II (PFMPSCSP II) 231.1
62 ADF Savanah Zone Agricultural Productivity Improvement Project (SAPIP) 9.3
63 BAAG Sogakope District Hospital 10.3
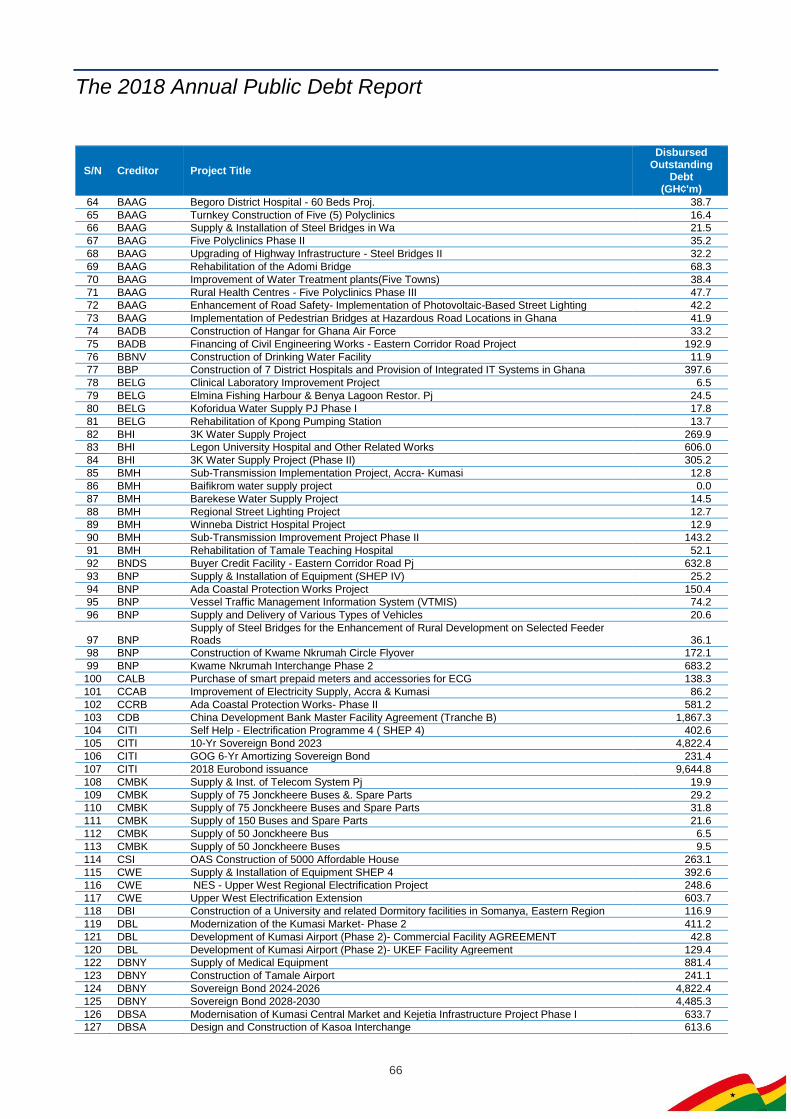
The 2018 Annual Public Debt Report
66
S/N Creditor Project Title
Disbursed Outstanding
Debt (GH¢'m)
64 BAAG Begoro District Hospital - 60 Beds Proj. 38.7
65 BAAG Turnkey Construction of Five (5) Polyclinics 16.4
66 BAAG Supply & Installation of Steel Bridges in Wa 21.5
67 BAAG Five Polyclinics Phase II 35.2
68 BAAG Upgrading of Highway Infrastructure - Steel Bridges II 32.2
69 BAAG Rehabilitation of the Adomi Bridge 68.3
70 BAAG Improvement of Water Treatment plants(Five Towns) 38.4
71 BAAG Rural Health Centres - Five Polyclinics Phase III 47.7
72 BAAG Enhancement of Road Safety- Implementation of Photovoltaic-Based Street Lighting 42.2
73 BAAG Implementation of Pedestrian Bridges at Hazardous Road Locations in Ghana 41.9
74 BADB Construction of Hangar for Ghana Air Force 33.2
75 BADB Financing of Civil Engineering Works - Eastern Corridor Road Project 192.9
76 BBNV Construction of Drinking Water Facility 11.9
77 BBP Construction of 7 District Hospitals and Provision of Integrated IT Systems in Ghana 397.6
78 BELG Clinical Laboratory Improvement Project 6.5
79 BELG Elmina Fishing Harbour & Benya Lagoon Restor. Pj 24.5
80 BELG Koforidua Water Supply PJ Phase I 17.8
81 BELG Rehabilitation of Kpong Pumping Station 13.7
82 BHI 3K Water Supply Project 269.9
83 BHI Legon University Hospital and Other Related Works 606.0
84 BHI 3K Water Supply Project (Phase II) 305.2
85 BMH Sub-Transmission Implementation Project, Accra- Kumasi 12.8
86 BMH Baifikrom water supply project 0.0
87 BMH Barekese Water Supply Project 14.5
88 BMH Regional Street Lighting Project 12.7
89 BMH Winneba District Hospital Project 12.9
90 BMH Sub-Transmission Improvement Project Phase II 143.2
91 BMH Rehabilitation of Tamale Teaching Hospital 52.1
92 BNDS Buyer Credit Facility - Eastern Corridor Road Pj 632.8
93 BNP Supply & Installation of Equipment (SHEP IV) 25.2
94 BNP Ada Coastal Protection Works Project 150.4
95 BNP Vessel Traffic Management Information System (VTMIS) 74.2
96 BNP Supply and Delivery of Various Types of Vehicles 20.6
97 BNP Supply of Steel Bridges for the Enhancement of Rural Development on Selected Feeder Roads 36.1
98 BNP Construction of Kwame Nkrumah Circle Flyover 172.1
99 BNP Kwame Nkrumah Interchange Phase 2 683.2
100 CALB Purchase of smart prepaid meters and accessories for ECG 138.3
101 CCAB Improvement of Electricity Supply, Accra & Kumasi 86.2
102 CCRB Ada Coastal Protection Works- Phase II 581.2
103 CDB China Development Bank Master Facility Agreement (Tranche B) 1,867.3
104 CITI Self Help - Electrification Programme 4 ( SHEP 4) 402.6
105 CITI 10-Yr Sovereign Bond 2023 4,822.4
106 CITI GOG 6-Yr Amortizing Sovereign Bond 231.4
107 CITI 2018 Eurobond issuance 9,644.8
108 CMBK Supply & Inst. of Telecom System Pj 19.9
109 CMBK Supply of 75 Jonckheere Buses &. Spare Parts 29.2
110 CMBK Supply of 75 Jonckheere Buses and Spare Parts 31.8
111 CMBK Supply of 150 Buses and Spare Parts 21.6
112 CMBK Supply of 50 Jonckheere Bus 6.5
113 CMBK Supply of 50 Jonckheere Buses 9.5
114 CSI OAS Construction of 5000 Affordable House 263.1
115 CWE Supply & Installation of Equipment SHEP 4 392.6
116 CWE NES - Upper West Regional Electrification Project 248.6
117 CWE Upper West Electrification Extension 603.7
118 DBI Construction of a University and related Dormitory facilities in Somanya, Eastern Region 116.9
119 DBL Modernization of the Kumasi Market- Phase 2 411.2
121 DBL Development of Kumasi Airport (Phase 2)- Commercial Facility AGREEMENT 42.8
120 DBL Development of Kumasi Airport (Phase 2)- UKEF Facility Agreement 129.4
122 DBNY Supply of Medical Equipment 881.4
123 DBNY Construction of Tamale Airport 241.1
124 DBNY Sovereign Bond 2024-2026 4,822.4
125 DBNY Sovereign Bond 2028-2030 4,485.3
126 DBSA Modernisation of Kumasi Central Market and Kejetia Infrastructure Project Phase I 633.7
127 DBSA Design and Construction of Kasoa Interchange 613.6
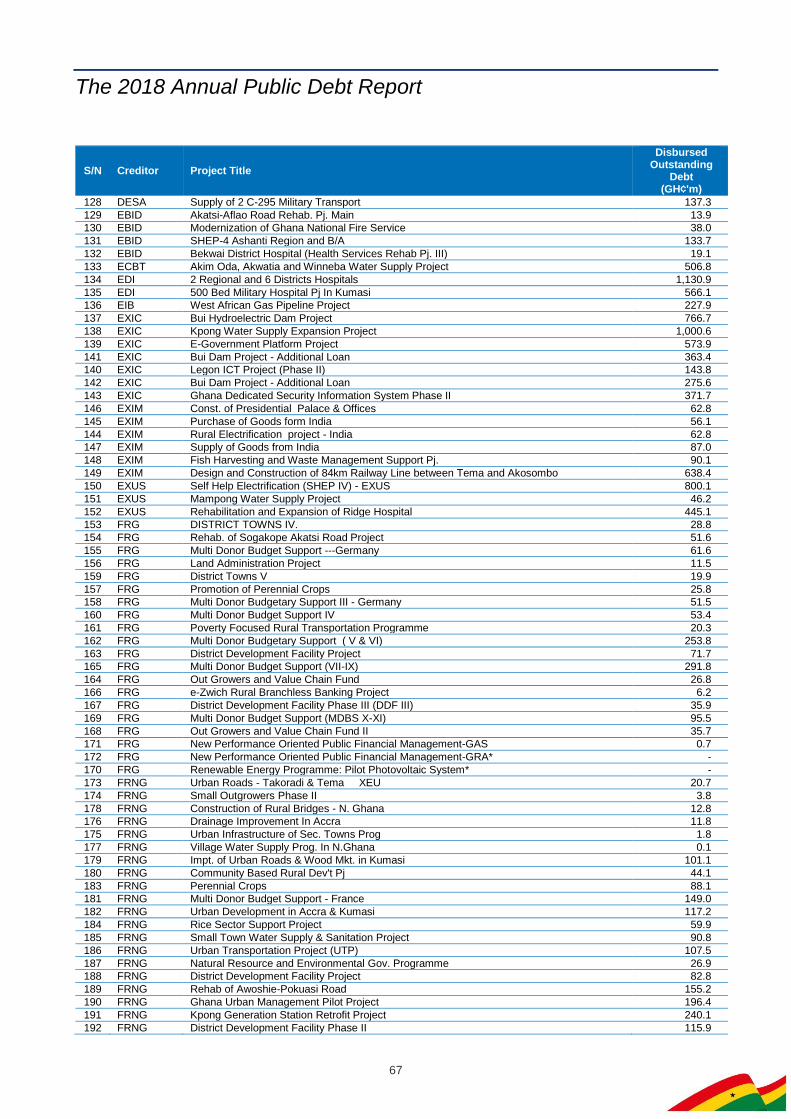
The 2018 Annual Public Debt Report
67
S/N Creditor Project Title
Disbursed Outstanding
Debt (GH¢'m)
128 DESA Supply of 2 C-295 Military Transport 137.3
129 EBID Akatsi-Aflao Road Rehab. Pj. Main 13.9
130 EBID Modernization of Ghana National Fire Service 38.0
131 EBID SHEP-4 Ashanti Region and B/A 133.7
132 EBID Bekwai District Hospital (Health Services Rehab Pj. III) 19.1
133 ECBT Akim Oda, Akwatia and Winneba Water Supply Project 506.8
134 EDI 2 Regional and 6 Districts Hospitals 1,130.9
135 EDI 500 Bed Military Hospital Pj In Kumasi 566.1
136 EIB West African Gas Pipeline Project 227.9
137 EXIC Bui Hydroelectric Dam Project 766.7
138 EXIC Kpong Water Supply Expansion Project 1,000.6
139 EXIC E-Government Platform Project 573.9
141 EXIC Bui Dam Project - Additional Loan 363.4
140 EXIC Legon ICT Project (Phase II) 143.8
142 EXIC Bui Dam Project - Additional Loan 275.6
143 EXIC Ghana Dedicated Security Information System Phase II 371.7
146 EXIM Const. of Presidential Palace & Offices 62.8
145 EXIM Purchase of Goods form India 56.1
144 EXIM Rural Electrification project - India 62.8
147 EXIM Supply of Goods from India 87.0
148 EXIM Fish Harvesting and Waste Management Support Pj. 90.1
149 EXIM Design and Construction of 84km Railway Line between Tema and Akosombo 638.4
150 EXUS Self Help Electrification (SHEP IV) - EXUS 800.1
151 EXUS Mampong Water Supply Project 46.2
152 EXUS Rehabilitation and Expansion of Ridge Hospital 445.1
153 FRG DISTRICT TOWNS IV. 28.8
154 FRG Rehab. of Sogakope Akatsi Road Project 51.6
155 FRG Multi Donor Budget Support ---Germany 61.6
156 FRG Land Administration Project 11.5
159 FRG District Towns V 19.9
157 FRG Promotion of Perennial Crops 25.8
158 FRG Multi Donor Budgetary Support III - Germany 51.5
160 FRG Multi Donor Budget Support IV 53.4
161 FRG Poverty Focused Rural Transportation Programme 20.3
162 FRG Multi Donor Budgetary Support ( V & VI) 253.8
163 FRG District Development Facility Project 71.7
165 FRG Multi Donor Budget Support (VII-IX) 291.8
164 FRG Out Growers and Value Chain Fund 26.8
166 FRG e-Zwich Rural Branchless Banking Project 6.2
167 FRG District Development Facility Phase III (DDF III) 35.9
169 FRG Multi Donor Budget Support (MDBS X-XI) 95.5
168 FRG Out Growers and Value Chain Fund II 35.7
171 FRG New Performance Oriented Public Financial Management-GAS 0.7
172 FRG New Performance Oriented Public Financial Management-GRA* -
170 FRG Renewable Energy Programme: Pilot Photovoltaic System* -
173 FRNG Urban Roads - Takoradi & Tema XEU 20.7
174 FRNG Small Outgrowers Phase II 3.8
178 FRNG Construction of Rural Bridges - N. Ghana 12.8
176 FRNG Drainage Improvement In Accra 11.8
175 FRNG Urban Infrastructure of Sec. Towns Prog 1.8
177 FRNG Village Water Supply Prog. In N.Ghana 0.1
179 FRNG Impt. of Urban Roads & Wood Mkt. in Kumasi 101.1
180 FRNG Community Based Rural Dev't Pj 44.1
183 FRNG Perennial Crops 88.1
181 FRNG Multi Donor Budget Support - France 149.0
182 FRNG Urban Development in Accra & Kumasi 117.2
184 FRNG Rice Sector Support Project 59.9
185 FRNG Small Town Water Supply & Sanitation Project 90.8
186 FRNG Urban Transportation Project (UTP) 107.5
187 FRNG Natural Resource and Environmental Gov. Programme 26.9
188 FRNG District Development Facility Project 82.8
189 FRNG Rehab of Awoshie-Pokuasi Road 155.2
190 FRNG Ghana Urban Management Pilot Project 196.4
191 FRNG Kpong Generation Station Retrofit Project 240.1
192 FRNG District Development Facility Phase II 115.9

The 2018 Annual Public Debt Report
68
S/N Creditor Project Title
Disbursed Outstanding
Debt (GH¢'m)
193 FRNG Kumasi Roads and Drainage Extension Project 2.7
194 GPRC Purchase Of Goods From China 9.8
195 GPRC Ghana National Communication Infr. Backbone Phase I 84.2
196 GPRC Ghana Dedicated Security Information System (Phase 1) Pj 90.5
197 GPRC Bui Hydropower Dam Project 946.6
198 GPRC ICT - Enabled Distance Education Project 26.0
199 GPRC Cape Coast Kotokuraba Market Project 132.4
200 GRK Petroleum Products Storage Depots Proj. 31.9
201 GRK LPG Cylinder Manufacturing Plant Project 27.0
202 GRK Buipe-Bolga Petroleum Pipeline Pj. 140.9
203 GRK Wa Water Supply and Expansion Project 74.3
204 GRK Preastea-Kumasi Power Enhancement Project 162.9
205 HSBC Redevelopment of Police Hospital 187.4
206 HSBC Refurbishment and Expansion Project for Ridge Hospital, Accra 118.9
207 HSBC Accra Bus Rapid Transit Project 353.9
208 ICBC Rural Electrification - Northern Region 418.1
210 ICBC Self- Help Electrification Programme in Five Regions HUNAN 28.3
209 ICBC Rural Electrification Programme CWE 236.4
211 IDA Thermal Power Project 64.2
212 IDA Urban Environmental Sanitation Pj-URB 4 4.4
213 IDA Public Enterprise & Priv. Tech. Asst. Pj 14.1
214 IDA Village Infrastructure Pj. 17.8
215 IDA Trade and Investment Gateway Pj. 89.7
216 IDA Public Sector Management Reform Project 0.2
217 IDA Community Water and Sanitation Project II 51.2
218 IDA National Functional Literacy Project 91.0
219 IDA Urban V Project 11.1
224 IDA Agric. Services Sub-Sector Investment Pj. 210.4
223 IDA Community-Based Poverty Reduction Proj 12.0
220 IDA Road Sector Development Project 678.2
221 IDA Rural Financial Services Project 18.4
222 IDA Ghana Aids Response Project 54.1
225 IDA 2ND Health Sector Program Support Pj. 259.5
226 IDA Land Administration Project 87.0
227 IDA Education Sector Project 333.1
228 IDA Second Poverty Reduction Support Financing 357.6
229 IDA Community Based Rural Dev't Project 335.4
230 IDA Second Urban Environmental Sanitation Pj 254.4
231 IDA Small Town Water SS & Sanitation Project 174.4
233 IDA Third Poverty Reduction Support 524.5
232 IDA First -Phase of Coastal Transmission Backbone Project 164.1
234 IDA Economic Management Capacity Building Proj. 110.0
235 IDA Multi Sectoral HIV/AIDS Proj. 85.8
236 IDA Micro Small Scale and Medium Enterprise Project. 203.0
237 IDA 4th Poverty Reduction Support Credit 626.8
238 IDA eGhana Project 170.8
239 IDA Fifth Poverty Reduction Support Credit 472.5
245 IDA West Africa Agricultural Productivity Program (WAAP) Supp. Pj. 65.3
240 IDA Energy Development and Access Project 390.3
241 IDA Health Insurance Project 65.4
242 IDA Nutrition and Malaria Control for Child Survival Project 107.3
243 IDA Urban Transport Project 194.7
244 IDA II Phase of the Coastal Transmission Backbone Pj. 188.4
246 IDA Additional Financing- Economic Management Capacity Building Proj. 40.8
247 IDA Sixth Poverty Reduction Support Credit 403.5
248 IDA 1st Agric. Development Policy Operation 104.8
249 IDA 1st Nat. Resource & Env. Gov. Dev. Policy Operation 83.0
250 IDA West African Transport and Transit Facilitation Project 325.0
251 IDA Economic Governance and Poverty Credit 1,299.2
253 IDA 2ND NREG-WORLD BANK 45.6
252 IDA Transport Sector Project 970.9
261 IDA Abidjan-Lagos Transport Facilitation Project 498.4
255 IDA 2nd Agric Development Policy Operation 110.6
257 IDA 3rd Nat. Resource and Environ. Gov. Develop. Policy 44.2
254 IDA e-Ghana Project Additional Financing 196.2
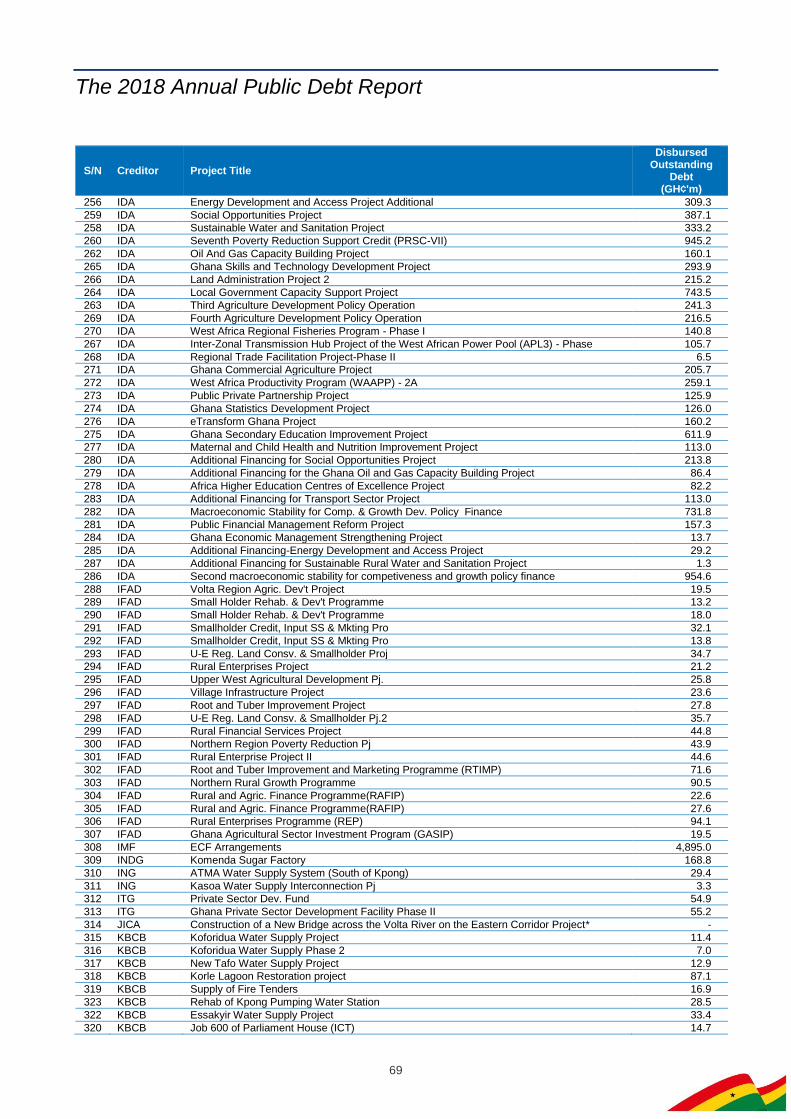
The 2018 Annual Public Debt Report
69
S/N Creditor Project Title
Disbursed Outstanding
Debt (GH¢'m)
256 IDA Energy Development and Access Project Additional 309.3
259 IDA Social Opportunities Project 387.1
258 IDA Sustainable Water and Sanitation Project 333.2
260 IDA Seventh Poverty Reduction Support Credit (PRSC-VII) 945.2
262 IDA Oil And Gas Capacity Building Project 160.1
265 IDA Ghana Skills and Technology Development Project 293.9
266 IDA Land Administration Project 2 215.2
264 IDA Local Government Capacity Support Project 743.5
263 IDA Third Agriculture Development Policy Operation 241.3
269 IDA Fourth Agriculture Development Policy Operation 216.5
270 IDA West Africa Regional Fisheries Program - Phase I 140.8
267 IDA Inter-Zonal Transmission Hub Project of the West African Power Pool (APL3) - Phase 105.7
268 IDA Regional Trade Facilitation Project-Phase II 6.5
271 IDA Ghana Commercial Agriculture Project 205.7
272 IDA West Africa Productivity Program (WAAPP) - 2A 259.1
273 IDA Public Private Partnership Project 125.9
274 IDA Ghana Statistics Development Project 126.0
276 IDA eTransform Ghana Project 160.2
275 IDA Ghana Secondary Education Improvement Project 611.9
277 IDA Maternal and Child Health and Nutrition Improvement Project 113.0
280 IDA Additional Financing for Social Opportunities Project 213.8
279 IDA Additional Financing for the Ghana Oil and Gas Capacity Building Project 86.4
278 IDA Africa Higher Education Centres of Excellence Project 82.2
283 IDA Additional Financing for Transport Sector Project 113.0
282 IDA Macroeconomic Stability for Comp. & Growth Dev. Policy Finance 731.8
281 IDA Public Financial Management Reform Project 157.3
284 IDA Ghana Economic Management Strengthening Project 13.7
285 IDA Additional Financing-Energy Development and Access Project 29.2
287 IDA Additional Financing for Sustainable Rural Water and Sanitation Project 1.3
286 IDA Second macroeconomic stability for competiveness and growth policy finance 954.6
288 IFAD Volta Region Agric. Dev't Project 19.5
289 IFAD Small Holder Rehab. & Dev't Programme 13.2
290 IFAD Small Holder Rehab. & Dev't Programme 18.0
291 IFAD Smallholder Credit, Input SS & Mkting Pro 32.1
292 IFAD Smallholder Credit, Input SS & Mkting Pro 13.8
293 IFAD U-E Reg. Land Consv. & Smallholder Proj 34.7
294 IFAD Rural Enterprises Project 21.2
295 IFAD Upper West Agricultural Development Pj. 25.8
296 IFAD Village Infrastructure Project 23.6
297 IFAD Root and Tuber Improvement Project 27.8
298 IFAD U-E Reg. Land Consv. & Smallholder Pj.2 35.7
299 IFAD Rural Financial Services Project 44.8
300 IFAD Northern Region Poverty Reduction Pj 43.9
301 IFAD Rural Enterprise Project II 44.6
302 IFAD Root and Tuber Improvement and Marketing Programme (RTIMP) 71.6
303 IFAD Northern Rural Growth Programme 90.5
304 IFAD Rural and Agric. Finance Programme(RAFIP) 22.6
305 IFAD Rural and Agric. Finance Programme(RAFIP) 27.6
306 IFAD Rural Enterprises Programme (REP) 94.1
307 IFAD Ghana Agricultural Sector Investment Program (GASIP) 19.5
308 IMF ECF Arrangements 4,895.0
309 INDG Komenda Sugar Factory 168.8
310 ING ATMA Water Supply System (South of Kpong) 29.4
311 ING Kasoa Water Supply Interconnection Pj 3.3
312 ITG Private Sector Dev. Fund 54.9
313 ITG Ghana Private Sector Development Facility Phase II 55.2
314 JICA Construction of a New Bridge across the Volta River on the Eastern Corridor Project* -
315 KBCB Koforidua Water Supply Project 11.4
316 KBCB Koforidua Water Supply Phase 2 7.0
317 KBCB New Tafo Water Supply Project 12.9
318 KBCB Korle Lagoon Restoration project 87.1
319 KBCB Supply of Fire Tenders 16.9
323 KBCB Rehab of Kpong Pumping Water Station 28.5
322 KBCB Essakyir Water Supply Project 33.4
320 KBCB Job 600 of Parliament House (ICT) 14.7
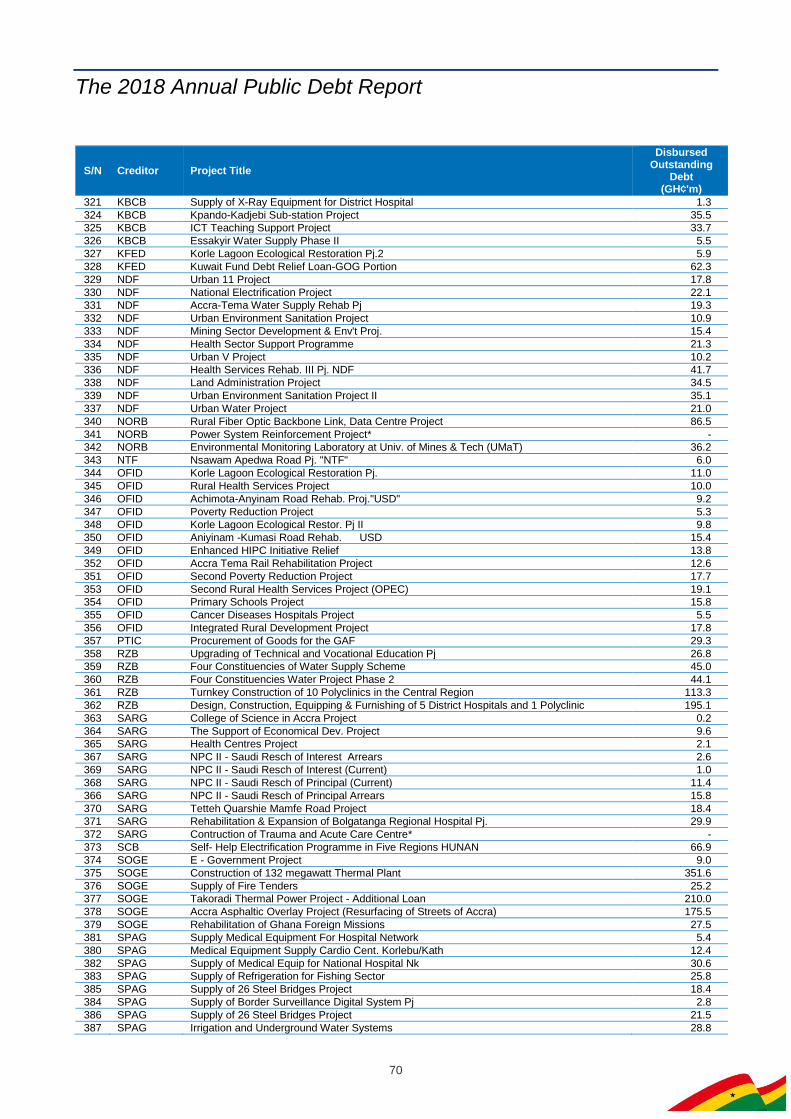
The 2018 Annual Public Debt Report
70
S/N Creditor Project Title
Disbursed Outstanding
Debt (GH¢'m)
321 KBCB Supply of X-Ray Equipment for District Hospital 1.3
324 KBCB Kpando-Kadjebi Sub-station Project 35.5
325 KBCB ICT Teaching Support Project 33.7
326 KBCB Essakyir Water Supply Phase II 5.5
327 KFED Korle Lagoon Ecological Restoration Pj.2 5.9
328 KFED Kuwait Fund Debt Relief Loan-GOG Portion 62.3
329 NDF Urban 11 Project 17.8
330 NDF National Electrification Project 22.1
331 NDF Accra-Tema Water Supply Rehab Pj 19.3
332 NDF Urban Environment Sanitation Project 10.9
333 NDF Mining Sector Development & Env't Proj. 15.4
334 NDF Health Sector Support Programme 21.3
335 NDF Urban V Project 10.2
336 NDF Health Services Rehab. III Pj. NDF 41.7
338 NDF Land Administration Project 34.5
339 NDF Urban Environment Sanitation Project II 35.1
337 NDF Urban Water Project 21.0
340 NORB Rural Fiber Optic Backbone Link, Data Centre Project 86.5
341 NORB Power System Reinforcement Project* -
342 NORB Environmental Monitoring Laboratory at Univ. of Mines & Tech (UMaT) 36.2
343 NTF Nsawam Apedwa Road Pj. "NTF" 6.0
344 OFID Korle Lagoon Ecological Restoration Pj. 11.0
345 OFID Rural Health Services Project 10.0
346 OFID Achimota-Anyinam Road Rehab. Proj."USD" 9.2
347 OFID Poverty Reduction Project 5.3
348 OFID Korle Lagoon Ecological Restor. Pj II 9.8
350 OFID Aniyinam -Kumasi Road Rehab. USD 15.4
349 OFID Enhanced HIPC Initiative Relief 13.8
352 OFID Accra Tema Rail Rehabilitation Project 12.6
351 OFID Second Poverty Reduction Project 17.7
353 OFID Second Rural Health Services Project (OPEC) 19.1
354 OFID Primary Schools Project 15.8
355 OFID Cancer Diseases Hospitals Project 5.5
356 OFID Integrated Rural Development Project 17.8
357 PTIC Procurement of Goods for the GAF 29.3
358 RZB Upgrading of Technical and Vocational Education Pj 26.8
359 RZB Four Constituencies of Water Supply Scheme 45.0
360 RZB Four Constituencies Water Project Phase 2 44.1
361 RZB Turnkey Construction of 10 Polyclinics in the Central Region 113.3
362 RZB Design, Construction, Equipping & Furnishing of 5 District Hospitals and 1 Polyclinic 195.1
363 SARG College of Science in Accra Project 0.2
364 SARG The Support of Economical Dev. Project 9.6
365 SARG Health Centres Project 2.1
367 SARG NPC II - Saudi Resch of Interest Arrears 2.6
369 SARG NPC II - Saudi Resch of Interest (Current) 1.0
368 SARG NPC II - Saudi Resch of Principal (Current) 11.4
366 SARG NPC II - Saudi Resch of Principal Arrears 15.8
370 SARG Tetteh Quarshie Mamfe Road Project 18.4
371 SARG Rehabilitation & Expansion of Bolgatanga Regional Hospital Pj. 29.9
372 SARG Contruction of Trauma and Acute Care Centre* -
373 SCB Self- Help Electrification Programme in Five Regions HUNAN 66.9
374 SOGE E - Government Project 9.0
375 SOGE Construction of 132 megawatt Thermal Plant 351.6
376 SOGE Supply of Fire Tenders 25.2
377 SOGE Takoradi Thermal Power Project - Additional Loan 210.0
378 SOGE Accra Asphaltic Overlay Project (Resurfacing of Streets of Accra) 175.5
379 SOGE Rehabilitation of Ghana Foreign Missions 27.5
381 SPAG Supply Medical Equipment For Hospital Network 5.4
380 SPAG Medical Equipment Supply Cardio Cent. Korlebu/Kath 12.4
382 SPAG Supply of Medical Equip for National Hospital Nk 30.6
383 SPAG Supply of Refrigeration for Fishing Sector 25.8
385 SPAG Supply of 26 Steel Bridges Project 18.4
384 SPAG Supply of Border Surveillance Digital System Pj 2.8
386 SPAG Supply of 26 Steel Bridges Project 21.5
387 SPAG Irrigation and Underground Water Systems 28.8

The 2018 Annual Public Debt Report
71
S/N Creditor Project Title
Disbursed Outstanding
Debt (GH¢'m)
388 UNCM Purchase and Installation of Equipment and Machinery 14.5
389 UNCR Supply of Two Ferries for Renovation of Adomi Bridge 45.0
390 UNCR Construction of Five (5) Polyclinics IV 71.4
391 UNCR Services for the Enhancement of Nationwide Water Network Management 8.8
392 VTB United Nations Peacekeeping 278.6
Grand Total** 83,820.1
*New loans which have not yet been disbursed **Excludes Government-guaranteed debt

The 2018 Annual Public Debt Report
72
Appendix 4: List of Loans Signed in 2018
S/N Creditor Project/Financing Title
Sector Terms USD Equivalent
Non-Concessional Loans 845,098,742.9
1 Deutsche Bank Ag
Rehabilitation of Selected Hospitals in the Eastern Region (Mampong, Atibie, Aburi and Kyebi)
Ministry of Health
SACE Supported Facility Facility Amount: up to €34.00 million (inclusive of estimated UKEF premium of 13.00% flat of facility amount) Interest Rate: CIRR+0.95% p.a. Commitment Fee: 1.00% p.a. Arrangement Fee: 1.25% flat of facility Structuring Fee: 0.50% flat of facility Grace Period: 2 years Repayment Period: 10 years Tenor: 12 years Commercial Facility Loan Amount: up to €6.00 million Interest Rate: 6ME + 5.00% p.a. Commitment Fee: 1.00% p.a. Arrangement Fee: 1.25% flat Structuring Fee: 0.50% flat Grace Period: 1 year Repayment Period: 4 years Tenor: 5 years
49,200,000.0
2 Deutsche Bank AG (ECA facility)
Bekwai Hospital Rehabilitation
Ministry of Health
Interest Rate: 6ME + 1.90% p.a. Commitment Fee: 1.00% p.a. Structuring Fees: 0.50% flat Arrangement Fees: 1.00% flat Grace Period: 1.5 years Tenor: 10 years
24,027,396.7
3 Deutsche Bank AG (Tied Commercial Loan)
Bekwai Hospital Rehabilitation
Ministry of Health
Interest Rate: 6ME + 5.00% p.a. Commitment Fee: 1.00% p.a. Structuring Fees: 0.50% flat Arrangement Fees: 1.00% flat Grace Period: 0.5 years Tenor: 5 years
5,739,049.6
4 EXIM Bank China
Upgrading of Polytechnics, Technical and Vocational Training Centres
Ministry of Education
Loan Amount: $119,101,946 Interest Rate: 2.00% p.a. Commitment Fee: 0.25% p.a. Management Fee: 0.25% flat Grace Period: 5 years Repayment Period: 15 years Tenor: 20 years
119,101,946.0
5 HSBC Bank Plc
Obetsebi Lamptey Drainage Network and Interchange
Ministry of Roads and Highways
Interest Rate: 6ML + 2% p.a. Commitment Fee: 0.80% p.a. Structuring Fee: 1.75% flat Arrangement Fee: $185,000 flat Grace Period: 2 years Tenor: 12 years
22,000,000.0
6 HSBC Bank Plc
Obetsebi Lamptey Drainage Network and Interchange
Ministry of Roads and Highways
Interest Rate: 6ML + 4.95% p.a. Commitment Fee: 1.95% p.a. Structuring Fees: 1.75% flat Administration Fees: $70,000.00 Grace Period: 1.5 years Tenor: 5 years
17,200,000.0
7 KFW Ipex Bank
Development of Tamale Airport- Terminal Building and Related Infrastructure Phase
Ministry of Transport
Interest: 6ML + 5.00% p.a. Grace Period: 1 year Tenor: 5 years Structuring Fee: 1.25% flat Commitment Fees: 1.60% p.a.
24,000,000.0
8 KFW Ipex Bank with support from UKEF
Interest: 6ML + 1.75% p.a. Grace Period: 2 years Tenor: 10 years Structuring Fee: 1.50% flat Commitment Fees: 0.70% p.a.
56,000,000.0
9 World Bank Additional Financing for the Secondary Education Improvement Project
Ministry of Education
Interest Rate: 1.25% p.a. Service Fee: 0.75% p.a. Commitment Fee: 0.5% p.a. Grace Period: 5 years Repayment: 25 years Tenor: 30 years
40,000,000.0

The 2018 Annual Public Debt Report
73
S/N Creditor Project/Financing Title
Sector Terms USD Equivalent
10 World Bank Ghana Transport Sector Improvement Project
Ministry of Roads and Highways
Interest Rate: 1.25% p.a. Service Fee: 0.75% p.a. Commitment Fee: 0.5% p.a. Grace Period: 5 years Repayment: 25 years Tenor: 30 years
154,476,309.9
11 World Bank Ghana Commercial Agriculture Project (Additional Financing)
Ministry of Food and Agriculture
Interest Rate: 1.25% p.a. Service Fee: 0.75% p.a. Commitment Fee: 0.5% p.a. Grace Period: 5 years Repayment: 25 years Tenor: 30 years
50,000,000.0
12 World Bank Financial Sector Development Project
Ministry of Finance
Interest Rate: 1.25% p.a. Service Fee: 0.75% p.a. Commitment Fee: 0.5% p.a. Grace Period: 5 years Repayment: 25 years Tenor: 30 years
29,960,000.0
13 World Bank Tourism Development Project
Ministry of Tourism
Interest Rate: 1.25% p.a. Service Fee: 0.75% p.a. Commitment Fee: 0.5% p.a. Grace Period: 5 years Repayment: 25 years Tenor: 30 years
39,060,000.0
14 World Bank Ghana Secondary Cities Support Programme
Ministry of Local Government & Rural Dev't
Interest Rate: 1.25% p.a. Service Fee: 0.75% p.a. Commitment Fee: 0.5% p.a. Grace Period: 5 years Repayment: 25 years Tenor: 30 years
99,540,000.0
15 World Bank Public Sector Reform for Results Project
Ministry of Special Initiatives
Interest Rate: 1.25% p.a. Service Fee: 0.75% p.a. Commitment Fee: 0.5% p.a. Grace Period: 5 year Repayment: 25 years Tenor: 30 years
35,000,000.0
16 World Bank Ghana Energy Sector Transformation Initiative Project
Ministry of Energy
Interest Rate: 1.25% p.a. Service Fee: 0.75% p.a. Commitment Fee: 0.5% p.a. Grace Period: 5 years Repayment: 25 years Tenor: 30 years
19,880,000.0
17 World Bank Productive Safety Net Project
Ministry of Local Government & Rural Dev't; Ministry of Gender & Social Protection
Interest Rate: 1.25% p.a. Service Fee: 0.75% p.a. Commitment Fee: 0.5% p.a. Grace Period: 5 years Repayment: 25 years Tenor: 30 years
59,914,040.7
Concessional Loans 126,541,504.1
18 African Development Bank
Savannah Zone Agricultural Productivity Improvement Project
Ministry of Agriculture
Interest Rate: 1.00% p.a. Service Charge: 0.75% p.a. Commitment Fee: 0.50% p.a. Grace Period: 5 years Repayment Period: 25 years Tenor: 30 years
39,296,700.0
19 Bank Austria Ag
Implementation of the Photovoltaic based Street Lighting Programme at Hazardous (black spot) Locations in Selected Communities within Ghana
Ministry of Roads and Highways
Facility Amount: €7,500,000 Repayment Period: 14 years Graced Period: 7.5 years Tenor: 21.5 years Interest Rate: 0.9%p.a. Commitment Fee: 0.5% p.a. Management Fee: 0.5% flat
9,225,000.0
20 ING Bank/ Government
Improving Access to Quality Health
Ministry of Health
Facility Amount: €17,088,777 ORIO Grant Amount: €9,201,651.00
21,019,195.7

The 2018 Annual Public Debt Report
74
S/N Creditor Project/Financing Title
Sector Terms USD Equivalent
of Netherlands
Care in the Western Region
Interest Rate: Euribor + 1.95% p.a. Commitment Fee: 0.80% p.a. Management Fee: 0.85% flat Grace Period: 2 years Repayment Period: 10 years Tenor: 12 years
21 Government of Republic of Germany
Establishment of Deposit Protection Scheme
Ministry of Finance
Loan Amount: €13,000,000 Grant Amount: €1,000,000 Interest Rate: 0.75% p.a. Commitment Fee: 0.25% p.a. Grace Period: 10 years Repayment Period: 30 years Tenor: 40 years
15,990,000.0
22 Government of the Netherlands
Upper East Water Supply Project
Ministry of Sanitation and Water Resources
Loan Amount: €25,341,958 ORIO Grant Amount: €12,341,308 Grace Period: 3 years Tenor: 12.5 years Interest Rate: 6ME + 1.95% p.a.
31,170,608.3
23 Unicredit Bank Austria
Nationwide Water Network Management Project
Ministry of Sanitation and Water Resources
Interest Rate: 1.00% p.a. Management Fee: 0.50% flat Repayment Period: 13 years Grace Period: 8 years Tenor: 21 years
9,840,000.0
TOTAL 971,640,246.9
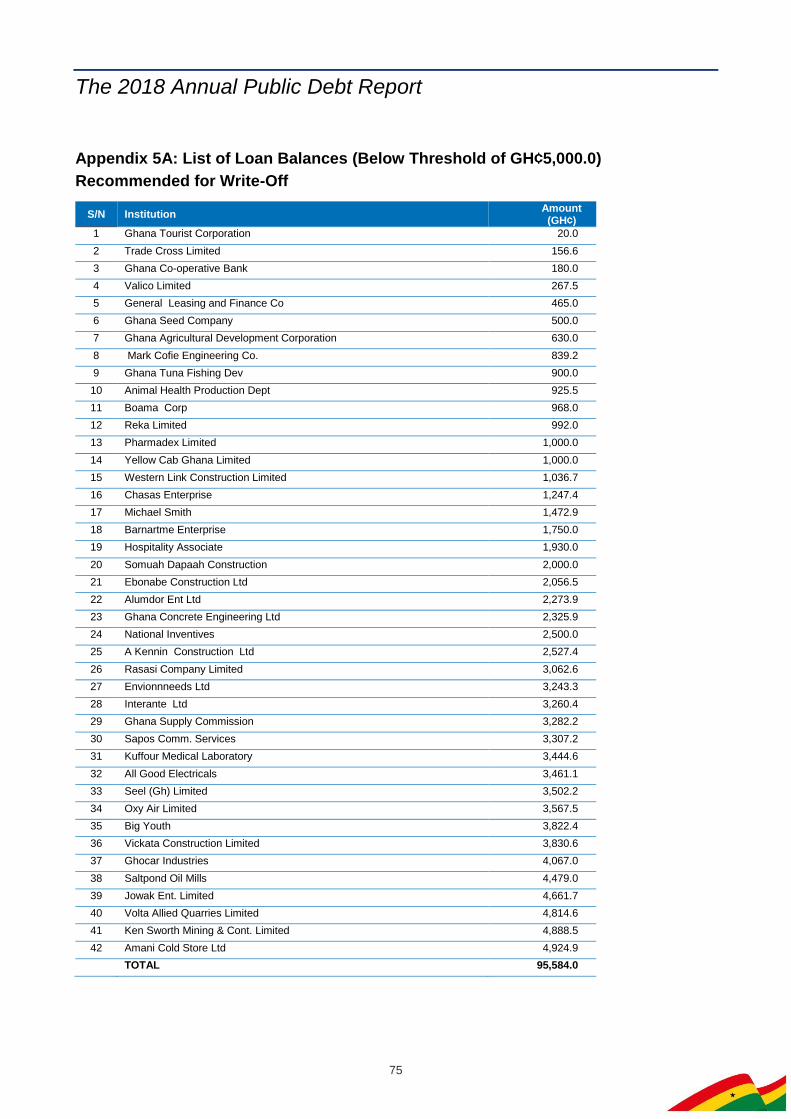
The 2018 Annual Public Debt Report
75
Appendix 5A: List of Loan Balances (Below Threshold of GH¢5,000.0)
Recommended for Write-Off
S/N Institution Amount (GH¢)
1 Ghana Tourist Corporation 20.0
2 Trade Cross Limited 156.6
3 Ghana Co-operative Bank 180.0
4 Valico Limited 267.5
5 General Leasing and Finance Co 465.0
6 Ghana Seed Company 500.0
7 Ghana Agricultural Development Corporation 630.0
8 Mark Cofie Engineering Co. 839.2
9 Ghana Tuna Fishing Dev 900.0
10 Animal Health Production Dept 925.5
11 Boama Corp 968.0
12 Reka Limited 992.0
13 Pharmadex Limited 1,000.0
14 Yellow Cab Ghana Limited 1,000.0
15 Western Link Construction Limited 1,036.7
16 Chasas Enterprise 1,247.4
17 Michael Smith 1,472.9
18 Barnartme Enterprise 1,750.0
19 Hospitality Associate 1,930.0
20 Somuah Dapaah Construction 2,000.0
21 Ebonabe Construction Ltd 2,056.5
22 Alumdor Ent Ltd 2,273.9
23 Ghana Concrete Engineering Ltd 2,325.9
24 National Inventives 2,500.0
25 A Kennin Construction Ltd 2,527.4
26 Rasasi Company Limited 3,062.6
27 Envionnneeds Ltd 3,243.3
28 Interante Ltd 3,260.4
29 Ghana Supply Commission 3,282.2
30 Sapos Comm. Services 3,307.2
31 Kuffour Medical Laboratory 3,444.6
32 All Good Electricals 3,461.1
33 Seel (Gh) Limited 3,502.2
34 Oxy Air Limited 3,567.5
35 Big Youth 3,822.4
36 Vickata Construction Limited 3,830.6
37 Ghocar Industries 4,067.0
38 Saltpond Oil Mills 4,479.0
39 Jowak Ent. Limited 4,661.7
40 Volta Allied Quarries Limited 4,814.6
41 Ken Sworth Mining & Cont. Limited 4,888.5
42 Amani Cold Store Ltd 4,924.9
TOTAL 95,584.0
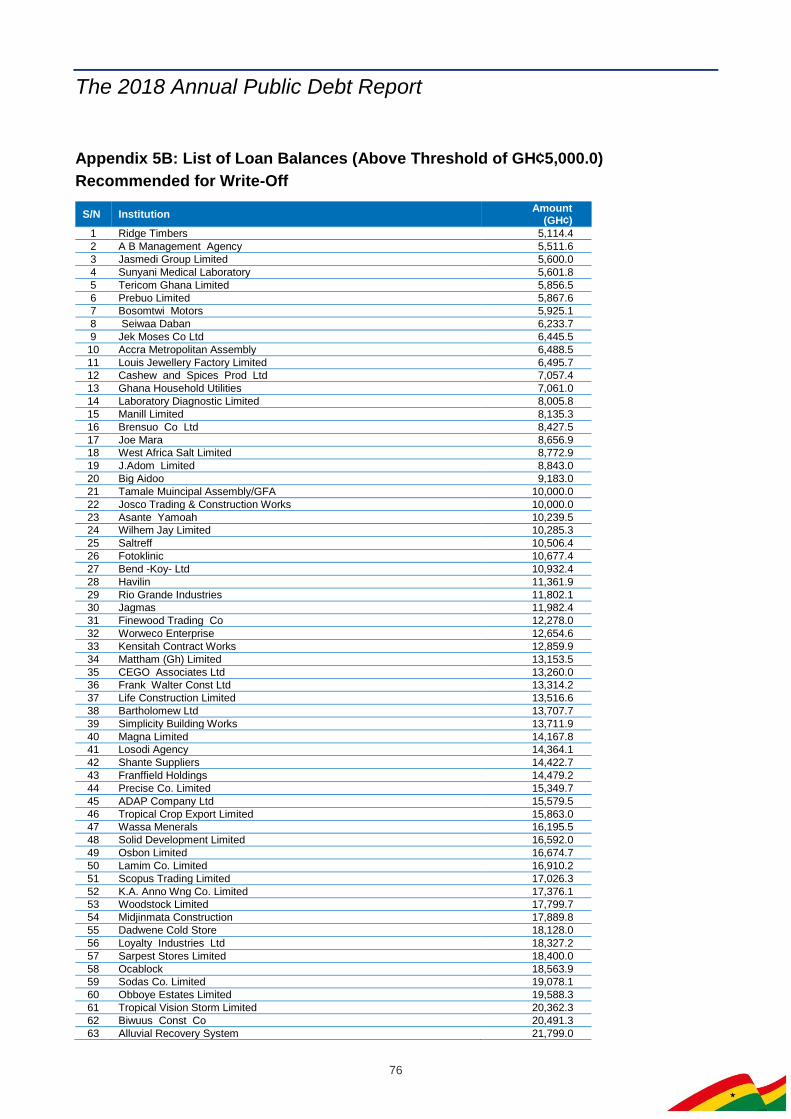
The 2018 Annual Public Debt Report
76
Appendix 5B: List of Loan Balances (Above Threshold of GH¢5,000.0)
Recommended for Write-Off
S/N Institution Amount
(GH¢)
1 Ridge Timbers 5,114.4
2 A B Management Agency 5,511.6
3 Jasmedi Group Limited 5,600.0
4 Sunyani Medical Laboratory 5,601.8
5 Tericom Ghana Limited 5,856.5
6 Prebuo Limited 5,867.6
7 Bosomtwi Motors 5,925.1
8 Seiwaa Daban 6,233.7
9 Jek Moses Co Ltd 6,445.5
10 Accra Metropolitan Assembly 6,488.5
11 Louis Jewellery Factory Limited 6,495.7
12 Cashew and Spices Prod Ltd 7,057.4
13 Ghana Household Utilities 7,061.0
14 Laboratory Diagnostic Limited 8,005.8
15 Manill Limited 8,135.3
16 Brensuo Co Ltd 8,427.5
17 Joe Mara 8,656.9
18 West Africa Salt Limited 8,772.9
19 J.Adom Limited 8,843.0
20 Big Aidoo 9,183.0
21 Tamale Muincipal Assembly/GFA 10,000.0
22 Josco Trading & Construction Works 10,000.0
23 Asante Yamoah 10,239.5
24 Wilhem Jay Limited 10,285.3
25 Saltreff 10,506.4
26 Fotoklinic 10,677.4
27 Bend -Koy- Ltd 10,932.4
28 Havilin 11,361.9
29 Rio Grande Industries 11,802.1
30 Jagmas 11,982.4
31 Finewood Trading Co 12,278.0
32 Worweco Enterprise 12,654.6
33 Kensitah Contract Works 12,859.9
34 Mattham (Gh) Limited 13,153.5
35 CEGO Associates Ltd 13,260.0
36 Frank Walter Const Ltd 13,314.2
37 Life Construction Limited 13,516.6
38 Bartholomew Ltd 13,707.7
39 Simplicity Building Works 13,711.9
40 Magna Limited 14,167.8
41 Losodi Agency 14,364.1
42 Shante Suppliers 14,422.7
43 Franffield Holdings 14,479.2
44 Precise Co. Limited 15,349.7
45 ADAP Company Ltd 15,579.5
46 Tropical Crop Export Limited 15,863.0
47 Wassa Menerals 16,195.5
48 Solid Development Limited 16,592.0
49 Osbon Limited 16,674.7
50 Lamim Co. Limited 16,910.2
51 Scopus Trading Limited 17,026.3
52 K.A. Anno Wng Co. Limited 17,376.1
53 Woodstock Limited 17,799.7
54 Midjinmata Construction 17,889.8
55 Dadwene Cold Store 18,128.0
56 Loyalty Industries Ltd 18,327.2
57 Sarpest Stores Limited 18,400.0
58 Ocablock 18,563.9
59 Sodas Co. Limited 19,078.1
60 Obboye Estates Limited 19,588.3
61 Tropical Vision Storm Limited 20,362.3
62 Biwuus Const Co 20,491.3
63 Alluvial Recovery System 21,799.0

The 2018 Annual Public Debt Report
77
S/N Institution Amount
(GH¢)
64 Katson Limited 21,890.1
65 O & A Limited 21,926.5
66 AP Systems (GH) Ltd 22,975.1
67 Cofie Zane Jewellery Ltd 23,651.6
68 Fine Print Ltd 23,985.2
69 Cape Coast Municipal Assembley/GFA 25,000.0
70 Ghana Sanyo Co. 25,429.0
71 Dickie Ltd 25,557.1
72 Jay W. Limited 25,883.5
73 J K Enterprise 26,759.9
74 Ibnat Garment Ind 26,865.8
75 Cartbrandys Enterprise 26,967.5
76 CKA Industries Ltd 27,044.1
77 Alhaji Abu Bala and Sons 27,660.8
78 Jokumaks Limited 28,042.9
79 Hildad Company Ltd 28,302.0
80 Modern Petroleum Products 28,538.4
81 Gellina Packaging Co Ltd 29,348.5
82 Electronic Works 29,807.3
83 Panafest Secretariat 30,000.0
84 Carreg 31,220.7
85 Westar Mining 34,058.1
86 All Gate Co 34,813.0
87 Farmers Services Co Ltd 36,630.3
88 Bonsa Tyre Co. Ltd 37,354.6
89 Volta Lake Transport Company 41,006.7
90 Hicent Enterprise 45,019.9
91 Jupiter Services 46,742.1
92 Planstic Packaging Products Limited 47,851.9
93 Coppon Wood Processing 48,024.1
94 Gold Coast Motors 50,845.9
95 Western Veneer & Lumber Co. Ltd 51,111.5
96 Trans Allied Co. Limited 59,444.0
97 Chiraa Forest Mills 64,396.2
98 Alhaji Sulemana Ind 70,407.4
99 Ghana Sacks Ltd 71,174.0
100 Architectural Engineering Services Corporation 79,106.3
101 Bonte Gold Mines 84,697.2
102 Wood Merchant & Trading Co. 90,489.9
103 Twifo Oil Palm Plantation Ltd 93,100.0
104 Twifo Oil Palm Plantation Limited 93,100.0
105 Ghana Primewood 95,888.7
106 Osumanu Salt Industry Limited 117,800.1
107 Esterimo Packaging Ltd 128,019.8
108 Direct Arts Industries Ltd 147,625.8
109 Volta River Estates 148,821.7
110 Alfralex Company Ltd 161,970.5
111 Listar Medical Service 163,893.4
112 Western Ventures 205,999.2
113 University of Ghana 210,170.0
114 Asamoah Raffan Works 212,458.5
115 Poly Product Limited 217,122.7
116 Academy Press 228,150.2
117 FOS Company Ltd 251,627.3
118 Tropical Golden Fruits Limited 373,571.0
119 Nana Boakye Austrian Casting Limited 374,134.4
120 Lorando Mining Co. Limited 389,330.1
121 Asihene Brothers 394,481.6
122 Banbert Dev Co Ltd 403,046.7
123 Gidama Wood Processing 404,529.5
124 Osei Research Centre 445,680.6
125 Aggreko UK Ltd. 478,107.7
126 Ghana Railways Corporation 484,552.2
127 Ghana Civil Aviation Authority 535,321.6
128 Ghana Publishing Corporation (Facility A) 629,547.4
129 Ghana Highway Authority 715,116.7
130 Ghana Publishing Corporation (Facility B) 811,675.2

The 2018 Annual Public Debt Report
78
S/N Institution Amount
(GH¢)
131 Ghana Publishing Corporation (Facility C) 811,675.2
132 Ghana National Fire Service 922,175.5
133 Ghana Agro-Food Company 1,094,602.3
134 Ghana Frequency Reg/Control 3,690,987.3
135 G. P. R. T. U. 3,966,062.8
136 Council for Indigenous Business Association (CIBA) 4,395,340.7
137 Ghana International Airline LTD 5,142,828.1
138 Home Finance Company 9,538,316.0
139 Ghana National Petroleum Corporation (G.N.P.C.) 10,870,959.1
140 Quality Grain Co. Ltd. 13,495,351.0
141 GNPC 14,978,700.0
142 Subri Industrial Plantation Co. Limited 18,129,368.8
143 Volta Reg. Devt. Corporation 19,989,705.8
144 Ghana Oil Palm Devt Corp 22,708,353.5
145 La Palm & Coco Palm 23,161,600.0
146 Ghana Broadcasting Corporation 71,113,533.3
147 State Gold Mining Corporation 144,249,401.7
Total 379,504,787.4
The sum of balance below and above GH¢5,000.0 brings the total amount recommended for write-off to GH¢379,600,371.37
Recommended