Tennessee CountyTAX STATISTICS
FY 2016
226 Capitol Boulevard, Suite 400 Nashville, TN 37219 | Phone: (615) 532-3555 | ctas.tennessee.eduPromoting better county government through direct assistance to county officials and their associations.

May, 2016
Dear County Official:
The following text and tables represent our 38th edition of tax statistics for county governments in Tennessee. The information provided is the most current as of the date of publication; however, changes will no doubt take place due to the dynamic nature of county government.
Information on local litigation taxes is not included in our report. Most counties do levy these taxes in varying amounts and for a myriad of purposes. Its ease of passage (resolution) has made it a popular source of much needed revenues.
It is our legislative mandate to provide county officials with information useful in the operation of their offices. We hope you find this report beneficial in analyzing revenue sources available to county government. If CTAS can provide other information relating to this report, please contact us.
For this and other CTAS publications and information, you are invited to visit the CTAS website at ctas.tennessee.edu.
Sincerely,
Robin Roberts Executive Director
226 Capitol Boulevard, Suite 400 Nashville, TN 37219 | Phone: (615) 532-3555 | www.ctas.tennessee.eduPromoting better county government through direct assistance to county officials and their associations.
1

Table of Contents Property Taxes…………………………………………………………………………………………………..……3
Table 1 Property Tax Rate by Fund FY 2016………………..…………………………………………………….4
Table 2 Property Tax Rate Comparisons from FY 2015 to FY 2016 Ranked by Rate Change……………………………………………………………………………………………………………………….………...9
Table 3 Amount of Property Tax Revenue Generated on One Cent of the Property Tax Rate 2015.……………………………………………………………………………………………………………………………..11
County Local Option Sales Tax........................................................................................................12
Table 4 Local Option Sales Tax Rates, Single Article Cap, and Effective Date……….……. 14
Table 5 Countywide Local Option Sales Tax Collections FY 2016…………..……………….…….15
County Motor Vehicle Tax…………………………………………………………………………………………….……16
Table 6 County Motor Vehicle Tax Rates FY 2016………..…………………………………………..……..17
Table 7 Motor Vehicle Registrations 2015…………………………..………………………………………..…..18
Hotel/Motel Tax…………………………….………………………………………………………………………………..….19
Table 8 Hotel/Motel Tax Rates and Distribution FY 2016….……………………………………….……20
County Mineral Severance Tax…………………..………………………………………………………………..…….23
Table 9 Mineral Severance Tax Rates and Distribution FY 2016……………………………..……..24
Adequate Facilities and School Facilities Taxes…………………………………………………….……..……26
Table 10 Adequate Facilities and School Facilities Taxes and Fees Distribution…….....…27
Summary of Major County Tax Rates…………………………………..………………………………………..…..28
Table 11 Summary of Major County Tax Rates………………………..……………………………………..…29
2
County Property Tax Rates by Fund 1
The county property tax is the most important source of revenue for county governments. The tax is levied on all real and personal property based on the classification and value of the property unless the property is exempt. 2
Tax revenues may only be used for the purposes for which the tax is levied. The county legislative body sets the rate of the tax by a deadline dependent on the county’s budget law. However, some counties do not adopt a budget until after the specified deadline, in which case operations continue under a continuation budget remaining in effect until a new budget is adopted.
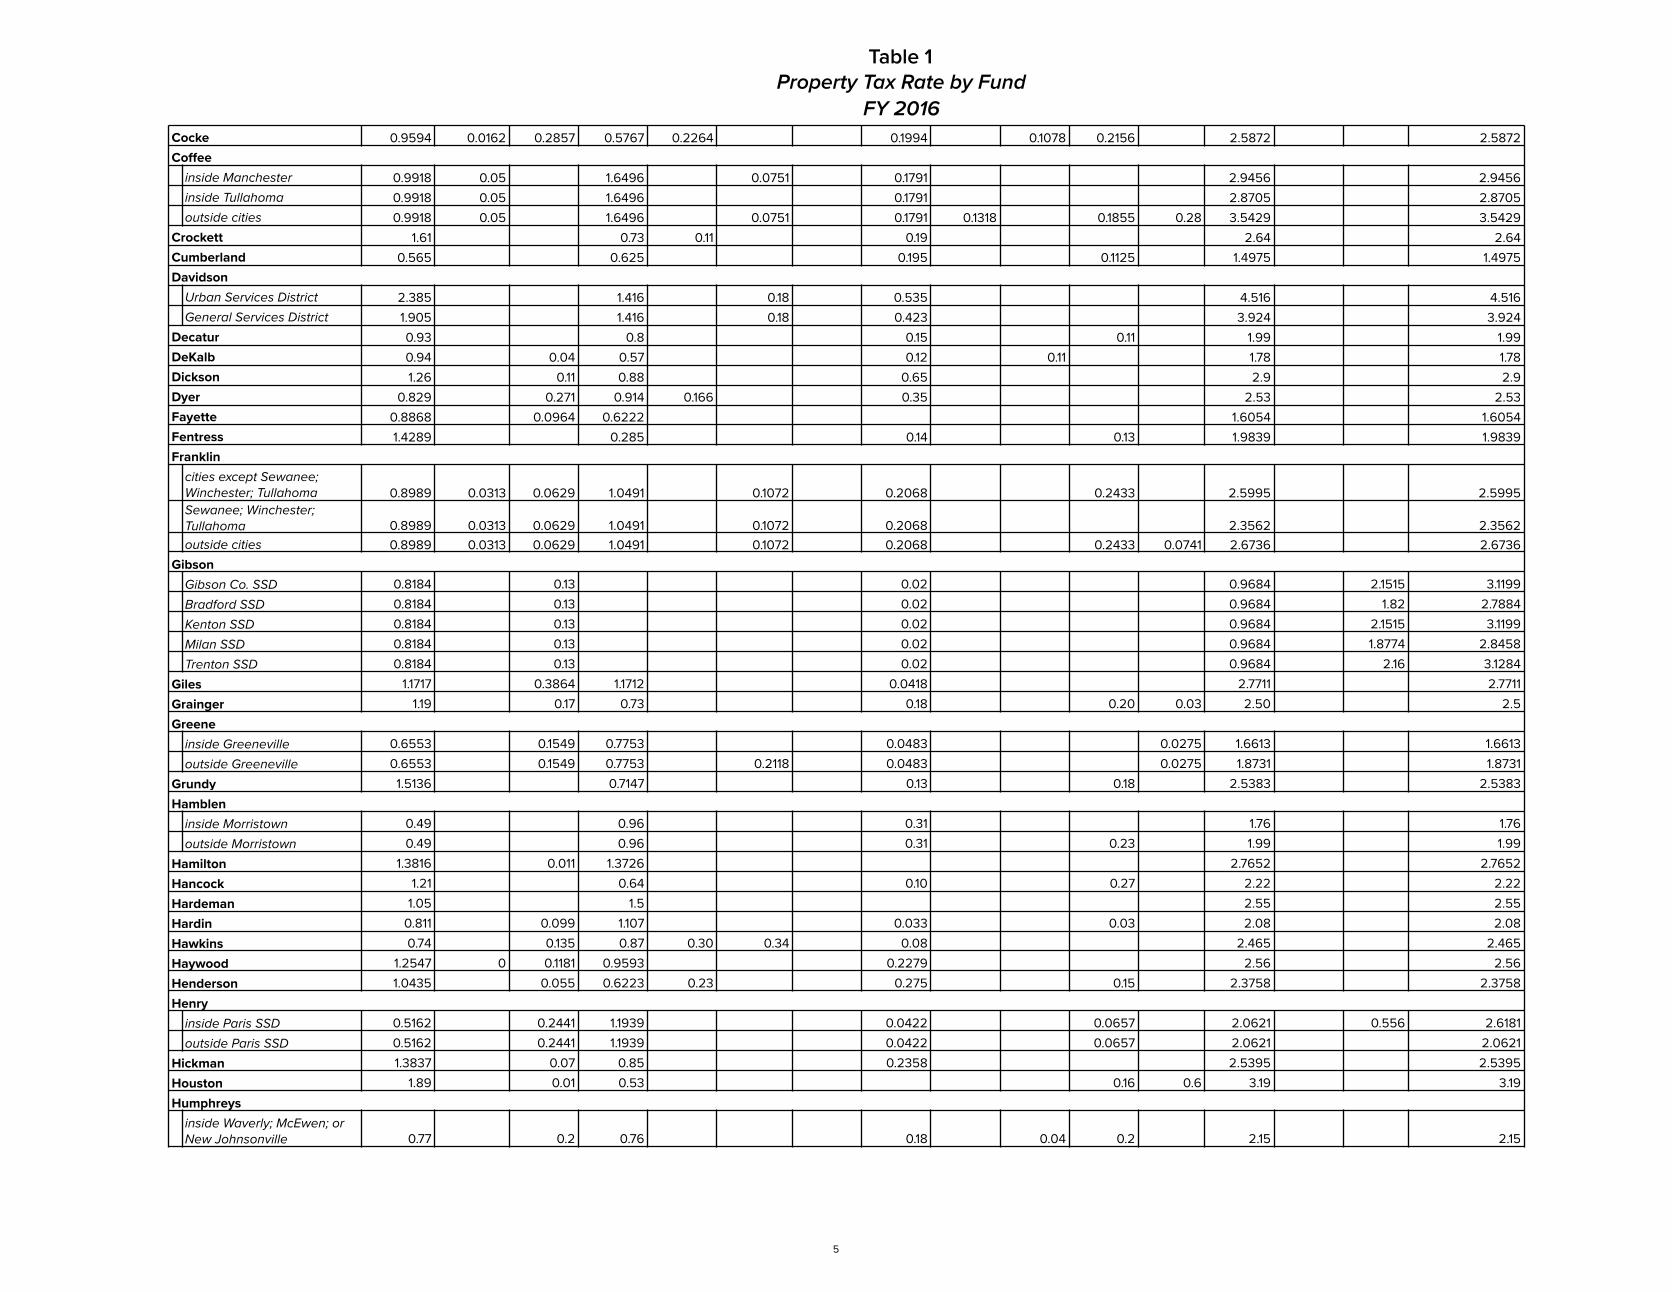
Rates adopted by type of fund for fiscal year 2016 are shown in Table 1. Note that not all rates are levied countywide. These instances occur for a variety of reasons. For example, certain services that cities provide to city residents are not provided outside city boundaries. Another example is in the case of special school districts, which have their own taxing jurisdictions. In those cases, the total tax rate reflected in the last column shows the rate paid by a county taxpayer living in the special district jurisdiction. Notes at the end of Table 1 provide detail on the purposes for which taxes are levied for special revenue and special purpose funds.
The information shown in Table 2 compares the total tax rate adopted in fiscal year 2016 with the previous year and is ranked by amount of rate increase. There are twenty-eight counties showing increases ranging from $0.003 to $0.519. In these counties, the percentage increase ranged from less than one percent to 25.24 percent.
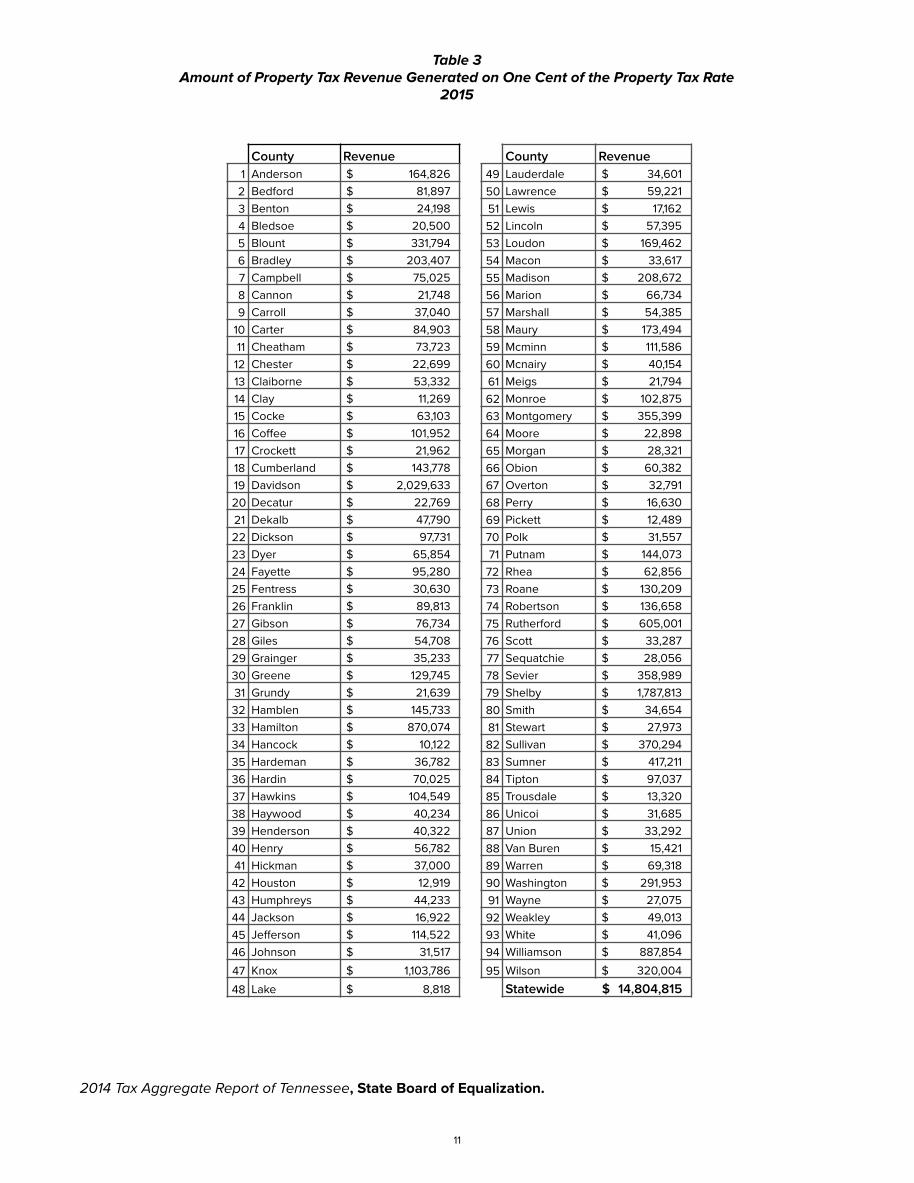
Table 3 shows how much revenue one cent of the property tax generates in each county if each county collected 100 percent of property taxes. This table illustrates the dramatic variations in county property tax bases across Tennessee, with the lowest in Lake County generating $8,818 on one cent of its property tax rate, to Davidson County (Metro Nashville-Davidson) generating more than $2 million on one cent of its property tax rate.
For more detail regarding the county property tax, go the CTAS website at ctas.tennessee.edu. Click on CTAS Reference Materials, and it will take you to e-Li where you can conduct a search on the property tax or any other item of interest related to county government.
The legal authority for the property tax is the Tennessee Constitution, article II, § 28; Tennessee Code Annotated (T.C.A.) 1
Title 67, Chapter 5, Parts 1 through 28.
T.C.A. § 67-5-1012
3

County/Area General Fund
Other General Fund or Special
Revenue Fund
Highway /Public Works Fund
General Purpose School Fund
School Transpor-
tation Fund
Education Debt
Service Fund
School Capital Projects
General and Other
Debt Service Funds
Rural Debt
Service Fund
Capital Projects Funds
Solid Waste Fund
Special/Local
Purpose Fund
County Tax Rate Fire Tax
Special School District
Total Tax Rate
Andersoninside Clinton 0.7373 0.0282 0.0448 1.6105 0.1644 0.1063 0.0016 0.0658 2.7589 2.7589inside Oak Ridge 0.7373 0.0282 0.0448 1.6105 0.1063 0.0016 0.0658 2.5945 2.5945outside Clinton and Oak Ridge 0.7373 0.0282 0.0448 1.6105 0.1644 0.1063 0.0314 0.0016 0.0658 2.7903 2.7903
Bedford 1.11 0.04 1.02 0.1 2.27 2.27Benton 1.2 0.09 1.517 0.078 0.065 2.95 2.95Bledsoe 1.0069 0.7875 0.041 0.2505 0.1303 2.2162 2.2162Blount 0.88 1.07 0.04 0.48 2.47 2.47Bradley
inside Charleston 0.5349 0.0277 0.1276 0.8609 0.0016 0.2674 0.052 1.8721 1.8721
inside Cleveland 0.5349 0.0277 0.1276 0.8609 0.0016 0.2674 0.052 1.8721 1.8721
inside urban fringe fire district 0.5349 0.0277 0.1276 0.8609 0.0016 0.2674 0.052 1.8721 0.344 2.2161
outside urban fringe 0.5349 0.0277 0.1276 0.8609 0.0016 0.2674 0.052 1.8721 0.4212 2.2933Campbell 0.9565 0.0478 0.1075 0.5964 0.124 0.1786 0.2392 2.25 2.25Cannon 1.41 0.2 0.88 0.03 0.16 2.68 2.68Carroll
Bruceton-Hollow Rock SSD 1.0554 0.08 0.14 0.12 0.09 1.4854 1.4786 2.964Huntingdon SSD 1.0554 0.08 0.14 0.12 0.09 1.4854 1.0729 2.56 McKenzie SSD 1.0554 0.08 0.14 0.12 0.09 1.4854 1.277 2.7624South Carroll SSD 1.0554 0.08 0.14 0.12 0.09 1.4854 1.5234 3.0088West Carroll SSD 1.0554 0.08 0.14 0.12 0.09 1.4854 1.3486 2.834
outside special school districts 1.0554 0.08 0.14 0.12 0.09 1.4854 1.4854
Carter 1.015 0.130 1.060 0.245 2.45 2.45Cheatham
inside Ashland City Rural Fire District 1.3018 0.075 1.085 0.1892 0.045 0.086 0.119 0.2496 3.1506 3.1506
inside Harpeth Ridge Fire District 1.3018 0.075 1.085 0.1892 0.045 0.086 0.119 0.1585 3.0595 3.0595
inside Henrietta Fire District 1.3018 0.075 1.085 0.1892 0.045 0.086 0.119 0.1504 3.0514 3.0514
inside Kingston Springs 1.3018 0.075 1.085 0.1892 0.045 0.086 0.119 0.256 3.1570 3.1570
inside Pegram Fire District 1.3018 0.075 1.085 0.1892 0.045 0.086 0.119 0.2458 3.1468 3.1468inside Pegram Rural Fire District 1.3018 0.075 1.085 0.1892 0.045 0.086 0.119 0.2347 3.1357 3.1357inside Pleasant View Rural Fire District 1.3018 0.075 1.085 0.1892 0.045 0.086 0.119 0.2396 3.1406 3.1406
inside Two Rivers Fire District 1.3018 0.075 1.085 0.1892 0.045 0.086 0.119 0.1811 3.0821 3.0821
outside fire districts 1.3018 0.075 1.085 0.1892 0.045 0.086 0.119 2.9010 2.9010
Chester 1.7302 0.02 0.7544 0.0156 2.5202 2.5202Claiborne 0.9449 0.01 1.22 0.03 0.0195 0.2356 0.02 2.480 2.48Clay 1.51 1.13 0.08 0.38 3.1 3.1
Table 1 Property Tax Rate by Fund
FY 2016
4
Cocke 0.9594 0.0162 0.2857 0.5767 0.2264 0.1994 0.1078 0.2156 2.5872 2.5872Coffee
inside Manchester 0.9918 0.05 1.6496 0.0751 0.1791 2.9456 2.9456inside Tullahoma 0.9918 0.05 1.6496 0.1791 2.8705 2.8705outside cities 0.9918 0.05 1.6496 0.0751 0.1791 0.1318 0.1855 0.28 3.5429 3.5429
Crockett 1.61 0.73 0.11 0.19 2.64 2.64Cumberland 0.565 0.625 0.195 0.1125 1.4975 1.4975Davidson
Urban Services District 2.385 1.416 0.18 0.535 4.516 4.516General Services District 1.905 1.416 0.18 0.423 3.924 3.924
Decatur 0.93 0.8 0.15 0.11 1.99 1.99DeKalb 0.94 0.04 0.57 0.12 0.11 1.78 1.78Dickson 1.26 0.11 0.88 0.65 2.9 2.9Dyer 0.829 0.271 0.914 0.166 0.35 2.53 2.53Fayette 0.8868 0.0964 0.6222 1.6054 1.6054Fentress 1.4289 0.285 0.14 0.13 1.9839 1.9839Franklin
cities except Sewanee; Winchester; Tullahoma 0.8989 0.0313 0.0629 1.0491 0.1072 0.2068 0.2433 2.5995 2.5995Sewanee; Winchester; Tullahoma 0.8989 0.0313 0.0629 1.0491 0.1072 0.2068 2.3562 2.3562outside cities 0.8989 0.0313 0.0629 1.0491 0.1072 0.2068 0.2433 0.0741 2.6736 2.6736
GibsonGibson Co. SSD 0.8184 0.13 0.02 0.9684 2.1515 3.1199Bradford SSD 0.8184 0.13 0.02 0.9684 1.82 2.7884Kenton SSD 0.8184 0.13 0.02 0.9684 2.1515 3.1199Milan SSD 0.8184 0.13 0.02 0.9684 1.8774 2.8458Trenton SSD 0.8184 0.13 0.02 0.9684 2.16 3.1284
Giles 1.1717 0.3864 1.1712 0.0418 2.7711 2.7711Grainger 1.19 0.17 0.73 0.18 0.20 0.03 2.50 2.5Greene
inside Greeneville 0.6553 0.1549 0.7753 0.0483 0.0275 1.6613 1.6613outside Greeneville 0.6553 0.1549 0.7753 0.2118 0.0483 0.0275 1.8731 1.8731
Grundy 1.5136 0.7147 0.13 0.18 2.5383 2.5383Hamblen
inside Morristown 0.49 0.96 0.31 1.76 1.76outside Morristown 0.49 0.96 0.31 0.23 1.99 1.99
Hamilton 1.3816 0.011 1.3726 2.7652 2.7652Hancock 1.21 0.64 0.10 0.27 2.22 2.22Hardeman 1.05 1.5 2.55 2.55Hardin 0.811 0.099 1.107 0.033 0.03 2.08 2.08Hawkins 0.74 0.135 0.87 0.30 0.34 0.08 2.465 2.465Haywood 1.2547 0 0.1181 0.9593 0.2279 2.56 2.56Henderson 1.0435 0.055 0.6223 0.23 0.275 0.15 2.3758 2.3758Henry
inside Paris SSD 0.5162 0.2441 1.1939 0.0422 0.0657 2.0621 0.556 2.6181outside Paris SSD 0.5162 0.2441 1.1939 0.0422 0.0657 2.0621 2.0621
Hickman 1.3837 0.07 0.85 0.2358 2.5395 2.5395Houston 1.89 0.01 0.53 0.16 0.6 3.19 3.19Humphreys
inside Waverly; McEwen; or New Johnsonville 0.77 0.2 0.76 0.18 0.04 0.2 2.15 2.15
Table 1 Property Tax Rate by Fund
FY 2016
5

outside Waverly; McEwen; or New Johnsonville 0.77 0.2 0.76 0.18 0.04 0.2 0.05 2.2 2.2
Jackson 1.41 0.11 1.02 0.02 0.29 2.85 2.85
Jefferson 0.87 0.20 0.89 0.22 0.02 0.15 2.35 2.35
Johnson 0.61 0.86 0.23 0.09 0.02 1.81 1.81
Knox 0.97 0.88 0.47 2.32 2.32
Lake 1.1193 0.0288 0.9553 0.1543 0.0588 2.3165 2.3165
Lauderdale 1.6588 0.2668 0.9628 0.0116 2.9 2.9
Lawrence 1.29 0.28 1 0.43 0.06 3.06 3.06
Lewis 1.5918 0.0398 0.635 0.0275 2.2941 2.2941
Lincoln 0.9958 0.1714 0.7883 0.1945 0.19 2.34 2.34
Loudoninside Lenoir City 0.47 0.013 0.0332 0.9263 0.069 0.01 0.0172 1.5387 1.5387
outside Lenoir City 0.47 0.013 0.0332 0.9263 0.32 0.069 0.01 0.0172 1.8587 1.8587
Macon 1.2923 0.1239 0.9303 0.0535 2.4 2.4
Madison 1.0333 0.0649 0.0844 0.343 0.1332 0.3265 0.1153 0.0494 2.15 2.15
Marioninside Richard City SSD 0.9871 0.7877 0.0902 0.1 1.965 1.965outside Richard City SSD 0.9871 0.7877 0.0902 0.2036 0.1 2.1686 2.1686
Marshall 0.93 0.08 1.67 0.01 0.4 0.13 3.22 3.22Maury 0.7159 0.1582 1.25 0.3347 0.0554 0.1058 2.62 2.62McMinn 0.4022 0.1341 0.7485 0.3307 1.6155 1.6155McNairy 0.79 0.09 0.99 0.22 2.09 2.09Meigs 1.325 0.6378 0.1398 0.07 2.1726 2.1726Monroe 0.9 0.0859 0.6336 0.3759 0.0988 2.0942 2.0942Montgomery 1.255 0.1137 0.838 0.0559 0.745 0.0624 3.07 3.07Moore
inside Urban Services District 0.89 0.015 1.19 0.16 0.115 0.1 2.47 2.47outside Urban Services District 0.85 0.015 1.19 0.16 0.115 0.1 2.43 2.43
Morgan 1.63 0.023 0.95 0.21 0.287 3.1 3.1Obion
inside Union City 0.3742 0.095 1.14 0.04 1.6492 1.6492outside Union City 0.3742 0.095 1.14 0.395 2.0042 2.0042
Overton 1.37 0.1 0.57 0.11 0.1 2.25 2.25Perry 1.24 0.82 0.07 0.27 2.4 2.4Pickett 1.16 0.47 0.09 0.15 1.87 1.87Polk 1.1545 0.73 0.3346 0.183 2.4021 2.4021Putnam 0.835 0.085 0.1 0.925 0.65 0.02 0.19 2.805 2.805Rhea 1.0467 0.03 0.4222 0.3545 0.2432 2.0966 2.0966Roane
inside Kingston; Midtown; Oliver Springs; and Rockwood 0.695 0.05 0.1 1.245 0.02 0.065 0.145 0.145 0.05 2.515 2.515inside Harriman 0.695 0.05 0.1 1.245 0.02 0.065 0.145 0.05 2.37 2.37inside city of Oak Ridge 0.695 0.05 0.1 1.245 0.065 0.145 0.05 2.35 2.35
outside Kingston; Midtown; Oliver Springs; Rockwood; Harriman; and Oak Ridge 0.695 0.11 0.1 1.245 0.02 0.065 0.145 0.145 0.05 2.575 2.575
Robertson 1.085 1.1 0.84 0.06 3.085 3.085Rutherford 0.6395 0.0661 0.0126 1.3435 0.05 0.5683 2.68 2.68
Table 1 Property Tax Rate by Fund
FY 2016
6

Scottinside Oneida SSD 1.044 0.86 0.09 0.09 0.51 2.594 0.27 2.864outside Oneida SSD 1.044 0.86 0.09 0.29 0.09 2.374 2.374
Sequatchie 1.2653 1.0233 0.13 0.15 2.5686 2.5686Sevier 0.535 0.19 0.965 0.16 0.03 1.88 1.88Shelby 1.45 2.14 0.78 4.37 4.37Smith 0.99 0.08 0.97 0.13 0.15 2.32 2.32Stewart 1.33 0.09 0.31 0.7188 2.4488 2.4488Sullivan 0.7715 0.0787 1.4708 0.0967 0.1377 0.0200 2.5754 2.5754Sumner 0.5535 0.0149 1.4539 0.3542 0.1235 2.5 2.5Tipton 0.84 0.07 1.15 0.36 2.42 2.42Trousdale
inside Hartsville 2.6999 0.93 0.09 0.2 0.32 4.2399 4.2399outside Hartsville 1.56 0.93 0.09 0.2 0.32 3.1 3.1
Unicoi 1.2413 0.0536 0.7827 0.4968 0.1094 2.6838 2.6838Union 0.92 0.135 0.09 0.75 0.21 0.065 2.17 2.17Van Buren 1.05 0.1495 0.55 0.0454 0.035 0.1 1.9299 1.9299Warren 0.8935 0.16 0.08 0.5726 0.22 0.04 1.9661 1.9661Washington 0.6885 0.1470 0.7956 0.3237 0.0250 1.9798 1.9798Wayne 0.685 0.015 0.71 0.37 0.29 2.07 2.07Weakley 0.708 0.207 0.7 0.51 0.0052 2.1302 2.1302White 1.19 0.75 0.11 2.05 2.05Williamson
5th and 9th districts inside city limits of Franklin and Franklin SSD 0.41 1.29 0.3 2 1.0541 3.05419th district outside Franklin city limits and Franklin SSD 0.41 0.05 1.29 0.3 0.06 2.11 1.0541 3.1641
inside cities of Brentwood; Fairview; Spring Hill; Thompson's Station; Nolensville 0.41 1.29 0.3 0.2 0.06 2.26 2.26inside Franklin city limits - no Franklin SSD 0.41 1.29 0.3 0.2 2.2 2.2
outside jurisdictions above 0.41 0.05 1.29 0.3 0.2 0.06 2.31 2.31
Wilsoninside Lebanon SSD 0.8408 0.1308 1.285 0.2074 0.0539 0.0525 2.5704 0.45 3.0204outside Lebanon SSD 0.8408 0.1308 1.285 0.2074 0.0539 0.0525 2.5704 2.5704
Notes on special revenue/special purpose funds
Anderson Anderson County special revenue fund is for the public library.Bradley Special purpose fund inside urban fringe is $.4212 for the fire district and $.0509 for community development;
Special purpose fund outside urban fringe is $.344 for the fire district and $.0509 for community development.
Bradley County special revenue fund is for the public library; special purpose fund inside Charleston and Cleveland is for community development fund.
Campbell Campbell County special revenue fund is $.0175 for ambulance service and $.0303 for economic development.Cannon Cannon County special revenue fund is for ambulance service.Cheatham Cheatham County special purpose funds for fire districts.Claiborne Claiborne special purpose fund is for industrial development.Cocke Cocke County special revenue fund is $.01 for economic development.Coffee Coffee County special purpose fund outside cities is for industrial development; special revenue fund is for ambulance service.Franklin Franklin County special revenue fund is for the library; local purpose tax outside cities is for rural fire.
Table 1 Property Tax Rate by Fund
FY 2016
7

Grainger Grainger County special purpose fund is for parks and recreation.Greene Greene County special purpose fund is for self-insurance.Humphreys Humphreys County special revenue fund is for the fire tax district.Lewis Lewis County special revenue fund is for sports and recreation.Loudon Loudon County special revenue fund is for public library.Putnam Putnam County special revenue fund is .0300 for industrial development and .0550 for sports and recreation.Roane Inside the city of Oak Ridge special revenue fund is $.02 for ambulance service and .03 for the recycling center.
Roane County special revenue fund outside cities is $.02 for ambulance service; $.06 for fire services and animal control; and $.03 for the recycling center.Inside the city of Harriman special revenue fund is $.02 for ambulance service and .03 for the recycling center.Inside cities of Kingston;Oliver Springs; and Rockwood special revenue fund is $.02 for ambulance service and .03 for the recycling center.
Rutherford Rutherford County special revenue fund is for ambulance service.Scott Scott County special purpose fund within Oneida SSD is Oneida Public Debt ServiceSevier Sevier County special purpose fund is for short-lived capital assets.Trousdale Trousdale County and the city of Hartsville are a consolidated government; the tax rate inside Hartsville is not broken out by fund type.Union Union County special revenue fund is for the ambulance fund.
Van Buren Van Buren special revenue fund is $.1495 for ambulance service; local purpose tax of $.10 is for the volunteer fire department.Warren Warren County special revenue fund is for the ambulance service.Wilson Wilson County special revenue fund is for the Ag Center.
Table 1 Property Tax Rate by Fund
FY 2016
8

County FY 2015 FY2016 Rate Percentage 1 Roane $ 2.0561 $ 2.5750 0.519 25.24%2 Blount $ 2.1238 $ 2.6200 0.496 23.36%
3 Union $ 1.7900 $ 2.1700 0.380 21.23%4 Lincoln $ 1.9600 $ 2.3400 0.380 19.39%5 Meigs $ 1.8726 $ 2.1726 0.300 16.02%6 Sevier $ 1.6300 $ 1.8800 0.250 15.34%7 Hardin $ 1.8200 $ 2.0800 0.260 14.29%8 Hamblen $ 1.7584 $ 1.9900 0.232 13.17%9 Campbell $ 1.9900 $ 2.2500 0.260 13.07%
10 Overton $ 1.9900 $ 2.2500 0.260 13.07%11 Anderson $ 2.4945 $ 2.7903 0.296 11.86%12 Lawrence $ 2.7386 $ 3.0600 0.321 11.74%13 Sullivan $ 2.3054 $ 2.5754 0.270 11.71%14 White $ 1.8500 $ 2.0500 0.200 10.81%15 DeKalb $ 1.6200 $ 1.7800 0.160 9.88%16 Rutherford $ 2.4867 $ 2.6800 0.193 7.77%17 Haywood $ 2.3956 $ 2.5600 0.164 6.86%18 Cannon $ 2.5300 $ 2.6800 0.150 5.93%19 Scott $ 2.2540 $ 2.3740 0.120 5.32%
20 Benton $ 2.8126 $ 2.9500 0.137 4.89%21 Lake $ 2.2165 $ 2.3165 0.100 4.51%22 Cheatham $ 2.7800 $ 2.9010 0.121 4.35%23 Robertson $ 2.9600 $ 3.0850 0.125 4.22%24 Gibson $ 0.9334 $ 0.9684 0.035 3.75%25 Montgomery $ 2.9747 $ 3.0700 0.095 3.20%26 Cumberland $ 1.4975 $ 1.5275 0.030 2.00%27 Dyer $ 2.5000 $ 2.5300 0.030 1.20%28 Tipton $ 2.4169 $ 2.4200 0.003 0.13%29 Bedford $ 2.2700 $ 2.2700 0.000 0.00%30 Bledsoe $ 2.2162 $ 2.2162 0.000 0.00%31 Carroll $ 1.4854 $ 1.4854 0.000 0.00%32 Carter $ 2.4500 $ 2.4500 0.000 0.00%33 Chester $ 2.5202 $ 2.5202 0.000 0.00%34 Claiborne $ 2.4800 $ 2.4800 0.000 0.00%35 Clay $ 3.1000 $ 3.1000 0.000 0.00%36 Cocke $ 2.5872 $ 2.5872 0.000 0.00%37 Coffee $ 3.5429 $ 3.5429 0.000 0.00%38 Crockett $ 2.6400 $ 2.6400 0.000 0.00%39 Davidson $ 4.5160 $ 4.5160 0.000 0.00%40 Decatur $ 1.9900 $ 1.9900 0.000 0.00%41 Dickson $ 2.9000 $ 2.9000 0.000 0.00%42 Fayette $ 1.6054 $ 1.6054 0.000 0.00%43 Fentress $ 1.9839 $ 1.9839 0.000 0.00%44 Franklin $ 2.6736 $ 2.6736 0.000 0.00%45 Giles $ 2.7711 $ 2.7711 0.000 0.00%46 Grainger $ 2.5000 $ 2.5000 0.000 0.00%47 Greene $ 1.8731 $ 1.8731 0.000 0.00%48 Grundy $ 2.5383 $ 2.5383 0.000 0.00%49 Hamilton $ 2.7652 $ 2.7652 0.000 0.00%50 Hancock $ 2.2200 $ 2.2200 0.000 0.00%51 Hardeman $ 2.5500 $ 2.5500 0.000 0.00%52 Hawkins $ 2.4650 $ 2.4650 0.000 0.00%53 Henderson $ 2.3758 $ 2.3758 0.000 0.00%54 Henry $ 2.0621 $ 2.0621 0.000 0.00%
Table 2 Property Tax Comparisons from FY 2015 to FY 2016
9

55 Hickman $ 2.5395 $ 2.5395 0.000 0.00%56 Houston $ 3.1900 $ 3.1900 0.000 0.00%57 Jackson $ 2.8500 $ 2.8500 0.000 0.00%58 Jefferson $ 2.3500 $ 2.3500 0.000 0.00%59 Johnson $ 1.8100 $ 1.8100 0.000 0.00%60 Knox $ 2.3200 $ 2.3200 0.000 0.00%61 Lauderdale $ 2.9000 $ 2.9000 0.000 0.00%62 Lewis $ 2.2941 $ 2.2941 0.000 0.00%63 Loudon $ 1.8587 $ 1.8587 0.000 0.00%64 Madison $ 2.1500 $ 2.1500 0.000 0.00%65 Marion $ 2.1686 $ 2.1686 0.000 0.00%66 Marshall $ 3.2200 $ 3.2200 0.000 0.00%67 Maury $ 2.6200 $ 2.6200 0.000 0.00%68 McMinn $ 1.6155 $ 1.6155 0.000 0.00%69 McNairy $ 2.0900 $ 2.0900 0.000 0.00%70 Monroe $ 2.0942 $ 2.0942 0.000 0.00%71 Moore $ 2.4300 $ 2.4300 0.000 0.00%72 Morgan $ 3.1000 $ 3.1000 0.000 0.00%73 Obion $ 2.0042 $ 2.0042 0.000 0.00%74 Pickett $ 1.8700 $ 1.8700 0.000 0.00%75 Polk $ 2.4021 $ 2.4021 0.000 0.00%76 Putnam $ 2.8050 $ 2.8050 0.000 0.00%77 Rhea $ 2.0966 $ 2.0966 0.000 0.00%78 Sequatchie $ 2.5686 $ 2.5686 0.000 0.00%79 Shelby $ 4.3700 $ 4.3700 0.000 0.00%80 Smith $ 2.3200 $ 2.3200 0.000 0.00%81 Stewart $ 2.4488 $ 2.4488 0.000 0.00%82 Sumner $ 2.5000 $ 2.5000 0.000 0.00%83 Unicoi $ 2.6838 $ 2.6838 0.000 0.00%84 Van Buren $ 1.9299 $ 1.9299 0.000 0.00%85 Warren $ 1.9661 $ 1.9661 0.000 0.00%86 Washington $ 1.9798 $ 1.9798 0.000 0.00%87 Wayne $ 2.0700 $ 2.0700 0.000 0.00%88 Weakley $ 2.1302 $ 2.1302 0.000 0.00%89 Williamson $ 2.3100 $ 2.3100 0.000 0.00%90 Wilson $ 2.5704 $ 2.5704 0.000 0.00%91 Macon $ 2.4001 $ 2.4000 -0.000 -0.00%92 Bradley $ 2.2933 $ 2.2923 -0.001 -0.04%93 Perry $ 2.4021 $ 2.4000 -0.002 -0.09%94 Trousdale $ 3.1200 $ 3.1000 -0.020 -0.64%95 Humphreys $ 2.2200 $ 2.2000 -0.020 -0.90%
Notes: Reappraisals occurred in Anderson, Benton, Blount, Carroll, Cocke, Hamblen, Henry, Lewis, Overton, Perry, Roane, Stewart, Van Buren, Warren, and White counties. For comparison purposes, rates for FY 2015 are certified rates.
Rates are county rates outside cities and urban and special districts. Davidson is USD rate.
Table 2 Property Tax Comparisons from FY 2015 to FY 2016
10
County Revenue County Revenue1 Anderson $ 164,826 49 Lauderdale $ 34,601 2 Bedford $ 81,897 50 Lawrence $ 59,221 3 Benton $ 24,198 51 Lewis $ 17,162 4 Bledsoe $ 20,500 52 Lincoln $ 57,395 5 Blount $ 331,794 53 Loudon $ 169,462 6 Bradley $ 203,407 54 Macon $ 33,617 7 Campbell $ 75,025 55 Madison $ 208,672 8 Cannon $ 21,748 56 Marion $ 66,734 9 Carroll $ 37,040 57 Marshall $ 54,385
10 Carter $ 84,903 58 Maury $ 173,494 11 Cheatham $ 73,723 59 Mcminn $ 111,586 12 Chester $ 22,699 60 Mcnairy $ 40,154 13 Claiborne $ 53,332 61 Meigs $ 21,794 14 Clay $ 11,269 62 Monroe $ 102,875 15 Cocke $ 63,103 63 Montgomery $ 355,399 16 Coffee $ 101,952 64 Moore $ 22,898 17 Crockett $ 21,962 65 Morgan $ 28,321 18 Cumberland $ 143,778 66 Obion $ 60,382 19 Davidson $ 2,029,633 67 Overton $ 32,791 20 Decatur $ 22,769 68 Perry $ 16,630 21 Dekalb $ 47,790 69 Pickett $ 12,489 22 Dickson $ 97,731 70 Polk $ 31,557 23 Dyer $ 65,854 71 Putnam $ 144,073 24 Fayette $ 95,280 72 Rhea $ 62,856 25 Fentress $ 30,630 73 Roane $ 130,209 26 Franklin $ 89,813 74 Robertson $ 136,658 27 Gibson $ 76,734 75 Rutherford $ 605,001 28 Giles $ 54,708 76 Scott $ 33,287 29 Grainger $ 35,233 77 Sequatchie $ 28,056 30 Greene $ 129,745 78 Sevier $ 358,989 31 Grundy $ 21,639 79 Shelby $ 1,787,813 32 Hamblen $ 145,733 80 Smith $ 34,654 33 Hamilton $ 870,074 81 Stewart $ 27,973 34 Hancock $ 10,122 82 Sullivan $ 370,294 35 Hardeman $ 36,782 83 Sumner $ 417,211 36 Hardin $ 70,025 84 Tipton $ 97,037 37 Hawkins $ 104,549 85 Trousdale $ 13,320 38 Haywood $ 40,234 86 Unicoi $ 31,685 39 Henderson $ 40,322 87 Union $ 33,292 40 Henry $ 56,782 88 Van Buren $ 15,421 41 Hickman $ 37,000 89 Warren $ 69,318 42 Houston $ 12,919 90 Washington $ 291,953 43 Humphreys $ 44,233 91 Wayne $ 27,075 44 Jackson $ 16,922 92 Weakley $ 49,013 45 Jefferson $ 114,522 93 White $ 41,096 46 Johnson $ 31,517 94 Williamson $ 887,854
47 Knox $ 1,103,786 95 Wilson $ 320,004
48 Lake $ 8,818 Statewide $ 14,804,815
Table 3 Amount of Property Tax Revenue Generated on One Cent of the Property Tax Rate
2015
2014 Tax Aggregate Report of Tennessee, State Board of Equalization.
11
County Local Option Sales Taxes 1
Any county by resolution of its legislative body can levy a sales tax on the same privileges subject to the state sales tax; however, no local sales tax or rate increase in the local sales tax can become effective until approved in an election in the county or city levying it (all counties now levy local option sales taxes). The same exemptions generally apply to the local option sales tax as apply to the state sales tax.
If the county has levied the maximum rate of 2.75 percent, no city in the county can levy a sales tax. If a county has a sales tax rate less than the maximum, a city may levy a rate up to the difference between the county rate and the maximum.
Additionally, the local option sales tax may only apply to single purchases of tangible personal property up to $1,600. This limitation results in a “cap” on the local option sales tax that can be collected on taxable single articles. The cap is calculated as the base (the limitation on single purchases as adopted by the county) multiplied by the rate. For example, a county that has adopted the maximum base of $1,600 with a rate in place of 2.25 percent would have a tax cap of $36 on any single article of purchase.
The limit has been modified several times since the local option sales tax was authorized in 1963. The first base limit was a fixed $5 cap on a single article. In 1968, the limit was increased to $7.50. In 1983, the base limit was changed to allow the local option sales tax to be applied to up to $667 of a single article. The cap at that point became a function of the single article limitation (which could be adopted by resolution of the county legislative body) and the local option sales tax rate. Since 1983, the single article limit, or base, has been expanded three times: to $889 in 1984; to $1,100 in 1985; and to the current level of $1,600 in 1990. In 2002, the General Assembly raised the state sales tax to 7 percent (the rate on non-prepared food items is set at 5.25 percent). At that time, the state also levied an additional 2.75 percent state sales tax on a single article purchase in excess of $1,600 up to $3,200. Therefore, on non-food purchases, the rate is 7 percent plus the local option rate on the first $1,600 of a single item, a 9.75 percent state rate on the amount in excess of $1,600 up to $3,200, and 7 percent on the amount of the purchase in excess of $3,200.
The required distribution of county local option sales taxes revenues (regardless of the location of the sales) is 50 percent to education in the same manner as the property tax and 50 percent to the location where the sales occurred. 2
Table 4 shows local option sales tax rates, bases, and caps, and the dates they went into effect. As of the publication of this document, the current rates are as follows: 49 counties are at 2.75 percent; 11 are at 2.50 percent; 28 counties are at 2.25 percent; 5 counties have rates of 2.00 percent; 1 is at 1.75 percent; and 1 is at 1.50 percent. Three counties have not yet adopted the maximum base of $1,600; two remain at the level of $7.50 and one at $8.25.
Table 5 shows countywide local option sales tax collections for fiscal year 2015 as reported by the Tennessee Department of Revenue in its June 2015 Monthly Collections Report. The collections figures can enable a simple calculation of potential additional local sales tax revenue that might be generated by increasing the existing rate if it is not currently at the maximum. For example, if the current rate is 2.25 percent, divide 2.75 percent by 2.25 percent. The result is 1.22, a factor that can be applied to current collections. If collections in the county with the 2.25 percent rate are $2.0 million, then multiply 1.22 by $2.0 million. The estimated collections
The legal authority for the local option sales tax is T.C.A. §§ 67-6-701 et seq.1
T.C.A. §67-6-7122
12
at the new rate are therefore approximately $2.44 million, or an additional $440,000. Caution should be used in making budgetary plans based on collections information. Data should be the most current and any foreseeable adverse economic event should be considered. For additional detail on the local option sales tax, refer to the CTAS Web site, www.ctas.tennessee.edu and click on e-Li, the CTAS electronic library and type in “local option sales tax” in the search box under “Ask e-Li.” Additional information can be found at http://tn.gov/revenue/statistics/index.shtml where theTennessee Dept. of Revenue has up-to-date information on local option sales tax rates at http://tn.gov/revenue/pubs/taxlist.pdf along with monthly collections reports.
13
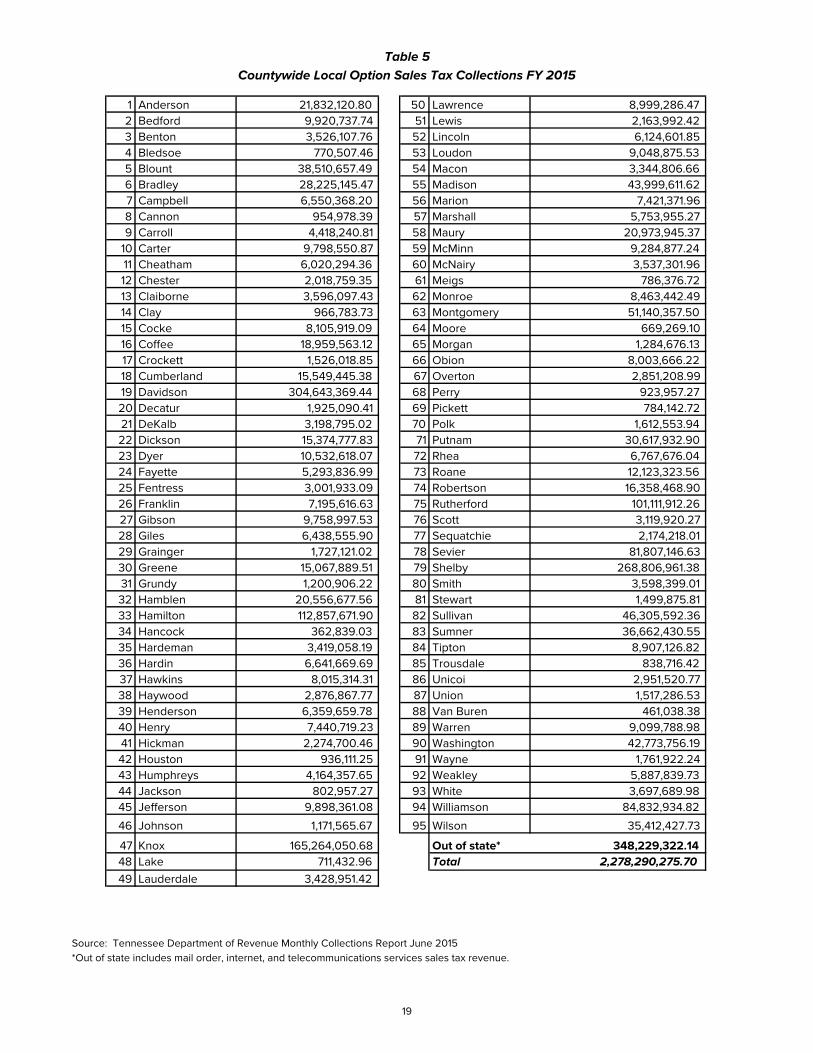
Table 5Countywide Local Option Sales Tax Collections FY 2015
Source: Tennessee Department of Revenue Monthly Collections Report June 2015*Out of state includes mail order, internet, and telecommunications services sales tax revenue.
1 Anderson 21,832,120.80 50 Lawrence 8,999,286.472 Bedford 9,920,737.74 51 Lewis 2,163,992.423 Benton 3,526,107.76 52 Lincoln 6,124,601.854 Bledsoe 770,507.46 53 Loudon 9,048,875.535 Blount 38,510,657.49 54 Macon 3,344,806.666 Bradley 28,225,145.47 55 Madison 43,999,611.627 Campbell 6,550,368.20 56 Marion 7,421,371.968 Cannon 954,978.39 57 Marshall 5,753,955.279 Carroll 4,418,240.81 58 Maury 20,973,945.37
10 Carter 9,798,550.87 59 McMinn 9,284,877.2411 Cheatham 6,020,294.36 60 McNairy 3,537,301.9612 Chester 2,018,759.35 61 Meigs 786,376.7213 Claiborne 3,596,097.43 62 Monroe 8,463,442.4914 Clay 966,783.73 63 Montgomery 51,140,357.5015 Cocke 8,105,919.09 64 Moore 669,269.1016 Coffee 18,959,563.12 65 Morgan 1,284,676.1317 Crockett 1,526,018.85 66 Obion 8,003,666.2218 Cumberland 15,549,445.38 67 Overton 2,851,208.9919 Davidson 304,643,369.44 68 Perry 923,957.2720 Decatur 1,925,090.41 69 Pickett 784,142.7221 DeKalb 3,198,795.02 70 Polk 1,612,553.9422 Dickson 15,374,777.83 71 Putnam 30,617,932.9023 Dyer 10,532,618.07 72 Rhea 6,767,676.0424 Fayette 5,293,836.99 73 Roane 12,123,323.5625 Fentress 3,001,933.09 74 Robertson 16,358,468.9026 Franklin 7,195,616.63 75 Rutherford 101,111,912.2627 Gibson 9,758,997.53 76 Scott 3,119,920.2728 Giles 6,438,555.90 77 Sequatchie 2,174,218.0129 Grainger 1,727,121.02 78 Sevier 81,807,146.6330 Greene 15,067,889.51 79 Shelby 268,806,961.3831 Grundy 1,200,906.22 80 Smith 3,598,399.0132 Hamblen 20,556,677.56 81 Stewart 1,499,875.8133 Hamilton 112,857,671.90 82 Sullivan 46,305,592.3634 Hancock 362,839.03 83 Sumner 36,662,430.5535 Hardeman 3,419,058.19 84 Tipton 8,907,126.8236 Hardin 6,641,669.69 85 Trousdale 838,716.4237 Hawkins 8,015,314.31 86 Unicoi 2,951,520.7738 Haywood 2,876,867.77 87 Union 1,517,286.5339 Henderson 6,359,659.78 88 Van Buren 461,038.3840 Henry 7,440,719.23 89 Warren 9,099,788.9841 Hickman 2,274,700.46 90 Washington 42,773,756.1942 Houston 936,111.25 91 Wayne 1,761,922.2443 Humphreys 4,164,357.65 92 Weakley 5,887,839.7344 Jackson 802,957.27 93 White 3,697,689.9845 Jefferson 9,898,361.08 94 Williamson 84,832,934.82
46 Johnson 1,171,565.67 95 Wilson 35,412,427.73
47 Knox 165,264,050.68 Out of state* 348,229,322.1448 Lake 711,432.96 Total 2,278,290,275.7049 Lauderdale 3,428,951.42
19

County Motor Vehicle Tax 1
Counties may levy a tax on motor vehicles (wheel tax) by any of the following methods: passage of a resolution by a two-thirds vote of the county legislative body at two consecutive regular county legislative body meetings; by passage of a resolution by the county legislative body by a regular majority with approval and referendum provided for in the resolution; and, by private act. Even a resolution that does not provide for a referendum is subject to a referendum if a petition signed by registered voters amounting to 10 percent of the votes cast in the last gubernatorial election (10 percent of the total registered voters in Shelby County) is filed with the county election commission within 30 days of final passage.
The rates are set forth in the resolutions or private acts. The distribution may be designated for any county purpose specified by the resolution or private act.
As of the date of this publication, 59 counties impose the county motor vehicle tax with rates ranging from $10.00 to $110.00, as shown in Table 6. Thirty-six of these counties have rates of $40.00 or greater.
Table 7 provides the number of motor vehicle registrations in each county and may be used to estimate potential revenues generated from the imposition or increase in the motor vehicle registration tax. These data include, however, vehicles exempt by statute from taxation and should be adjusted accordingly.
The legal authority for the county motor vehicle tax is T.C.A. § 5-8-102.1
20

1 Anderson N/A 49 Lauderdale $65.00 2 Bedford N/A 50 Lawrence $25.00 3 Benton N/A 51 Lewis $20.00 4 Bledsoe N/A 52 Lincoln $75.00 5 Blount N/A 53 Loudon N/A6 Bradley N/A 54 Macon $65.00/$45.007 Campbell $75.00 55 Madison N/A8 Cannon $50.25 56 Marion N/A9 Carroll $55.00 57 Marshall $50.00
10 Carter N/A 58 Maury $25.00 11 Cheatham $51.00 59 McMinn N/A12 Chester $65.35 60 McNairy N/A13 Claiborne $25.00 61 Meigs N/A14 Clay $25.00 62 Monroe $25.00 15 Cocke N/A 63 Montgomery $30.50 16 Coffee N/A 64 Moore N/A17 Crockett $73.50 65 Morgan N/A18 Cumberland N/A 66 Obion $40.00 19 Davidson $55.00 67 Overton $30.50 20 Decatur $110.00 68 Perry N/A21 DeKalb N/A 69 Pickett $10.00 22 Dickson $60.00 70 Polk N/A23 Dyer $60.15 71 Putnam N/A24 Fayette $71.00 72 Rhea N/A25 Fentress $25.00 73 Roane N/A26 Franklin N/A 74 Robertson $85.25 27 Gibson $35.75 75 Rutherford $52.50 28 Giles N/A 76 Scott $30.00 29 Grainger N/A 77 Sequatchie N/A30 Greene $55.00 78 Sevier N/A31 Grundy N/A 79 Shelby $50.00 32 Hamblen $27.00 80 Smith $65.00 33 Hamilton N/A 81 Stewart $35.00 34 Hancock $20.00 82 Sullivan N/A35 Hardeman $80.00 83 Sumner $51.00 36 Hardin $47.00 84 Tipton $61.00 37 Hawkins $27.00 85 Trousdale $40.00 38 Haywood $90.00 86 Unicoi N/A39 Henderson $60.00 87 Union $30.00 40 Henry $15.50 88 Van Buren N/A41 Hickman $50.50 89 Warren $30.00 42 Houston $45.50 90 Washington N/A43 Humphreys N/A 91 Wayne $61.00 44 Jackson $41.00 92 Weakley $40.00 45 Jefferson $50.00/$30.00 93 White $42.00 46 Johnson $40.00 94 Williamson $25.75 47 Knox $36.00 95 Wilson $25.00 48 Lake $75.00/$37.75
Table 6 County Motor Vehicle Tax Rates
FY 2016
Source: http://tn.gov/revenue/vehicle/countyclerks.shtml Note: counties with two rates show are vehicles and motorcycles.
21

Table 7Motor Vehicle Registrations
2015
1 Anderson 97,689 51 Lewis 12,9622 Bedford 59,818 52 Lincoln 37,5373 Benton 20,342 53 Loudon 60,8174 Bledsoe 15,081 54 McMinn 61,6445 Blount 169,668 55 McNairy 29,5926 Bradley 108,034 56 Macon 25,2957 Campbell 41,057 57 Madison 98,4608 Cannon 16,246 58 Marion 37,1469 Carroll 28,032 59 Marshall 33,70010 Carter 61,582 60 Maury 93,00511 Cheatham 51,056 61 Meigs 15,39412 Chester 15,696 62 Monroe 49,32513 Claiborne 36,958 63 Montgomery 186,87114 Clay 9,379 64 Moore 7,56015 Cocke 36,569 65 Morgan 22,00816 Coffee 65,153 66 Obion 32,26917 Crockett 14,531 67 Overton 24,03018 Cumberland 69,668 68 Perry 10,24919 Davidson 698,837 69 Pickett 7,28420 Decatur 13,412 70 Polk 19,67621 DeKalb 22,113 71 Putnam 86,60422 Dickson 54,013 72 Rhea 37,78923 Dyer 35,097 73 Roane 56,05424 Fayette 44,623 74 Robertson 75,26525 Fentress 21,168 75 Rutherford 260,85826 Franklin 45,586 76 Scott 23,15327 Gibson 47,716 77 Sequatchie 22,20128 Giles 36,079 78 Sevier 112,76629 Grainger 30,585 79 Shelby 773,77730 Greene 105,429 80 Smith 22,18431 Grundy 16,638 81 Stewart 15,02532 Hamblen 66,079 82 Sullivan 176,27733 Hamilton 671,416 83 Sumner 162,84334 Hancock 7,205 84 Tipton 59,25735 Hardeman 23,405 85 Trousdale 9,98936 Hardin 29,159 86 Unicoi 20,90337 Hawkins 60,525 87 Union 18,86838 Haywood 16,466 88 Van Buren 6,44239 Henderson 28,927 89 Warren 42,24340 Henry 36,901 90 Washington 135,73341 Hickman 25,315 91 Wayne 17,42142 Houston 9,025 92 Weakley 31,82943 Humphreys 24,688 93 White 29,77844 Jackson 12,253 94 Williamson 198,99145 Jefferson 85,069 95 Wilson 131,99646 Johnson 20,663 Statewide 7,134,147 47 Knox 462,48448 Lake 4,458 Total Registrations49 Lauderdale 22,343 as of February 28, 201650 Lawrence 46,841
Source: TN Department of Revenue. Total registrations as of February 28,2016. Nothing has been eliminated from these tallies. Includes permanentvehicle registrations, 18-wheeler trailer plates, as well as all apportionedlicense plates.
�1
24

Hotel/Motel Tax
Seventy-seven counties levy the hotel/motel tax, which is authorized by private act on the privilege of occupancy of hotel and motel rooms. (Davidson County is the exception as it has utilized a general law that applies only to metropolitan governments.) Rates vary according to the terms of the private act. Currently, rates are imposed ranging from 2 percent to 8 percent of the price of the lodgings. The distribution of the tax is set forth in the private act. The rates and distributions are shown in Table 8.
Since May 12, 1988, any private act which authorizes a city or county (Dickson, Rutherford, Shelby, and Williamson counties excepted) to levy a tax on the privilege of occupancy of a hotel must limit the application of the tax as follows:
1. A city shall only levy such tax on occupancy of hotels located within its municipal boundaries;
2. A city shall not be authorized to levy such tax on occupancy of hotels if the county in which such city is located has levied such tax prior to the adoption of the tax by the city; and
3. A county shall only levy such tax on occupancy of hotels located within its boundaries but outside the boundaries of any municipality that has levied a tax on such occupancy prior to the adoption of such tax by the county. 1
These limitations only apply prospectively and all private acts levying taxes on the privilege of occupancy of hotels enacted prior to May 12, 1988, shall remain in full force and effect. Note that home rule municipalities have separate general law authority to levy hotel/motel taxes. As these taxes are not levied by private act, the limitations listed above do not apply to hotel/motel taxes levied by a home rule municipality.
T.C.A. § 67-4-1425 1
25
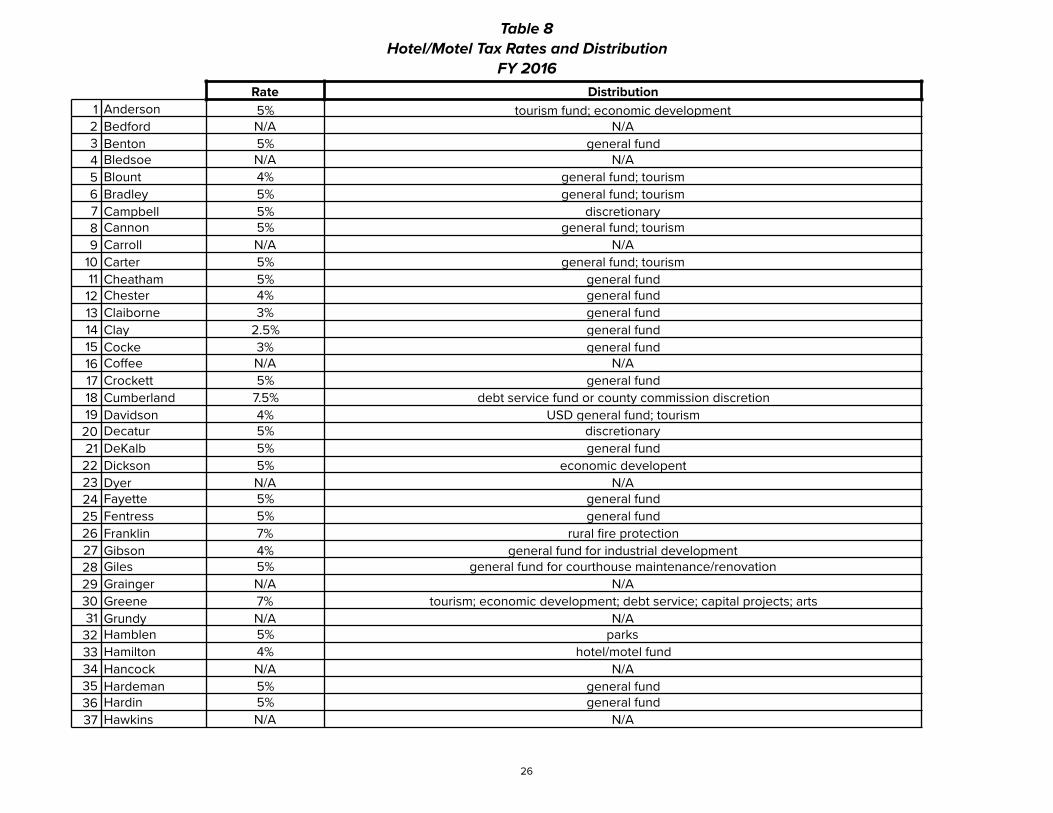
Rate Distribution1 Anderson 5% tourism fund; economic development2 Bedford N/A N/A3 Benton 5% general fund4 Bledsoe N/A N/A5 Blount 4% general fund; tourism6 Bradley 5% general fund; tourism7 Campbell 5% discretionary8 Cannon 5% general fund; tourism9 Carroll N/A N/A
10 Carter 5% general fund; tourism11 Cheatham 5% general fund12 Chester 4% general fund13 Claiborne 3% general fund14 Clay 2.5% general fund15 Cocke 3% general fund16 Coffee N/A N/A17 Crockett 5% general fund18 Cumberland 7.5% debt service fund or county commission discretion19 Davidson 4% USD general fund; tourism
20 Decatur 5% discretionary21 DeKalb 5% general fund22 Dickson 5% economic developent23 Dyer N/A N/A24 Fayette 5% general fund25 Fentress 5% general fund26 Franklin 7% rural fire protection27 Gibson 4% general fund for industrial development28 Giles 5% general fund for courthouse maintenance/renovation29 Grainger N/A N/A30 Greene 7% tourism; economic development; debt service; capital projects; arts31 Grundy N/A N/A32 Hamblen 5% parks33 Hamilton 4% hotel/motel fund34 Hancock N/A N/A35 Hardeman 5% general fund36 Hardin 5% general fund37 Hawkins N/A N/A
Table 8 Hotel/Motel Tax Rates and Distribution
FY 2016
26

38 Haywood 5% city of Brownsville; general fund39 Henderson 5% general fund; fire department40 Henry 5% general fund41 Hickman 5% general fund42 Houston 5% general fund43 Humphreys 5% general fund44 Jackson N/A N/A45 Jefferson 4% general fund46 Johnson 5% general fund47 Knox 5% tourism; general fund; city of Knoxville48 Lake 7.5% general fund49 Lauderdale 5% general fund50 Lawrence 5% general fund for economic development51 Lewis 5% general fund52 Lincoln 5% general fund; tourism53 Loudon 5% general fund54 Macon N/A N/A55 Madison 5% city of Jackson; community economic development commission; general fund56 Marion 5% education57 Marshall 7% general fund58 Maury 5% industrial development; tourism; beautification and recreation59 McMinn 5% tourism; economic development60 McNairy N/A N/A61 Meigs 5% general fund62 Monroe 5% industrial development; tourism63 Montgomery 3% tourism; general fund; city of Clarksville64 Moore 3% general fund65 Morgan N/A N/A66 Obion 5% general fund for Reelfoot Lake tourism67 Overton 5% tourism68 Perry 5% discretionary69 Pickett N/A N/A70 Polk 3% general fund; debt service; economic development71 Putnam 6% debt service fund; Chamber of Commerce; recreation72 Rhea 2% tourism; economic development73 Roane 5% industrial/economic development74 Robertson 7% industrial development board75 Rutherford 2.5% general fund for tourism; debt service fund; county commission discretion
Table 8 Hotel/Motel Tax Rates and Distribution
FY 2016
27

76 Scott 5% general fund77 Sequatchie 2% general fund78 Sevier 3% N/A79 Shelby 5% convention center; convention and visitors bureau; arena80 Smith N/A N/A81 Stewart 5% general fund82 Sullivan N/A N/A83 Sumner 5% general fund84 Tipton 5% general fund for industrial development85 Trousdale N/A N/A86 Unicoi 5% general fund87 Union 5% tourist-related activities88 Van Buren 7% general fund; education capital outlay fund; city of Spencer89 Warren 5% debt service90 Washington N/A N/A91 Wayne N/A N/A92 Weakley 5% general fund93 White 5% general fund94 Williamson 4% general fund95 Wilson 3% general fund; county commission discretion
Table 8 Hotel/Motel Tax Rates and Distribution
FY 2016
28

County Mineral Severance Tax
By a two-thirds vote, counties may levy a tax on all sand, gravel, sandstone, chert, and limestone severed from the ground within the county at a rate of up to $0.15 per ton. Prior to 1984, the county mineral severance tax could be authorized by private act only. Private acts in existence when the general law was passed remain in effect for all purposes, except that the rate may not exceed $0.15 per ton. Counties who levied the tax under the general law are required to distribute the tax to the county highway fund. 1
As shown in Table 9, 68 counties impose county mineral severance taxes. Of those 68, 58 counties allocate the proceeds to the county highway fund, eight counties allocate the proceeds to the county general fund with one designating the funds for roads from the general fund, one county allocates the proceeds to education and one to debt service. Sixty-three counties impose the maximum rate of $0.15; one county is at $.14; three counties are at $0.10; and one county is at $0.05.
T.C.A. §§ 67-7-201 through 67-7-2211
29

Table 9Mineral Severance Tax Rates and Distribution
FY 2016
County Rate Distribution1 Anderson $0.15 highway fund
2 Bedford $0.15 highway fund3 Benton $0.10 highway fund4 Bledsoe $0.15 highway fund5 Blount $0.15 highway fund6 Bradley N/A N/A7 Campbell $0.15 highway fund8 Cannon $0.10 highway fund9 Carroll $0.15 highway fund
10 Carter $0.15 highway fund11 Cheatham $0.15 highway fund
12 Chester N/A N/A13 Claiborne $0.15 highway fund14 Clay $0.15 highway fund15 Cocke $0.15 highway fund16 Coffee $0.15 highway fund17 Crockett N/A N/A18 Cumberland $0.15 highway fund19 Davidson $0.15 general fund for roads
20 Decatur $0.15 general fund21 DeKalb $0.15 highway fund22 Dickson $0.15 debt service23 Dyer N/A N/A24 Fayette $0.15 highway fund25 Fentress $0.15 highway fund26 Franklin $0.15 highway fund27 Gibson N/A N/A28 Giles $0.15 general fund29 Grainger $0.14 highway fund30 Greene $0.15 highway fund31 Grundy N/A N/A
32 Hamblen $0.15 highway fund33 Hamilton N/A N/A34 Hancock N/A N/A35 Hardeman N/A N/A36 Hardin $0.15 highway fund37 Hawkins $0.15 highway fund38 Haywood $0.15 highway fund39 Henderson N/A N/A40 Henry N/A N/A41 Hickman $0.15 highway fund
42 Houston N/A N/A43 Humphreys $0.05 general fund44 Jackson $0.15 highway fund45 Jefferson N/A N/A46 Johnson $0.15 highway fund47 Knox N/A N/A48 Lake N/A N/A49 Lauderdale N/A N/A50 Lawrence $0.15 highway fund51 Lewis N/A N/A52 Lincoln $0.15 highway fund53 Loudon $0.15 highway fund54 Macon N/A N/A
55 Madison $0.15 highway fund
30
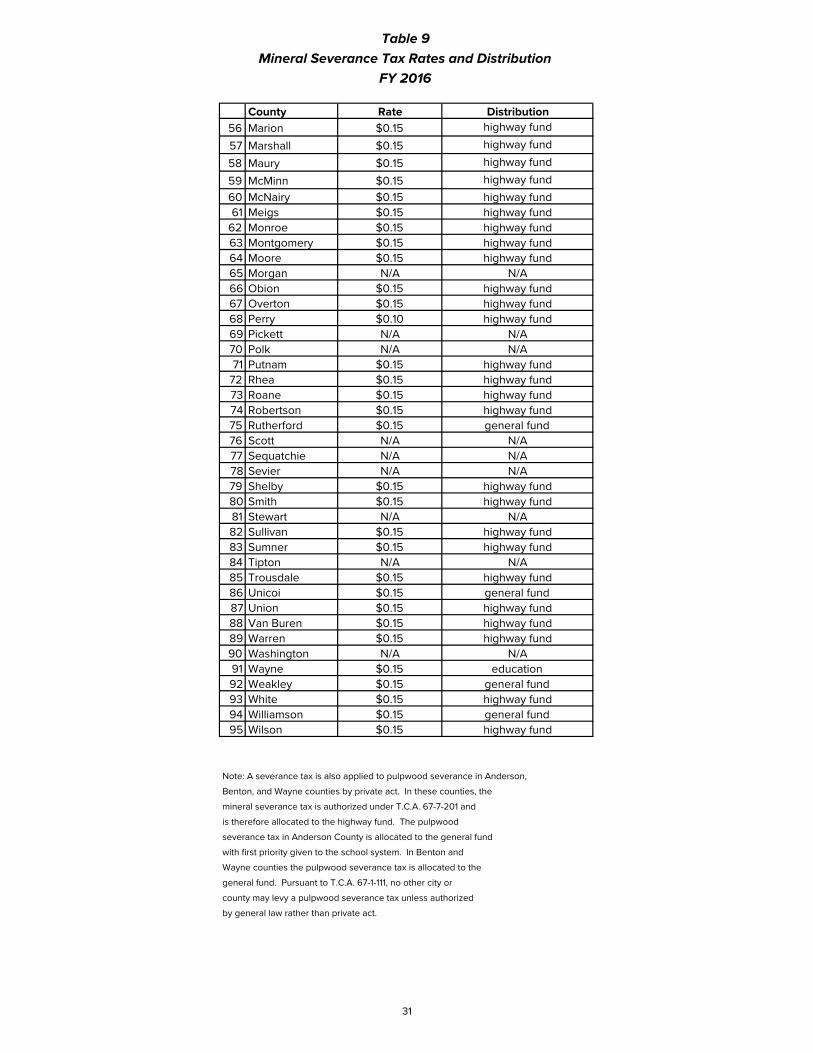
Table 9Mineral Severance Tax Rates and Distribution
FY 2016
County Rate Distribution56 Marion $0.15 highway fund
57 Marshall $0.15 highway fund
58 Maury $0.15 highway fund
59 McMinn $0.15 highway fund60 McNairy $0.15 highway fund61 Meigs $0.15 highway fund
62 Monroe $0.15 highway fund63 Montgomery $0.15 highway fund64 Moore $0.15 highway fund65 Morgan N/A N/A66 Obion $0.15 highway fund67 Overton $0.15 highway fund68 Perry $0.10 highway fund69 Pickett N/A N/A70 Polk N/A N/A71 Putnam $0.15 highway fund
72 Rhea $0.15 highway fund73 Roane $0.15 highway fund74 Robertson $0.15 highway fund75 Rutherford $0.15 general fund76 Scott N/A N/A77 Sequatchie N/A N/A78 Sevier N/A N/A79 Shelby $0.15 highway fund80 Smith $0.15 highway fund81 Stewart N/A N/A82 Sullivan $0.15 highway fund83 Sumner $0.15 highway fund84 Tipton N/A N/A85 Trousdale $0.15 highway fund86 Unicoi $0.15 general fund87 Union $0.15 highway fund88 Van Buren $0.15 highway fund89 Warren $0.15 highway fund90 Washington N/A N/A91 Wayne $0.15 education92 Weakley $0.15 general fund93 White $0.15 highway fund94 Williamson $0.15 general fund95 Wilson $0.15 highway fund
Note: A severance tax is also applied to pulpwood severance in Anderson,
Benton, and Wayne counties by private act. In these counties, the
mineral severance tax is authorized under T.C.A. 67-7-201 and
is therefore allocated to the highway fund. The pulpwood
severance tax in Anderson County is allocated to the general fund
with first priority given to the school system. In Benton and
Wayne counties the pulpwood severance tax is allocated to the
general fund. Pursuant to T.C.A. 67-1-111, no other city or
county may levy a pulpwood severance tax unless authorized
by general law rather than private act.
31

Adequate Facilities and School Facilities Taxes
In recent years local governments, especially those in counties experiencing heavy growth, have looked for ways by which those benefiting from the growth could also pay for the increased governmental costs resulting from that growth.
After June 20, 2006, statutory provisions for the authorization of the adequate facilities tax changed. Current Tennessee law now only authorizes the imposition of the adequate facilities tax if the county meets certain criteria: the county must have experienced a growth rate of 20 percent or more in total population between the last two federal decennial censuses or between future federal decennial censuses; or, the county must experience a 9 percent or more increase over the period from 2000 to 2004, or any future subsequent four-year period, according to the U.S. Census Bureau population estimates.
Furthermore, counties meeting the new criteria may initially impose an amount per square foot of new residential construction only, up to $1.00 per square foot. Counties may not increase the rate of the tax for four years after the effective date of the levy or the last increase, and the rate increase may not exceed 10 percent.
Finally, the change was designed to help fund only school facilities. Therefore, counties must adopt a capital improvement plan for which the proceeds of the tax must be allocated to school capital outlay.
At the date of this publication, Bedford, Jefferson, Loudon, and Trousdale counties have adopted the school facilities tax. Counties that adopted adequate facilities taxes before this legislation went into effect are not prevented from imposing the taxes that were granted by private act, nor are they prevented from using the proceeds of these taxes for use on public facilities other than school facilities. The counties that impose adequate facilities and school facilities taxes are listed in Table 10, along with the rates, how the rates are imposed, and the purposes for which the proceeds are allocated. 1
T.C.A. § 67-4-29011
32

Table 10Adequate School Facilities/Development Taxes and Fees and Distribution
Bedford $1.00 per residential square foot education capital projects;education debt service
$1,875 paid by developer upon approval of plat
$1,875 paid upon issuance of building permit
$1.00 per residential square foot
$.50 per heated residential square foot
$.25 per heated commercial square foot
$.15 per temperature controlled industrial square foot
Fayette maximum of $1.00 per residential/nonresidential square foot capital projects fund
$1.00 per residential square foot with $1,500 minimum
$.25 per commercial square foot with $1,500 minimum
Jefferson $1.00 per residential square foot education capital projects
Loudon $1.00 per residential square foot education capital projects
$1.00 per residential square foot
$.25 per commercial square foot
$.70 per residential square foot
$.30 per commercial square foot
$.50 per residential square foot
$.30 per commercial square foot
Montgomery$250 per residential lot plus $250 per unit increasing 6% annually to a maximum of $1,000 combined
education, capital projects, education debt service
$1.50 per residential square foot
$.30 per commercial square foot
$750 paid by developer upon approval of plat
$750 paid upon issuance of building permit
$.70 per residential square foot
$.40 per commercial square foot
Trousdale $1.00 per residential square foot education debt service
$1.00 per residential square foot schools
$.34 per commercial square foot fire services; highways
$1.00 per residential square foot schools; recreation
Wilson $1,000 minimum per residential unit imposed at issuance ofbuilding permit or equivalent to building permit fee in jurisdiction
capital projects
School Facilities Tax
CheathamDevelopment Tax $500 parks and recreation $750
general fund; $2,500 education debtAdequate Facilities Tax
Dickson Adequate Facilities Tax education capital projects
Adequate Facilities Tax
Hickman Adequate Facilities Tax capital projects fund
School Facilities Tax
School Facilities Tax
Macon Development/Impact Fee capital projects
capital improvements; debt
Marshall Adequate Facilities Tax capital projects fund
Maury Adequate Facilities Tax local purpose fund
Within Cities
Adequate Facilities Tax
Sumner Adequate Facilities Tax education capital projects
School Facilities Tax
Williamson Privilege Tax
Adequate Facilities Tax
Robertson Adequate Facilities Tax education debt
Rutherford Development Tax
33

Summary of Major County Tax Rates
Table 11 provides a summary of rates of the most broadly imposed county taxes that were in place when counties adopted budgets for fiscal year 2016. Any referenda occurring after the date of this publication will not be reflected until next year.
For additional detail on these and any other local or state revenues pertinent to counties, refer to the CTAS website, ctas.tennessee.edu and click on e-Li and type in the subject in the search box under “Ask e-Li.”
Technical assistance on financial and other issues is also available by contacting the CTAS consultant for your county. General questions regarding this publication should be directed to the CTAS central office in Nashville by calling (615) 532-3555.
34

County Property Tax Rates
Local Option
Sales Tax Rates
Motor Vehicle Tax Rates
Hotel/ Motel Tax
Rates
Mineral Severance
1 Anderson 2.7903 2.75 N/A $0.05 $0.152 Bedford 2.2700 2.75 N/A N/A $0.153 Benton 2.9500 2.75 N/A $0.05 $0.104 Bledsoe 2.2162 2.25 N/A N/A $0.155 Blount 2.6200 2.75 N/A $0.04 $0.156 Bradley 2.4021 2.75 N/A $0.05 N/A7 Campbell 2.2500 2.25 $75.00 $0.05 $0.158 Cannon 2.6800 1.75 $50.25 $0.05 $0.109 Carroll 1.4854 2.75 $55.00 N/A $0.1510 Carter 2.4500 2.75 N/A $0.05 $0.1511 Cheatham 2.9010 2.25 $51.00 $0.05 $0.1512 Chester 2.5202 2.75 $65.35 $0.04 N/A13 Claiborne 2.4800 2.25 $25.00 $0.03 $0.1514 Clay 3.1000 2.75 $25.00 $0.03 $0.1515 Cocke 2.5872 2.75 N/A $0.03 $0.1516 Coffee 3.5429 2.75 N/A N/A $0.1517 Crockett 2.6400 2.75 $73.50 $0.05 N/A18 Cumberland 1.5275 2.75 N/A $0.08 $0.1519 Davidson 4.5160 2.25 $55.00 $0.04 $0.1520 Decatur 1.9900 2.50 $110.00 $0.05 $0.1521 DeKalb 1.7800 2.75 N/A $0.05 $0.1522 Dickson 2.9000 2.75 $60.00 $0.05 $0.1523 Dyer 2.5300 2.75 $60.15 N/A N/A24 Fayette 1.6054 2.25 $71.00 $0.05 $0.1525 Fentress 1.9839 2.50 $25.00 $0.05 $0.1526 Franklin 2.6736 2.25 N/A $0.07 $0.1527 Gibson 0.9684 2.75 $35.75 $0.04 N/A28 Giles 2.7711 2.50 N/A $0.05 $0.1529 Grainger 2.5000 2.75 N/A N/A $0.1430 Greene 1.8731 2.75 $55.00 $0.07 $0.1531 Grundy 2.5383 2.25 N/A N/A N/A32 Hamblen 1.9900 2.75 $27.00 $0.05 $0.1533 Hamilton 2.7652 2.25 N/A $0.04 N/A34 Hancock 2.2200 2.00 $20.00 N/A N/A
Summary of Major County Tax Rates FY 2016
35

35 Hardeman 2.5500 2.75 $80.00 $0.05 N/A36 Hardin 2.0800 2.75 $47.00 $0.05 $0.1537 Hawkins 2.4650 2.75 $27.00 N/A $0.1538 Haywood 2.5600 2.75 $90.00 $0.05 $0.1539 Henderson 2.3758 2.75 $60.00 $0.05 N/A40 Henry 2.0621 2.75 $15.50 $0.05 N/A41 Hickman 2.5395 2.75 $50.50 $0.05 $0.1542 Houston 3.1900 2.75 $45.50 $0.05 N/A43 Humphreys 2.2000 2.75 N/A $0.05 $0.0544 Jackson 2.8500 2.75 $41.00 N/A $0.1545 Jefferson 2.3500 2.75 $50.00/$30.00 $0.04 N/A46 Johnson 1.8100 1.50 $40.00 $0.05 $0.1547 Knox 2.3200 2.25 $36.00 $0.05 N/A48 Lake 2.3165 2.75 $75.00/$37.75 $0.08 N/A49 Lauderdale 2.9000 2.75 $65.00 $0.05 N/A50 Lawrence 3.0600 2.75 $25.00 $0.05 $0.1551 Lewis 2.2941 2.50 $20.00 $0.05 N/A52 Lincoln 2.3400 2.50 $75.00 $0.05 $0.1553 Loudon 1.8587 2.00 N/A $0.05 $0.1554 Macon 2.4000 2.25 $65.00/$45.00 N/A N/A55 Madison 2.1500 2.75 N/A $0.05 $0.1556 Marion 2.1686 2.75 N/A $0.05 $0.1557 Marshall 3.2200 2.25 $50.00 $0.07 $0.1558 Maury 2.6200 2.25 $25.00 $0.05 $0.1559 McMinn 1.6155 2.00 N/A $0.05 $0.1560 McNairy 2.0900 2.25 N/A N/A $0.1561 Meigs 2.1726 2.00 N/A $0.05 $0.1562 Monroe 2.0942 2.25 $25.00 $0.05 $0.1563 Montgomery 3.0700 2.50 $30.50 $0.03 $0.1564 Moore 2.4300 2.50 N/A $0.03 $0.1565 Morgan 3.1000 2.00 N/A N/A N/A66 Obion 2.0042 2.75 $40.00 $0.05 $0.1567 Overton 2.2500 2.50 $30.50 $0.05 $0.1568 Perry 2.4000 2.50 N/A $0.05 $0.10
County Property Tax Rates
Local Option
Sales Tax Rates
Motor Vehicle Tax Rates
Hotel/ Motel Tax
Rates
Mineral Severance
Summary of Major County Tax Rates FY 2016
36

69 Pickett 1.8700 2.75 $10.00 N/A N/A70 Polk 2.4021 2.75 N/A $0.03 N/A71 Putnam 2.8050 2.75 N/A $0.06 $0.1572 Rhea 2.0966 2.75 N/A $0.02 $0.1573 Roane 2.5750 2.50 N/A $0.05 $0.1574 Robertson 3.0850 2.75 $85.25 $0.07 $0.1575 Rutherford 2.6800 2.75 $52.50 $0.03 $0.1576 Scott 2.3740 2.25 $30.00 $0.05 N/A77 Sequatchie 2.5686 2.25 N/A $0.02 N/A78 Sevier 1.8800 2.75 N/A $0.03 N/A79 Shelby 4.3700 2.25 $50.00 $0.05 $0.1580 Smith 2.3200 2.75 $65.00 N/A $0.1581 Stewart 2.4488 2.25 $35.00 $0.05 N/A82 Sullivan 2.5754 2.25 N/A N/A $0.1583 Sumner 2.5000 2.25 $51.00 $0.05 $0.1584 Tipton 2.4200 2.25 $61.00 $0.05 N/A85 Trousdale 3.1000 2.25 $40.00 N/A $0.1586 Unicoi 2.6838 2.75 N/A $0.05 $0.1587 Union 2.1700 2.25 $30.00 $0.05 $0.1588 Van Buren 1.9299 2.75 N/A $0.07 $0.1589 Warren 1.9661 2.75 $30.00 $0.05 $0.1590 Washington 1.9798 2.50 N/A N/A N/A91 Wayne 2.0700 2.75 $61.00 N/A $0.1592 Weakley 2.1302 2.75 $40.00 $0.05 $0.1593 White 2.0500 2.25 $42.00 $0.05 $0.1594 Williamson 2.3100 2.25 $25.75 $0.04 $0.1595 Wilson 2.5704 2.25 $25.00 $0.03 $0.15
County Property Tax Rates
Local Option
Sales Tax Rates
Motor Vehicle Tax Rates
Hotel/ Motel Tax
Rates
Mineral Severance
Summary of Major County Tax Rates FY 2016
37

! 226 Capitol Boulevard, Suite 400 Nashville, TN 37219 | Phone: (615) 532-3555 | ctas.tennessee.edu
Promoting better county government through direct assistance to county officials and their associations.
38
Recommended