Content
Pages
Chapter 1: Introduction .............................................................................................................. 1
Chapter 2: What are Graphic Organizers? ............................................................................... 3
Chapter 3: Types of Graphic Organizers ................................................................................... 5
Chapter 4: Specific Benefits to Students and Teachers .......................................................... 7
Chapter 5: How to Use the Graphic Organizers? .................................................................... 9
Chapter 6: Thinking Skills and Graphic Organizers ............................................................... 11
Chapter 7: Graphic Organizers: Description, Procedures and Exemplars ......................... 13
Big Question Map ....................................................................................................................................... 14
Characteristics Map ................................................................................................................................... 18
Circle Organizer ............................................................................................................................................ 22
Compare Map ............................................................................................................................................... 26
Concept Definition Map ......................................................................................................................... 30
Data Grid .......................................................................................................................................................... 34
Discussion Map ............................................................................................................................................ 38
Divergent and Convergent Thinking Web .................................................................................... 42
Hierarchy Diagram ...................................................................................................................................... 46
K-W-H-L Chart .............................................................................................................................................. 50
Main Concepts Map .................................................................................................................................. 54
Math Factors Organizer ........................................................................................................................... 58
Multiple Meaning Map ............................................................................................................................ 62
Multiple Timeline ........................................................................................................................................ 66
One and All Organizer .............................................................................................................................. 70
Overlapping Circles Map ........................................................................................................................ 74
Persuasion Map ............................................................................................................................................ 78
Pie Chart ........................................................................................................................................................... 82
Problem-Solving Organizer .................................................................................................................... 86
V Map ................................................................................................................................................................ 90
Venn Diagram................................................................................................................................................ 94
Chapter 8: Web Sites for Graphic Organizers .......................................................................... 99
Chapter 9: References...................................................................................................................101
Chapter 10: How to Use the CD-ROM ............................................................................................. 103

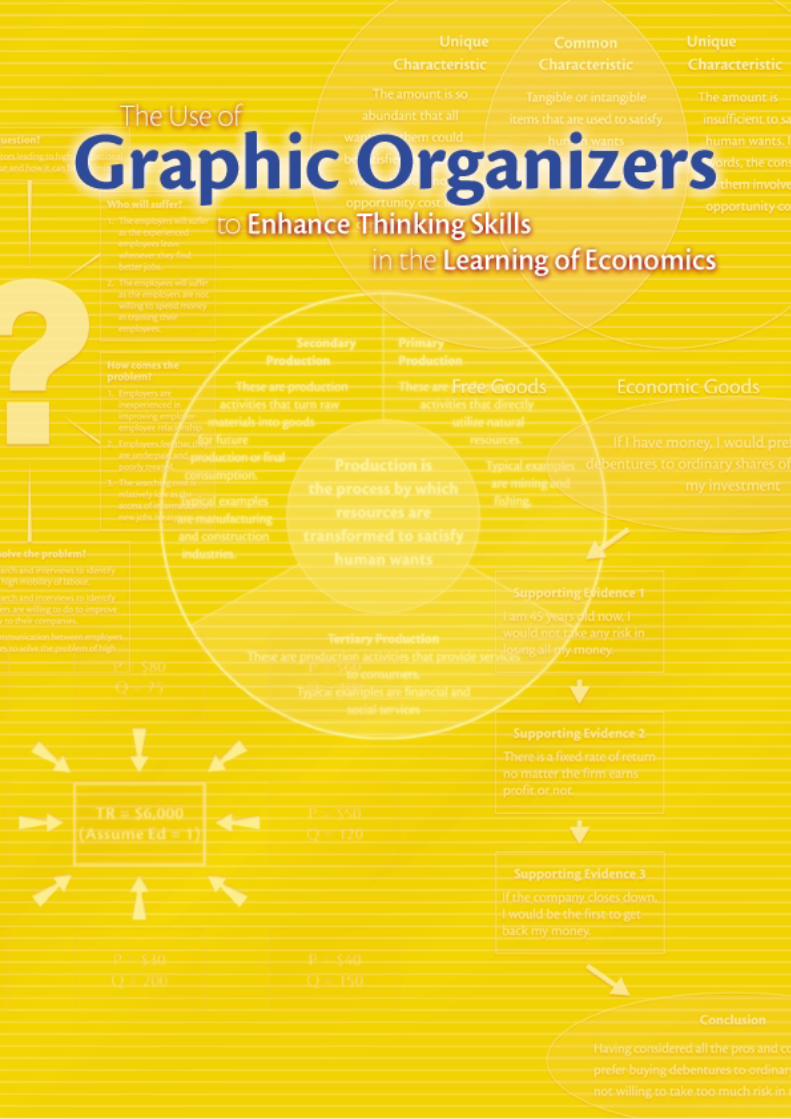
The Use of Graphic Organizers to Enhance Thinking Skills in the Learning of Economics
Introduction
Learning how to think is not as complicated as some people
have believed. Once learned, thinking skills can be readily
applied to lessons in all curriculum areas and further to enhance
students’ life-long learning. While our knowledge about subjects
can change, fade, or become obsolete, our ability to think
effectively remains constant. Effective thinking strategies allow
students to acquire the necessary knowledge and apply it
appropriately.
Graphic organizers, as illustrated by Drapeau (1998), can be used
to enhance students’ thinking skills by encouraging
brainstorming, generating new ideas, connecting parts to the
whole, drawing sequence, analyzing causes and effects...etc.
These are exactly important traits of economics students to
make sense out of economic phenomena and to make effective
decisions about economic issues (CDC, 1989).
Prawat (1991) reminds us that thinking skills are most effectively
taught within a subject matter context. This allows students to
use the skills in a meaningful context and to achieve deeper
learning of the subject matter.
The graphic organizers introduced in this book include
description of the thinking strategies, step-by-step suggestions
on how to introduce it to students, and exemplars within each
content area. In many cases, the ideas will apply directly to the
text teachers wish to use. At other times, teachers will need to
modify the ideas to meet their needs. While we have provided a
number of ideas and strategies, we hope that this book will be a
useful guide and resource to stimulate teachers’ own ideas and
variations, and will encourage and support the use of graphic
organizers to enhance students' thinking skills in the learning of
Economics.
Chapter 1 • 1

The Use of Graphic Organizers to Enhance Thinking Skills in the Learning of Economics
What are Graphic Organizers?
Graphic organizers are visual representation of knowledge
that structures information by arranging important
aspects of a concept or topic into a pattern using labels
(Bromley, DeVitis & Modlo, 1999). Their main function is to help
present information in concise ways that highlight the
organization and relationships of concepts.
Reasons for UsingGraphic Organizers
Tools for critical and creative thinkingGraphic organizers help students focus on what is important
(Bromley, DeVitis and Modlo, 1995) because they highlight key
concepts and vocabulary, and the relationships among them,
thus providing the tools for critical and creative thinking.
Tools for organizing informationThe human mind organizes and stores information in a series of
networks (Ausubel, 1968). Graphic organizers are visual
depictions that resemble networks and allow students to add or
modify their background knowledge by seeing the connections
and contradictions between existing knowledge and new
information.
Tools for understanding information andrelationshipsGraphic organizers serve as mental tools (Vygotsky, 1962) to
help the students understand and retain important information
and relationships.
Chapter 2 • 3

The Use of Graphic Organizers to Enhance Thinking Skills in the Learning of Economics
Tools for depicting knowledge and understandingGraphic organizers provide an optional way of depicting
knowledge and understanding (Sorenson, 1991), so it is
particularly beneficial for students who have difficulty with
expressing relationship among parts of economic concepts in
written word.
Tools for self-learningStudents who use graphic organizers in the classroom develop
their ability to use them independently as study tools for note
taking, planning, presentation, and review (Dunston, 1992). In
other words, graphic organizers are beneficial to students’
learning inside and beyond classrooms.
4 • What are Graphic Organizers?

The Use of Graphic Organizers to Enhance Thinking Skills in the Learning of Economics
Types of Graphic Organizers
Although there are many variations and possible
combinations of graphic organizers used in the classrooms,
most of them fall into four basic categories, namely cyclical
organizers, conceptual organizers, sequential organizers and
hierarchical organizers.
Chapter 3 • 5
Cyclical
Organizers
Sequential
Organizers
DefinitionOrganizers showing how amain concept is supported
by facts, evidence andcharacteristics
DefinitionOrganizers showing the
relation between a conceptand its subordinate levels of
characteristics
Example
Concept Definition Map
Example
Hierarchy Diagram
DefinitionOrganizers showing thesequence of events in a
process
Example
Circle organizer
DefinitionOrganizers showing events in
chronological order
Example
Multiple Timeline
Hierarchical
Organizers
Conceptual
OrganizersGraphic
Organizers


The Use of Graphic Organizers to Enhance Thinking Skills in the Learning of Economics
Specific Benefits toStudents and Teachers
Graphic organizers enable teachers to show and explain
relationships between content and subcontent and how
they in turn relate to other content areas. On the other hand,
through the use of the organizers, students can make more
abstract comparisons, evaluations, and conclusions. In short,
graphic organizers allow students an active role in their learning.
For easy understanding, specific benefits to students and
teachers are presented in the following organizer.
Chapter 4 • 7
Benefitsto
Teachers
Benefitsto
Students
Assess what students know
Recognize and assimilatedifferent points of view
Assist students in prewritingtechniques
Motivate students
Help visual learners toacquire information more
easily
Make your lessonsinteractive
Show and explainrelationships between and
among content
Record relationships
Clarify and organize ideas
Improve memory
Comprehend texts
The Use ofGraphic
Organizers
Understand the concept ofpart to whole


The Use of Graphic Organizers to Enhance Thinking Skills in the Learning of Economics
How to Use theGraphic Organizers?
Teachers can use the graphic organizers recommended in
this book as they see appropriate because the organizers
are really flexible tools. Teachers can use them for instruction,
review, extension and enrichment, and have their students work
in pairs, groups or in whole class to complete them.
In order to help students get the most out of the graphic
organizers, the following steps are recommended.
Chapter 5 • 9
Use examples to illustrate the use of somegraphic organizers
Familiarize yourself with different types ofgraphic organizers
Explain to students what graphic organizersare and why they are useful in learning
Present the specific graphic organizer for atopic. Point out its subject and organizational
framework
Assign the graphic organizer as an individual,paired, or group activity
Review students’ work. Generate classroomdiscussion on the effective use of graphic
organizers


The Use of Graphic Organizers to Enhance Thinking Skills in the Learning of Economics
Thinking Skills andGraphic Organizers
Among the brain’s many functions is the ability to think
(Parry and Gregory, 1998), but many students do not have
the skills necessary for the more “higher-order” creative and
critical thinking needed to thrive both within and beyond the
economics lessons.
Generally speaking, there are five different ways in which
thinking skills can be used to enhance classroom instruction in
economics lessons. First, thinking skills can be used to enhance
students’ learning by generating ideas and activating relevant
diagrams of economic concepts. This makes it more likely that
they can connect new knowledge to their prior knowledge.
Second, thinking skills help students organize ideas and
components of economic concepts by searching for meaningful
patterns, organizing information, and putting things in groups or
categories in order to understand. Third, thinking skills help
students understand the parts of an economic idea to the whole
by seeing the structure of a concept or an event. Fourth, by
focusing on similarities and differences, thinking skills can be
used to help students establish relationships between two or
more ideas, concepts and events. Finally, knowing how to use
thinking skills in teaching economics will provide teachers with a
vast repertoire of activities to use with any unit or lesson.
(Johnson, 2000)
Graphic organizers have a number of attributes that enhance
students’ thinking skills. They allow students to make
connections among pieces of information and make information
easier to recall. Furthermore, they also allow students to break
information into manageable chunks, so that they can easily see
the relationships among the separate ideas.
Chapter 6 • 11

The Use of Graphic Organizers to Enhance Thinking Skills in the Learning of Economics
Finally, graphic organizers also provide a structure or framework
to display the internal process of thinking in an external, visual
form. In other words, they provide a means to observe and assess
the students’ thought processes.
Four primary ways of using graphic organizers to enhance
students’ thinking skills are compiling information, generating
ideas, analyzing or evaluating ideas, and reflecting.
12 • Thinking Skills and Graphic Organizers
analyzing ideas
compiling information
reflecting
generating ideas
The use of graphicorganizers can
enhance students’thinking skills in……
analyzing ideas
compiling information
reflecting
generating ideas
The use of graphicorganizers can
enhance students’thinking skills in……
The Use of Graphic Organizers to Enhance Thinking Skills in the Learning of Economics
Graphic Organizers:Description, Procedures andExemplars
Chapter 7 • 13
In this chapter, we’ve included a variety of graphic organizers
that can be used in many areas of economics learning. They
are accompanied by brief descriptions, step-by-step procedures
and exemplars. However, teachers are reminded to modify the
ideas to meet their own needs. The modification should depend
on students’ developmental level and their experience with
graphic organizers. Certainly, the modification itself is a valuable
opportunity for critical thinking.
14 • Graphic Organizers: Description, Procedures and Exemplars
The Use of Graphic Organizers to Enhance Thinking Skills in the Learning of Economics
Big Question MapDescriptionThis organizer can be used to help students improve their
research and problem-solving skills. Students are trained to plan
their research and investigation of a topic and thus promote
their ability to learn and think independently.
Procedures1. Identify an authentic question for which there is no easy, pre-
existing answer or solution.
2. Brainstorm the procedures and resources required for
answering the questions.
3. Record the information in the organizer.
4. Add, delete or change the boxes in the organizer whereas
appropriate.
Chapter 7 • 15
The Use of Graphic Organizers to Enhance Thinking Skills in the Learning of Economics
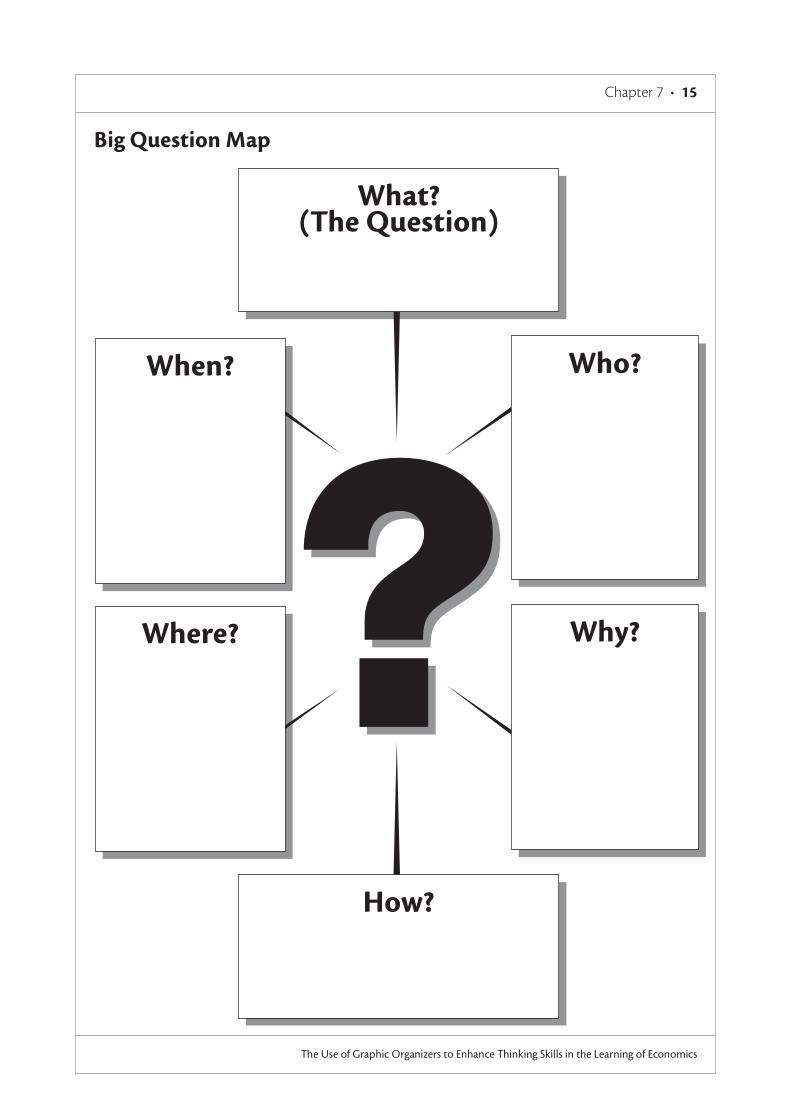
What?(The Question)
How?
Who?When?
Why?Where?
What?(The Question)
Who?When?
Why?
How?
Where?
Big Question Map

ExemplarExemplar16 • Graphic Organizers: Description, Procedures and Exemplars
The Use of Graphic Organizers to Enhance Thinking Skills in the Learning of Economics
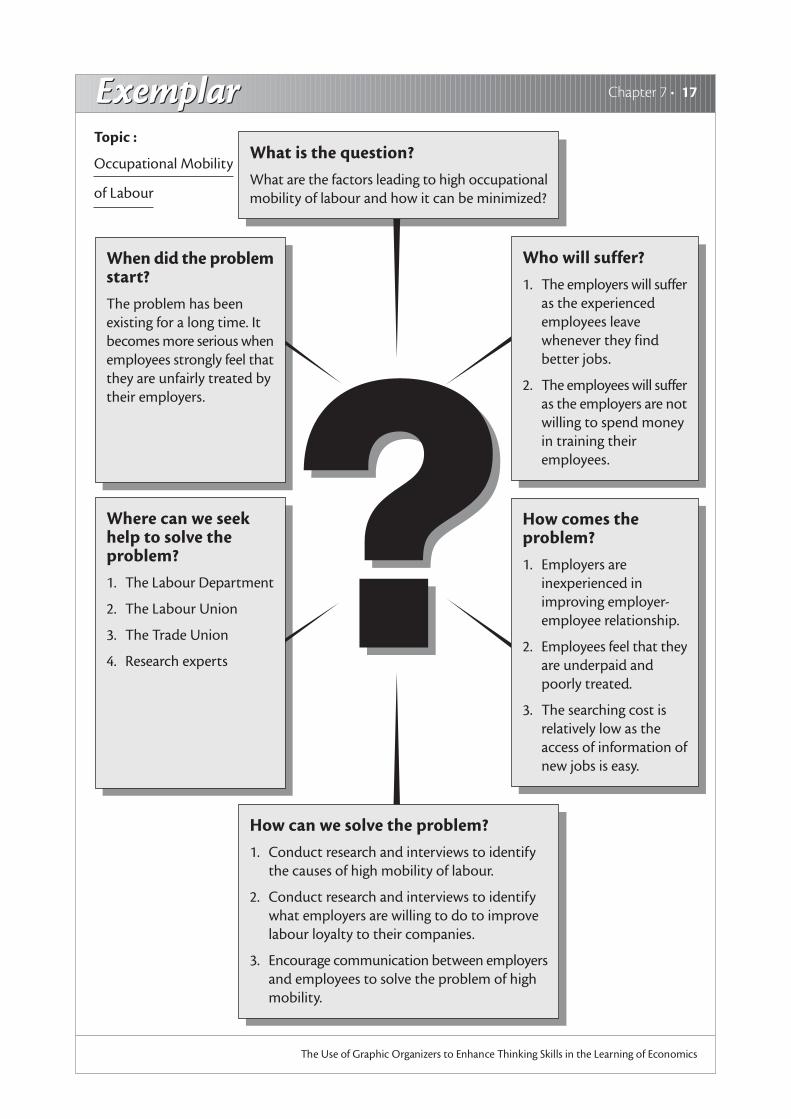
Big Question MapTopicOccupational Mobility of Labour
Concepts1. Referring to a recent research, employees in Hong Kong in
general lack loyalty to their employees.
2. Most of the employees are preparing to change their jobs
whenever they can find better ones.
3. Most of the companies in Hong Kong are small in size, so that
the employers lack experience and funding to provide fringe
benefits to the employees.
4. High occupational mobility of labour will bring along high
training cost with new employees.
ExemplarExemplar Chapter 7 • 17
The Use of Graphic Organizers to Enhance Thinking Skills in the Learning of Economics
What is the question?
What are the factors leading to high occupationalmobility of labour and how it can be minimized?
Who will suffer?
1. The employers will sufferas the experiencedemployees leavewhenever they findbetter jobs.
2. The employees will sufferas the employers are notwilling to spend moneyin training theiremployees.
When did the problemstart?
The problem has beenexisting for a long time. Itbecomes more serious whenemployees strongly feel thatthey are unfairly treated bytheir employers.
How comes theproblem?
1. Employers areinexperienced inimproving employer-employee relationship.
2. Employees feel that theyare underpaid andpoorly treated.
3. The searching cost isrelatively low as theaccess of information ofnew jobs is easy.
How can we solve the problem?
1. Conduct research and interviews to identifythe causes of high mobility of labour.
2. Conduct research and interviews to identifywhat employers are willing to do to improvelabour loyalty to their companies.
3. Encourage communication between employersand employees to solve the problem of highmobility.
Where can we seekhelp to solve theproblem?
1. The Labour Department
2. The Labour Union
3. The Trade Union
4. Research experts
Topic :
Occupational Mobility
of Labour
18 • Graphic Organizers: Description, Procedures and Exemplars
The Use of Graphic Organizers to Enhance Thinking Skills in the Learning of Economics
Characteristics MapDescriptionThis organizer can be used to promote students’ critical and
analytical thinking about key concepts and their characteristics.
Students are expected to list the major characteristics of a
concept and illustrate with examples.
Procedures1. Select a concept and write it in the middle of the organizer.
2. Identify the categories belong to the concept and write them
in the ‘category’ boxes. You may change the number of these
boxes as appropriate.
3. Brainstorm the major characteristics of each category.
Annotate with evidence whereas appropriate and necessary.

Chapter 7 • 19
The Use of Graphic Organizers to Enhance Thinking Skills in the Learning of Economics
Characteristics Map
Characteristic Characteristic
Characteristic Characteristic
Characteristic Characteristic
Characteristic Characteristic
CategoryConcept
Category
Category
Category
ExemplarExemplar20 • Graphic Organizers: Description, Procedures and Exemplars
The Use of Graphic Organizers to Enhance Thinking Skills in the Learning of Economics
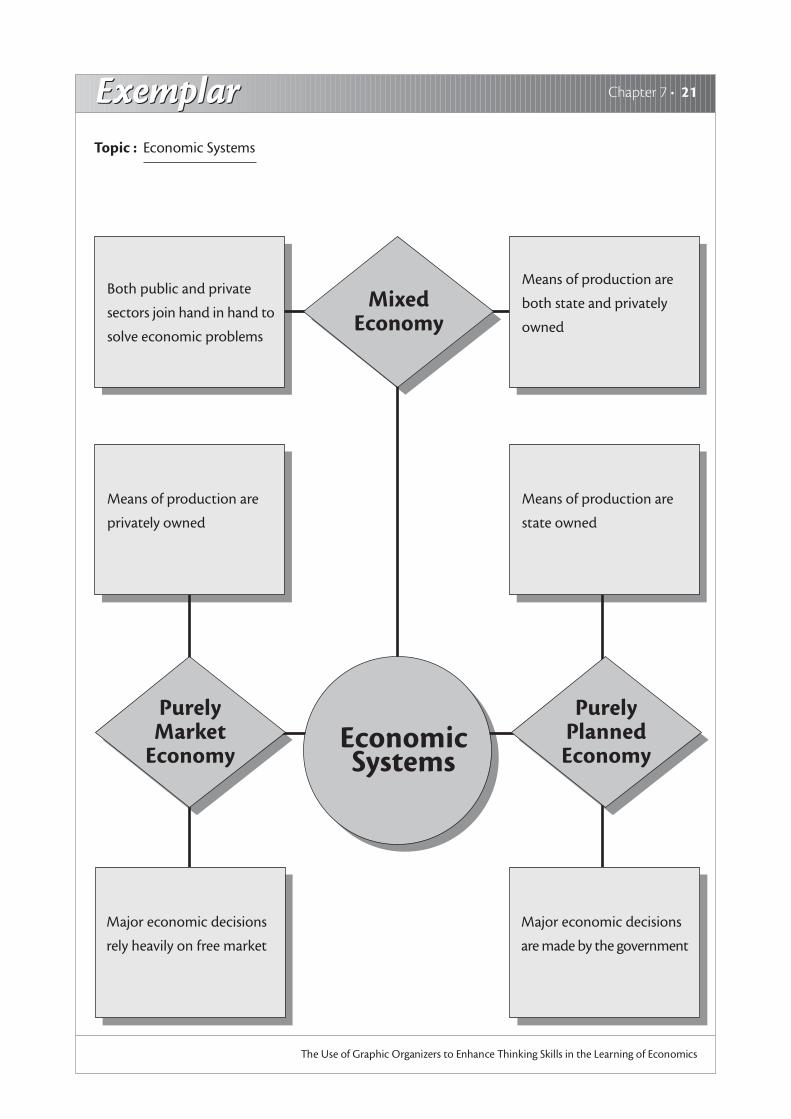
TopicEconomic Systems
Concepts1. Economic systems can be distinguished along many lines, but
two seem most important:
A. How is economic activity coordinated; and
B. Who owns the means of production?
2. Based on the above criteria, there are three different types of
economic system using different ways to deal with the three
basic economic problems of what to produce, how to
produce and for whom to produce.
3. A purely planned economy is one in which the state owns the
means ofproduction and all basic economic activities are
heavily planned.
4. A purely market economy is one in which the means of
production are privately owned and all economic decisions
are relied on free markets.
5. In reality, all economies are to some extent mixed. In a mixed
economy, there are both public and private sectors working
hand in hand so as to ensure economic growth of the state.
Characteristics Map
ExemplarExemplar Chapter 7 • 21
The Use of Graphic Organizers to Enhance Thinking Skills in the Learning of Economics
Both public and private
sectors join hand in hand to
solve economic problems
Means of production are
privately owned
Major economic decisions
rely heavily on free market
PurelyMarket
EconomyEconomicSystems
MixedEconomy
Means of production are
both state and privately
owned
Means of production are
state owned
PurelyPlannedEconomy
Major economic decisions
are made by the government
Topic : Economic Systems

22 • Graphic Organizers: Description, Procedures and Exemplars
The Use of Graphic Organizers to Enhance Thinking Skills in the Learning of Economics
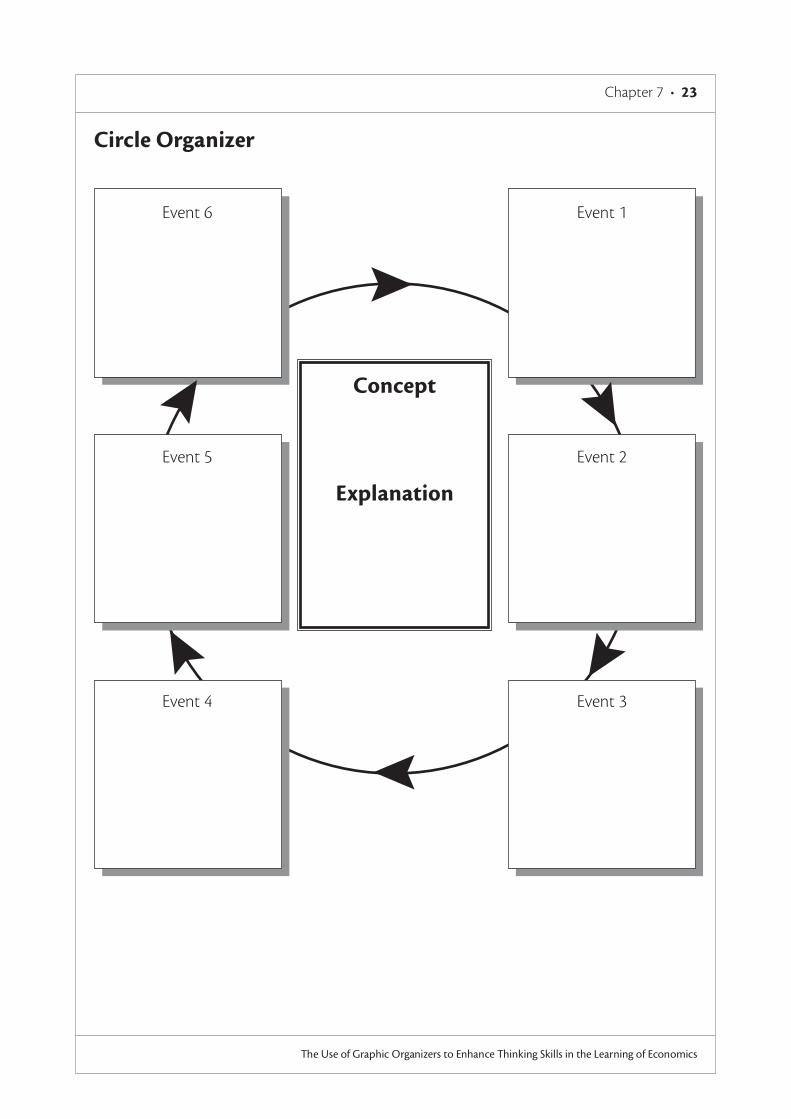
Circle OrganizerDescriptionThis organizer can be used to help students understand the
sequence of events in a process. On a sequence circle there is a
consecutive flow of events with the last cycling back to the first
event. Sequence circles are appropriate to represent the
relationship of events that are continuous.
Procedures1. Discuss a cycle process with students and encourage them to
retell the sequence of events.
2. Write the concept to be discussed in the middle of the
organizer.
3. In clockwise direction write the events in order.
4. Write a brief note to explain the steps in the process under
the ‘concept title’.
Chapter 7 • 23
The Use of Graphic Organizers to Enhance Thinking Skills in the Learning of Economics
Circle Organizer
Event 6 Event 1
Event 5 Event 2
Event 4 Event 3
Concept
Explanation
ExemplarExemplar24 • Graphic Organizers: Description, Procedures and Exemplars
The Use of Graphic Organizers to Enhance Thinking Skills in the Learning of Economics
TopicMultiple Money Creation
Concepts1. This can be defined as a process of multiple money creation,
whereby a small given deposit, will lead to a greater increase
in the money supply in the economy.
2. Generally, if the reserve ratio is R (a percentage of the deposit
received), meaning that each dollar of deposits requires only a
fraction R of a dollar in reserves. The deposit will expand by
1/R for each dollar of new reserves that are injected into the
system.
3. Assumes that all the banks in our society hold exactly the
20% required reserves (no excess reserves), and that each loan
recipient re-deposits the proceeds in the next bank. The total
money supply created (including the initial deposit (D)) will
be: D + D(1-R) + D(1-R)2 + D(1-R)3 + D(1-R)4 +……= D x 1/R = D/R
Circle Organizer

ExemplarExemplar Chapter 7 • 25
The Use of Graphic Organizers to Enhance Thinking Skills in the Learning of Economics
Bank ADeposit received = $1,000
Required reserves = $200
New loans = $800
Bank FDeposit received = $327.7
Required reserves = $65.5
New loans = $262.2
Bank EDeposit received = $409.6
Required reserves = $81.9
New loans = $327.7
Bank BDeposit received = $800
Required reserves = $160
New loans = $ 640
Bank DDeposit received = $512
Required reserves = $102.4
New loans = $409.6
Bank CDeposit received = $640
Required reserves = $128
New loans = $512
Multiple MoneyCreation
Assume:
1. There are many banks
2. Required reserve ratio =
20%
3. Initial deposit = $1,000
4. Banks keep no excess
reserves
5. All loans are re-deposited
in banks
Assume the new loans from bank F are re-deposited into
Bank A and the process goes on and on.
The total money supply thus created (including the initial
amount) would be: $1,000 x 1/0.2 = $5,000
Topic : Multiple Money Creation

26 • Graphic Organizers: Description, Procedures and Exemplars
The Use of Graphic Organizers to Enhance Thinking Skills in the Learning of Economics
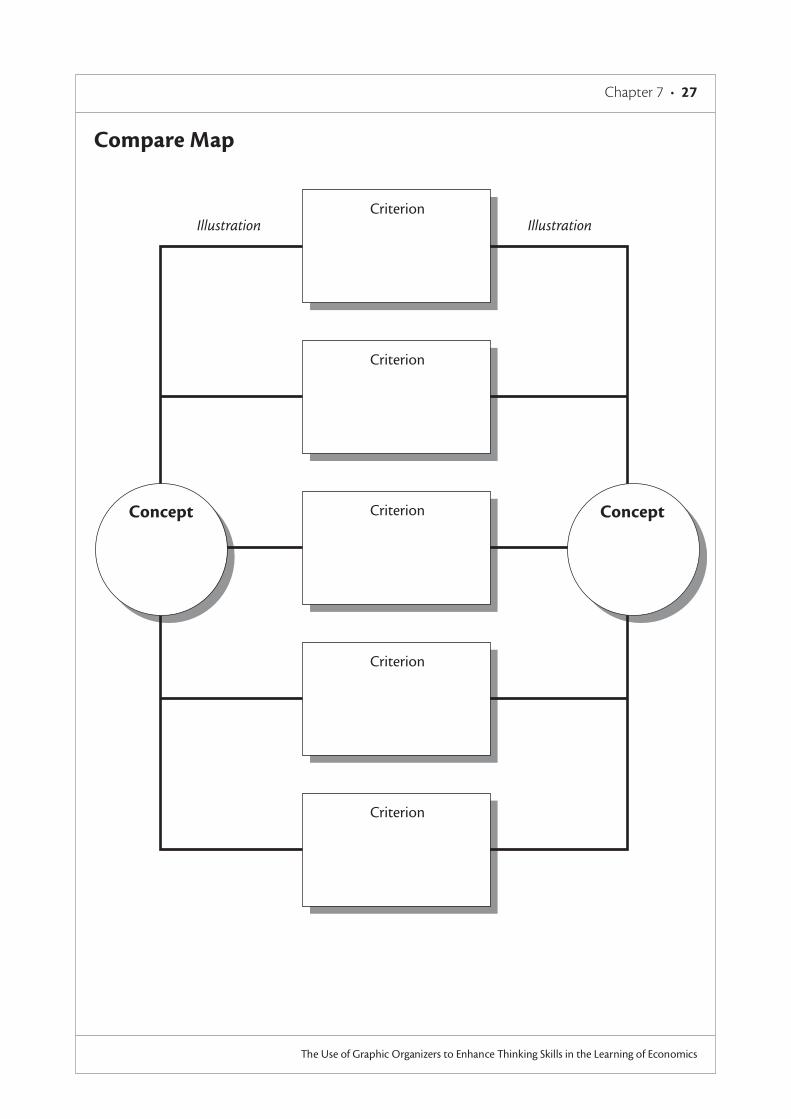
Compare MapDescriptionThis organizer can be used to help students compare two
concepts according to a set of criteria. Students can make use of
it to record a discussion between two concepts/subjects and as
an organizing tool for comparison.
Procedures1. Identify two concepts/subjects that are to be compared and
write them in the ‘concept’ boxes.
2. List the criteria for comparing the two concepts/subjects. Put
the criteria in the ‘criteria’ boxes.
3. Discuss the similarities and differences between the two
concepts/subjects.
4. Record information on the appropriate lines.
Chapter 7 • 27
The Use of Graphic Organizers to Enhance Thinking Skills in the Learning of Economics
Compare Map
IllustrationCriterion
Criterion
Criterion
Criterion
Criterion
Concept Concept
Illustration
ExemplarExemplar28 • Graphic Organizers: Description, Procedures and Exemplars
The Use of Graphic Organizers to Enhance Thinking Skills in the Learning of Economics
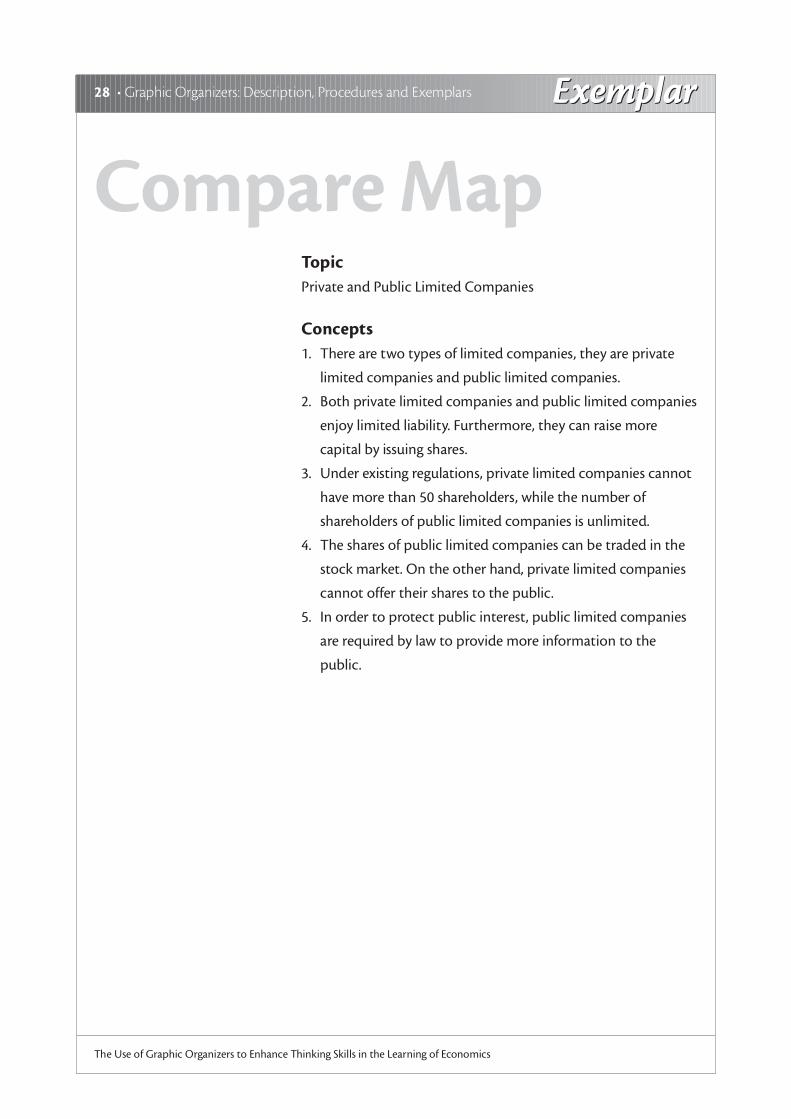
TopicPrivate and Public Limited Companies
Concepts1. There are two types of limited companies, they are private
limited companies and public limited companies.
2. Both private limited companies and public limited companies
enjoy limited liability. Furthermore, they can raise more
capital by issuing shares.
3. Under existing regulations, private limited companies cannot
have more than 50 shareholders, while the number of
shareholders of public limited companies is unlimited.
4. The shares of public limited companies can be traded in the
stock market. On the other hand, private limited companies
cannot offer their shares to the public.
5. In order to protect public interest, public limited companies
are required by law to provide more information to the
public.
Compare Map
ExemplarExemplar Chapter 7 • 29
The Use of Graphic Organizers to Enhance Thinking Skills in the Learning of Economics
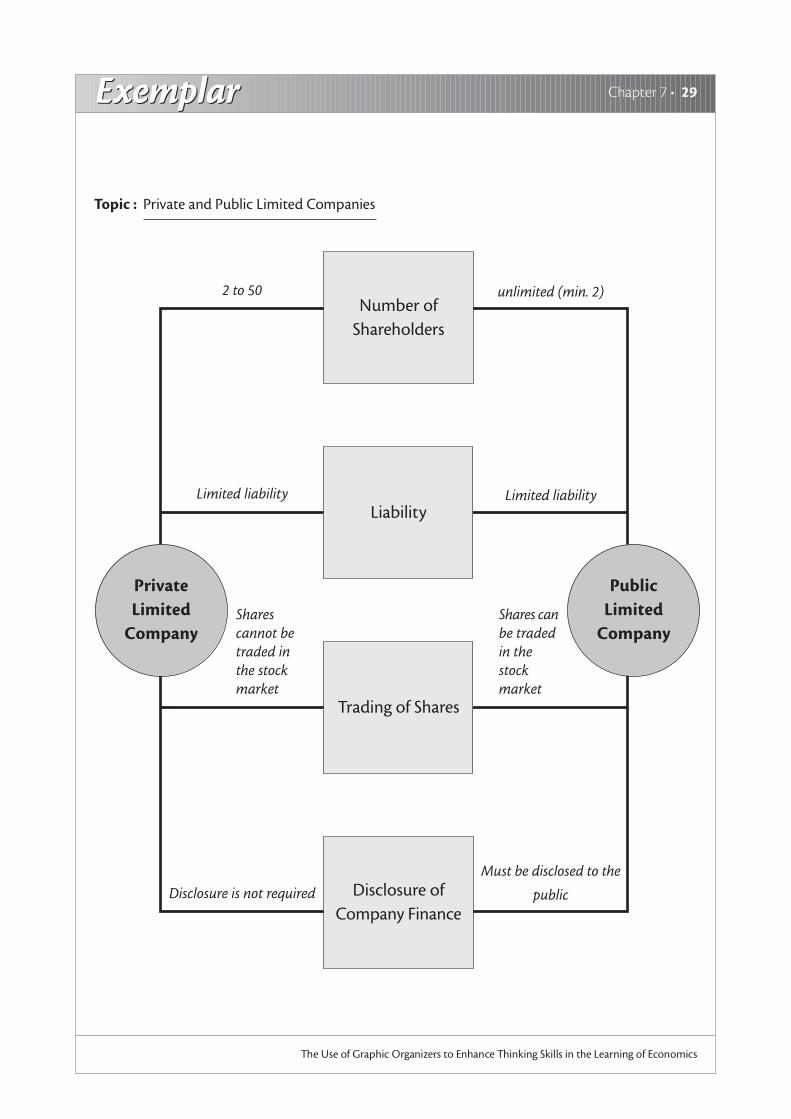
Number ofShareholders
Liability
Trading of Shares
Disclosure ofCompany Finance
PrivateLimited
Company
PublicLimited
Company
Disclosure is not required
2 to 50 unlimited (min. 2)
Limited liability Limited liability
Sharescannot betraded inthe stockmarket
Shares canbe tradedin thestockmarket
Must be disclosed to the
public
Topic : Private and Public Limited Companies
30 • Graphic Organizers: Description, Procedures and Exemplars
The Use of Graphic Organizers to Enhance Thinking Skills in the Learning of Economics
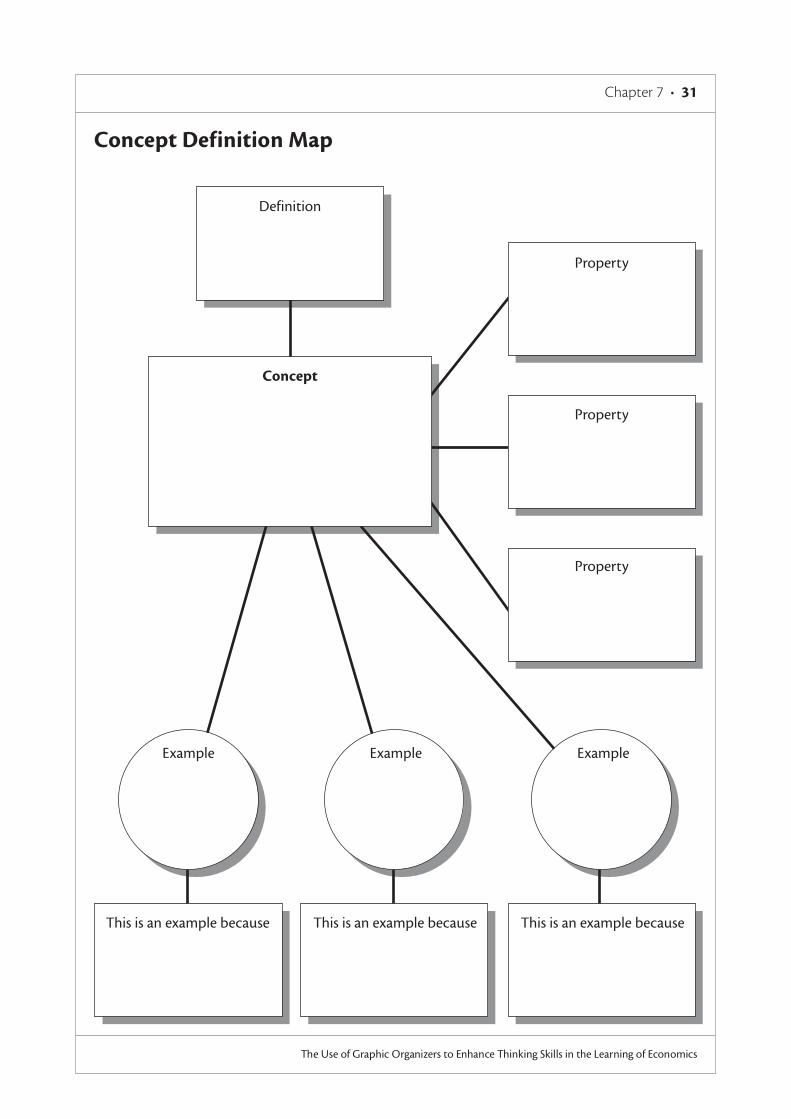
Concept Definition MapDescriptionThis organizer can be used to help students focus attention on
the main components of a definition. These may include
categories, properties and illustrations. It not only enriches
students’ understanding of a concept, but also encourages them
to integrate their own experience with the definition.
Procedures1. Discuss basic elements related to the definition of a concept,
for example, what is it? What are their properties? What are
the examples?
2. Choose a concept and tell students discuss the meaning and
brainstorm its properties and examples.
3. Ask students to justify the examples they have given.
Chapter 7 • 31
The Use of Graphic Organizers to Enhance Thinking Skills in the Learning of Economics
Concept Definition Map
Example
This is an example because
Example
This is an example because
Example
This is an example because
Property
Property
Property
Definition
Concept

ExemplarExemplar32 • Graphic Organizers: Description, Procedures and Exemplars
The Use of Graphic Organizers to Enhance Thinking Skills in the Learning of Economics
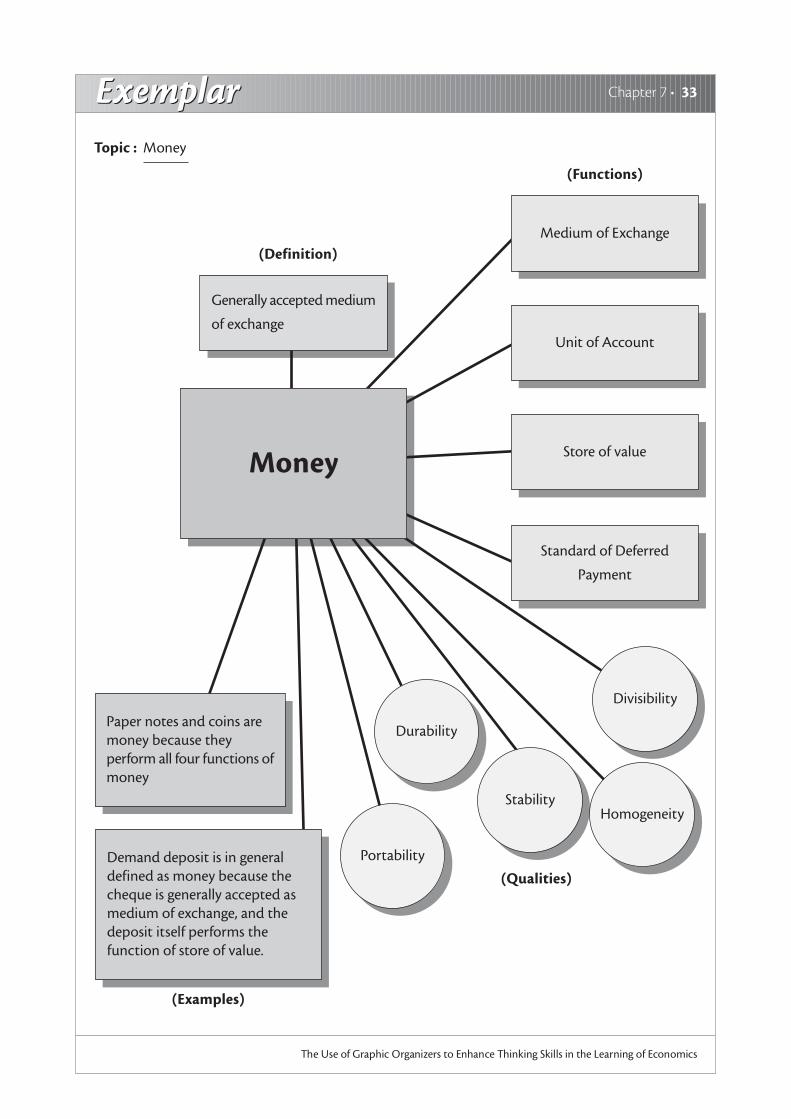
TopicMoney
Concepts1. Money is defined as a generally accepted medium of
exchange.
2. Besides the function of medium of exchange, money usually
performs basic functions of unit of account, standard of
deferred payment and store of value.
3. To perform the functions effectively, money should have the
qualities of stability (in intrinsic value), durability, divisibility,
portability and homogeneity.
4. Paper notes, coins and demand deposit (cheques) are
generally accepted as examples of money because they
perform most of the basic money functions.
Concept Definition Map
ExemplarExemplar Chapter 7 • 33
The Use of Graphic Organizers to Enhance Thinking Skills in the Learning of Economics
(Functions)
Money
Medium of Exchange
Unit of Account
Store of value
Standard of Deferred
Payment
Generally accepted medium
of exchange
(Definition)
(Qualities)
(Examples)
StabilityHomogeneity
Divisibility
Portability
DurabilityPaper notes and coins aremoney because theyperform all four functions ofmoney
Demand deposit is in generaldefined as money because thecheque is generally accepted asmedium of exchange, and thedeposit itself performs thefunction of store of value.
Topic : Money
34 • Graphic Organizers: Description, Procedures and Exemplars
The Use of Graphic Organizers to Enhance Thinking Skills in the Learning of Economics
Data GridDescriptionThis organizer can be used to help students organize
information into different categories. It allows students compare
and contrast information according to various criteria. Students
are thus trained to see patterns of information and are able to
generate hypotheses.
Procedures1. Choose a topic to research.
2. List subtopics to be compared and contrasted and write
them across the top of the organizer.
3. Brainstorm all criteria for comparing and contrasting and list
them vertically down the left side of the organizer.
4. Conduct research on and/or search for the required
information and write it in the appropriate boxes.
5. Use the grid to launch a discussion.

Chapter 7 • 35
The Use of Graphic Organizers to Enhance Thinking Skills in the Learning of Economics
Data Grid
Sub-topics
Criteria Sub-topic 1 Sub-topic 2 Sub-topic 3 Sub-topic 4
Criterion 1
Criterion 2
Criterion 3
Criterion 4
Criterion 5
Criterion 6
Research Topic :
ExemplarExemplar36 • Graphic Organizers: Description, Procedures and Exemplars
The Use of Graphic Organizers to Enhance Thinking Skills in the Learning of Economics
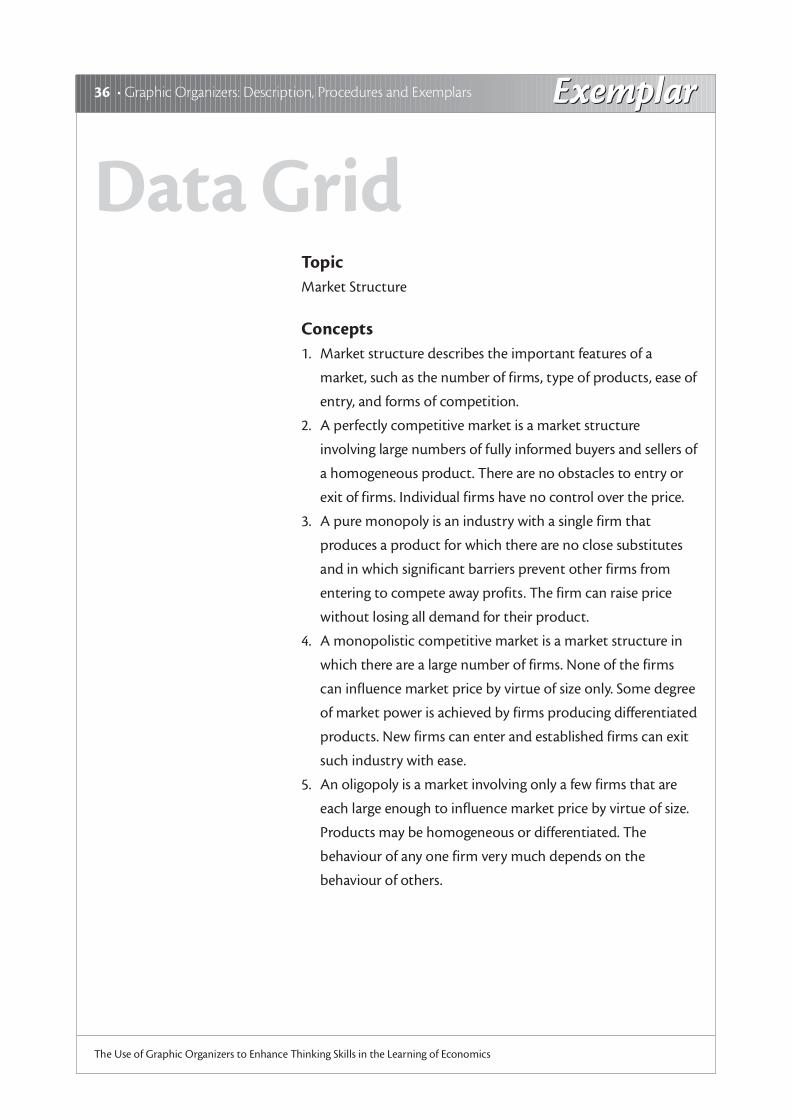
TopicMarket Structure
Concepts1. Market structure describes the important features of a
market, such as the number of firms, type of products, ease of
entry, and forms of competition.
2. A perfectly competitive market is a market structure
involving large numbers of fully informed buyers and sellers of
a homogeneous product. There are no obstacles to entry or
exit of firms. Individual firms have no control over the price.
3. A pure monopoly is an industry with a single firm that
produces a product for which there are no close substitutes
and in which significant barriers prevent other firms from
entering to compete away profits. The firm can raise price
without losing all demand for their product.
4. A monopolistic competitive market is a market structure in
which there are a large number of firms. None of the firms
can influence market price by virtue of size only. Some degree
of market power is achieved by firms producing differentiated
products. New firms can enter and established firms can exit
such industry with ease.
5. An oligopoly is a market involving only a few firms that are
each large enough to influence market price by virtue of size.
Products may be homogeneous or differentiated. The
behaviour of any one firm very much depends on the
behaviour of others.
Data Grid

ExemplarExemplar Chapter 7 • 37
The Use of Graphic Organizers to Enhance Thinking Skills in the Learning of Economics
PerfectCompetition
Research Topic : Market Structure
MonopolisticCompetition
Oligopoly Monopoly
Number of Firms Many Many Few One
Types of Product Homogeneous DifferentiatedHomogeneous /
Differentiated----
Forms ofCompetitionamong theProducers
----Non-price
CompetitionPrice/Non-price
Competition----
Availability ofInformation
PerfectInformation
ImperfectInformation
ImperfectInformation
ImperfectInformation
Barrier of Entry Free Entry Free Entry Entry Restricted Entry Restricted
Control over Price Price Taker Price Searcher Price Searcher Price Searcher
Market Structure
38 • Graphic Organizers: Description, Procedures and Exemplars
The Use of Graphic Organizers to Enhance Thinking Skills in the Learning of Economics
Discussion MapDescriptionThis organizer can be used to help students consider both sides
of an issue before drawing conclusion. Students are trained to
develop skills in comparing and contrasting points of view from
different people.
Procedures1. Discuss and identify an issue that students are interested in.
2. Students brainstorm the reasons for and against the
argument and record their ideas in the appropriate boxes.
3. Having considered all the pros and cons, try to arrive at a class
conclusion and write a brief justification to support the
decision.
Chapter 7 • 39
The Use of Graphic Organizers to Enhance Thinking Skills in the Learning of Economics
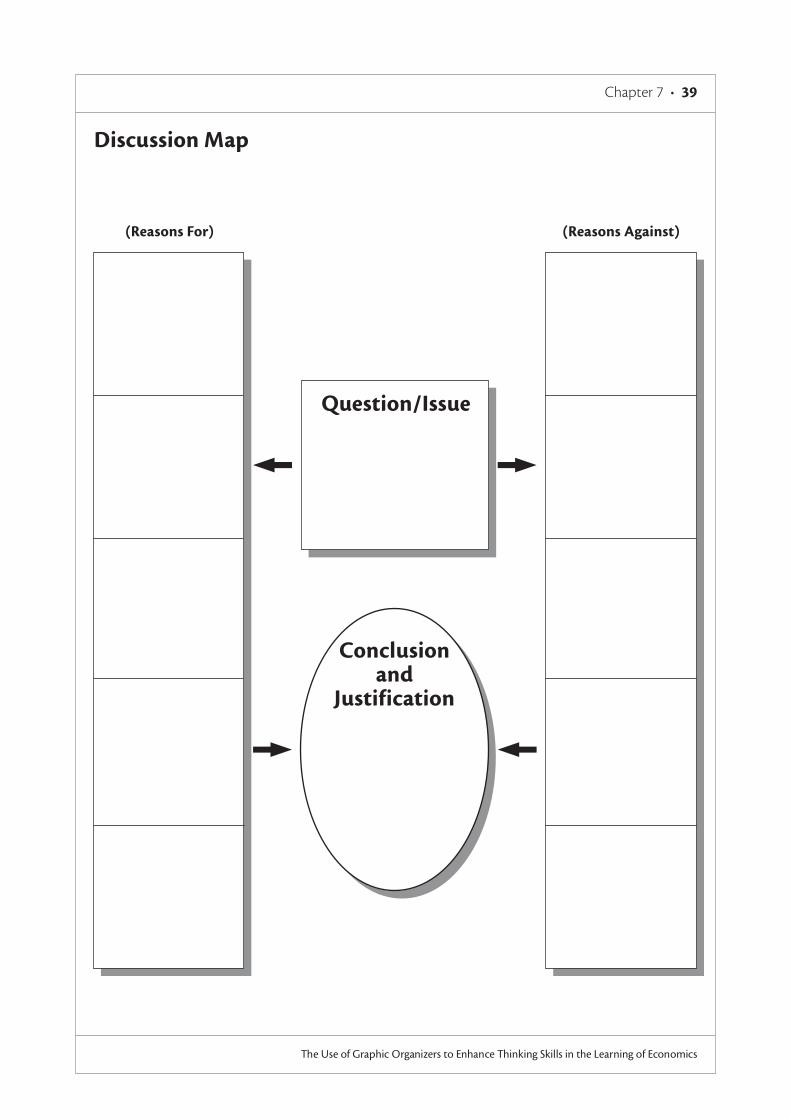
Discussion Map
(Reasons Against)(Reasons For)
Question/Issue
Conclusionand
Justification

ExemplarExemplar40 • Graphic Organizers: Description, Procedures and Exemplars
The Use of Graphic Organizers to Enhance Thinking Skills in the Learning of Economics
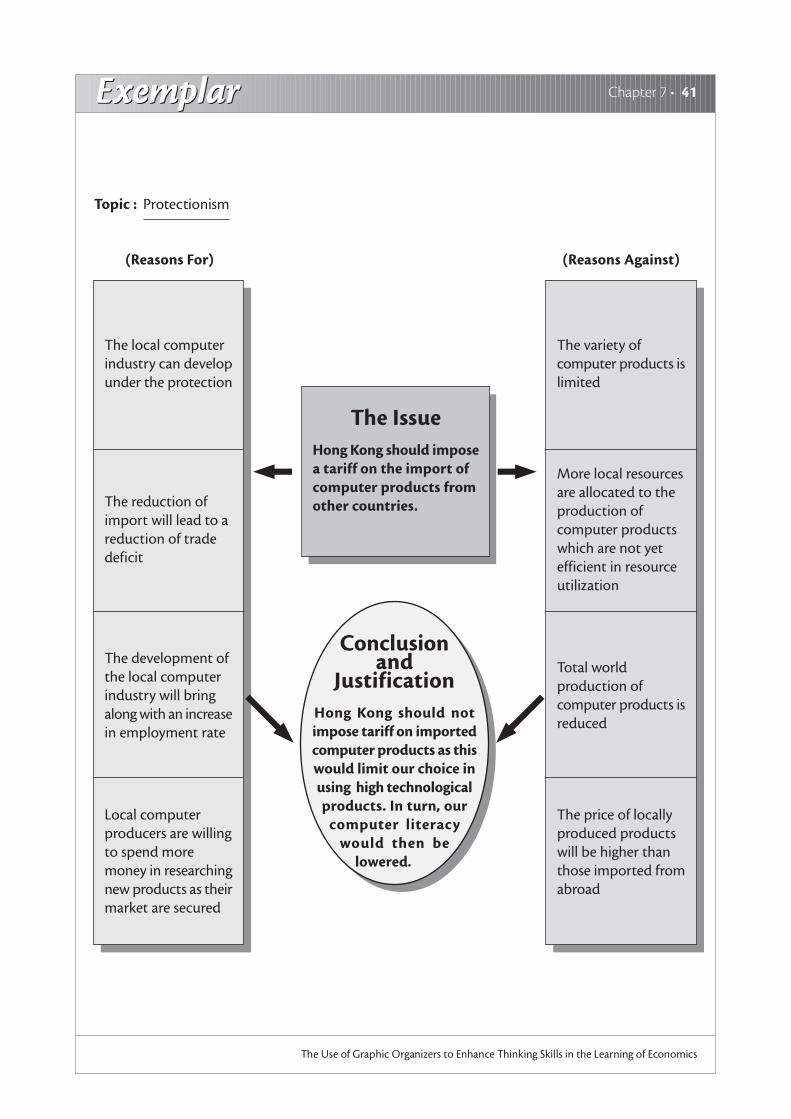
TopicProtectionism
Concepts1. Reasons for protectionism:
A. Protection of local infant industries
B. Correcting adverse balance of payment position
C. Protecting declining industries
D. Preventing dumping goods from other countries
E. Increasing local employment rate
2. Reasons against protectionism:
A. Limiting choices of consumers
B. Reduction in world output
C. Resource misallocation
D. Retaliation from other countries
E. Inefficient use of resources
Discussion Map
ExemplarExemplar Chapter 7 • 41
The Use of Graphic Organizers to Enhance Thinking Skills in the Learning of Economics
Conclusionand
JustificationHong Kong should notimpose tariff on importedcomputer products as thiswould limit our choice inusing high technologicalproducts. In turn, our
computer literacywould then be
lowered.
(Reasons Against)(Reasons For)
The variety ofcomputer products islimited
The IssueHong Kong should imposea tariff on the import ofcomputer products fromother countries.
The local computerindustry can developunder the protection
The reduction ofimport will lead to areduction of tradedeficit
The development ofthe local computerindustry will bringalong with an increasein employment rate
Local computerproducers are willingto spend moremoney in researchingnew products as theirmarket are secured
More local resourcesare allocated to theproduction ofcomputer productswhich are not yetefficient in resourceutilization
Total worldproduction ofcomputer products isreduced
The price of locallyproduced productswill be higher thanthose imported fromabroad
Topic : Protectionism

42 • Graphic Organizers: Description, Procedures and Exemplars
The Use of Graphic Organizers to Enhance Thinking Skills in the Learning of Economics
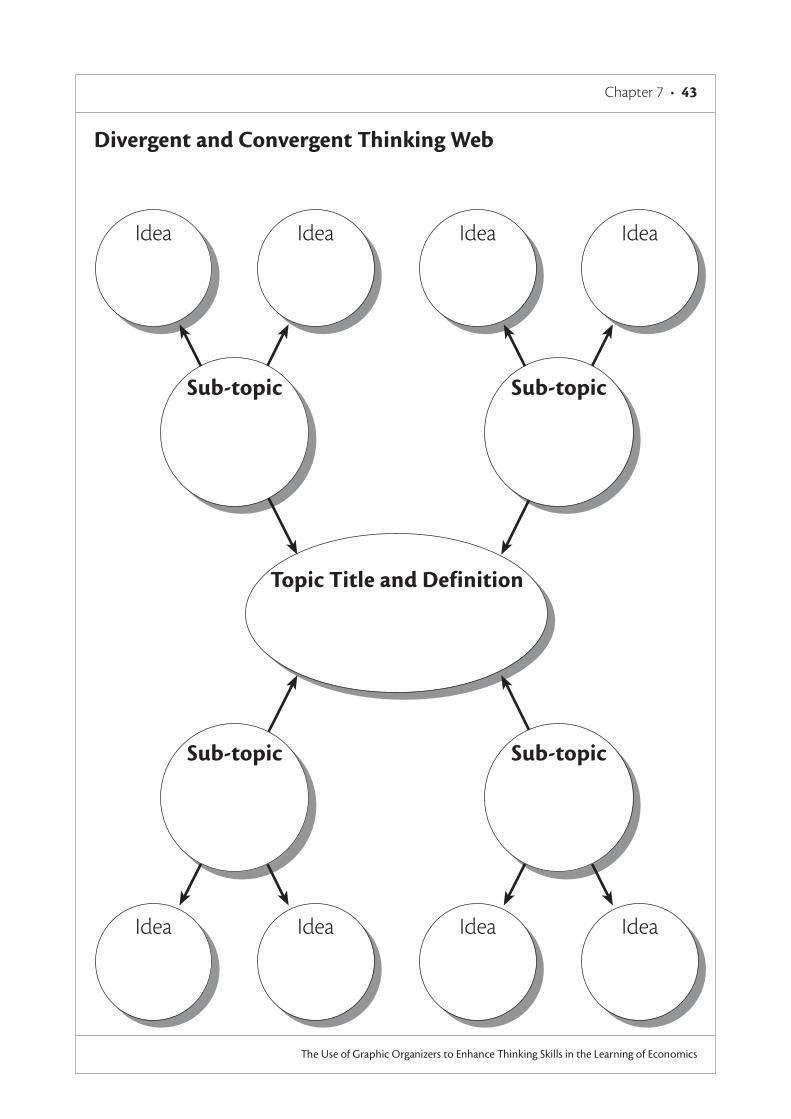
DescriptionThis organizer can be used to help students brainstorm ideas in
such a way as to show the relationship between various topics
and subtopics. Students are encouraged to generate as many
ideas as possible in relation to a given topic. They are then
required to refine their ideas by thinking convergently and finally
weave them into a definition.
Procedures1. Choose a topic to discuss and write it down in the centred
box.
2. Brainstorm ideas in such a way as to show the relationship
between the subtopics.
3. After discussion, refine the ideas by eliminating certain
unrelated/incorrect attributes from the list.
4. Put the critical attributes into the appropriate outer layer
boxes.
5. Take the critical attributes and weave them into a definition.
6. Write the definition under the topic title in the centred box.
7. Check the definition by applying it to a wide range of
examples and cases.
Divergent and ConvergentThinking Web
Chapter 7 • 43
The Use of Graphic Organizers to Enhance Thinking Skills in the Learning of Economics
Divergent and Convergent Thinking Web
Topic Title and Definition
Idea Idea
Sub-topic
Idea Idea
Sub-topic
Idea Idea
Sub-topic
Idea Idea
Sub-topic
ExemplarExemplar44 • Graphic Organizers: Description, Procedures and Exemplars
The Use of Graphic Organizers to Enhance Thinking Skills in the Learning of Economics
TopicIntegration of Firms
Concepts1. An integration of firms occurs when two previously
independent firms are combined under a single owner orgroup of owners, with the main reason to raise theircompetitiveness in the market.
2. A horizontal integration is the combining of two firmsproducing similar products. The aims for doing so are to usethe resources more efficiently, to enlarge the market shares,and to enjoy the advantages of economies of scale. Theintegration of two banks is a typical example.
3. A vertical integration is the combining of two firms one ofwhich is the input supplier/market outlet of the other. Abackward vertical integration is formed in order to ensure thesupply of inputs whereas a forward vertical integration is forthe purpose of having an outlet of production. Bothbackward and forward vertical integration can enjoy thebenefit of economies of scale and more efficient use ofresources. The integration of a flour manufacturing firm anda bakery shop is an example of backward vertical integrationto the bakery shop, but an example of forward verticalintegration to the flour manufacturing firm.
4. A lateral integration is the combining of two firms producingrelated but not competitive products. The aims of doing soare to have better use of resources and diversity ofproduction and risks. The integration of two shops sellingwatches and jewellery is a typical example.
5. A conglomerate integration is the combining of two firmsproducing unrelated products. The firms are combinedtogether in order to have more efficient use of resources, andto diversify lines of production and risks. The combining of atransport company and a restaurant is an example ofconglomerate integration.
Divergent and ConvergentThinking Web

ExemplarExemplar Chapter 7 • 45
The Use of Graphic Organizers to Enhance Thinking Skills in the Learning of Economics
Combining of two firms whichproduce related but not
competitive products
Integration of FirmsCombining of two previously independentfirms in order to have more efficient use ofresources and to raise the competitiveness
in the market
HorizontalIntegration
VerticalIntegration
LateralIntegration
ConglomerateIntegration
Combining of two firms whichproduce similar products
Combining of two firms whichare at different stages in
producing a product
Have a larger marketshare
More efficient use ofresources
Enjoy economies ofscale
Backward VerticalIntegration
Forward VerticalIntegration
Enjoyeconomiesof scale andbetter use
ofresources
Ensureresourcesupply
Ensuremarketoutlet
Combining of two firms whichproduce unrelated products
Diversity ofproduction and risks
More efficient use ofresources
Topic : Integration of Firms

46 • Graphic Organizers: Description, Procedures and Exemplars
The Use of Graphic Organizers to Enhance Thinking Skills in the Learning of Economics
Hierarchy DiagramDescriptionThis organizer can be used to help students see superordinate
and subordinate categories of a concept or topic. It clarifies
relationships between and among concepts/topics in different
levels.
Procedures1. Choose a topic and write it in the box at the top of the
organizer.
2. Brainstorm a list of the subcategories of the topic.
3. Cluster the ideas into different levels of ranks and levels.
4. Write the first subordinates in the boxes in the second level.
Add or delete boxes whereas appropriate.
5. With materials that have more than two levels, students can
add additional levels to the organizer.

Chapter 7 • 47
The Use of Graphic Organizers to Enhance Thinking Skills in the Learning of Economics
Main Topic
Sub-topic 1 Sub-topic 2 Sub-topic 3
Hierarchy Diagram

ExemplarExemplar48 • Graphic Organizers: Description, Procedures and Exemplars
The Use of Graphic Organizers to Enhance Thinking Skills in the Learning of Economics
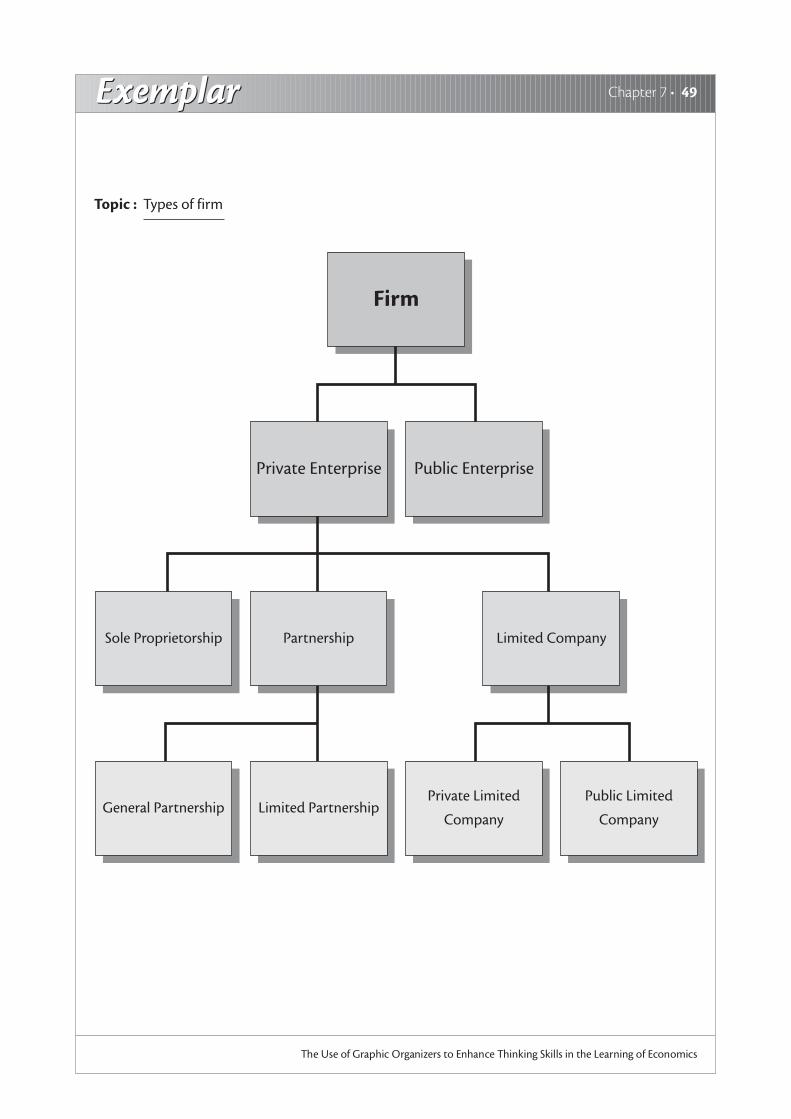
TopicTypes of firm
Concepts1. Firms can be divided generally into private and public
enterprises.
2. For the private enterprises, there are three different types of
firm, namely sole proprietorship, partnership and limited
company.
3. Partnership can be further divided into general partnership
and limited partnership.
4. There are also two different types of limited company; they
are private limited company and public limited company.
Hierarchy Diagram
ExemplarExemplar Chapter 7 • 49
The Use of Graphic Organizers to Enhance Thinking Skills in the Learning of Economics
General Partnership
Firm
Private Enterprise Public Enterprise
Limited PartnershipPrivate Limited
Company
Sole Proprietorship Partnership Limited Company
Public Limited
Company
Topic : Types of firm
50 • Graphic Organizers: Description, Procedures and Exemplars
The Use of Graphic Organizers to Enhance Thinking Skills in the Learning of Economics
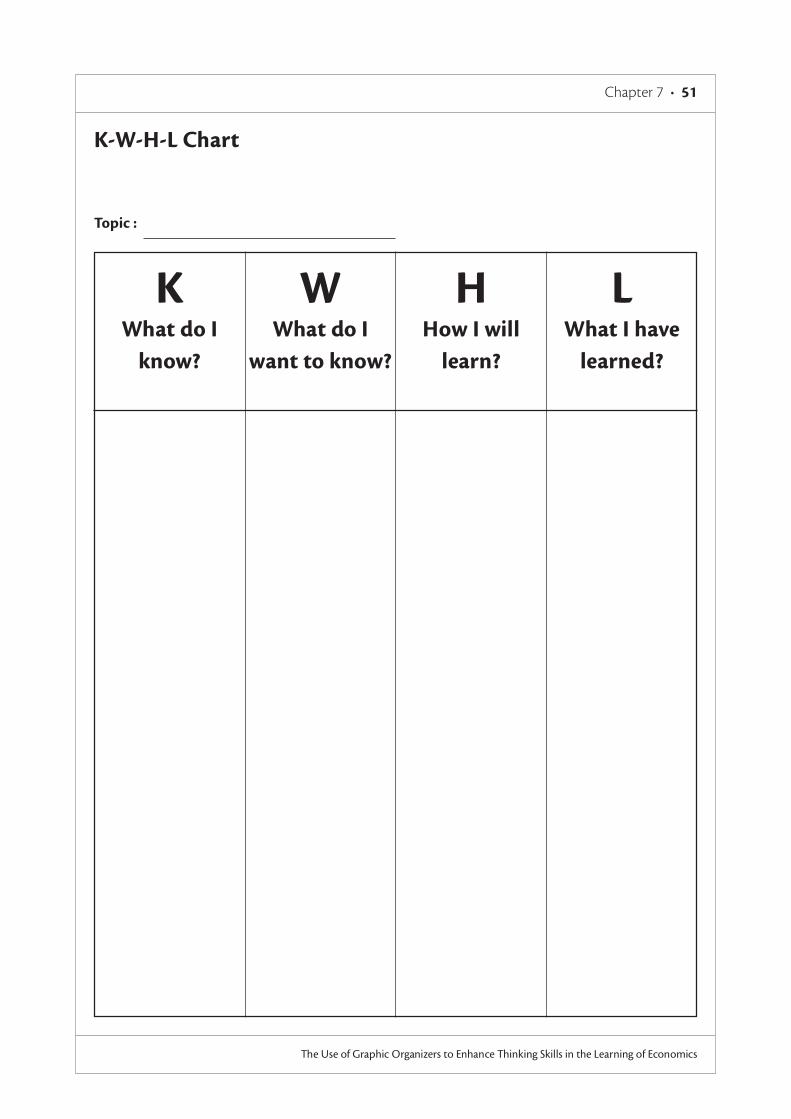
K-W-H-L ChartDescriptionThis organizer can be used to help students understand the
questions of what they know (K), what they want to know (W),
how they will learn (H) and what they have learned (L) in
relation to a specific topic. This is an effective tool to make
students identify their prior knowledge and let them set their
own targets and means of learning. Finally students are required
to write down what they have learned to show the new
knowledge they have obtained.
Procedures1. Choose a topic that students are interested in researching.
2. Record the questions the students have about the topic in
the ‘W’ column. This establishes a guide for researching.
3. Ask students to share the prior experience on the topic and
list them in the ‘K’ column.
4. Help students identify possible ways to research the need
information and record them in the ‘H’ column.
5. List the new information and knowledge in the ‘L’ column.
6. Discuss whether students’ prior knowledge listed in the ‘K’
column can be confirmed or denied.
Chapter 7 • 51
The Use of Graphic Organizers to Enhance Thinking Skills in the Learning of Economics
K-W-H-L Chart
KWhat do I
know?
Topic :
WWhat do I
want to know?
HHow I will
learn?
LWhat I have
learned?
ExemplarExemplar52 • Graphic Organizers: Description, Procedures and Exemplars
The Use of Graphic Organizers to Enhance Thinking Skills in the Learning of Economics
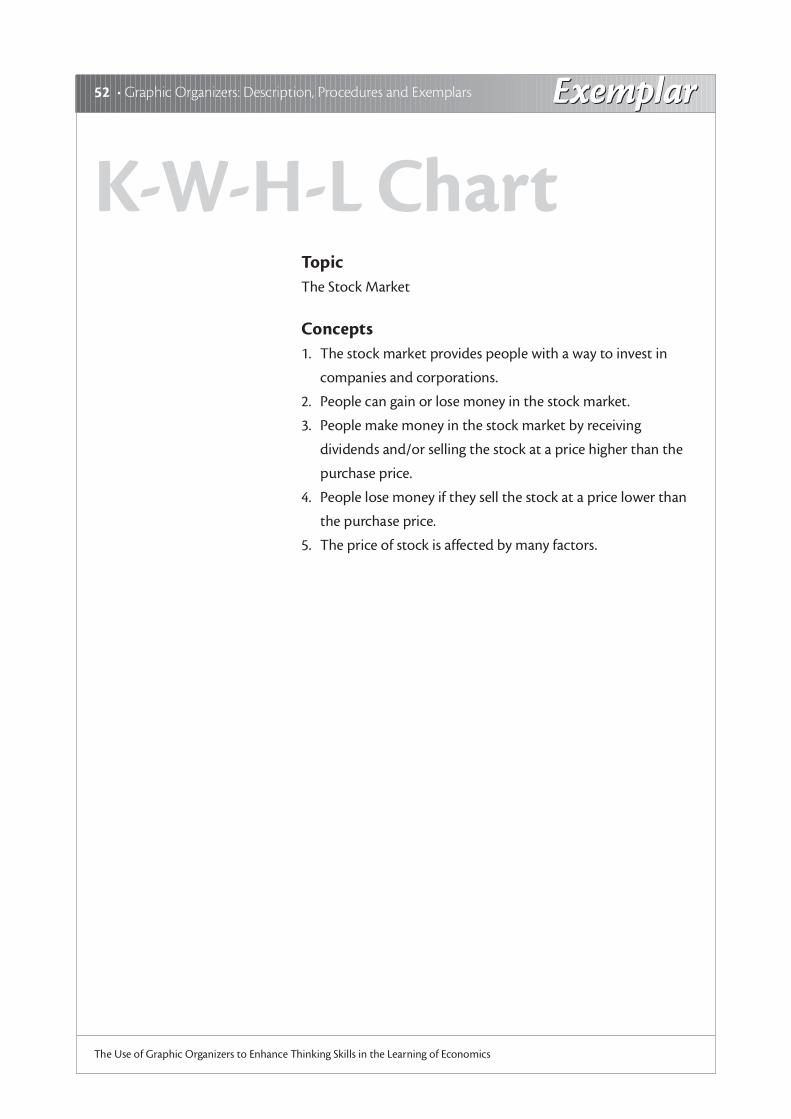
TopicThe Stock Market
Concepts1. The stock market provides people with a way to invest in
companies and corporations.
2. People can gain or lose money in the stock market.
3. People make money in the stock market by receiving
dividends and/or selling the stock at a price higher than the
purchase price.
4. People lose money if they sell the stock at a price lower than
the purchase price.
5. The price of stock is affected by many factors.
K-W-H-L Chart
ExemplarExemplar Chapter 7 • 53
The Use of Graphic Organizers to Enhance Thinking Skills in the Learning of Economics
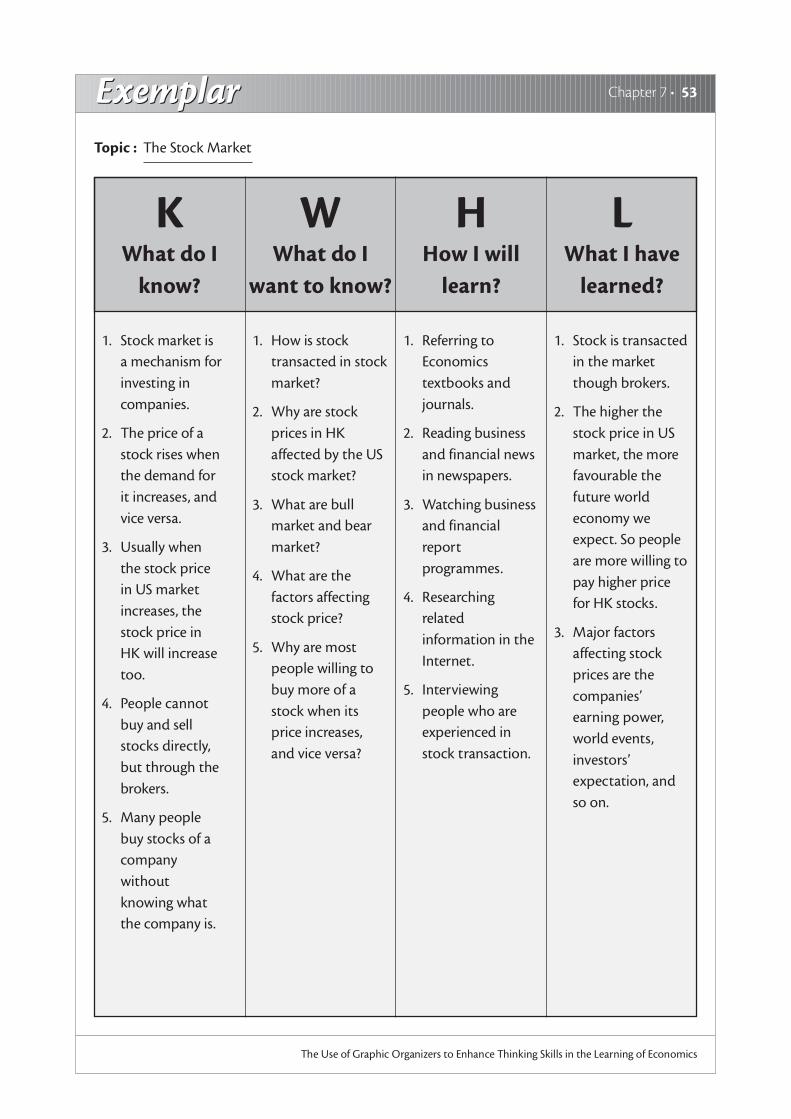
1. Stock market isa mechanism forinvesting incompanies.
2. The price of astock rises whenthe demand forit increases, andvice versa.
3. Usually whenthe stock pricein US marketincreases, thestock price inHK will increasetoo.
4. People cannotbuy and sellstocks directly,but through thebrokers.
5. Many peoplebuy stocks of acompanywithoutknowing whatthe company is.
KWhat do I
know?
Topic :
WWhat do I
want to know?
HHow I will
learn?
The Stock Market
1. How is stocktransacted in stockmarket?
2. Why are stockprices in HKaffected by the USstock market?
3. What are bullmarket and bearmarket?
4. What are thefactors affectingstock price?
5. Why are mostpeople willing tobuy more of astock when itsprice increases,and vice versa?
1. Referring toEconomicstextbooks andjournals.
2. Reading businessand financial newsin newspapers.
3. Watching businessand financialreportprogrammes.
4. Researchingrelatedinformation in theInternet.
5. Interviewingpeople who areexperienced instock transaction.
1. Stock is transactedin the marketthough brokers.
2. The higher thestock price in USmarket, the morefavourable thefuture worldeconomy weexpect. So peopleare more willing topay higher pricefor HK stocks.
3. Major factorsaffecting stockprices are thecompanies’earning power,world events,investors’expectation, andso on.
LWhat I have
learned?

54 • Graphic Organizers: Description, Procedures and Exemplars
The Use of Graphic Organizers to Enhance Thinking Skills in the Learning of Economics
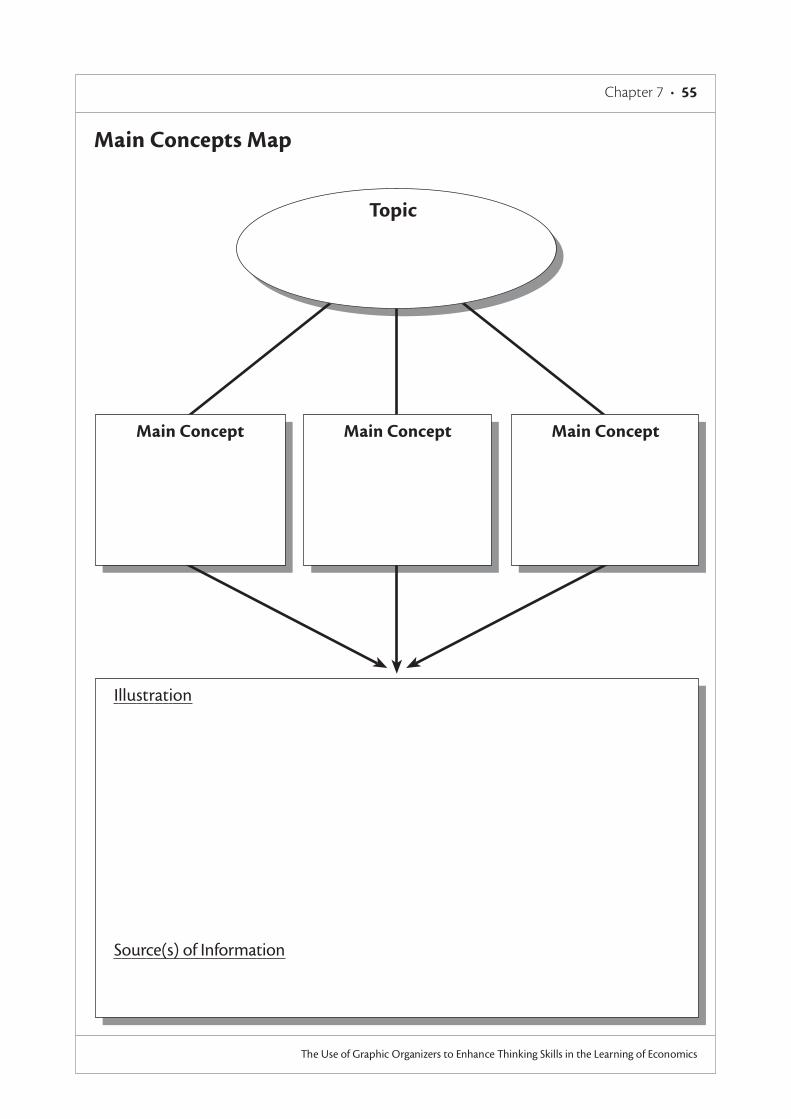
Main Concepts MapDescriptionThis organizer can be used to help students identify the main
concepts of a topic. Students are encouraged to give a broad
interpretation of the components of a topic and to support
their ideas with specific information from relevant source.
Procedures1. Choose a topic to discuss.
2. Identify main concepts that are important to the
understanding of the topic.
3. Research information that illustrates the interrelationship
among the main concepts.
4. Quote the source(s) of the information you get.
Chapter 7 • 55
The Use of Graphic Organizers to Enhance Thinking Skills in the Learning of Economics
Main Concepts Map
Main Concept Main Concept Main Concept
Topic
Illustration
Source(s) of Information
ExemplarExemplar56 • Graphic Organizers: Description, Procedures and Exemplars
The Use of Graphic Organizers to Enhance Thinking Skills in the Learning of Economics
Main Concepts Map
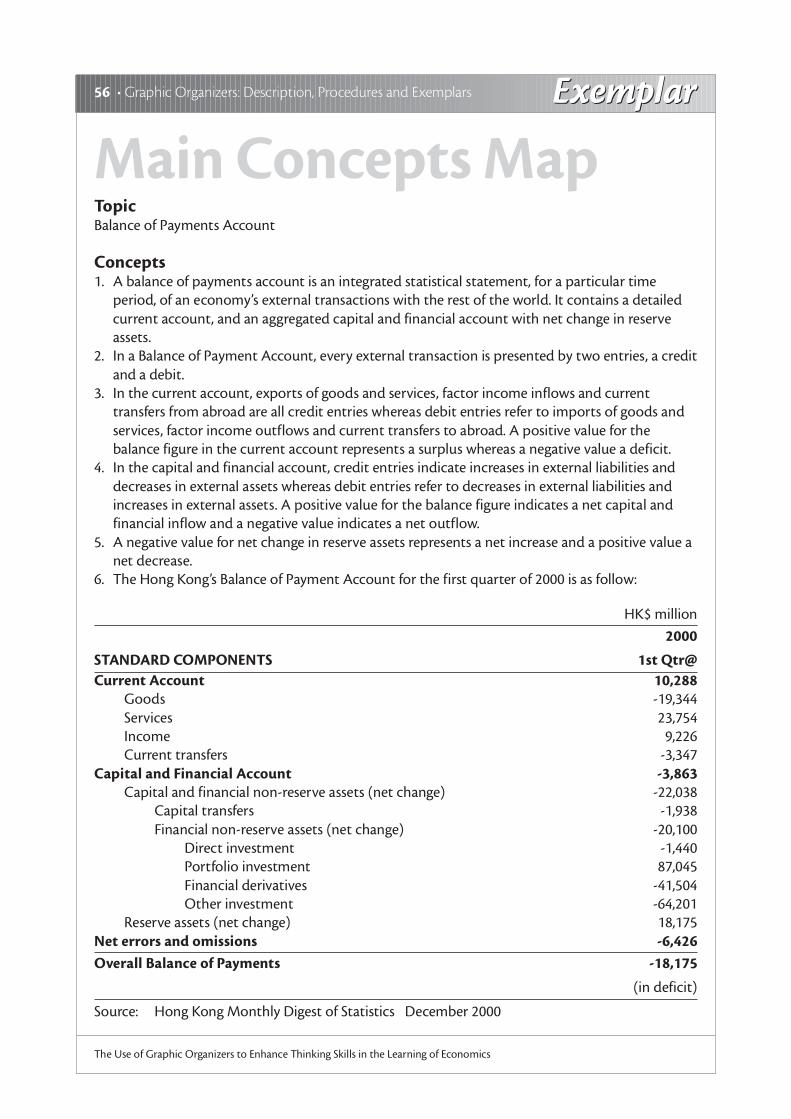
HK$ million
2000
STANDARD COMPONENTS 1st Qtr@Current Account 10,288
Goods -19,344Services 23,754Income 9,226Current transfers -3,347
Capital and Financial Account -3,863Capital and financial non-reserve assets (net change) -22,038
Capital transfers -1,938Financial non-reserve assets (net change) -20,100
Direct investment -1,440Portfolio investment 87,045Financial derivatives -41,504Other investment -64,201
Reserve assets (net change) 18,175Net errors and omissions -6,426Overall Balance of Payments -18,175
(in deficit)
Source: Hong Kong Monthly Digest of Statistics December 2000
TopicBalance of Payments Account
Concepts1. A balance of payments account is an integrated statistical statement, for a particular time
period, of an economy’s external transactions with the rest of the world. It contains a detailedcurrent account, and an aggregated capital and financial account with net change in reserveassets.
2. In a Balance of Payment Account, every external transaction is presented by two entries, a creditand a debit.
3. In the current account, exports of goods and services, factor income inflows and currenttransfers from abroad are all credit entries whereas debit entries refer to imports of goods andservices, factor income outflows and current transfers to abroad. A positive value for thebalance figure in the current account represents a surplus whereas a negative value a deficit.
4. In the capital and financial account, credit entries indicate increases in external liabilities anddecreases in external assets whereas debit entries refer to decreases in external liabilities andincreases in external assets. A positive value for the balance figure indicates a net capital andfinancial inflow and a negative value indicates a net outflow.
5. A negative value for net change in reserve assets represents a net increase and a positive value anet decrease.
6. The Hong Kong’s Balance of Payment Account for the first quarter of 2000 is as follow:

ExemplarExemplar Chapter 7 • 57
The Use of Graphic Organizers to Enhance Thinking Skills in the Learning of Economics
Main ConceptBalance of Payments
Account = Current Account+ Capital and Financial
Account
Illustration
1. Balance of Payments AccountThis is an integrated statistical statement of an economy’s external transactions with therest of the world. It contains the current account, the integrated capital and financialaccount a9with net change in reserve assets).
2. Current AccountCredit entries Debit entries
a. exports of goods and services a. imports of goods and servicesb. factor income inflows b. factor income outflowsc. current transfers from abroad c. current transfers to abroad
• A ‘+’ value for the balance figure represents a surplus whereas a ‘-‘ value a deficit.
3. Capital and Financial AccountA. Capital and financial non-reserve assets
Credit entries Debit entriesa. increases in external liabilities a. decreases in external liabilitiesb. decreases in external assets b. increases in external assets
• A ‘+’ value for the balance figure indicates a net inflow whereas a ‘-‘ value a net outflow.
B. Net change in reserve assetsA ‘-‘ value represents a net increase whereas a ‘+’ value a net decrease.
Source of InformationCensus and Statistics Departmenthttp://www.info.gov.hk/censtatd/eng/press/bal_payment/bop_0699.htm(as at 29 May 2000)
Main ConceptCurrent account consists ofimports/exports of goods
and services, factor incomeinflows and outflows, andcurrent transfers to/from
abroad.
Main ConceptCapital and financial
account consists of changesof external liabilities and
assets
Balance of PaymentsAccounts in Hong Kong
Topic : Balance of Payments Account
58 • Graphic Organizers: Description, Procedures and Exemplars
The Use of Graphic Organizers to Enhance Thinking Skills in the Learning of Economics
Math Factors OrganizerDescriptionThis organizer can be used to help students understand possible
factors that make up a concept. In other words, students are
expected to brainstorm all associative properties of the concept.
Procedures1. Choose and write the concept in the centred box of the
organizer.
2. Discuss possible factors contributing to the concept.
3. Brainstorm possible associative property of numbers that
make up the same result as stated in the concept.
Chapter 7 • 59
The Use of Graphic Organizers to Enhance Thinking Skills in the Learning of Economics
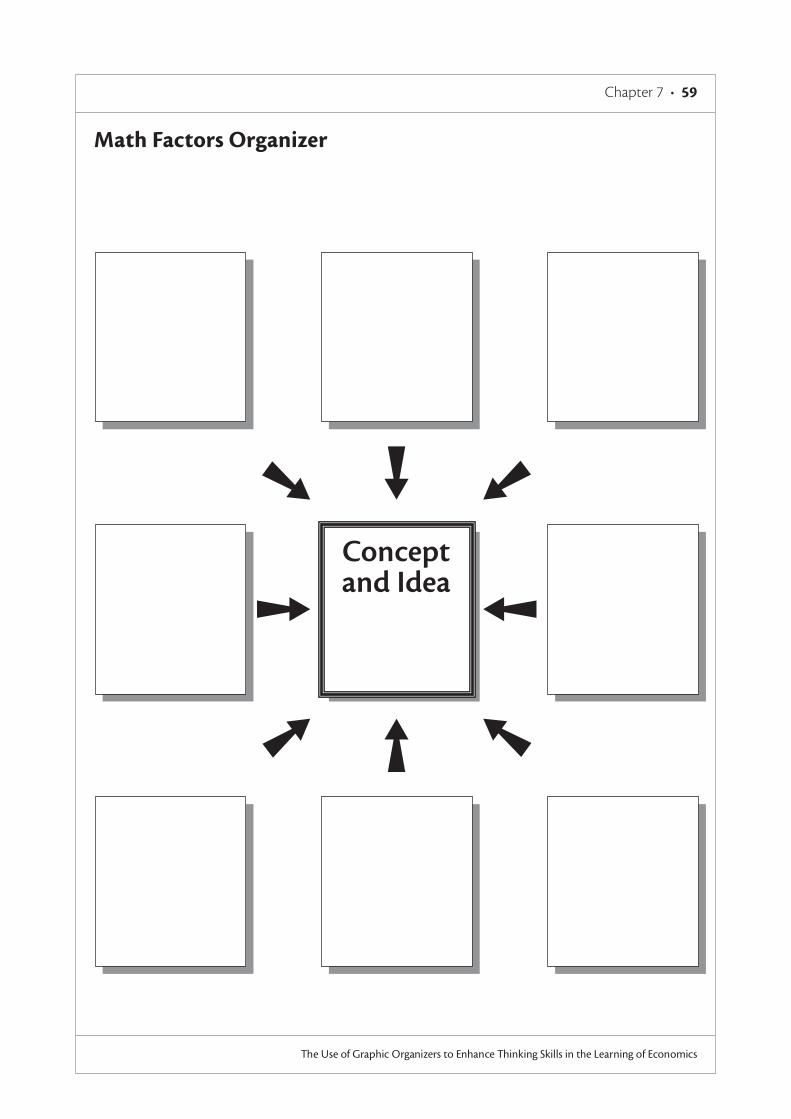
Math Factors Organizer
Conceptand Idea
ExemplarExemplar60 • Graphic Organizers: Description, Procedures and Exemplars
The Use of Graphic Organizers to Enhance Thinking Skills in the Learning of Economics
TopicTotal Revenue and Price Elasticity of Demand
Concepts1. Total Revenue(TR) = Price per unit(P) x Quantity sold(Q)
2. If the price elasticity of demand (Ed) is equal to one, any
change in price will result in a same proportional change in its
quantity sold. Therefore, the total revenue of the product
sold will remain constant.
Math Factors Organizer

ExemplarExemplar Chapter 7 • 61
The Use of Graphic Organizers to Enhance Thinking Skills in the Learning of Economics
P = $100Q = 60
P = $80Q = 75
P = $60Q = 100
P = $20Q = 300
P = $50Q = 120
TR = $6,000(Assume Ed = 1)
P = $15Q = 400
P = $30Q = 200
P = $40Q = 150
Topic : Total Revenue and Price Elasticity of Demand
62 • Graphic Organizers: Description, Procedures and Exemplars
The Use of Graphic Organizers to Enhance Thinking Skills in the Learning of Economics
Multiple Meaning MapDescriptionThis organizer can be used to help students explore concepts
with more than one meaning, definitions, examples and
categories. It is an excellent tool to develop students’ skill in
creating associations and conceptual links.
Procedures1. Choose a concept/word with multiple meanings, definitions,
examples...etc. and put it in the centre of the organizer.
2. Identify the various meanings (or other categories) of the
concept/word and help students make connections. Put
these categories in the boxes of the outer level. Adding or
deleting the number of boxes as needed.
3. Brainstorm associations to each of the categories.

Chapter 7 • 63
The Use of Graphic Organizers to Enhance Thinking Skills in the Learning of Economics
Multiple Meaning Map
Description Description
Description Description
CategoryCategory
CategoryCategory
Concept
ExemplarExemplar64 • Graphic Organizers: Description, Procedures and Exemplars
The Use of Graphic Organizers to Enhance Thinking Skills in the Learning of Economics
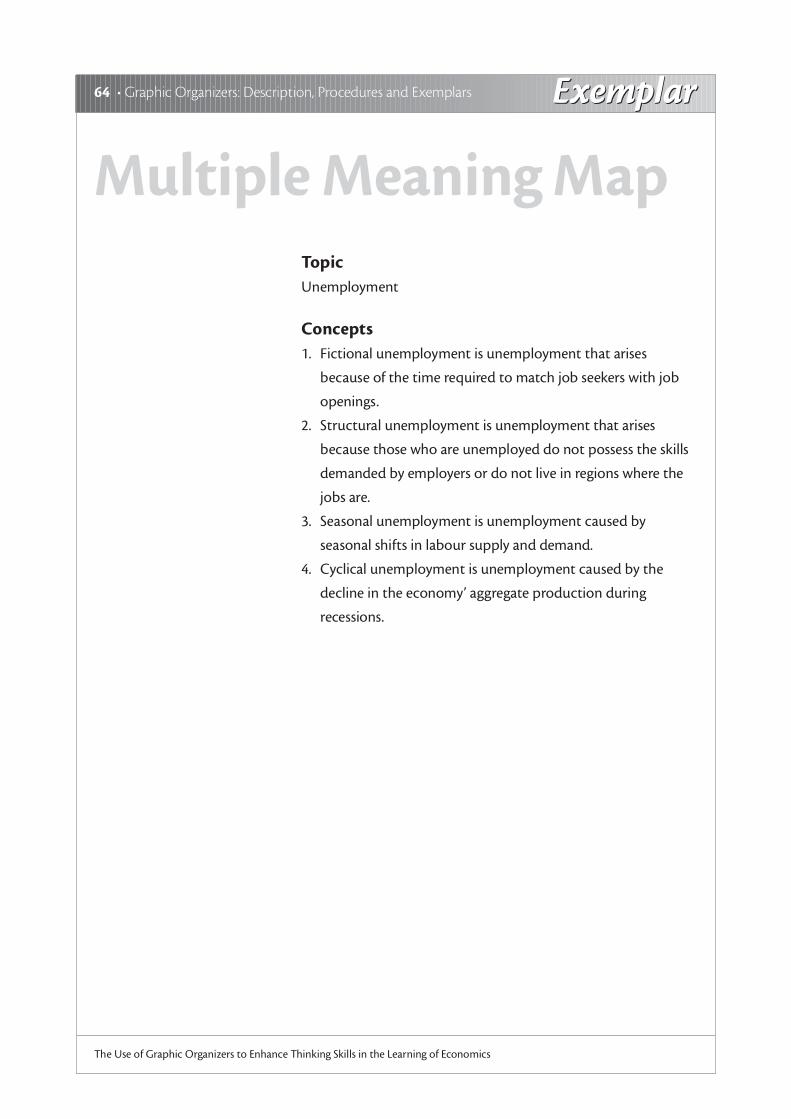
TopicUnemployment
Concepts1. Fictional unemployment is unemployment that arises
because of the time required to match job seekers with job
openings.
2. Structural unemployment is unemployment that arises
because those who are unemployed do not possess the skills
demanded by employers or do not live in regions where the
jobs are.
3. Seasonal unemployment is unemployment caused by
seasonal shifts in labour supply and demand.
4. Cyclical unemployment is unemployment caused by the
decline in the economy’ aggregate production during
recessions.
Multiple Meaning Map

ExemplarExemplar Chapter 7 • 65
The Use of Graphic Organizers to Enhance Thinking Skills in the Learning of Economics
CyclicalUnemployment
This arises because of thedecline in the economy’saggregate production duringrecessions.
This arises because ofseasonal shifts in laboursupply and demand.
SeasonalUnemployment
StructuralUnemployment
Unemployment
FictionalUnemployment
This arises because those whoare unemployed do notpossess the skills demandedby employers or do not livein regions where the jobs are.
This arises because of the timerequired to match job seekerswith job openings.
Topic : Unemployment
66 • Graphic Organizers: Description, Procedures and Exemplars
The Use of Graphic Organizers to Enhance Thinking Skills in the Learning of Economics
Multiple TimelineDescriptionThis organizer can be used to help students acquire the skill to
look at various aspects of a time period and see the influences
they have on one another. For instance, students may trace the
relationship between rates of unemployment and inflation in a
specific period of time.
Procedures1. Choose a topic of the multiple timeline and put it at the top
of the organizer.
2. Enter the beginning and ending points of time of study in the
appropriate blanks.
3. Decide upon what subtopics or aspects to be compared on
the left-hand side of the organizer.
4. Research and collect information (data and/or events) that fit
the subtopics or aspects, and enter them in the appropriate
boxes.
5. Give a brief conclusion of the relationship between/among
the subtopics or events at the end of the organizer.

Chapter 7 • 67
The Use of Graphic Organizers to Enhance Thinking Skills in the Learning of Economics
Multiple Timeline
Topic :
Dates
Subtopic/Aspect
Events/Data
Conclusion:
Dates
Subtopic/Aspect
Events/Data
ExemplarExemplar68 • Graphic Organizers: Description, Procedures and Exemplars
The Use of Graphic Organizers to Enhance Thinking Skills in the Learning of Economics
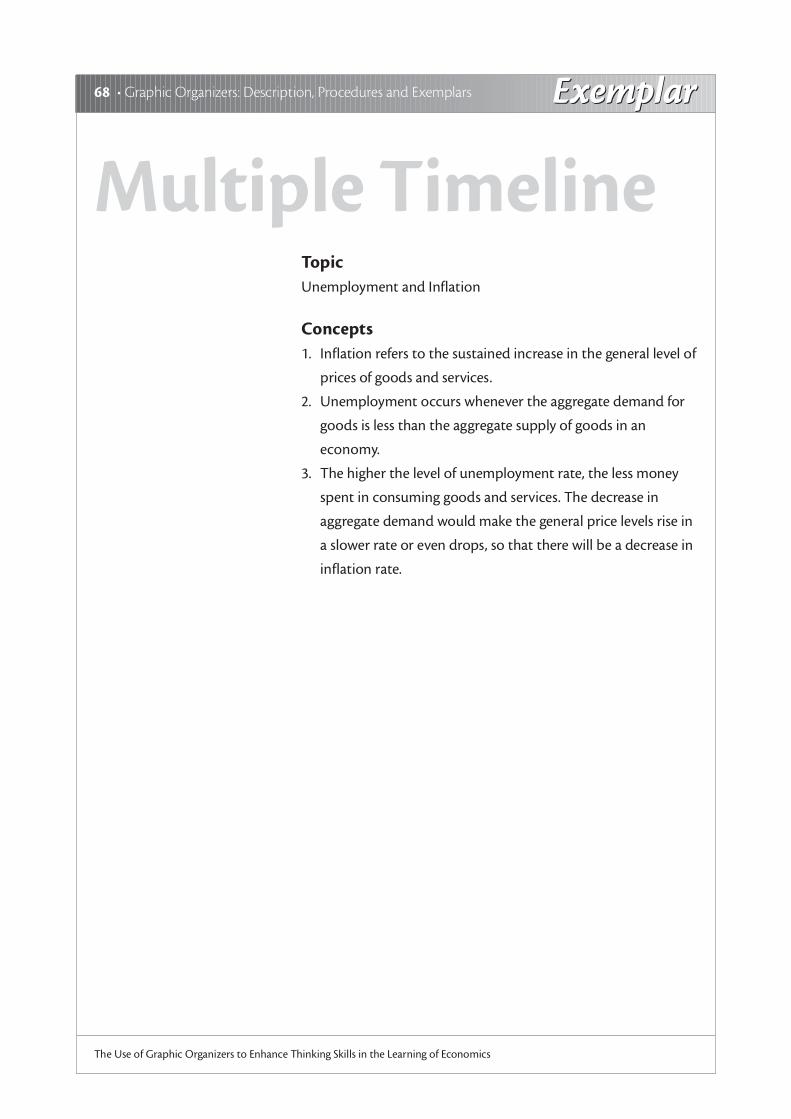
TopicUnemployment and Inflation
Concepts1. Inflation refers to the sustained increase in the general level of
prices of goods and services.
2. Unemployment occurs whenever the aggregate demand for
goods is less than the aggregate supply of goods in an
economy.
3. The higher the level of unemployment rate, the less money
spent in consuming goods and services. The decrease in
aggregate demand would make the general price levels rise in
a slower rate or even drops, so that there will be a decrease in
inflation rate.
Multiple Timeline
ExemplarExemplar Chapter 7 • 69
The Use of Graphic Organizers to Enhance Thinking Skills in the Learning of Economics
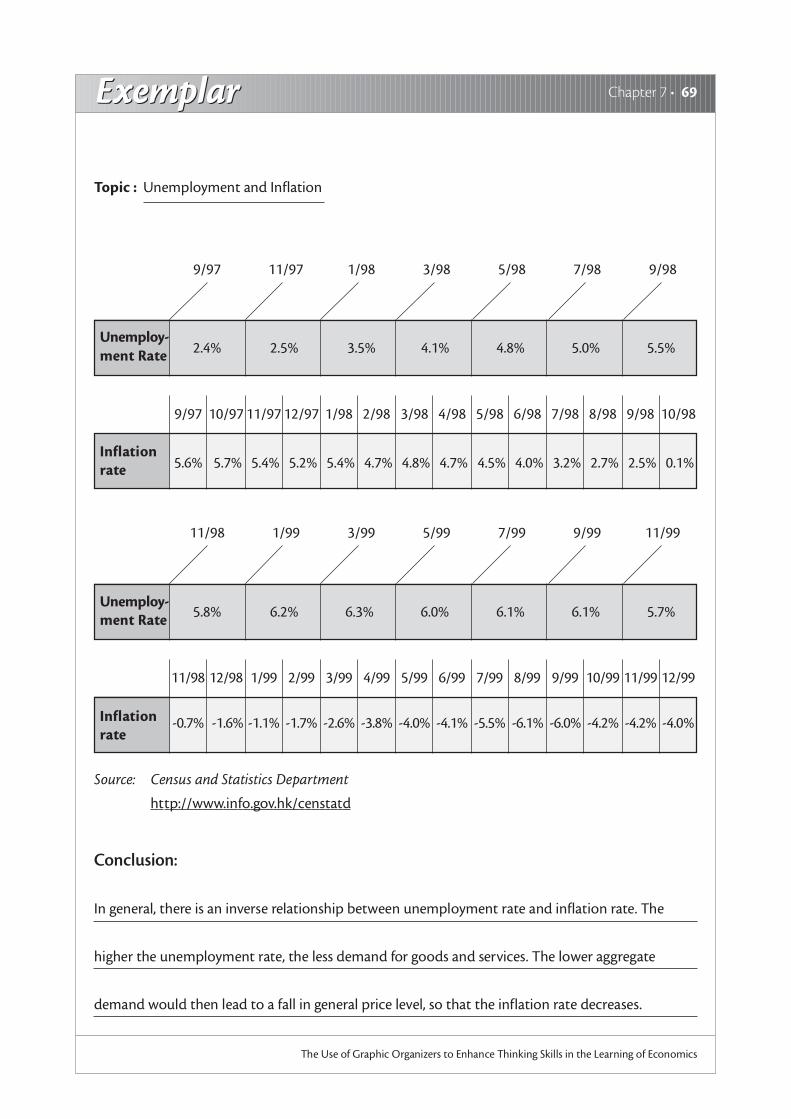
9/97 11/97 1/98 3/98 5/98 7/98 9/98
Topic : Unemployment and Inflation
Unemploy-ment Rate
Inflationrate
Unemploy-ment Rate
Inflationrate
2.4% 2.5% 3.5% 4.1% 4.8% 5.0% 5.5%
9/97 10/97 11/97 12/97 1/98 2/98 3/98 4/98 5/98 6/98 7/98 8/98 9/98 10/98
5.6% 5.7% 5.4% 5.2% 5.4% 4.7% 4.8% 4.7% 4.5% 4.0% 3.2% 2.7% 2.5% 0.1%
11/98 1/99 3/99 5/99 7/99 9/99 11/99
5.8% 6.2% 6.3% 6.0% 6.1% 6.1% 5.7%
11/98 12/98 1/99 2/99 3/99 4/99 5/99 6/99 7/99 8/99 9/99 10/99 11/99 12/99
-0.7% -1.6% -1.1% -1.7% -2.6% -3.8% -4.0% -4.1% -5.5% -6.1% -6.0% -4.2% -4.2% -4.0%
Source: Census and Statistics Department
http://www.info.gov.hk/censtatd
Conclusion:
In general, there is an inverse relationship between unemployment rate and inflation rate. The
higher the unemployment rate, the less demand for goods and services. The lower aggregate
demand would then lead to a fall in general price level, so that the inflation rate decreases.
70 • Graphic Organizers: Description, Procedures and Exemplars
The Use of Graphic Organizers to Enhance Thinking Skills in the Learning of Economics
One and All OrganizerDescriptionThis organizer can be used to help students uncover similarities
and differences among several items. It is designed to facilitate
the development of students’ comparing and contrasting skills.
Procedures1. Choose a topic to be discussed.
2. Divide the class into several groups and assign each group a
subtopic.
3. Have students name a characteristic of their subtopic. Decide
whether the characteristic is unique, or if it is shared.
4. Record the shared characteristics in the centered circle, and
the unique characteristics in respective subtopic boxes.
5. Ask students to give examples as well as the rationale for
their decisions.

Chapter 7 • 71
The Use of Graphic Organizers to Enhance Thinking Skills in the Learning of Economics
One and All Organizer
Subtopic
Subtopic
Subtopic Subtopic
Topic

ExemplarExemplar72 • Graphic Organizers: Description, Procedures and Exemplars
The Use of Graphic Organizers to Enhance Thinking Skills in the Learning of Economics
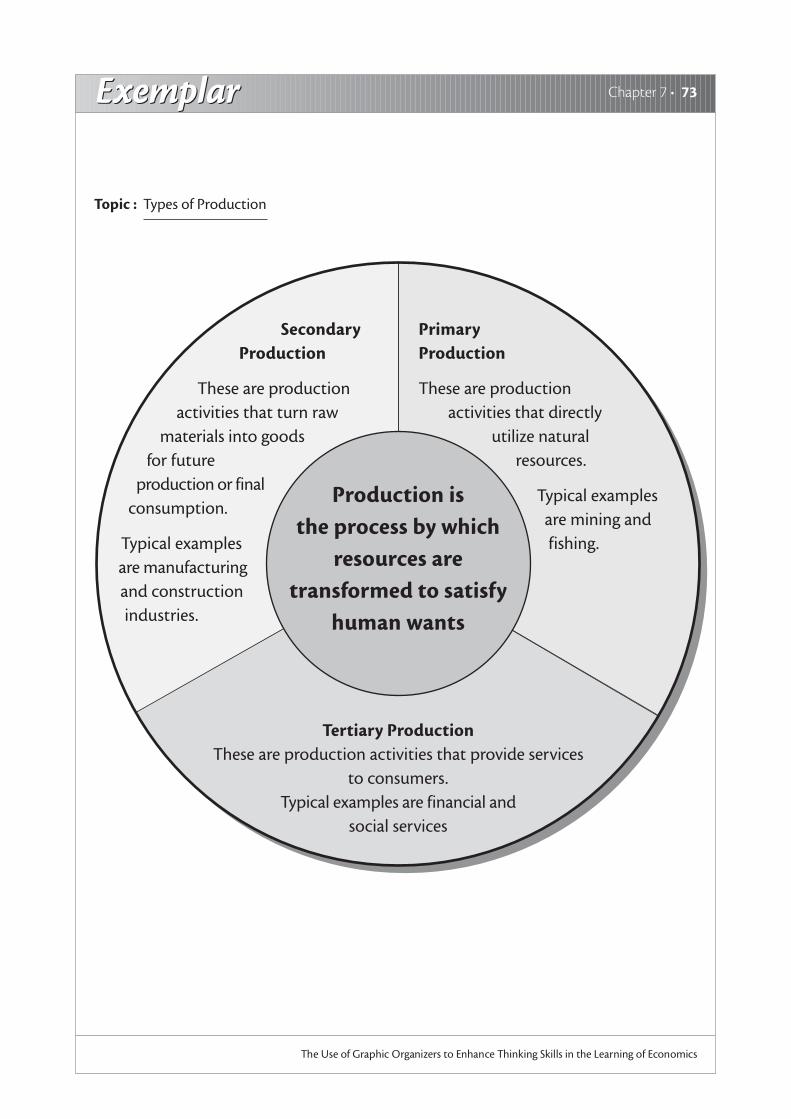
TopicTypes of Production
Concepts1. Production is the process by which resources are transformed
to satisfy human wants.
2. Primary production refers to activities that directly utilize
natural resources in the process of production. Fishing and
mining are typical examples.
3. Secondary production refers to production activities that
turn raw materials into goods for future production or final
consumption. Manufacturing and construction industries are
typical examples.
4. Tertiary production refers to the provision of services.
Financial services and social services are typical examples.
One and All Organizer
ExemplarExemplar Chapter 7 • 73
The Use of Graphic Organizers to Enhance Thinking Skills in the Learning of Economics
Production isthe process by which
resources aretransformed to satisfy
human wants
PrimaryProduction
These are productionactivities that directly
utilize naturalresources.
Typical examplesare mining andfishing.
SecondaryProduction
These are productionactivities that turn raw
materials into goodsfor future
production or finalconsumption.
Typical examplesare manufacturingand constructionindustries.
Tertiary ProductionThese are production activities that provide services
to consumers.Typical examples are financial and
social services
Topic : Types of Production

74 • Graphic Organizers: Description, Procedures and Exemplars
The Use of Graphic Organizers to Enhance Thinking Skills in the Learning of Economics
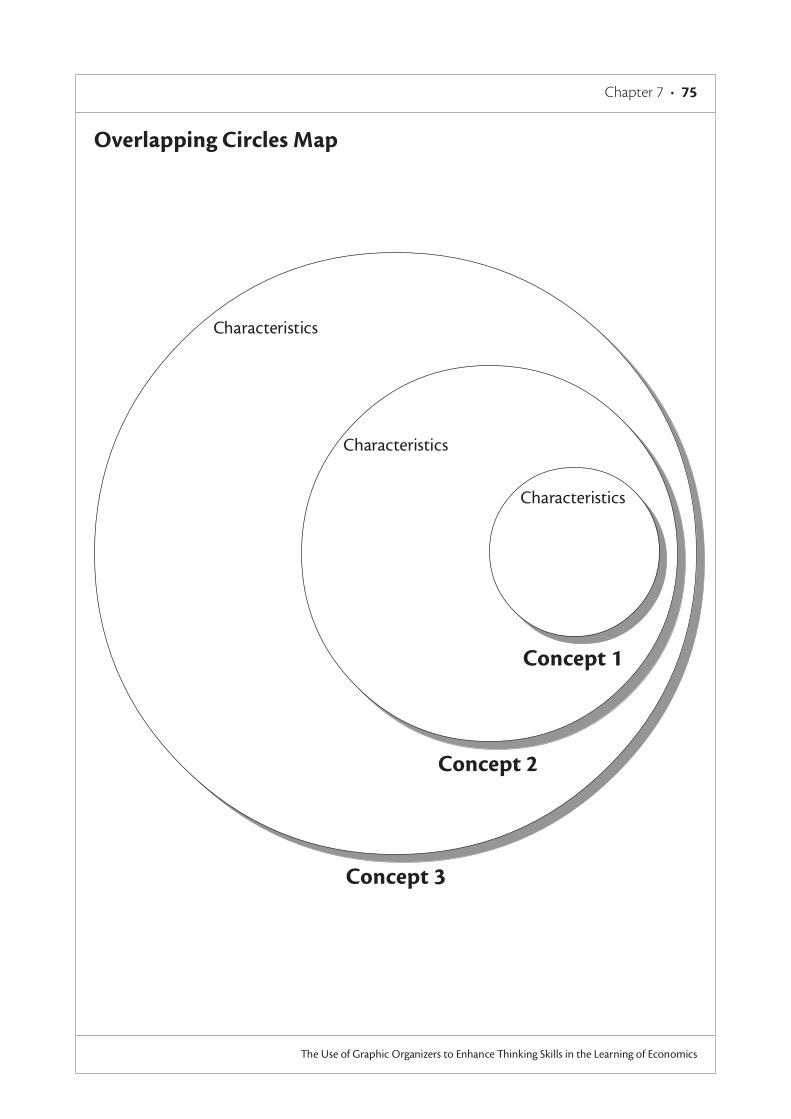
Overlapping Circles MapDescriptionThis organizer can be used to help students develop skill in
comparing and contrasting similarities and/or differences. This is
specially designed to show the relationship of two concepts of
which one is the subset of the other. This organizer may consist
of two or more circles.
Procedures1. Identify and label above each circle the concepts to be
compared and contrasted.
2. Discuss and record their similarities and differences.
3. Put the shared characteristics in the appropriate overlapping
sectors.
4. Record the unique characteristics of each concept in its own
sector.
Chapter 7 • 75
The Use of Graphic Organizers to Enhance Thinking Skills in the Learning of Economics
Overlapping Circles Map
Concept 1
Characteristics
Concept 2
Characteristics
Concept 3
Characteristics
ExemplarExemplar76 • Graphic Organizers: Description, Procedures and Exemplars
The Use of Graphic Organizers to Enhance Thinking Skills in the Learning of Economics
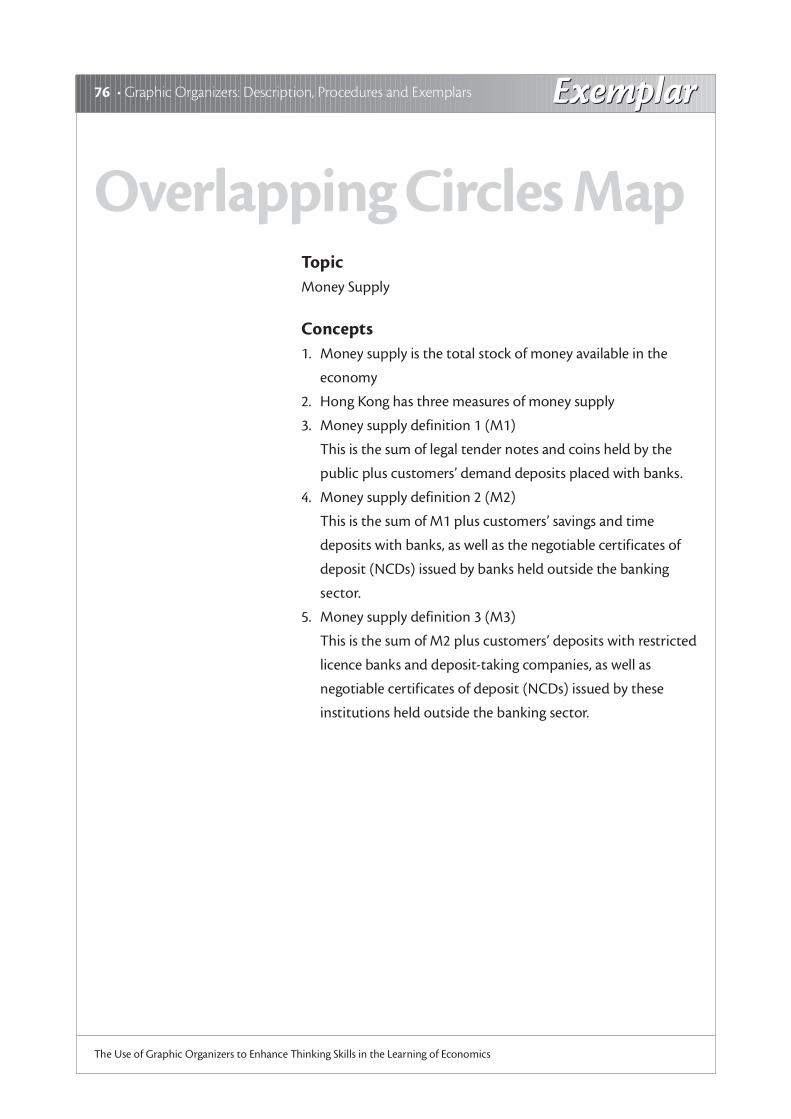
TopicMoney Supply
Concepts1. Money supply is the total stock of money available in the
economy
2. Hong Kong has three measures of money supply
3. Money supply definition 1 (M1)
This is the sum of legal tender notes and coins held by the
public plus customers’ demand deposits placed with banks.
4. Money supply definition 2 (M2)
This is the sum of M1 plus customers’ savings and time
deposits with banks, as well as the negotiable certificates of
deposit (NCDs) issued by banks held outside the banking
sector.
5. Money supply definition 3 (M3)
This is the sum of M2 plus customers’ deposits with restricted
licence banks and deposit-taking companies, as well as
negotiable certificates of deposit (NCDs) issued by these
institutions held outside the banking sector.
Overlapping Circles Map

ExemplarExemplar Chapter 7 • 77
The Use of Graphic Organizers to Enhance Thinking Skills in the Learning of Economics
Topic : Money Supply
M3
M2
M1
➣ legal tender notesand coins held bythe public
➣ demand depositsplaced withbanks
➣ deposits with restrictedlicence banks anddeposits-takingcompanies
➣ negotiable certificates ofdeposit issued by theabove two institutionsheld outside thebanking sector
➣ savings and timedeposits with banks
➣ negotiablecertificates of depositissued by banks heldoutside the bankingsector

78 • Graphic Organizers: Description, Procedures and Exemplars
The Use of Graphic Organizers to Enhance Thinking Skills in the Learning of Economics
Persuasion MapDescriptionThis organizer can be used to help students get familiar with the
process of persuasive writing. Students are required not only to
identify evidence in support of their argument, but also to
acknowledge opposing opinions.
Procedures1. Choose an issue of interest.
2. Discuss the ideas and facts to support both sides of the
controversial issue.
3. List all facts and ideas on the blackboard.
3. Students choose a position on one side or the other.
4. According to their own understanding and choice, write
several reasons to support their position in the ‘supporting
evidence’ boxes. Opposing evidences should also be
identified and written in the ‘opposing evidence’ box.
5. Help students reconsider their position if needed and write it
in the ‘conclusion’ boxes.

Chapter 7 • 79
The Use of Graphic Organizers to Enhance Thinking Skills in the Learning of Economics
Persuasion Map
Supporting Evidence 1 Opposing Evidence 1
Supporting Evidence 2 Opposing Evidence 2
Supporting Evidence 3 Opposing Evidence 3
Position
Conclusion

ExemplarExemplar80 • Graphic Organizers: Description, Procedures and Exemplars
The Use of Graphic Organizers to Enhance Thinking Skills in the Learning of Economics
TopicOrdinary Shares and Debentures
Concepts1. Both ordinary shares and debentures are ways that a
company obtains capital from the public.
2. Ordinary shareholders have voting right in shareholders’
meeting.
3. Ordinary shareholders may receive a high rate of dividend if
the profit of the company is high, but low or even no
dividend if the profit is low.
4. Ordinary shareholders can only receive their dividends after
preference shareholders are fully paid. Furthermore, if the
company closes down, ordinary shareholders would be the
last to get back their money. To conclude, the risk to buy
ordinary shares is quite high.
5. Debenture holders are creditors, but not shareholders of a
company, so they have no voting right over company matters.
6. Debenture holders received a fixed rate of return no matter
the company makes a profit or not.
7. If the company closes down, debenture holders would be the
first to get back their investment.
Persuasion Map

ExemplarExemplar Chapter 7 • 81
The Use of Graphic Organizers to Enhance Thinking Skills in the Learning of Economics
If I have money, I would prefer buyingdebentures to ordinary shares of a company as
my investment
Supporting Evidence 1
I am 45 years old now, Iwould not take any risk inlosing all my money.
Having considered all the pros and cons, I would still
prefer buying debentures to ordinary shares as I am
not willing to take too much risk in my investment.
Supporting Evidence 2
There is a fixed rate of returnno matter the firm earnsprofit or not.
Supporting Evidence 3
If the company closes down,I would be the first to getback my money.
Opposing Evidence 1
The return rate is fixed even
the company earns a lot of
profit.
Opposing Evidence 2
I have no voting right over
company matters.
Position
Conclusion
Topic : Ordinary Shares and Debentures

82 • Graphic Organizers: Description, Procedures and Exemplars
The Use of Graphic Organizers to Enhance Thinking Skills in the Learning of Economics
Pie ChartDescriptionThis organizer can be used to help students explore the
relationship between the parts and the whole. The pie
represents a whole entity or unit, and the individual “slices”
represent segments, or fractions, of the whole. This organizer is
often used to visualize budget allocations and demographic
information.
Procedures1. Identify a topic to research.
2. Research and calculate the percentage of the parts to the
whole.
3. Draw segments to represent the relative weight of different
parts.
4. Encourage students to discuss and evaluate whether they
would make any comment on the relative importance of the
parts.
Chapter 7 • 83
The Use of Graphic Organizers to Enhance Thinking Skills in the Learning of Economics
Pie Chart
Category 1
Category 2
Category 3
Category 4
Category 6
Category 5
ExemplarExemplar84 • Graphic Organizers: Description, Procedures and Exemplars
The Use of Graphic Organizers to Enhance Thinking Skills in the Learning of Economics
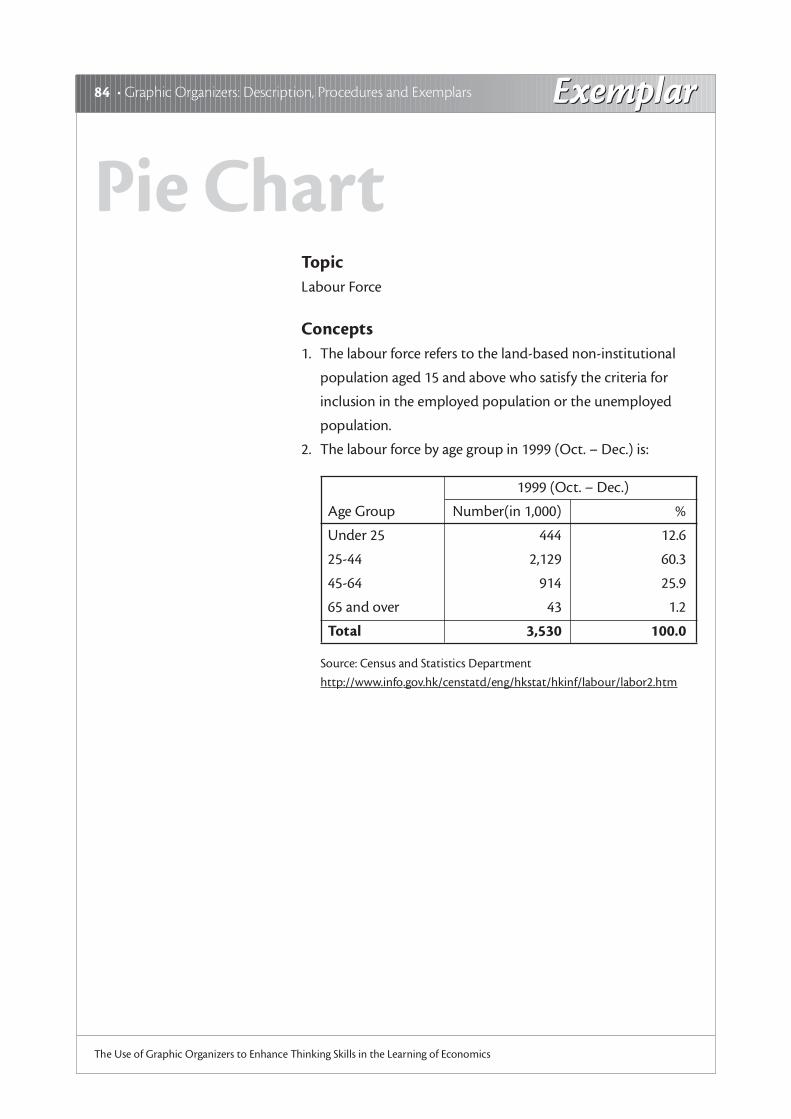
TopicLabour Force
Concepts1. The labour force refers to the land-based non-institutional
population aged 15 and above who satisfy the criteria for
inclusion in the employed population or the unemployed
population.
2. The labour force by age group in 1999 (Oct. – Dec.) is:
Pie Chart
1999 (Oct. – Dec.)
Age Group Number(in 1,000) %
Under 25 444 12.6
25-44 2,129 60.3
45-64 914 25.9
65 and over 43 1.2
Total 3,530 100.0
Source: Census and Statistics Department
http://www.info.gov.hk/censtatd/eng/hkstat/hkinf/labour/labor2.htm
ExemplarExemplar Chapter 7 • 85
The Use of Graphic Organizers to Enhance Thinking Skills in the Learning of Economics
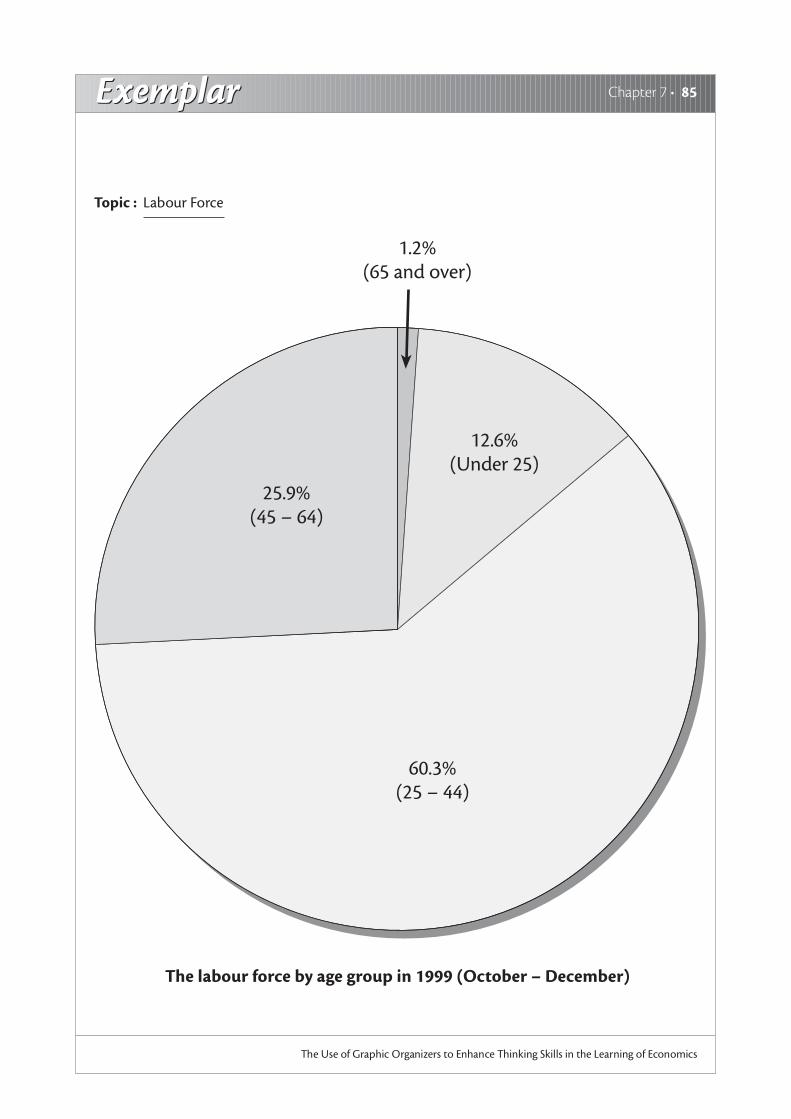
25.9%(45 – 64)
12.6%(Under 25)
60.3%(25 – 44)
The labour force by age group in 1999 (October – December)
1.2%(65 and over)
Topic : Labour Force
86 • Graphic Organizers: Description, Procedures and Exemplars
The Use of Graphic Organizers to Enhance Thinking Skills in the Learning of Economics
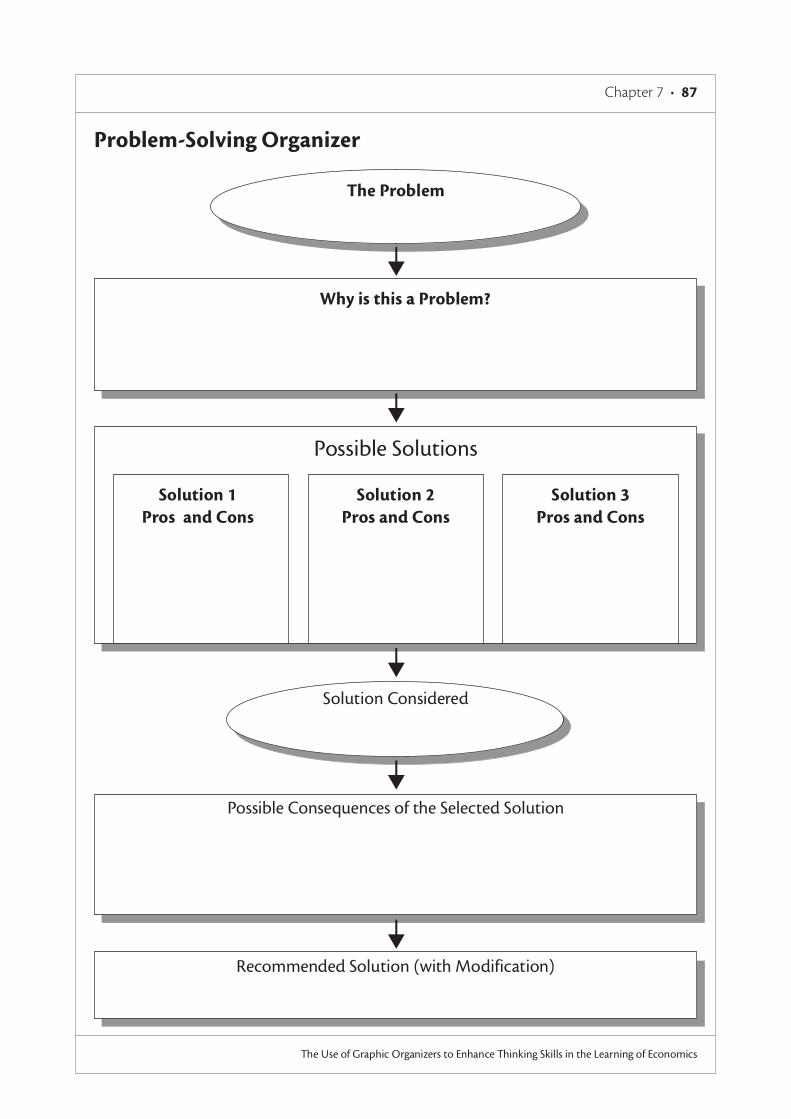
Problem-Solving OrganizerDescriptionThis organizer can be used to help students develop the
problem-solving skills that they need throughout their lives.
With this organizer students are trained to pose and evaluate
possible solutions to problems
Procedures1. Students identify a problem and write in the ‘problem’ box.
2. Ask students to think about what specially makes this a
problem.
3. Let students list all possible solutions, and the pros and cons
of each of them, in the appropriate box and choose the one
they think is the best.
4. Ask students to consider all possible consequences of the
selected solution.
5. Students then write a persuasive paragraph arguing that how
the selected one could be modified to make it the best
solution.
Chapter 7 • 87
The Use of Graphic Organizers to Enhance Thinking Skills in the Learning of Economics
Problem-Solving Organizer
The Problem
Why is this a Problem?
Possible Solutions
Solution 3Pros and Cons
Solution 2Pros and Cons
Solution 1Pros and Cons
Solution Considered
Possible Consequences of the Selected Solution
Recommended Solution (with Modification)
ExemplarExemplar88 • Graphic Organizers: Description, Procedures and Exemplars
The Use of Graphic Organizers to Enhance Thinking Skills in the Learning of Economics
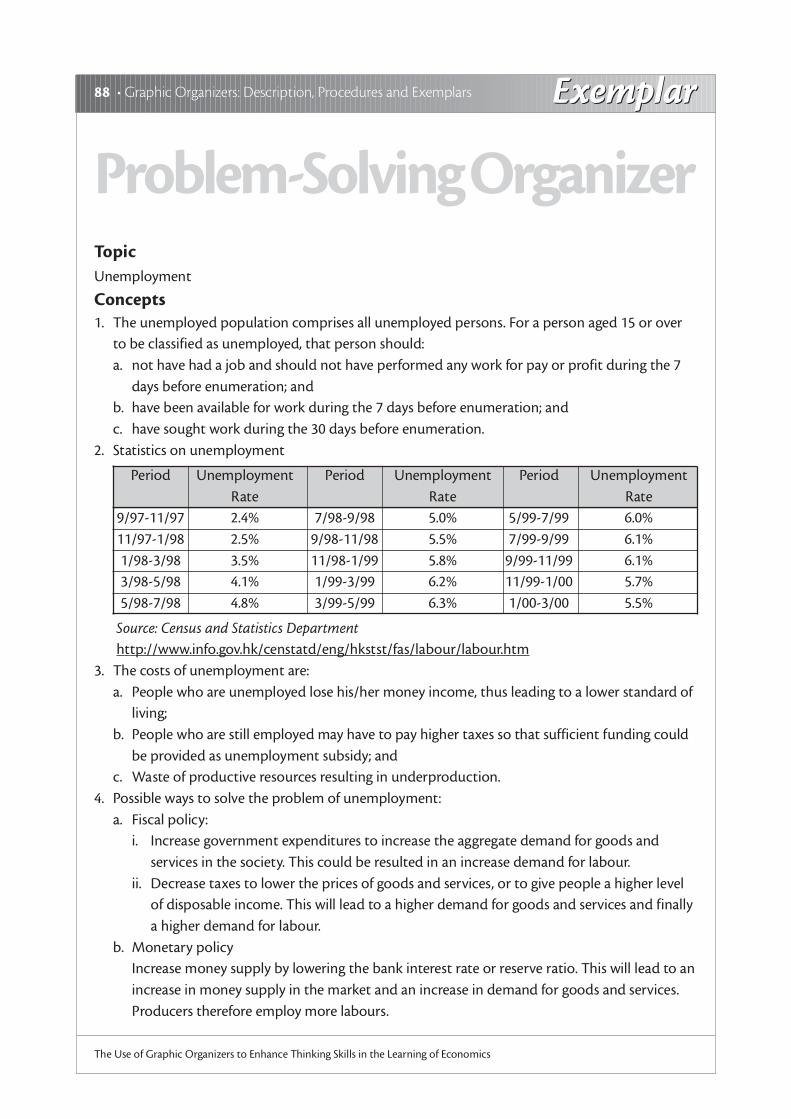
TopicUnemployment
Concepts1. The unemployed population comprises all unemployed persons. For a person aged 15 or over
to be classified as unemployed, that person should:a. not have had a job and should not have performed any work for pay or profit during the 7
days before enumeration; andb. have been available for work during the 7 days before enumeration; andc. have sought work during the 30 days before enumeration.
2. Statistics on unemployment
Period Unemployment Period Unemployment Period UnemploymentRate Rate Rate
9/97-11/97 2.4% 7/98-9/98 5.0% 5/99-7/99 6.0%11/97-1/98 2.5% 9/98-11/98 5.5% 7/99-9/99 6.1%1/98-3/98 3.5% 11/98-1/99 5.8% 9/99-11/99 6.1%3/98-5/98 4.1% 1/99-3/99 6.2% 11/99-1/00 5.7%5/98-7/98 4.8% 3/99-5/99 6.3% 1/00-3/00 5.5%
Source: Census and Statistics Department http://www.info.gov.hk/censtatd/eng/hkstst/fas/labour/labour.htm
3. The costs of unemployment are:a. People who are unemployed lose his/her money income, thus leading to a lower standard of
living;b. People who are still employed may have to pay higher taxes so that sufficient funding could
be provided as unemployment subsidy; andc. Waste of productive resources resulting in underproduction.
4. Possible ways to solve the problem of unemployment:a. Fiscal policy:
i. Increase government expenditures to increase the aggregate demand for goods andservices in the society. This could be resulted in an increase demand for labour.
ii. Decrease taxes to lower the prices of goods and services, or to give people a higher levelof disposable income. This will lead to a higher demand for goods and services and finallya higher demand for labour.
b. Monetary policyIncrease money supply by lowering the bank interest rate or reserve ratio. This will lead to anincrease in money supply in the market and an increase in demand for goods and services.Producers therefore employ more labours.
Problem-Solving Organizer

ExemplarExemplar Chapter 7 • 89
The Use of Graphic Organizers to Enhance Thinking Skills in the Learning of Economics
The ProblemThe unemployment rate in HK rises to a record
average of 5.5%.
Why is this a Problem?➣ More and more people lose their income and suffer from lower living standard.➣ Government may raise tax to provide sufficient unemployment benefit to the unemployed.➣ Valuable human resources are left idle and wasted.
Possible Solutions
Solution 3Increase money supply
ProsNo adverse effect ongovernment budget.
ConsAdverse effect on
balance of payments aslower interest rate wouldlead to capital outflow.
Solution 2Decrease taxes
ProsLow administrative cost
in conducting thisexpansionary policy.
ConsPeople may not spendthe extra income on
consumption and lessenthe effect on aggregate
demand.
Solution 1Increase government
expendituresPros
Effect on aggregatedemand is immediate
and certain.Cons
Increase expendituremay lead to government
deficit.
Solution Considered
Possible Consequences of the Selected Solution(Students may give different answers from their own perspective and understanding)
Recommended Solution (with Modification)(Students may give different answers with justification and support)
Topic : Unemployment
90 • Graphic Organizers: Description, Procedures and Exemplars
The Use of Graphic Organizers to Enhance Thinking Skills in the Learning of Economics
V MapDescriptionThis organizer can be used to help students get familiar with the
process of scientific thinking and investigation. With the aid of
this organizer, students can be helped to focus on the various
steps and the types of knowledge required for research
investigations.
Procedures1. Choose a research topic and write it at the top center.
2. Recall knowledge and facts that are related to the topic and
write them under the heading ‘What I already know’.
3. Discuss and record the relevant principles and concepts that
are important to your investigation.
4. Identify a specific area you are interested in your
investigation. Write the question at the bottom of the
organizer.
5. Decide the tools that can be used to research the question
and write them in the centre of the graph.
6. Design the research plan, including dates, times and methods.
7. Finally, complete the top right corner by recording an analysis
of the data, conclusion, and implication.
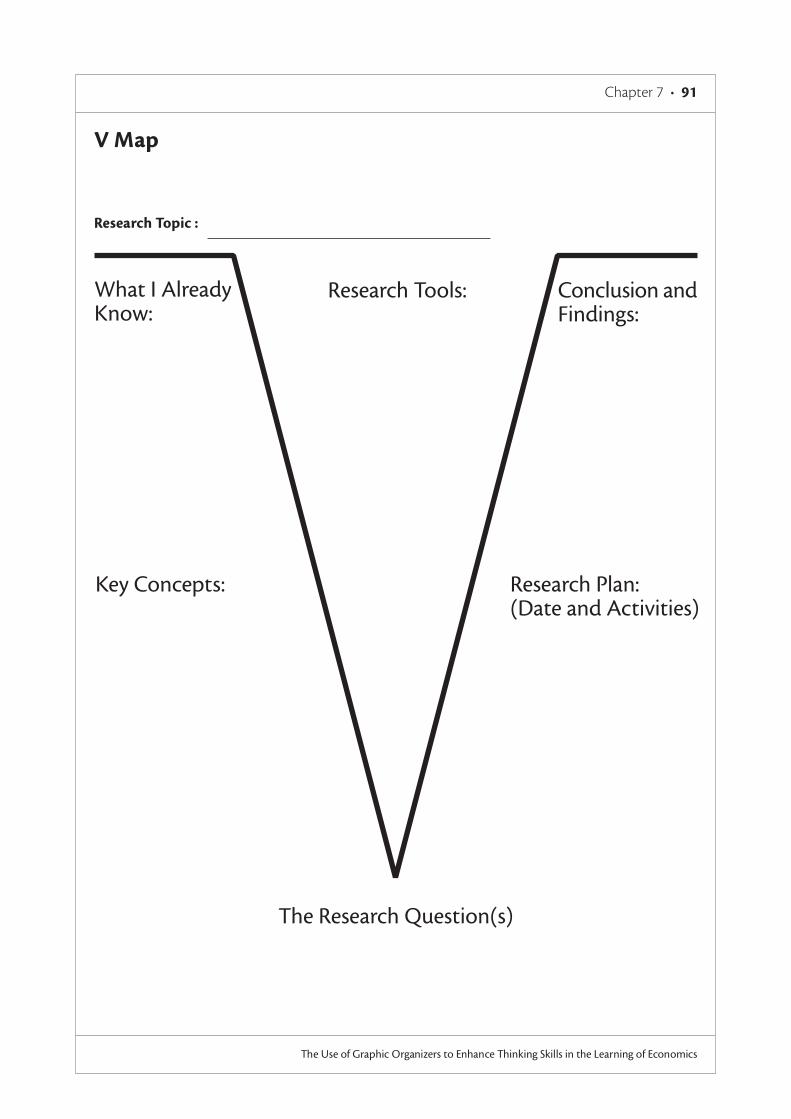
Chapter 7 • 91
The Use of Graphic Organizers to Enhance Thinking Skills in the Learning of Economics
V Map
Research Topic :
Research Tools: Conclusion andFindings:
What I AlreadyKnow:
Key Concepts: Research Plan:(Date and Activities)
The Research Question(s)
ExemplarExemplar92 • Graphic Organizers: Description, Procedures and Exemplars
The Use of Graphic Organizers to Enhance Thinking Skills in the Learning of Economics
TopicInflation and Standard of Living
Concepts1. Inflation is the continuous increase in general price level.
2. Inflation occurs whenever aggregate demand is greater than
aggregate supply when the economy is near full employment
3. When the rise of income is lower than the rise of price level,
standard of living (purchasing power) becomes lower.
V Map
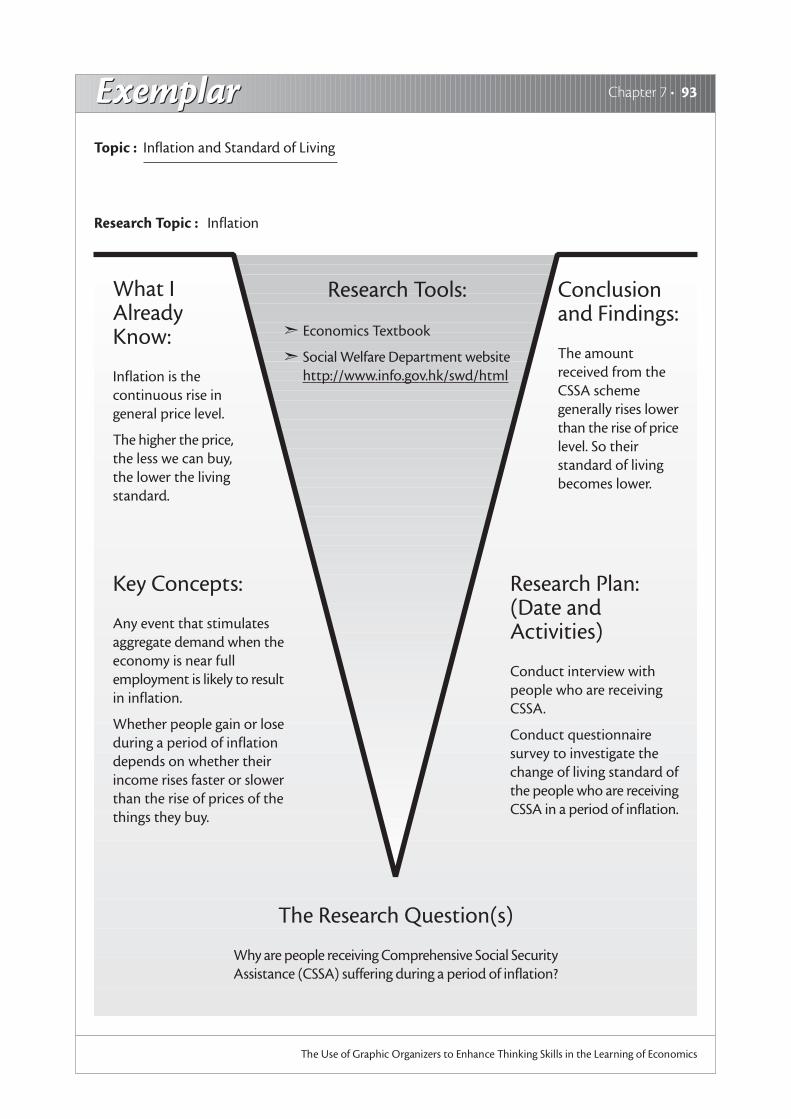
ExemplarExemplar Chapter 7 • 93
The Use of Graphic Organizers to Enhance Thinking Skills in the Learning of Economics
Research Tools: Conclusionand Findings:
The amountreceived from theCSSA schemegenerally rises lowerthan the rise of pricelevel. So theirstandard of livingbecomes lower.
What IAlreadyKnow:
Inflation is thecontinuous rise ingeneral price level.
The higher the price,the less we can buy,the lower the livingstandard.
Key Concepts:
Any event that stimulatesaggregate demand when theeconomy is near fullemployment is likely to resultin inflation.
Whether people gain or loseduring a period of inflationdepends on whether theirincome rises faster or slowerthan the rise of prices of thethings they buy.
Research Plan:(Date andActivities)
Conduct interview withpeople who are receivingCSSA.
Conduct questionnairesurvey to investigate thechange of living standard ofthe people who are receivingCSSA in a period of inflation.
The Research Question(s)
Why are people receiving Comprehensive Social SecurityAssistance (CSSA) suffering during a period of inflation?
➣ Economics Textbook
➣ Social Welfare Department websitehttp://www.info.gov.hk/swd/html
Research Topic : Inflation
Topic : Inflation and Standard of Living
94 • Graphic Organizers: Description, Procedures and Exemplars
The Use of Graphic Organizers to Enhance Thinking Skills in the Learning of Economics
Venn DiagramDescriptionThis organizer can be used to help students develop skill in
comparing and contrasting similar and/or different information.
A Venn diagram may consist of two or more circles.
Procedures1. Identify and label each circle the concepts to be compared
and contrasted.
2. Discuss and record the similarities and differences among the
concepts.
3. Put the shared characteristics in the appropriate overlapping
sectors.
4. Record the unique characteristics of each concept in its own
sector.

Chapter 7 • 95
The Use of Graphic Organizers to Enhance Thinking Skills in the Learning of Economics
Venn Diagram
Concept 2Concept 1
CommonCharacteristics
UniqueCharacteristics
UniqueCharacteristics

ExemplarExemplar96 • Graphic Organizers: Description, Procedures and Exemplars
The Use of Graphic Organizers to Enhance Thinking Skills in the Learning of Economics
TopicFree goods and economic goods
Concepts1. Goods are tangible or intangible items that are used to satisfy
human wants.
2. Free goods are goods that the amounts are so abundant that
all human wants of them can be satisfied.
3. Economic goods are goods that the amounts are not
sufficient to satisfy all our wants of them.
Venn Diagram
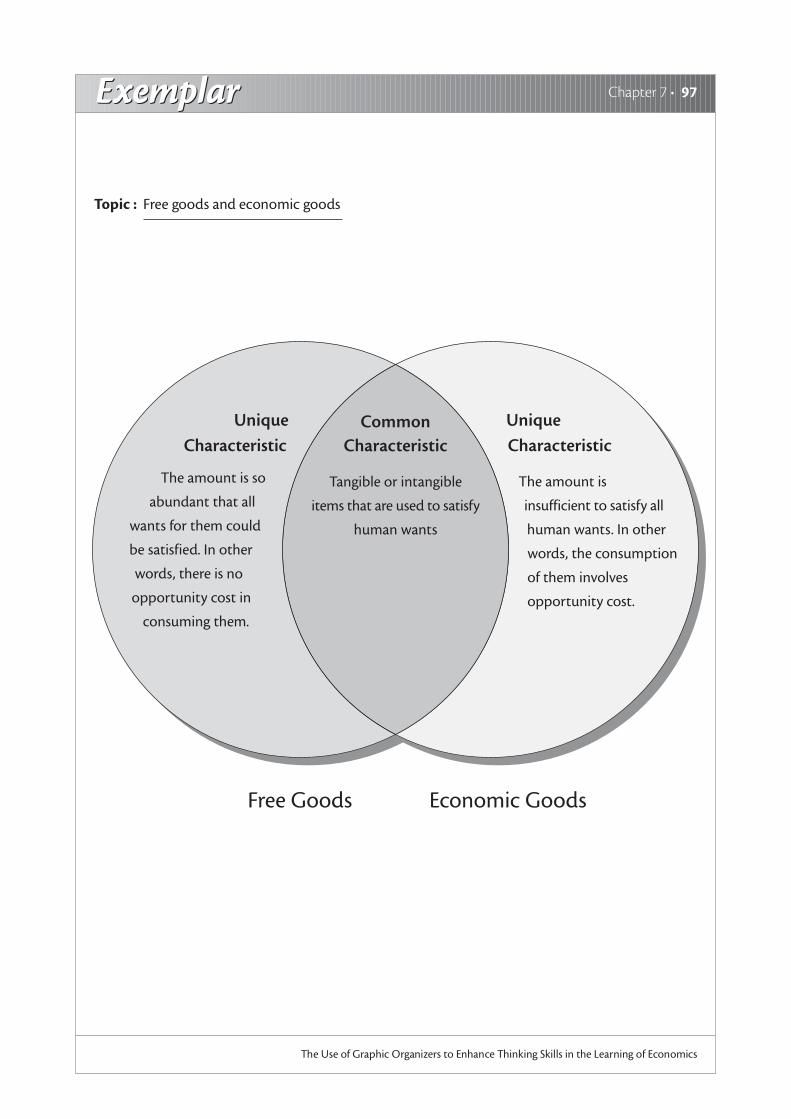
ExemplarExemplar Chapter 7 • 97
The Use of Graphic Organizers to Enhance Thinking Skills in the Learning of Economics
Unique
Characteristic
The amount is
insufficient to satisfy all
human wants. In other
words, the consumption
of them involves
opportunity cost.
Free Goods
Common
Characteristic
Tangible or intangible
items that are used to satisfy
human wants
Economic Goods
Unique
Characteristic
The amount is so
abundant that all
wants for them could
be satisfied. In other
words, there is no
opportunity cost in
consuming them.
Topic : Free goods and economic goods

The Use of Graphic Organizers to Enhance Thinking Skills in the Learning of Economics
Web Sites for Graphic Organizers
* The recommended websites are correct and available as at the production date of this teaching package.
1. Brain Dancing for Studentshttp://braindance.com/bdi.htm
2. Graphic Organizers: The Use of GraphicOrganizers in Processing Informationhttp://www.graphic.org/goindex.html
3. Graphic Organizers as Thinking Technologyhttp://www.fno.org/oct97/picture.html
4. Graphic Organizer as an Instructional Toolhttp://www.ncrel.org/sdrs/areas/issues/students/learning/lrlgrorg.htm
5. Mind Tools — Helping You to Think Your Wayto an Excellent Lifehttp://www.demon.co.uk/mindtool/mindmaps.html
6. Semantic Mapping for Concept Formationhttp://www.ilt.columbia.edu/k12/livetext/does/semantic.htm
7. The Mind Modulehttp://classes.aces.uiuc.edu/ACES100/
8. Using Concept Mapping in a Sensation &Perception Coursehttp://river.clarion.edu/TRVILBERG/conceptmap.html
9. Venn Diagramhttp://coe.ilstu/portfolios/students/caheiss/c&i456teach.htm
10. Visual Learning Using Inspirationhttp://www.inspiration.com/inspclass.html
11. Vocabulary Graphic Organizerhttp://www.history.org/other/teaching/tchmhvoc.htm
Chapter 8 • 99


The Use of Graphic Organizers to Enhance Thinking Skills in the Learning of Economics
References
Chapter 9 • 101
Ausubel, D.P. (1968). Educational Psychology: A Cognitive View.
New York: Holt.
Barnekow, D.J. (1998). Graphic Organizers for Social Studies
Classes. Maine: J. Weston Walch Publisher.
Bromley, K., DeVitis, L. I. and Modlo, M. (1995). Graphic
Organizers: Visual Strategies for Active Learning. New York:
Scholastic Professional Books.
Bromley, K., DeVitis, L. I. and Modlo, M. (1999). 50 Graphic
Organizers for Reading, Writing & More. New York: Scholastic
Professional Books.
Cassidy, J. (1991). “Using graphic organizers to develop critical
thinking.” Gifted Child Today, 12(6), pp.34-36.
Curriculum Development Council (1989). Syllabuses for
Secondary Schools: Economics (Secondary 4-5). Hong Kong: The
Government Printer.
Drapeau, P. (1998), Great Teaching With Graphic Organizers:
Lessons and Fun-shaped Templates That Motivate Kids of all
Learning Styles. New York: Scholastic Professional Books, pp.4-10.
Dunston, P.J. (1992). “A critique of graphic organizer research.” in
Reading Research and Instruction, 31 (2), pp.57-65.
Johnson, A.P. (2000). Up and Out: Using Creative and Critical
Thinking Skills to Enhance Learning. Massachusetts, Allan &
Bacon, pp.10-15.
Moline, S. (1995). I See What You Mean: Children at Work With
Visual Information. York, ME: Stenhouse.

The Use of Graphic Organizers to Enhance Thinking Skills in the Learning of Economics
Novak, J.D. and Gowin, D.B. (1984). Learning How to Learn. New
York: Cambridge University Press.
Parry, T. and Gregory, G. (1998). Designing Brain Compatible
Learning. Victoria: Hawker Brownlow Education, pp.168-206.
Pobl, M. (1997). “Thinking Skills for Explicit Teaching; Graphic
Organizers” in Teaching Thinking Skills in the Primary Years: A
Whole School Approach. Victoria: Hawker Brownlow Education,
pp.61-74.
Prawat, R. (1991). “Embedded Thinking skill Instruction in
Subject Matter Instruction” in A. Costa (ed.) Development Minds
(Vol. 1), pp.185-186. Alexandria, VI: Association of Supervision
and Curriculum Development.
Robinson, D.H. (1998). “Graphic organizers as aids to text
learning.” in Reading Research and Instruction, 37(2), pp.85-105.
Schrenko, L. (1994). “What are the most effective instructional
strategies?” in Structuring a Learner-Centred School. Victoria:
Hawker Brownlow Education, pp.81-132.
Sorenson, S. (1991). Working with special students in English
language arts. TRIED, ED 336902, Bloomington, IN: ERIC
Clearinghouse on Reading and Communication Skills.
Vygotsky, L.S. (1962). Thought and Language. Cambridge, MA:
MIT Press.
102 • References

The Use of Graphic Organizers to Enhance Thinking Skills in the Learning of Economics
Chapter 10 • 103
How to Use the CD-ROM
The enclosed CD-ROM contains a soft copy of this book
which is in Adobe Acrobat Portable Document Format
(PDF). The CD-ROM is in Hybrid Format which is usable in both
Windows or Macintosh Computers.
To read the file, you need to have Adobe Acrobat Reader
installed on your computer. For your convenience, the Acrobat
Reader Installer is included on the CD-ROM.
The Asian Font Packs included is not required to read this
book, it is just for your convenience if you want to read other
.pdf documents in Asian languages in the future.
How to UseWindows
1 Turn on the computer.
2 Place the CD-ROM in your CD-ROM Drive.
3 Double click My Computer icon.
4 Double click CD-ROM Drive icon (Usually D: or E:).
5 Double click the file “TheBook”.
Macintosh
1 Turn on the computer.
2 Place the CD-ROM in your CD-ROM Drive.
3 Double click Graphic_Organizers icon.
4 Double click the file “TheBook.pdf”.

The Use of Graphic Organizers to Enhance Thinking Skills in the Learning of Economics
104 • How to Use the CD-ROM
How to Install Adobe Acrobat ReaderWindows1 Turn on the computer.2 Place the CD-ROM in your CD-ROM Drive.3 Double click My Computer icon.4 Double click CD-ROM Drive icon (Usually D: or E:).5 Double click to open the folder Acroread.6 Double click to open the folder Installers.7 Double click Acrd4enu icon.
Macintosh1 Turn on the computer2 Place the CD-ROM in your CD-ROM Drive.3 Double click Graphic_Organizers icon.5 Double click to open the folder Acrobat Reader 4.0.6 Double click to open the folder Installers.7 Double click Reader Installer icon.
If you are not familiar with the operation of Adobe AcrobatReader, please refer to the guide book inside the Help folderunder the same directory of your Acrobat Reader 4.0 folder.
System RequirementsWindows• i486™ or Pentium® processor-based personal computer.• Microsoft® Windows® 95, Windows 98, or Windows NT® 4.0
with Service Pack 3 or later.• 10 MB of available RAM on Windows 95 and Windows 98 (16
MB recommended).• 16 MB of available RAM on Windows NT (24 MB
recommended).• 10 MB of available hard-disk space.• 50 MB of additional hard-disk space for Asian fonts .
Macintosh• Apple Power Macintosh or compatible computer.• Mac OS software version 7.1.2 or later.• 4.5 MB of available RAM (6.5 MB recommended).• 8 MB of available hard-disk space.• 50 MB of additional hard-disk space for Asian fonts .
Recommended