Annual Report 2002----5
Takasago Thermal Engineering Co., Ltd.
ANNUAL REPORT 2002
YEAR ENDEDMARCH 31,2002
ANNUAL REPORT 2002

2----Takasago Thermal Engineering Co., Ltd.
PROFILE
Founded in 1923, Takasago Thermal Engineering Co., Ltd. is Japan’s largest company specializingin Heating, Ventilation and Air Conditioning (HVAC). The company’s mission is to make people’slives more pleasant and contribute to society as a whole by creating comfortable environments.Building upon a solid theoretical foundation in thermal dynamics, fluid dynamics and electronics,Takasago uses its own leading-edge technology to design and install systems that meet the require-ments of a wide variety of buildings.
Takasago is continuing its R&D efforts in a broad range of fields to respond to global environ-mental problems and other diverse needs of society.
TO THE READER 01REVIEW OF OPERATIONS 02RESEARCH AND DEVELOPMENT 04FINANCIAL REVIEW 06CONSOLIDATED STATEMENTS OF INCOME 07CONSOLIDATED BALANCE SHEETS 08CONSOLIDATED STATEMENTS OF SHAREHOLDERS’ EQUITY 10
CONSOLIDATED STATEMENTS OF CASH FLOWS 11NOTES TO CONSOLIDATED FINANCIAL STATEMENTS 12REPORT OF INDEPENDENT PUBLIC ACCOUNTANTS 23DIRECTORY 24BOARD OF DIRECTORS AND CORPORATE AUDITORS 25INVESTOR INFORMATION 25
CONTENTS
1. HVAC for Comfortable EnvironmentsTakasago provides optimum air environments in a huge array of modern structures. These include office buildings,
where “intelligent” functions are becoming increasingly common, crowded stations and airports, and hotels where the
element of comfort is paramount. In addition, the company provides systems for schools, hospitals and other facilities
essential to society, art galleries and museums housing cultural exhibits, as well as vast complexes and skyscrapers that
combine many of these functions. Takasago’s technical skill extends also to the environmental control of large indoor
spaces such as domed baseball stadiums, concert halls and theaters.
2. HVAC for Work SpacesTakasago is playing a major role in preserving healthy working environments and raising efficiency at the factories of
many of Japan’s best known manufacturers in such industries as automobiles and electrical appliances, in addition to
precision equipment such as watches and cameras, and printing.
3. HVAC for Manufacturing ProcessesProcess HVAC systems such as clean rooms and clean-dry rooms are essential to the high-precision processing technol-
ogy at the core of information and communications equipment such as PCs, mobile phones and LCDs, as well as the
pharmaceuticals, biotechnology and food products essential to healthy living. Over the years, Takasago has responded
to changing customer needs by developing ultra-precise constant-temperature, constant-humidity technology; ultra-
clean technology for the removal of dust, chemical contaminants and static electricity; and ultra-dry technology for
preserving an extremely low dew point. By combining these techniques with its high-precision control expertise,
Takasago contributes to raising productivity in manufacturing processes.
4. HVAC RenovationsWhen a building is renovated and its facilities updated, installing HVAC equipment is inevitably one of the most impor-
tant tasks. Typically, these systems need to be replaced after 15 or 20 years, a much shorter period than the average
building lifetime of 30 to 50 years. To respond to changes in a building’s use during its lifetime—and to continual
demands for higher-performance systems—Takasago draws upon its vast experience in renovation and upgrading to
propose HVAC solutions that meet the requirements of the age and add value to the building itself.
5. DHC (District Heating-and-Cooling) SystemsDHC systems are an effective means of both saving energy and purifying exhaust gas emissions in redevelopment
projects. In addition, they help utilize limited energy resources and space more efficiently and provide reliable service in
the event of an emergency. Offering the optimum combination of energy usage—electricity, gas and unused energy—the
importance of DHC systems in countering global warming is set to increase from hereon. DHC systems are also impor-
tant in terms of showcasing Takasago’s expertise in heating technology accumulated through years of experience.
�
�
�
�
�

Annual Report 2002----01
OVERVIEW OF THE FISCAL YEAR ENDED MARCH 31, 2002
Japan’s economy saw a further deepening of recession in fiscal 2001, ended March 31,
2002. The worldwide economic slowdown and slumping IT-related industries have led to
falling exports and declining capital expenditures in Japan. These in turn have caused
rising unemployment and declining incomes, which continue to dampen consumer sentiment.
The Japanese construction industry, which relates directly to our operations, continued
to face a difficult operating environment. A falling number of public-works projects and
intensifying competition for private-sector projects has put downward pressure on prices.
Amid this operating environment, Takasago and its group companies made a concerted
effort to expand marketing activities, giving priority to profitability as well as emphasizing
customers’ needs. At the same time, we worked aggressively to reduce costs and curb sell-
ing, general and administrative expenses across operations. Actions included improving
our engineering and construction processes, raising the efficiency of site administration
and rationalizing the procurement of materials to lower costs. As a result, orders received
decreased 10.9% year on year to ¥187,017 million, and net sales fell 19.2% to ¥196,436
million. Net income, however, amounted to ¥1,698 million, a 6.6% increase from the
previous fiscal year. The dividend remained unchanged at ¥17.00 per share.
ONGOING MEDIUM-TERM BUSINESS PLAN
Last year, Takasago formulated a three-year medium-term business plan running from
April 1, 2001 to March 31, 2004. Nevertheless, our results in the first year of this plan
were not completely satisfactory. It would seem that we will also have difficulty meeting
our targets for the year ending March 31, 2003: orders received of ¥205,000 million, net
sales of ¥205,000 million, operating income of ¥2,500 million, and net income of ¥1,300
million. As we approach the final year of this business plan, we are determined to push
ahead with customer-directed marketing activities and reduce costs further to hit our
targets. I request your ongoing, valued support in all these endeavors.
Masaru Ishii
Thousands ofMillions of yen U.S. dollars
2002 2001 2000 1999 1998 2002
For the year:Orders received............................................. ¥187,017 ¥209,816 ¥206,818 ¥212,561 ¥246,918 $1,403,505Net sales ...................................................... 196,436 243,213 196,168 230,998 271,670 1,474,191Operating income ......................................... 3,685 5,650 4,628 5,809 9,213 27,654Net income .................................................. 1,698 1,593 1,922 2,872 4,343 12,743Backlog of orders ......................................... 147,155 156,575 189,972 179,322 197,759 1,104,353
At year end:Total assets .................................................. ¥221,223 ¥250,999 ¥238,276 ¥231,914 ¥254,456 $1,660,210Shareholders’ equity ..................................... 80,074 81,029 80,875 79,468 78,400 600,931
Yen U.S. dollars
Per share:Net income .................................................. ¥19.80 ¥18.57 ¥22.41 ¥33.49 ¥50.63 $0.15Cash dividends applicable to the year ............ 17.00 17.00 17.00 17.00 17.00 0.13
Note: U.S. dollar amounts are translated from yen, for convenience only, at the rate of ¥133.25=US$1.
FINANCIAL HIGHLIGHTS
Masaru Ishii PRESIDENT
TO THE READER

02----Takasago Thermal Engineering Co., Ltd.
REVIEW OF OPERATIONS
Office Projects
Shopping Centers
HotelsSports and LeisureFacilitiesResidential Housing
Educational Facilities
Medical Facilities
Factory Projects
Others
Equipment
28.8
5.6
4.34.9
0.610.3
8.3
29.0
5.6
2.6
Office Projects
Shopping Centers
HotelsSports and LeisureFacilities
Residential Housing
Educational Facilities
Medical Facilities
Factory Projects
Others
Equipment
29.7
7.1
2.63.4
0.8
11.69.2
26.3
6.7
2.6
Millions of yen
20022002200220022002 2001 2000
ConstructionOffice Projects ¥ 55,608¥ 55,608¥ 55,608¥ 55,608¥ 55,608 ¥ 62,403 ¥ 65,108Shopping Centers 13,34013,34013,34013,34013,340 15,921 15,201Hotels 4,8284,8284,8284,8284,828 5,307 3,588Sports and Leisure Facilities 6,4066,4066,4066,4066,406 7,822 8,672Residential Housing 1,4541,4541,4541,4541,454 2,087 2,779Educational Facilities 21,76021,76021,76021,76021,760 17,276 18,523Medical Facilities 17,16317,16317,16317,16317,163 12,842 23,912Factory Projects 49,26449,26449,26449,26449,264 69,699 44,538Others 12,42812,42812,42812,42812,428 12,088 18,857
Equipment 4,7664,7664,7664,7664,766 4,371 5,640
TOTAL ¥187,017¥187,017¥187,017¥187,017¥187,017 ¥209,816 ¥206,818
NET SALES BY PROJECT • Net sales declined 19.2% to ¥196,436 million. By sector, net sales of
general-purpose HVAC systems declined 17.8% to ¥134,378 million, and industrial HVAC systems by
24.1% to ¥56,882 million. Meanwhile, net sales of equipment increased 6.3% to ¥5,176 million.
General-purpose HVAC systems accounted for 68.4% of net sales, industrial HVAC systems for
29.0% and equipment for 2.6%.
Millions of yen
20022002200220022002 2001 2000
ConstructionOffice Projects ¥ 56,638¥ 56,638¥ 56,638¥ 56,638¥ 56,638 ¥ 68,074 ¥ 63,012Shopping Centers 10,92410,92410,92410,92410,924 19,498 15,627Hotels 8,5238,5238,5238,5238,523 7,532 10,941Sports and Leisure Facilities 9,7059,7059,7059,7059,705 9,946 15,015Residential Housing 1,1221,1221,1221,1221,122 2,887 1,269Educational Facilities 20,27120,27120,27120,27120,271 20,313 16,916Medical Facilities 16,21216,21216,21216,21216,212 20,001 21,834Factory Projects 56,88256,88256,88256,88256,882 74,966 28,421Others 10,98310,98310,98310,98310,983 15,126 17,535
Equipment 5,1765,1765,1765,1765,176 4,870 5,598
TOTAL ¥196,436¥196,436¥196,436¥196,436¥196,436 ¥243,213 ¥196,168
2002 Orders Received by Project (%)
2002 Net Sales by Project (%)
ORDERS RECEIVED BY PROJECT • Orders received in the fiscal year ended March 31, 2002
decreased year on year by 10.9% to ¥187,017 million. While orders for public-works projects rose,
those for large-scale urban redevelopment and other projects met with slow demand. Orders for con-
struction of IT-related clean rooms and renovation projects both fell. As a result, orders for general-
purpose HVAC systems edged down 2.0% to ¥132,987 million, and orders for industrial HVAC
systems dropped by 29.3% to ¥49,264 million. Orders for equipment, however, rose year on year by
9.0% to ¥4,766 million. Overall, general-purpose HVAC systems accounted for 71.1% of orders,
industrial HVAC systems for 26.3% and equipment for 2.6%.
“General-purpose HVACsystems” includes allConstruction items exceptFactory Projects.“Industrial HVAC systems”means Factory Projects thatinclude clean rooms.

Annual Report 2002----03
BACKLOG OF ORDERS BY PROJECT • The backlog of orders at the end of the fiscal year stood at
¥147,155 million, representing a year-on-year decrease of 6.0%. The backlog of orders for general-
purpose HVAC systems fell 1.1% to ¥129,697 million, and industrial HVAC systems by 32.0% to
¥16,201 million. Equipment also decreased, by 24.6%, to ¥1,257 million. General-purpose HVAC
systems accounted for 88.1% of the backlog of orders, industrial HVAC systems for 11.0% and
equipment for 0.9%.
OVERSEAS BUSINESS • Takasago’s Singapore, Hong Kong and Taiwan branches have established a strong track
record in the supply of clean rooms for high-tech factories and HVAC systems for hotels and other high-rise build-
ings, shopping centers and other such large-scale establishments.
In China, we have set up representative offices in Shenzhen, Suzhou and Shanghai, focal points for the business
activities of many Japanese, European and U.S. companies. We are participating in several regional development
projects sponsored by the Chinese government. We have also set up local companies in Malaysia, Thailand and the
Philippines as part of our strategy to establish an overseas network in Southeast Asia and elsewhere.
Takasago considers that a full-fledged recovery from the current IT recession will take some time. We anticipate
new investments in construction by IT-related companies in the latter half of the year ending March 31, 2003. We
estimate that our results for this fiscal year will be about the same as last year or slightly higher.
Nevertheless, foreign and Japanese companies are actively investing in China. Takasago will strengthen its mar-
keting activities in China, centering on its representative office in Shenzhen.
Millions of yen
20022002200220022002 2001 2000
ConstructionOffice Projects ¥ 62,759¥ 62,759¥ 62,759¥ 62,759¥ 62,759 ¥ 63,789 ¥ 68,233Shopping Centers 9,8769,8769,8769,8769,876 7,461 11,038Hotels 2,4822,4822,4822,4822,482 6,177 8,402Sports and Leisure Facilities 6,7976,7976,7976,7976,797 10,096 12,220Residential Housing 3,5073,5073,5073,5073,507 3,175 5,202Educational Facilities 15,36915,36915,36915,36915,369 13,879 16,916Medical Facilities 17,10517,10517,10517,10517,105 16,154 23,313Factory Projects 16,20116,20116,20116,20116,201 23,820 29,087Others 11,80211,80211,80211,80211,802 10,357 13,395
Equipment 1,2571,2571,2571,2571,257 1,667 2,166
TOTAL ¥147,155¥147,155¥147,155¥147,155¥147,155 ¥156,575 ¥189,972
2002 Backlog of Orders by Project (%)
Office Projects
Shopping Centers
HotelsSports and LeisureFacilities
Residential Housing
Educational Facilities
Medical Facilities
Factory Projects
Others
Equipment
42.6
6.7
1.7
4.62.4
10.4
11.6
11.0
8.1
0.9

RESEARCH AND DEVELOPMENT
HVAC technology, the core business of Takasago, has become an
indispensable element in creating enhanced building and urban
environments, and a key aspect in the design of manufacturing facili-
ties. Creating the optimum environment through HVAC systems involves
far more than simply adjusting air temperature and humidity; it calls
for the complete control of a wide range of factors such as air flow,
distribution, pressure and cleanliness to meet exacting requirements.
Takasago develops distinctive HVAC technologies with the aim of
providing the most comfortable environment possible for its customers.
04----Takasago Thermal Engineering Co., Ltd.
R&D
HVAC system technology
Energy utilization system technology
Clean roomsystem technology
Informationand control system technology
R&D OBJECTIVES

Annual Report 2002----05
RECENT DEVELOPMENTS
Takasago started to sell its ice thermal storage system, Super Ice System™, in 1988. Since then we have steadily
won our customers’ trust. To date, we have installed more than 10,000 refrigeration tons*1.
We have developed a new system, Super Ice System MII. Instead of the former discharge pipe, the new system
employs a “supercooled activity discharge device” which uses ultrasound to manufacture ice. This ice thermal stor-
age system enables more stable heat storage and a much smaller discharge unit. Also, a circulating pump enables the
sherbet ice to be moved wherever desired.
The new system is ideal for buildings being remodeled as we have eliminated the former layout and shape con-
straints required for the ice thermal storage tank. The customer can use a conventional water thermal storage tank,
a double under-floor slab space or an unused water tank for the ice thermal storage tank. Naturally, the new system
is also ideal for new buildings.
*1: A refrigeration ton is the amount of heat required to convert 1 ton of water (0ºC) into ice in a twenty-four hour
period = 3,516W
Super Ice System MII ○ ○ ○ ○ ○ ○ ○ ○ ○ ○ ○ ○ ○ ○ ○ ○ ○ ○ ○ ○ ○ ○ ○ ○ ○ ○ ○ ○ ○ ○ ○ ○ ○ ○ ○ ○ ○ ○ ○ ○ ○ ○ ○ ○ ○ ○ ○ ○ ○ ○ ○
Takasago’s Fan Filter Unit TFFU is an important device for maintaining a high degree of cleanliness in a clean room.
The TFFU consists of a fan and filters, and is fitted to the air conditioning conduit of the internal circulatory system of
the clean room. The DC-TFFU device uses direct-current brushless motors*2 to control the rotational speed of each fan
with great sensitivity, sending only the required amount of air into the room. This enables lower power consumption,
better energy conservation, and a reduction in running costs.
DC-TFFU is compatible with mini-line systems and mini-environment systems, considered to represent the
next generation of clean rooms. The low associated energy consumption and operational costs make our system
ideal for makers of semiconductors and liquid crystal products who require high levels of energy conservation.
SIGMAT-FUDC is a monitoring and control system for DC-TFFU. SIGMAT-FUDC allows up to 12,000 DC-
TFFU units to be monitored simultaneously. It can instruct the DC-TFFU units to turn on or off, can alter their
speed, can detect irregular operations or malfunctions, and can keep operational records.
*2: Direct-current brushless motors are durable and highly reliable motors which do not generate discharge noise.
The speed of the motors can be freely changed in accordance with the speed of electronic +/- switching.
DC-TFFU: Fan Filter Unit for Clean Rooms ○ ○ ○ ○ ○ ○ ○ ○ ○ ○ ○ ○ ○ ○ ○ ○ ○ ○ ○ ○ ○ ○ ○ ○ ○ ○ ○ ○ ○ ○ ○ ○ ○ ○ ○ ○ ○ ○
Takasago has developed TIOS-AIII, a product with superior properties related to the removal of water-soluble
nitrogen oxides. This product is one of the TIOS-A product line for removing acid gases and has always experienced
strong demand.
With the increasing level of sophistication and detail required for the manufacture of semiconductors, chemical
contamination has become a serious issue and measures to prevent contamination have become essential. Recently,
attention has focused on acidic gases in the ventilation systems of clean rooms. Of these gases, water-soluble nitrogen
oxides have the highest concentration. TIOS-AIII is a strategic product developed in direct response to this demand.
TIOS-AIII is fitted to the air conditioning conduit of the internal circulatory system of a clean room. A carbonate
impregnated into the surface of the filter neutralizes and absorbs the water-soluble nitrogen oxides in the air. The
initial removal efficiency is over 90%. The useful life of the filter—the time taken for the removal efficiency to fall to
80% assuming a concentration of water soluble nitrogen oxides of 5 µg/m3 prior to filtering—is 11,200 hours. This
represents a tenfold increase over that of the current TIOS-A series.
The filter is manufactured by baking a ceramic honeycomb structure together with the material to impregnate
the surface. Consequently, only nonflammable and highly stable materials are used in manufacturing the filter.
TIOS–AIII: A Chemical Filterfor the Removal of Water Soluble Nitrogen Oxides ○ ○ ○ ○ ○ ○ ○ ○ ○ ○ ○ ○ ○ ○ ○ ○ ○ ○ ○ ○ ○ ○ ○ ○ ○ ○ ○ ○ ○ ○ ○ ○ ○ ○
TLACS is a new air conditioning system developed for laboratory animal facilities in research institutes. In Takasago’s
new system, air flows along vertical walls installed near air outlets in the ceiling, spreading the airflow evenly and gently.
Air is exhausted through the vent of a chamber provided at the rear of the animal rack. Consequently, problems of tem-
perature difference, air flow difference and diffusion within the room can be eliminated, enabling precise control of the
environment and strict prevention of contamination. Because this system also allows a reduction in the number of times
the air should be changed, in a model case we were able to trim running costs by 20%.
Maintenance is simple, as the lack of any special duct connections makes the animal racks very easy to clean. Any
smells or powdery deposits from the animals extracted through the chamber vent can also be easily cleaned away.
Because this air conditioning system is structurally simple and compatible with any type of rack, it can be
readily adapted for different animal species, or for future upgrades to the facilities.
TLACS: A New Air Conditioning System for Laboratory Animal Facilities ○ ○ ○ ○ ○ ○ ○ ○ ○ ○ ○ ○ ○ ○ ○ ○ ○ ○ ○ ○ ○ ○

06----Takasago Thermal Engineering Co., Ltd.
FINANCIAL REVIEW
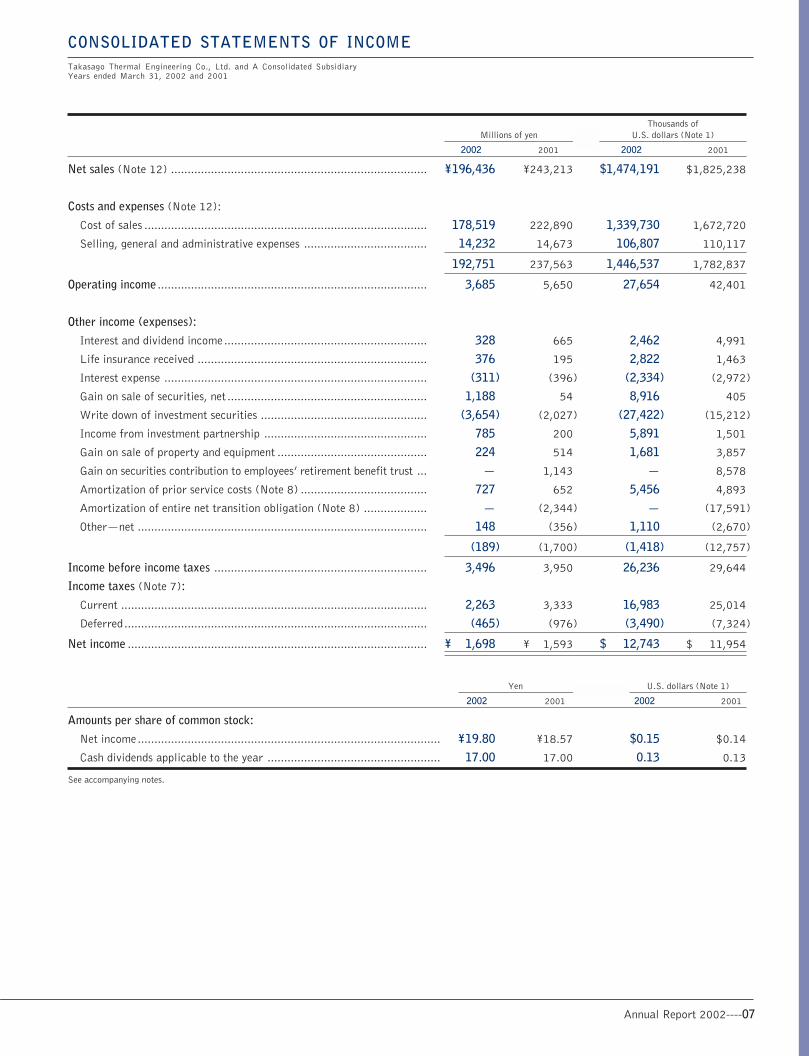
CONSOLIDATED STATEMENTS OF INCOME • In the fiscal year ended March 31, 2002, consolidated net sales fell somewhat com-
pared to the previous fiscal year. Construction of HVAC systems accounted for 97.4% of
Takasago’s net sales. Sales of general-purpose HVAC systems for office buildings declined
17.8%, and sales of industrial HVAC systems, primarily clean rooms, fell by 24.1%. As a
result, sales at the parent company, which is responsible for HVAC systems, decreased
19.8% year on year. Offsetting these declines somewhat was a 6.3% increase in manufac-
turing and marketing of equipment at our consolidated subsidiary. As a result of the above,
the ratio of consolidated net sales to non-consolidated net sales was 1.03 times.
The gross profit on completed construction contracts increased 0.7 of a percentage
point from 8.4% to 9.1%. In addition, selling, general and administrative expenses
decreased. However, due to a decline in net sales, operating income fell 34.8%. The ratio
of consolidated operating income to non-consolidated operating income was 1.18 times. In
other income (expenses), the company booked a gain on an anonymous investment partner-
ship, but recorded an increased write-down of investment securities. However, the absence
of last year’s amortization of the entire net transition obligation for retirement benefits
following introduction of a new accounting standard resulted in an increase in net income
for the year of 6.6%. As a result, the ratio of consolidated net income to non-consolidated
net income was 1.04 times.
FINANCIAL POSITION • In assets, notes and accounts receivable-trade decreased ¥20,498 million, or 21.6%. In
the previous fiscal year, there was a concentration of completed contracts at the end of the
year, which resulted in a significant increase at March 31, 2001. This fact, and a drop in
the balance of completed contracts in the year under review, led to the decrease in notes
and accounts receivable-trade. The cost of uncompleted contracts increased by ¥3,125
million, or 10.9%, due to an increase in construction projects in progress.
On the other side of the balance sheet, notes and accounts payable-trade were ¥18,749
million, or 18.4% lower, for the same reasons as with notes and accounts receivable-
trade. Advances received on uncompleted contracts fell by ¥2,131 million, or 9.4%, in line
with a decrease in progress payments received.
CASH FLOWS• Cash and cash equivalents at the end of the year were ¥51,201 million, down ¥1,322 mil-
lion from a year ago.
Operating activities used net cash of ¥2,746 million, ¥4,287 million more than in the
previous fiscal year. The main uses of cash were an increase in the cost of uncompleted con-
tracts and a decrease in advances received on uncompleted contracts.
Investing activities provided net cash of ¥5,362 million, ¥3,743 million less than in the
previous fiscal year. Payments for the purchase of marketable and investment securities to
strengthen business ties were outweighed by proceeds from returns on matured time deposits.
Returns on matured deposits were less than the previous year, which was the main reason for
the decrease in overall cash provided by investing activities.
Net cash used in financing activities amounted to ¥3,902 million, ¥416 million higher than
in the previous fiscal year. Cash was mainly used for repayments of borrowings and cash divi-
dends paid. The decrease in net cash used reflected curbs on new long-term debt.
Net salesMillions of yen
Net incomeMillions of yen
Total assets & Equity ratioMillions of yen
98 0299 00 01
271,
670
230,
998
196,
168
243,
213
196,
436
98 0299 00 01
4,34
3
2,87
2
1,92
2
1,59
3
1,69
8
98 0299 00 01
254,
456
231,
914
238,
276
250,
999
221,
223
30.8%34.3% 33.9% 32.3%
36.2%
Annual Report 2002----07
Thousands ofMillions of yen U.S. dollars (Note 1)
2002 2001 2002 2001
Net sales (Note 12) ............................................................................. ¥196,436 ¥243,213 $1,474,191 $1,825,238
Costs and expenses (Note 12):
Cost of sales ..................................................................................... 178,519 222,890 1,339,730 1,672,720
Selling, general and administrative expenses ..................................... 14,232 14,673 106,807 110,117
192,751 237,563 1,446,537 1,782,837
Operating income ................................................................................. 3,685 5,650 27,654 42,401
Other income (expenses):
Interest and dividend income............................................................. 328 665 2,462 4,991
Life insurance received ..................................................................... 376 195 2,822 1,463
Interest expense ............................................................................... (311) (396) (2,334) (2,972)
Gain on sale of securities, net ............................................................ 1,188 54 8,916 405
Write down of investment securities .................................................. (3,654) (2,027) (27,422) (15,212)
Income from investment partnership ................................................. 785 200 5,891 1,501
Gain on sale of property and equipment ............................................. 224 514 1,681 3,857
Gain on securities contribution to employees’ retirement benefit trust ... — 1,143 — 8,578
Amortization of prior service costs (Note 8) ...................................... 727 652 5,456 4,893
Amortization of entire net transition obligation (Note 8) ................... — (2,344) — (17,591)
Other—net ....................................................................................... 148 (356) 1,110 (2,670)
(189) (1,700) (1,418) (12,757)
Income before income taxes ................................................................ 3,496 3,950 26,236 29,644
Income taxes (Note 7):
Current ............................................................................................ 2,263 3,333 16,983 25,014
Deferred ........................................................................................... (465) (976) (3,490) (7,324)
Net income .......................................................................................... ¥ 1,698 ¥ 1,593 $ 12,743 $ 11,954
Yen U.S. dollars (Note 1)
2002 2001 2002 2001
Amounts per share of common stock:
Net income........................................................................................... ¥19.80 ¥18.57 $0.15 $0.14
Cash dividends applicable to the year .................................................... 17.00 17.00 0.13 0.13
See accompanying notes.
CONSOLIDATED STATEMENTS OF INCOMETakasago Thermal Engineering Co., Ltd. and A Consolidated SubsidiaryYears ended March 31, 2002 and 2001

08----Takasago Thermal Engineering Co., Ltd.
Thousands ofMillions of yen U.S. dollars (Note 1)
ASSETS 2002 2001 2002 2001
Current assets:
Cash and time deposits (Note 3) ....................................................... ¥ 53,570 ¥ 59,240 $ 402,026 $ 444,578
Marketable securities (Note 4) ......................................................... 363 1,100 2,724 8,255
Notes and accounts receivable—trade ............................................... 74,412 94,911 558,439 712,278
Less allowance for doubtful accounts ................................................ (176) (254) (1,321) (1,906)
Cost of uncompleted contracts .......................................................... 31,841 28,716 238,957 215,505
Deferred tax assets ........................................................................... 715 382 5,366 2,866
Other current assets .......................................................................... 9,721 11,629 72,953 87,272
Total current assets ...................................................................... 170,446 195,724 1,279,144 1,468,848
Property, plant and equipment—at cost (Note 6):
Land ................................................................................................ 1,894 1,987 14,214 14,912
Buildings and structures ................................................................... 7,674 7,763 57,591 58,259
Machinery ........................................................................................ 579 547 4,345 4,105
Tools, furniture and fixtures ............................................................. 2,906 2,961 21,809 22,221
13,053 13,258 97,959 99,497
Less accumulated depreciation .......................................................... (6,759) (6,722) (50,724) (50,446)
6,294 6,536 47,235 49,051
Investments and other assets:
Investment securities (Note 4) .......................................................... 24,709 28,030 185,433 210,356
Investments in unconsolidated subsidiaries
and affiliated companies ................................................................. 698 797 5,238 5,981
Guarantee deposits ........................................................................... 4,457 5,030 33,448 37,749
Long-term insurance contribution ..................................................... 7,832 8,777 58,777 65,869
Deferred tax assets ........................................................................... 5,313 4,456 39,873 33,441
Other ............................................................................................... 1,617 1,831 12,135 13,741
Less allowance for doubtful accounts ................................................ (143) (182) (1,073) (1,366)
44,483 48,739 333,831 365,771
¥221,223 ¥250,999 $1,660,210 $1,883,670
See accompanying notes.
CONSOLIDATED BALANCE SHEETSTakasago Thermal Engineering Co., Ltd. and A Consolidated SubsidiaryMarch 31, 2002 and 2001

Annual Report 2002----09
Thousands ofMillions of yen U.S. dollars (Note 1)
LIABILITIES AND SHAREHOLDERS’ EQUITY 2002 2001 2002 2001
Current liabilities:
Bank loans (Note 6) ......................................................................... ¥ 12,259 ¥ 13,216 $ 92,000 $ 99,182
Long-term debt due within one year (Note 6) .................................... 2,351 2,814 17,644 21,118
Notes and accounts payable—trade ................................................... 83,028 101,777 623,099 763,805
Advances received on uncompleted contracts ..................................... 20,456 22,586 153,516 169,501
Income taxes payable (Note 7) ......................................................... 1,834 1,311 13,764 9,839
Allowance for claim expenses ............................................................ 306 370 2,296 2,777
Other current liabilities ..................................................................... 8,907 13,666 66,844 102,558
Total current liabilities ................................................................. 129,141 155,740 969,163 1,168,780
Long-term debt due after one year (Note 6) ......................................... 2,179 3,195 16,353 23,977
Employees’ severance and retirement benefits (Note 8) ....................... 8,743 9,668 65,614 72,555
Directors’ retirement benefits .............................................................. 897 836 6,732 6,274
Other non-current liabilities ................................................................. 189 531 1,417 3,986
Shareholders’ equity (Note 9):
Common stock:
Authorized — 200,000,000 shares
Issued — 85,765,768 shares .................................................... 13,135 13,135 98,574 98,574
Additional paid-in capital ................................................................. 12,854 12,854 96,465 96,465
Retained earnings ............................................................................. 55,137 55,089 413,786 413,426
Net unrealized holding losses on securities ......................................... (1,044) (48) (7,834) (359)
80,082 81,030 600,991 608,106
Treasury stock, at cost ...................................................................... (8) (1) (60) (8)
Total shareholders’ equity ............................................................. 80,074 81,029 600,931 608,098
¥221,223 ¥250,999 $1,660,210 $1,883,670

10----Takasago Thermal Engineering Co., Ltd.
Millions of yen
Number of Additional Net unrealizedshares of Common paid-in Retained holding gains Treasury
common stock stock capital earnings on securities stock
Balance at March 31, 2000 ......................................... 85,765,768 ¥13,135 ¥12,854 ¥54,887 ¥ — ¥(1)
Increase of affiliated companies on equity method ..... — — — 283 — —
Net income............................................................... — — — 1,593 — —
Adoption of new accounting standard
for financial instruments ......................................... — — — — (48) —
Treasury stock .......................................................... — — — — — 0
Cash dividends paid (¥17 per share) .......................... — — — (1,458) — —
Bonuses to directors and corporate auditors .............. — — — (216) — —
Balance at March 31, 2001 ......................................... 85,765,768 13,135 12,854 55,089 (48) (1)
Net income............................................................... — — — 1,698 — —
Adjustment of net unrealized holding
gains in securities ................................................... — — — — (996) —
Treasury stock .......................................................... — — — — — (7)
Cash dividends paid (¥17 per share) .......................... — — — (1,458) — —
Bonuses to directors and corporate auditors .............. — — — (192) — —
Balance at March 31, 2002 ......................................... 85,765,768 ¥13,135 ¥12,854 ¥55,137 ¥(1,044) ¥(8)
Thousands of U.S. dollars (Note 1)
Additional Net unrealizedCommon paid-in Retained holding gains Treasury
stock capital earnings on securities stock
Balance at March 31, 2000 ................................................................ $98,574 $96,465 $411,910 $ — $ (8)
Increase of affiliated companies on equity method ............................ — — 2,124 — —
Net income...................................................................................... — — 11,955 — —
Adoption of new accounting standard
for financial instruments ................................................................. — — — (359) —
Treasury stock ................................................................................. — — — — 0
Cash dividends paid ($0.13 per share) .............................................. — — (10,942) — —
Bonuses to directors and corporate auditors ..................................... — — (1,621) — —
Balance at March 31, 2001 ................................................................ 98,574 96,465 413,426 (359) (8)
Net income...................................................................................... — — 12,743 — —
Adjustment of net unrealized holding gains in securities .................... — — — (7,475) —
Treasury stock ................................................................................. — — — — (52)
Cash dividends paid ($0.13 per share) .............................................. — — (10,942) — —
Bonuses to directors and corporate auditors ..................................... — — (1,441) — —
Balance at March 31, 2002 ................................................................ $98,574 $96,465 $413,786 $(7,834) $(60)
See accompanying notes.
CONSOLIDATED STATEMENTS OF SHAREHOLDERS’ EQUITYTakasago Thermal Engineering Co., Ltd. and A Consolidated SubsidiaryYears ended March 31, 2002 and 2001

Annual Report 2002----11
Thousands ofMillions of yen U.S. dollars (Note 1)
2002 2001 2002 2001
Cash flows from operating activities:Income before income taxes .............................................................. ¥ 3,496 ¥ 3,950 $ 26,236 $ 29,644
Adjustments to reconcile net income before taxes to net cash provided
by operating activities:
Depreciation and amortization ...................................................... 654 701 4,908 5,261
Gain on sale of marketable and investment securities ..................... (1,188) (54) (8,916) (405)
Loss on evaluation of marketable and investment securities ............ 3,654 2,093 27,422 15,707
Provision for retirement benefits ................................................... (137) 428 (1,028) 3,212
Decrease (Increase) in trade receivables ........................................ 20,551 (19,124) 154,229 (143,520)
Decrease (Increase) in cost of uncompleted contracts ..................... (3,125) 4,526 (23,452) 33,966
Increase (Decrease) in trade payables ............................................ (18,749) 13,386 (140,705) 100,458
Increase (Decrease) in advances received on uncompleted contracts .... (2,131) 2,062 (15,992) 15,475
Gain on sale of property and equipment ......................................... (224) (514) (1,681) (3,857)
Gain on contributing assets to retirement benefit trust .................... — (1,143) — (8,578)
Gain on amortization of prior service cost ...................................... (727) (652) (5,456) (4,893)
Amortization of entire net transition obligation .............................. — 2,344 — 17,591
Other—net .................................................................................... (3,241) (1,745) (24,323) (13,097)
Subtotal ..................................................................................... (1,167) 6,258 (8,758) 46,964
Interest and dividends received ...................................................... 469 648 3,520 4,863
Interest paid ................................................................................. (308) (387) (2,311) (2,904)
Income taxes paid ......................................................................... (1,740) (4,978) (13,059) (37,358)
Net cash provided by (used in) operating activities ....................... (2,746) 1,541 (20,608) 11,565
Cash flows from investing activities:Increase in time deposits ................................................................... (4,622) (12,245) (34,687) (91,895)
Decrease in time deposits .................................................................. 9,841 20,079 73,853 150,687
Purchase of marketable and investment securities .............................. (1,237) (2,193) (9,283) (16,458)
Proceeds from sale of marketable and investment securities ............... 218 2,390 1,636 17,936
Purchase of property, plant and equipment ........................................ (412) (261) (3,092) (1,959)
Proceeds from sale of property, plant and equipment ......................... 332 807 2,492 6,056
Payments of long-term insurance contribution ................................... (1,210) (1,432) (9,081) (10,747)
Proceeds from long-term insurance contribution ................................ 2,155 1,429 16,173 10,724
Other—net ....................................................................................... 297 530 2,229 3,978
Net cash provided by investing activities ...................................... 5,362 9,104 40,240 68,322
Cash flows from financing activities:Net decrease in bank loans ................................................................ (957) (2,011) (7,182) (15,092)
Proceeds from long-term debt ........................................................... 1,396 3,114 10,477 23,370
Payments of long-term debt .............................................................. (2,875) (3,132) (21,576) (23,505)
Cash dividends paid .......................................................................... (1,458) (1,458) (10,942) (10,942)
Other—net ....................................................................................... (8) 1 (60) 8
Net cash used in financing activities ............................................. (3,902) (3,486) (29,283) (26,161)
Effect of exchange rate change on cash and cash equivalents ................ (36) 93 (270) 698
Net increase in cash and cash equivalents ............................................. (1,322) 7,252 (9,921) 54,424
Cash and cash equivalents at beginning of year ..................................... 52,523 45,271 394,169 339,745
Cash and cash equivalents at end of year (Note 3) ................................ ¥51,201 ¥52,523 $384,248 $394,169
See accompanying notes.
CONSOLIDATED STATEMENTS OF CASH FLOWSTakasago Thermal Engineering Co., Ltd. and A Consolidated SubsidiaryYears ended March 31, 2002 and 2001

12----Takasago Thermal Engineering Co., Ltd.
1. Basis of presenting consolidated financial statementsTakasago Thermal Engineering Co., Ltd. (the “Company”) and its consolidated domestic subsidiary maintain their official
accounting records in Japanese yen and in accordance with the provisions set forth in the Japanese Commercial Code and
accounting principles and practices generally accepted in Japan (“Japanese GAAP”). The accounts of overseas subsidiaries are
based on their accounting records maintained in conformity with generally accepted accounting principles and practices prevailing
in the respective countries of domicile. Certain accounting principles and practices generally accepted in Japan are different from
International Accounting Standards and standards in other countries in certain respects as to application and disclosure require-
ments. Accordingly, the accompanying financial statements are intended for use by those who are informed about Japanese
accounting principles and practices.
The accompanying consolidated financial statements are a translation of the audited consolidated financial statements of the
Company which were prepared in accordance with accounting principles and practices generally accepted in Japan and were filed
with the Local Finance Bureau of the Ministry of Finance as required by the Securities and Exchange Law.
In preparing the accompanying consolidated financial statements, certain reclassifications have been made in the consoli-
dated financial statements issued domestically in order to present them in a form which is more familiar to readers outside
Japan. The consolidated statements of shareholders’ equity have been prepared for the purpose of inclusion in the consolidated
financial statements, although such statements were not customarily prepared in Japan and were not required to be filed with
the authorities of regulation.
The translation of the Japanese yen amounts into U.S. dollars are included solely for the convenience of readers, using the
prevailing exchange rate at March 31, 2002 which was ¥133.25 to U.S.$1.00. The convenience translations should not be con-
strued as representations that the Japanese yen amounts have been, could have been, or could in the future be, converted into U.S.
dollars at this or any other rate of exchange.
2. Summary of significant accounting policiesConsolidation — The consolidated financial statements include the accounts of the Company and a significant subsidiary, “Nihon
Pmac Co., Ltd.”, which is controlled by the Company through substantial ownership of more than 50% of the voting rights and
existence of certain conditions evidencing control by the Company of the decision-making body of such a company. Under the
revised accounting standard for consolidation and equity accounting, investments in affiliated companies (all 20% owned and
certain other 15% to 20% owned) are accounted for using the equity method.
All significant inter-company transactions and accounts have been eliminated in consolidation.
The investments in unconsolidated subsidiaries and affiliated companies are stated at cost as they are insignificant in
the aggregate.
Marketable securities and investment securities — Prior to April 1, 2000, securities (both quoted and non-quoted) are stated
at cost determined by the moving-average method and written down to the market price or an estimated realizable value if the
securities have been significantly impaired and the impairment is not considered to be recoverable.
Effective April 1, 2000, the Companies adopted the new Japanese accounting standard on accounting for financial instruments
(“Opinion Concerning Establishment of Accounting Standard for Financial Instruments” issued by the Business Accounting Delib-
eration Council on January 22, 1999).
Upon applying the new accounting standard, companies are required to examine the intent of holding each security and classify
those securities as (a) securities held for trading purposes (hereafter, “trading securities”), (b) debt securities intended to be held
to maturity (hereafter, “held-to-maturity debt securities”), (c) equity securities issued by subsidiaries and affiliated companies,
and (d) for all other securities that are not classified in any of the above categories (hereafter, “available-for-sale securities”)
Held-to-maturity debt securities are stated at amortized cost. Equity securities issued by subsidiaries and affiliated companies
which are not consolidated or accounted for by the equity method are stated at moving-average cost. Available-for-sale securities
with fair market values are stated at fair market values. Unrealized gains and unrealized losses on these securities are reported,
net of applicable income taxes, as a separate component of the shareholders’ equity. Realized gains and losses on sale of such
securities is computed using the moving-average cost. The Companies had no trading securities.
Debt securities with no fair market values are stated at amortized cost, net of the amount considered not collectible. Other
securities with no fair market values are stated principally at the moving-average cost.
If the market value of held-to-maturity debt securities, equity securities issued by subsidiaries and affiliated companies, and
available-for-sale securities, declines significantly, such securities are stated at fair market value and the difference between fair
market value and the carrying amount is recognized as a loss in the period of the decline. If the fair market value of equity securities
NOTES TO CONSOLIDATED FINANCIAL STATEMENTSTakasago Thermal Engineering Co., Ltd. and A Consolidated SubsidiaryMarch 31, 2002 and 2001

Annual Report 2002----13
issued by subsidiaries and affiliated companies is not readily available, such securities should be written down to net asset value in
the event net asset value has significantly declined. Unrealized losses on these securities are reported in the income statement.
As a result of adopting the new accounting standard for financial instruments, income before income taxes decreased by
¥1,008 million ($7,565 thousand) in the year ended March 31, 2001 compared with what would have been reported under the
previous accounting policy. Also, based on the examination of the intent of holding each security upon application of the new
accounting standard at April 1, 2000, held-to-maturity debt securities and available-for-sale securities maturing within one year
from the balance sheet date are included in current assets, and other securities are included in investments and other assets. As a
result, at April 1, 2000, securities in current assets decreased by ¥9,981 million ($74,904 thousand) and investment securities
increased by the same amount compared with what would have been reported under the previous accounting policy.
Allowance for doubtful accounts — Allowance for doubtful accounts is provided in amounts sufficient to cover probable losses on
collection. It consists of the estimated uncollectible amount with respect to certain identified doubtful accounts and an amount
calculated using the rate of actual collection losses in the past with respect to the remaining receivables.
Allowance for claim expenses — Allowance for claim expenses is provided in amounts sufficient to cover possible claim expenses
on completed contracts. The Company adopts the method of providing the allowance based on the estimated amount of payments
for future claims which may be filed on contracts completed during the year.
Construction contracts — Construction contracts of the Company are accounted for by the completed-contract method.
Expenditures on uncompleted contracts to be charged to cost of contracts at the time of completion are included in current
assets. These expenditures are not offset against advances received on uncompleted contracts, which are instead included in
current liabilities. No profits or losses, therefore, are recognized before the completion of the work.
Construction contracts which will be collected in long-term installment payments are accounted for on the installment basis in
accordance with the Japanese tax regulations. For the years ended March 31, 2002 and 2001, no such contracts were outstanding.
Property, plant and equipment — Property, plant and equipment are stated at cost. Depreciation is computed using the declining-
balance method over their useful lives as prescribed in the Japanese tax regulations.
Certain lease transactions — Finance leases except those for which the ownership of the leased assets are considered to be trans-
ferred to the lessee, are not capitalized and accounted for in the same manner as operating leases (non-capitalized finance leases).
Retirement benefits — The Company and its consolidated subsidiary have contributory and non-contributory funded pension plans
covering substantially all employees. Eligibility for enrollment in the contributory plan is 5 or more years of service and 23 or
more years of age. Eligibility for the non-contributory plan is 3 or more years of service. The amount of retirement benefits is, in
general, based on the length of service, basic salary at the time of retirement and cause of retirement. Prior to April 1, 2000,
annual contributions, which consist of current period costs and amortization of prior service costs over 8.5 years and 20 years,
respectively, were charged to income when paid.
Effective April 1, 2000, the Company and its consolidated subsidiary adopted the new accounting standard, “Opinion on
Setting Accounting Standard for Employees’ Severance and Pension Benefits”, issued by the Business Accounting Deliberation
Council on June 16, 1998. Under the new accounting standard, the liabilities and expenses for severance and retirement
benefits are determined based on the amounts actuarially calculated using certain assumptions.
The Company and its consolidated subsidiary provided allowance for employees’ severance and retirement benefits based on the
estimated amounts of projected benefit obligation and the fair value of the plan assets at the year end. Actuarial gains and losses
are recognized as income or expense in equal amounts principally over 10 years commencing from the succeeding period.
The excess of the projected benefit obligation over the fair value of pension assets as of April 1, 2000 and the liabilities for
severance and retirement benefits recorded as of April 1, 2000 (the “net transition obligation”) amounted to ¥2,344 million
($17,591 thousand). All of the net transition obligation was recognized as expense in the year ended March 31, 2001.
As a result of the adoption of the new accounting standard, in the year ended March 31, 2001, severance and retirement
benefit expense increased by ¥2,433 million ($18,259 thousand), operating income decreased by ¥82 million ($615 thousand)
and income before income taxes decreased by ¥2,426 million ($18,206 thousand) compared with what would have been recorded
under the previous accounting standard.
The liability for retirement benefits to directors and corporate auditors are fully accrued.

14----Takasago Thermal Engineering Co., Ltd.
Bonuses to directors and corporate auditors — Bonuses to directors and corporate auditors, which are subject to shareholders’
approval at the annual shareholders’ meeting under the Commercial Code of Japan, are accounted for as appropriations of
retained earnings.
Income taxes — The Company computes the provision for income taxes based on the pretax income included in the consolidated
statement of income and recognizes deferred tax assets and liabilities for the expected future tax consequences of temporary dif-
ferences between the financial statement basis and the tax basis of assets and liabilities.
Foreign currency translation — Receivables and payables denominated in foreign currencies are translated into Japanese yen at
the exchange rates at the balance sheet date.
Prior to April 1, 2000, long-term receivables and payables denominated in foreign currencies were translated at historical
exchange rates.
Effective April 1, 2000, the Company and its consolidated subsidiary adopted the revised accounting standard, “Opinion
Concerning Revision of Accounting Standard for Foreign Currency Translation”, issued by the Business Accounting Deliberation
Council on October 22, 1999.
Under the revised accounting standard, long-term receivables and payables denominated in foreign currencies are also trans-
lated into Japanese yen at the exchange rates at the balance sheet date. The effect on the income statement of adopting the
revised accounting standard was immaterial.
Revenues and expenses resulting from the Company’s overseas operations are translated at the rate of exchange prevailing
when the relevant transaction was made. Exchange gains and losses are credited or charged to income.
Amounts per share of common stock — In computing net income per share of common stock, the average number of shares out-
standing during each fiscal year has been used.
Diluted net income per share is not presented, since the Company has never issued any securities with a diluting effect.
Cash dividends per share represent actual amounts declared as applicable to the respective years.
Reclassifications — Certain prior year amounts have been reclassified to conform to the 2002 presentation. These changes had no
impact on previously reported results of operations or shareholders’ equity.
Cash flow statement and cash and cash equivalents — In preparing the consolidated statements of cash flows, cash on hand,
readily-available deposits and short-term highly liquid investments with maturities of not exceeding three months at the time of
purchase are considered to be cash and cash equivalents.
Derivatives and hedge accounting —The new accounting standard for financial instruments, effective from the year ended March
31, 2001, requires companies to state derivative financial instruments at fair value and to recognize changes in the fair value as
gains or losses unless derivative financial instruments are used for hedging purposes.
If derivative financial instruments are used as hedges and meet certain hedging criteria, a company defers recognition of gains
or losses resulting from changes in fair value of derivative financial instruments until the related losses or gains on the hedged
items are recognized.
However, in cases where forward foreign exchange contracts are used as hedges and meet certain hedging criteria, forward
foreign exchange contracts and hedged items are accounted for in the following manner:
(1) If a forward foreign exchange contract is executed to hedge an existing foreign currency receivable or payable,
(a) The difference, if any, between the Japanese yen amount of the hedged foreign currency receivable or payable translated
using the spot rate at the inception date of the contract and the book value of the receivable or payable is recognized in
the income statement in the period which includes the inception date, and
(b) The discount or premium on the contract (that is, the difference between the Japanese yen amount of the contract trans-
lated using the contracted forward rate and that translated using the spot rate at the inception date of the contract) is
recognized over the term of the contract.
(2) If a forward foreign exchange contract is executed to hedge a future transaction denominated in a foreign currency, the future
transaction will be recorded using the contracted forward rate, and no gains or losses on the forward foreign exchange con-
tract are recognized.

Annual Report 2002----15
Also, if interest rate swap contracts are used as hedges and meet certain hedging criteria, the net amount to be paid or received
under the interest rate swap contract is added to or deducted from the interest on the assets or liabilities for which the swap con-
tract was executed.
3. Cash and cash equivalentsCash and cash equivalents at March 31, 2002 and 2001 for the consolidated statements of cash flows consisted of the following:
Thousands ofU.S. dollars
Millions of yen (Note 1)
2002 2001 2002 2001
Cash and time deposits ........................................................................... ¥53,570 ¥59,240 $402,026 $444,578
Marketable securities ............................................................................. — 1,100 — 8,255
Marketable securities (except for M.M.F.) .............................................. — (199) — (1,493)
Marketable securities due within three months ........................................ 30 — 226 —
Time deposits over three months ............................................................. (2,399) (7,618) (18,004) (57,171)
Cash and cash equivalents ...................................................................... ¥51,201 ¥52,523 $384,248 $394,169
4. Market value information for securities(1) At March 31, 2002 and 2001, acquisition cost, book value and fair value of securities with available fair values were as follows:
(a) Held-to-maturity debt securitiesThousands ofU.S. dollars
Millions of yen (Note 1)
2002 2001 2002 2001
Securities with fair value exceeding book value:
Book value .............................................................................................. ¥809 ¥809 $6,071 $6,071
Fair value ............................................................................................... 847 857 6,356 6,432
Difference ............................................................................................... ¥ 38 ¥ 48 $ 285 $ 361
(b) Available-for-sale securitiesMillions of yen
2002 Acquisition cost Book value Difference
Securities with book value (fair value) exceeding acquisition cost:
Equity securities .............................................................................................. ¥ 3,139 ¥ 4,493 ¥ 1,354
Other securities:
Equity securities .............................................................................................. ¥17,556 ¥14,464 ¥(3,092)Others ............................................................................................................. 944 876 (68)
Total other securities ....................................................................................... ¥18,500 ¥15,340 ¥(3,160)
Millions of yen
2001 Acquisition cost Book value Difference
Securities with book value (fair value) exceeding acquisition cost:
Equity securities .............................................................................................. ¥ 7,572 ¥11,313 ¥ 3,741
Other securities:
Equity securities .............................................................................................. ¥15,080 ¥11,254 ¥(3,826)
Others ............................................................................................................. 740 740 —
Total other securities ....................................................................................... ¥15,820 ¥11,994 ¥(3,826)

16----Takasago Thermal Engineering Co., Ltd.
Thousands of U.S. dollars (Note 1)
2002 Acquisition cost Book value Difference
Securities with book value (fair value) exceeding acquisition cost:
Equity securities .............................................................................................. $ 23,557 $ 33,719 $ 10,162
Other securities:
Equity securities .............................................................................................. $131,752 $108,548 $(23,204)Others ............................................................................................................. 7,084 6,574 (510)
Total other securities ....................................................................................... $138,836 $115,122 $(23,714)
Thousands of U.S. dollars (Note 1)
2001 Acquisition cost Book value Difference
Securities with book value (fair value) exceeding acquisition cost:
Equity securities .............................................................................................. $ 56,826 $84,901 $ 28,075
Other securities:
Equity securities .............................................................................................. $113,171 $84,458 $(28,713)
Others ............................................................................................................. 5,553 5,553 —
Total other securities ....................................................................................... $118,724 $90,011 $(28,713)
(2) At March 31, 2002 and 2001, book value of securities with no available fair values were as follows:
(a) Held-to-maturity debt securitiesThousands ofU.S. dollars
Millions of yen (Note 1)
2002 2001 2002 2001
Non-listed foreign bond .......................................................................... ¥3,000 ¥3,000 $22,514 $22,514
Discount financial bond .......................................................................... 19 199 143 1,493
Total .............................................................................................. ¥3,019 ¥3,199 $22,657 $24,007
(b) Available-for-sale securitiesThousands ofU.S. dollars
Millions of yen (Note 1)
2002 2001 2002 2001
Mid-term national bond.......................................................................... ¥ 30 ¥ — $ 225 $ —
Money management fund ........................................................................ — 901 — 6,762
Non-listed equity securities .................................................................... 1,377 913 10,334 6,852
Total .............................................................................................. ¥1,407 ¥1,814 $10,559 $13,614
(3) At March 31, 2002 and 2001, maturities of available-for-sale securities with maturity and held-to-maturity debt securities
were as follows:Millions of yen
Over one year Over five yearsWithin one but within but within Over ten
2002 year five years ten years years Total
Bonds:
Government bonds ...................................... ¥ — ¥ — ¥ 499 ¥ — ¥ 499Corporate bonds ......................................... 119 1,210 2,000 — 3,329
Others: .......................................................... 213 130 263 — 606
Total ......................................................... ¥332 ¥1,340 ¥2,762 ¥ — ¥4,434

Annual Report 2002----17
Millions of yen
Over one year Over five yearsWithin one but within but within Over ten
2001 year five years ten years years Total
Bonds:
Government bonds ...................................... ¥ — ¥ — ¥ 500 ¥ — ¥ 500
Corporate bonds ......................................... 200 1,309 2,000 — 3,509
Others: .......................................................... — 348 186 — 534
Total ......................................................... ¥200 ¥1,657 ¥2,686 ¥ — ¥4,543
Thousands of U.S. dollars (Note 1)
Over one year Over five yearsWithin one but within but within Over ten
2002 year five years ten years years Total
Bonds:
Government bonds ...................................... $ — $ — $ 3,745 $ — $ 3,745Corporate bonds ......................................... 893 9,081 15,009 — 24,983
Others: .......................................................... 1,598 976 1,974 — 4,548
Total ......................................................... $2,491 $10,057 $20,728 $ — $33,276
Thousands of U.S. dollars (Note 1)
Over one year Over five yearsWithin one but within but within Over ten
2001 year five years ten years years Total
Bonds:
Government bonds ...................................... $ — $ — $ 3,752 $ — $ 3,752
Corporate bonds ......................................... 1,501 9,824 15,009 — 26,334
Others: .......................................................... — 2,612 1,396 — 4,008
Total ......................................................... $1,501 $12,436 $20,157 $ — $34,094
5. Derivative transactions — the company onlyThe Company utilizes, commencing from the year ended March 31, 2000, only forward foreign exchange contracts as derivative
transactions in order to hedge foreign currency risks arising from time deposits. The derivative transactions are made solely with
highly rated financial institutions, therefore, the Company expects credit risk is low.
The contracts relating to foreign currency denominated time deposits were approved by the General Manager of Operations
and contracted by the Overseas Operations Department. The results are then reported to the General Manager of Accounting and
Finance Department.

18----Takasago Thermal Engineering Co., Ltd.
6. Bank loans and long-term debtBank loans at March 31, 2002 and 2001 were represented by short-term notes, bearing interest principally at 1.375% to
1.750% per annum and at 1.375% to 1.875% per annum, respectively. The Company has had no difficulty in renewing such
notes when it considered such renewal advisable.
Long-term debt at March 31, 2002 and 2001 consisted of the following:Thousands ofU.S. dollars
Millions of yen (Note 1)
2002 2001 2002 2001
Loans principally from banks and insurance companies:
Secured, with interest rates ranging from 1.6% to 2.9% (2002) and
2.0% to 3.0% (2001) ...................................................................... ¥1,218 ¥1,500 $ 9,141 $11,257
Unsecured, with interest rates ranging from 1.4% to 2.6% (2002) and
1.7% to 2.3% (2001) ...................................................................... 3,312 4,509 24,856 33,838
4,530 6,009 33,997 45,095
Less amount due within one year ............................................................ (2,351) (2,814) (17,644) (21,118)
¥2,179 ¥3,195 $16,353 $23,977
As is customary in Japan, security must be given if requested by a lending bank and such bank has the right to offset cash
deposited with it against any debt or obligation that becomes due and, in the case of default or certain other specified events,
against all debt payable to the bank. The Company has never received any such request.
The annual maturities of long-term debt at March 31, 2002 were as follows:Thousands ofU.S. dollars
Years ending March 31, Millions of yen (Note 1)
2003 ................................................................................................................................................ ¥2,351 $17,644
2004 ................................................................................................................................................ 1,517 11,385
2005 ................................................................................................................................................ 587 4,405
2006 ................................................................................................................................................ 75 563
At March 31, 2002 assets pledged as collateral for long-term debt and guarantees were as follows:Thousands ofU.S. dollars
Millions of yen (Note 1)
Property, plant and equipment
(Net of accumulated depreciation) ................................................................................................... ¥258 $1,936
7. Income taxesTaxes on income consist of corporation, enterprise and inhabitants’ taxes. The aggregate statutory tax rate on income before
income taxes was approximately 42.1 % for 2002 and 2001.
The actual effective tax rate in the accompanying statements of income differed from the statutory tax rate primarily as a
result of expenses not deductible for tax purposes.
The following table summarizes the significant differences between the statutory tax rate and the Company’s effective tax rate
for financial statement purposes for the years ended March 31, 2002 and 2001:2002 2001
Statutory tax rate ....................................................................................................................... 42.1% 42.1%
Non-taxable dividend income ................................................................................................... (4.0) (2.9)
Non-deductible expenses .......................................................................................................... 10.8 17.3
Per capital inhabitant tax ........................................................................................................ 2.7 2.4
Other ...................................................................................................................................... (0.2) 0.8
Effective tax rate ........................................................................................................................ 51.4% 59.7%

Annual Report 2002----19
Significant components of the Company’s deferred tax assets and liabilities as of March 31, 2002 and 2001 were follows:
Thousands ofU.S. dollars
Millions of yen (Note 1)
2002 2001 2002 2001
Deferred tax assets:
Employees’ severance and retirement benefits ...................................... ¥3,189 ¥3,489 $23,932 $26,184
Officers’ retirement benefits ................................................................ 377 351 2,829 2,634
Enterprise taxes ................................................................................. 197 174 1,479 1,306
Write down of investment securities .................................................... 859 471 6,447 3,535
Net unrealized holding losses on securities ........................................... 1,331 — 9,989 —
Write down of golf membership .......................................................... 329 274 2,469 2,056
Other ................................................................................................. 798 560 5,988 4,202
Total deferred tax assets ................................................................. 7,080 5,319 53,133 39,917
Deferred tax liabilities:
Net unrealized holding gains on securities ........................................... (571) — (4,285) —
Gains on security contribution to employees’ retirement benefit trust .... (481) (481) (3,610) (3,610)
Total deferred liabilities .................................................................. (1,052) (481) (7,895) (3,610)
Net deferred tax assets ........................................................................... ¥6,028 ¥4,838 $45,238 $36,307
8. Retirement benefitsAs explained in Note 2 (the significant accounting policies), effective April 1, 2000, the Company and its consolidated subsidiary
adopted the new accounting standard for employees’ severance and retirement benefits, under which allowance and expenses for
severance and retirement benefits are determined based on the amounts obtained by actuarial calculations.
Retirement benefits included in the liability section of the consolidated balance sheet as of March 31, 2002 and 2001 were
as follows:Thousands ofU.S. dollars
Millions of yen (Note 1)
2002 2001 2002 2001
Projected benefit obligation .................................................................... ¥29,310 ¥26,112 $219,963 $195,963
Unrecognized actuarial differences ......................................................... (5,348) (1,894) (40,135) (14,214)
Less fair value of pension assets ............................................................. (15,219) (14,551) (114,214) (109,201)
Allowance for severance and retirement benefits ..................................... ¥ 8,743 ¥ 9,667 $ 65,614 $ 72,548
Included in the consolidated statements of income for the years ended March 31, 2002 and 2001 were employees’ severance
and retirement benefit expense comprising of the following:Thousands ofU.S. dollars
Millions of yen (Note 1)
2002 2001 2002 2001
Service costs – benefits earned during the year ........................................ ¥1,176 ¥1,186 $8,826 $ 8,901
Interest cost on projected benefit obligation ............................................ 895 864 6,717 6,484
Expected return on plan assets ............................................................... (422) (416) (3,167) (3,122)
Amortization of entire net transition obligation ....................................... — 2,344 — 17,591
Amortization of actuarial differences ...................................................... 189 — 1,418 —
Amortization of prior service costs ......................................................... (727) (652) (5,456) (4,893)
Severance and retirement benefit expense ............................................. ¥1,111 ¥3,326 $8,338 $24,961
The discount rate on benefits obligation used by the Companies is 3.0% and the rate of expected return on plan assets used
principally by the Company and its consolidated subsidiary is 3.0% in the year ended March 31, 2002. The estimated amount of

20----Takasago Thermal Engineering Co., Ltd.
all retirement benefits to be paid at the future retirement date is allocated equally to each service year using the estimated number
of total service years. Actuarial gains and losses are recognized as income or expense in equal amounts principally over 10 years
commencing from the succeeding period.
9. Shareholders’ equityUnder the Commercial Code of Japan (the “Code”), at least 50% of the issue price of new shares is required to be designated
as stated capital. The portion which is not transferred to stated capital is determined by resolution of the Board of Directors.
Proceeds not transferred to stated capital are credited to additional paid-in capital.
In the year ended March 31, 2002, the Code was revised significantly and stock with stated value was abolished. Under the
revised Code, certain amounts of retained earnings equal to at least 10% of cash dividends and bonuses to directors and corporate
auditors must be set aside as a legal reserve until the total of the reserve and additional paid-in capital equals 25% of common
stock. Before the revision of the Code, bonuses to directors and corporate auditors had to be set aside as a legal reserve until the
reserve equals 25% of common stock.
Legal reserve and additional paid-in capital were not available for dividends, but could be used to reduce a deficit by resolution
of the shareholders or could be capitalized by resolution of the Board of Directors before the revision of the Code. Due to the revi-
sion, the legal reserve and additional paid-in capital became available for unappropriated retained earnings for the portion beyond
25 % of common stock by a resolution of the shareholders’ meeting.
The maximum amount that the Company can distribute as dividends is calculated based on the non-consolidated financial
statements of the Company in accordance with the Code.
10. Certain lease transactionsInformation on finance leases except those for which ownership of the leased assets is considered to be transferred to the
lessee were as follows.
(1) Equivalent amounts of acquisition cost, accumulated depreciation and net book value of the assets under non-capitalized
finance leases at March 31, 2002 and 2001 were as follows:Millions of yen
Accumulated2002 Acquisition cost depreciation Net book value
Equipment ............................................................................................................. ¥1,063 ¥443 ¥620
Millions of yen
Accumulated2001 Acquisition cost depreciation Net book value
Equipment ............................................................................................................. ¥1,577 ¥1,166 ¥411
Thousands of U.S. dollars (Note 1)
Accumulated2002 Acquisition cost depreciation Net book value
Equipment ............................................................................................................. $7,977 $3,325 $4,652
Thousands of U.S. dollars (Note 1)
Accumulated2001 Acquisition cost depreciation Net book value
Equipment ............................................................................................................. $11,835 $8,750 $3,085
Depreciation is calculated based on the straight-line method over the contracted lease period assuming no residual values.

Annual Report 2002----21
(2) The amounts of outstanding future lease payments due at March 31, 2002 and 2001, and lease transactions for the year
ended March 31, 2002 and 2001 were as follows:Thousands ofU.S. dollars
Millions of yen (Note 1)
Future lease payments 2002 2001 2002 2001
Within one year ..................................................................................... ¥204 ¥216 $1,531 $1,621
Over one year ......................................................................................... 418 198 3,137 1,486
Total .............................................................................................. ¥622 ¥414 $4,668 $3,107
Total lease expenses ............................................................................... ¥283 ¥399 $2,124 $2,994
Depreciation equivalent .......................................................................... ¥277 ¥383 $2,079 $2,874
Interest equivalent ................................................................................. ¥ 3 ¥ 4 $ 23 $ 30
11. Contingent liabilitiesContingent liabilities at March 31, 2002 and 2001 were as follows:
Thousands ofU.S. dollars
Millions of yen (Note 1)
2002 2001 2002 2001
For notes discounted with banks ............................................................ ¥201 ¥337 $1,508 $2,529
For notes endorsed ................................................................................ 10 10 75 75
For guarantees for loans of unconsolidated subsidiaries, employees
and others from banks .......................................................................... 360 485 2,702 3,640
¥571 ¥832 $4,285 $6,244
12. Segment informationThe Company and its consolidated subsidiary are mainly engaged in construction business and sale and production of equipment.
Summaries of net assets, operating income and total assets by industry segment for the years ended March 31, 2002 and
2001 were as follows:Millions of yen
2002 Construction Equipment Total Elimination Consolidated
Net sales:
Outside customers ....................................... ¥191,259 ¥5,177 ¥196,436 ¥ — ¥196,436Inside group ............................................... — 857 857 (857) —
Total ...................................................... 191,259 6,034 197,293 (857) 196,436Costs and expenses ..................................... 188,132 5,563 193,695 (944) 192,751
Operating income ....................................... ¥ 3,127 ¥ 471 ¥ 3,598 ¥ 87 ¥ 3,685
Assets and others:
Assets ........................................................ ¥215,787 ¥6,282 ¥222,069 ¥(846) ¥221,223Depreciation .............................................. 555 99 654 (0) 654Capital Expenditures .................................. 203 206 409 (3) 406

22----Takasago Thermal Engineering Co., Ltd.
Millions of yen
2001 Construction Equipment Total Elimination Consolidated
Net sales:
Outside customers ....................................... ¥238,343 ¥4,870 ¥243,213 ¥ — ¥243,213
Inside group ............................................... — 1,130 1,130 (1,130) —
Total ...................................................... 238,343 6,000 244,343 (1,130) 243,213
Costs and expenses ..................................... 233,105 5,682 238,787 (1,224) 237,563
Operating income ....................................... ¥ 5,238 ¥ 318 ¥ 5,556 ¥ 94 ¥ 5,650
Assets and others:
Assets ........................................................ ¥245,697 ¥6,141 ¥251,838 ¥(839) ¥250,999
Depreciation .............................................. 611 91 702 (1) 701
Capital Expenditures .................................. 189 72 261 — 261
Thousands of U.S. dollars (Note 1)
2002 Construction Equipment Total Elimination Consolidated
Net sales:
Outside customers ....................................... $1,435,340 $38,851 $1,474,191 $ — $1,474,191Inside group ............................................... — 6,432 6,432 (6,432) —
Total .................................................. 1,435,340 45,283 1,480,623 (6,432) 1,474,191Costs and expenses ......................................... 1,411,872 41,749 1,453,621 (7,084) 1,446,537
Operating income ........................................... $ 23,468 $ 3,534 $ 27,002 $ 652 $ 27,654
Assets and others:
Assets ........................................................ $1,619,415 $47,144 $1,666,559 $(6,349) $1,660,210Depreciation .............................................. 4,165 743 4,908 (0) 4,908Capital Expenditures .................................. 1,523 1,546 3,069 (22) 3,047
Thousands of U.S. dollars (Note 1)
2001 Construction Equipment Total Elimination Consolidated
Net sales:
Outside customers ....................................... $1,788,690 $36,548 $1,825,238 $ — $1,825,238
Inside group ............................................... — 8,480 8,480 (8,480) —
Total .................................................. 1,788,690 45,028 1,833,718 (8,480) 1,825,238
Costs and expenses ..................................... 1,749,381 42,642 1,792,023 (9,186) 1,782,837
Operating income ....................................... $ 39,309 $ 2,386 $ 41,695 $ 706 $ 42,401
Assets and others:
Assets ........................................................ $1,843,880 $46,086 $1,889,966 $(6,296) $1,183,670
Depreciation .............................................. 4,585 683 5,268 (7) 5,261
Capital Expenditures .................................. 1,418 541 1,959 — 1,959
Segment information by location and overseas sales is not shown from a materiality view point.
13. Subsequent eventThe following appropriations of retained earnings at March 31, 2002, were approved at the annual meeting of shareholders held
on June 27, 2002.Thousands ofU.S. dollars
Millions of yen (Note 1)
Year-end cash dividends .................................................................................................................... ¥728 $5,463
Bonuses to directors and corporate auditors ....................................................................................... 192 1,441
Annual Report 2002----23
We have audited the accompanying consolidated balance sheets of Takasago Thermal Engineering Co., Ltd. and a subsidiary as of
March 31, 2002 and 2001, and the related consolidated statements of income, shareholders’ equity and cash flows for the years
then ended, expressed in Japanese yen. Our audits were made in accordance with generally accepted auditing standards in Japan
and, accordingly, included such tests of the accounting records and such other auditing procedures as we considered necessary in
the circumstances.
In our opinion, the consolidated financial statements referred to above present fairly the consolidated financial position of
Takasago Thermal Engineering Co., Ltd. and a subsidiary as of March 31, 2002 and 2001, and the consolidated results of their
operations and their cash flows for the years then ended in conformity with accounting principles generally accepted in Japan
(Note 1) applied on a consistent basis during the periods, except as noted in the following paragraph.
As explained in Note 2, in the year ended March 31, 2001, Takasago Thermal Engineering Co., Ltd. and a subsidiary prospec-
tively adopted new Japanese accounting standards for employees’ severance and retirement benefits, financial instruments and
foreign currency translation.
Also, in our opinion, the U.S. dollar amounts in the accompanying consolidated financial statements have been translated from
Japanese yen on the basis set forth in Note 1.
Tokyo, Japan
June 27, 2002
REPORT OF INDEPENDENT PUBLIC ACCOUNTANTS
To the Shareholders and the Board of Directors ofTakasago Thermal Engineering Co., Ltd.

24----Takasago Thermal Engineering Co., Ltd.
Tokyo
Hsin-chu City
Manila
SuzhouShanghaiShenzhen
Hong KongBangkok
Kuala LumpurSingapore
Batam
Takasago Overseas Network
(Domestic Offices)Head Office4-2-8 Kanda Surugadai,Chiyoda-ku, Tokyo 101-8321, JapanTel: 81-3-3255-8212 Fax: 81-3-3251-0914R&D Center: Atsugi, Sendai
Tokyo Main Office4-2-8 Kanda Surugadai,Chiyoda-ku, Tokyo 101-8321, JapanTel: 81-3-3255-8221 Fax: 81-3-3251-6122
Sapporo Branch OfficeNippon Seimei Hokumonkan Bldg.,5-1-3, Kita-4-Nishi, Chuo-ku,Sapporo 060-0004, JapanTel: 81-11-261-2531 Fax: 81-11-251-2608
Tohoku Branch OfficeKowa Bldg., 2-4-1 Ichiban-cho,Aoba-ku, Sendai 980-0811, JapanTel: 81-22-227-9552 Fax: 81-22-266-0414
Kanto Branch OfficeSumitomo Fudosan Ryogoku Bldg.,2-10-8 Ryogoku,Sumida-ku, Tokyo 130-0026, JapanTel: 81-3-5600-2201 Fax: 81-3-5600-2277
Yokohama Branch Office26th Fl., Land Mark Tower,2-2-1-1 Minatomirai, Nishi-ku,Yokohama 220-8126, JapanTel: 81-45-224-1570 Fax: 81-45-224-1580
Nagoya Branch Office37th Fl., Central Towers,1-1-4 Meieki, Nakamura-ku,Nagoya 450-6037, JapanTel: 81-52-582-8400 Fax: 81-52-581-4155
Osaka Branch Office20th Fl., Applause Tower19-19 Chayamachi, Kita-ku,Osaka 530-0013, JapanTel: 81-6-6377-2800 Fax: 81-6-6372-5557
Hiroshima Branch OfficeAsahi Bldg., 13-7 Moto-machi,Naka-ku, Hiroshima 730-0011, JapanTel: 81-82-221-2871 Fax: 81-82-223-6903
Kyushu Branch OfficeTaihaku Center Bldg., 2-19-24 Hakata-Ekimae,Hakata-ku, Fukuoka 812-0011, JapanTel: 81-92-431-8050 Fax: 81-92-441-1473
Overseas Business DivisionNK Bldg., 3-6-2 Ogawa-machi,Chiyoda-ku, Tokyo 101-0052, JapanTel: 81-3-3292-0211 Fax: 81-3-3292-0215
(Overseas Branch Offices)Singapore Branch Office111 Somerset Rd., #09-01 SingaporePower Bldg., Singapore 238164Tel: 65-6737-3312 Fax: 65-6733-7442
Hong Kong Branch Office37/Fl., Citicorp Centre, 18 Whitfield Rd.,Causeway Bay, Hong KongTel: 852-2520-2403 Fax: 852-2861-0795
Taiwan Branch Office20F-6, Empire Commercial Bldg.,No. 295, Sec. 2, Kuang-Fu Rd.,Hsin-chu City, TaiwanTel: 886-3-5714512 Fax: 886-3-5714507
Batam Representative OfficeKompleks Salaiman Jalan,Sultan Abdulla Rahman Blk B No. 12Nagoya Batam 29432 IndonesiaTel: 62-778-424281 Fax: 62-778-424325
Shenzhen Representative Office5Lou, Heli Gufen Wenkang Lou, Di Er Gong YeCun, Fu Yong Zhen, Bao An Qu, Shenzhen518103, P.R. of ChinaTel: 86-755-27381078 Fax: 86-755-27381055
Suzhou Representative OfficeUnit A1, 22/F, Kings Tower, Shinshan Rd.,Suzhou 215011, P.R. of ChinaTel: 86-5126-8092986 Fax: 86-5126-8097842
Shanghai Representative OfficeUnit 910C, Pidemco Tower, No.318 Fuzhou Rd.,Huangpu District, Shanghai, 200001, P.R. of ChinaTel: 86-21-6391-2308 Fax: 86-21-6391-2558
(Overseas Affiliates)T.T.E. Engineering (Malaysia) Sdn. Bhd.Ground Fl., Wisma IJM Annexe, Jalan,Yong Shook Lin, 46760 Petaling Jaya,Selangor, MalaysiaTel: 60-3-7955-5972 Fax: 60-3-7955-4370
Thai Takasago Co., Ltd.Bangna Towers C 16th Fl., 40/14 Moo 12,Bangna-Trad Rd., K.M. 6.5, Bangkaew,Bangplee, Samutprakarn 10541, ThailandTel: 66-2-751-9695 Fax: 66-2-751-9694
Takasago Thermal Engineering(Hong Kong) Co., Ltd.37/Fl., Citicorp Centre, 18 Whitfield Rd.,Causeway Bay, Hong KongTel: 852-2520-2403 Fax: 852-2861-0795
Takasago Philippines, Inc.4th floor, Raha Suleyman Bldg.,108 Benavidez St. Legaspi Village,Makati City, Manila, PhilippinesTel: 63-2-840-0014 Fax: 63-2-817-7025
Takasago Thermal Engineering(Shenzhen) Co., Ltd.5Lou, Heli Gufen Wenkang Lou, Di Er Gong YeCun, Fu Yong Zhen, Bao An Qu, Shenzhen518103, P.R. of ChinaTel: 86-755-27381078 Fax: 86-755-27381055
P.T. Takasago Engineering IndonesiaKompleks Salaiman Jalan,Sultan Abdulla Rahman Blk B No. 12Nagoya Batam 29432 IndonesiaTel: 62-778-424281 Fax: 62-778-424325
DIRECTORY
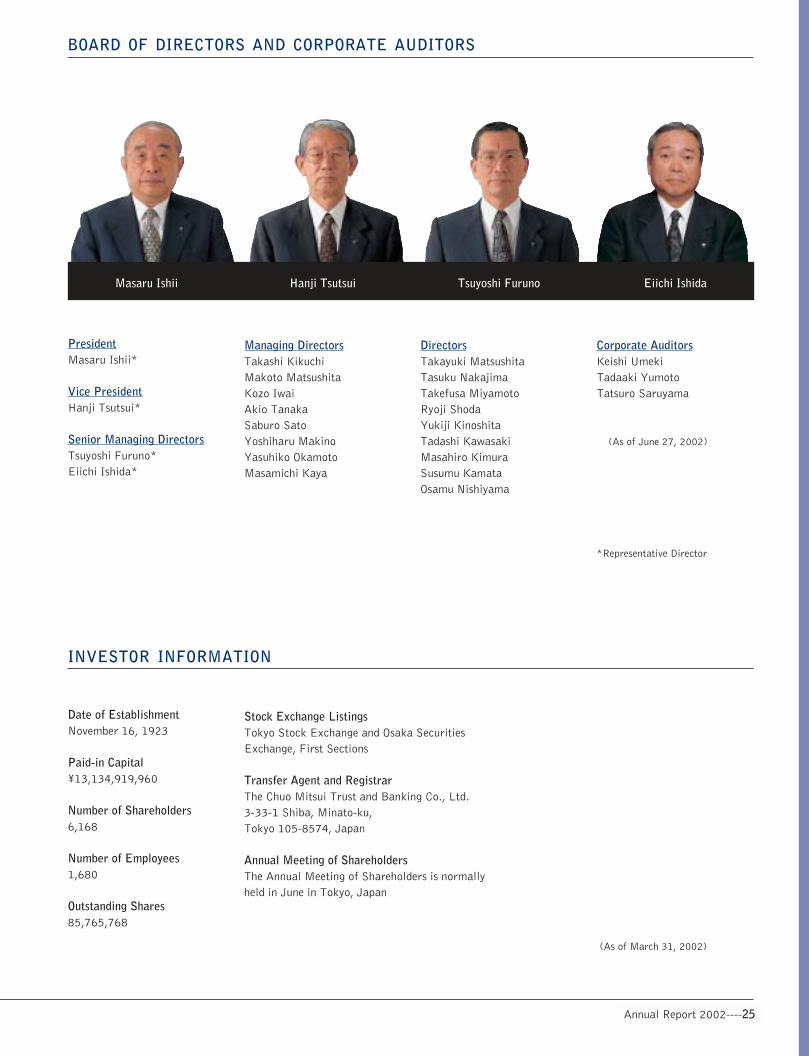
Annual Report 2002----3Annual Report 2002----25
Date of EstablishmentNovember 16, 1923
Paid-in Capital¥13,134,919,960
Number of Shareholders6,168
Number of Employees1,680
Outstanding Shares85,765,768
Stock Exchange ListingsTokyo Stock Exchange and Osaka SecuritiesExchange, First Sections
Transfer Agent and RegistrarThe Chuo Mitsui Trust and Banking Co., Ltd.3-33-1 Shiba, Minato-ku,Tokyo 105-8574, Japan
Annual Meeting of ShareholdersThe Annual Meeting of Shareholders is normallyheld in June in Tokyo, Japan
PresidentMasaru Ishii*
Vice PresidentHanji Tsutsui*
Senior Managing DirectorsTsuyoshi Furuno*Eiichi Ishida*
DirectorsTakayuki MatsushitaTasuku NakajimaTakefusa MiyamotoRyoji ShodaYukiji KinoshitaTadashi KawasakiMasahiro KimuraSusumu KamataOsamu Nishiyama
Managing DirectorsTakashi KikuchiMakoto MatsushitaKozo IwaiAkio TanakaSaburo SatoYoshiharu MakinoYasuhiko OkamotoMasamichi Kaya
Corporate AuditorsKeishi UmekiTadaaki YumotoTatsuro Saruyama
(As of June 27, 2002)
*Representative Director
INVESTOR INFORMATION
(As of March 31, 2002)
Masaru Ishii Hanji Tsutsui Tsuyoshi Furuno Eiichi Ishida
BOARD OF DIRECTORS AND CORPORATE AUDITORS

4----Takasago Thermal Engineering Co., Ltd. This annual report is printed on recycled paper.
Printed in Japan
Takasago Thermal Engineering Co., Ltd.4-2-8 Kanda Surugadai, Chiyoda-ku, Tokyo 101-8321, Japan
Recommended