(Systeme International)

Branches of Earth Science
1. GeologyStudy of the origin, history,
and structure of the earth
2. MeteorologyStudy atmosphere,
especially weather
& weather conditions

3. OceanographyStudy of the ocean and its phenomena
4. Astronomy
Study of the
position, composition
of stars, planets & other objects

Earth’s 4 Spheres
Geosphere/

TIME TO DRAW A….
SCIENTIST!!!
PLEASE GET OUT A BLANK SHEET OF PAPER….

How many of your drawings portrayed a scientist that…
1. Is male?2. Is female?
3. Is wearing glasses?4. Is wearing a lab coat?
5. Has crazy hair?6. Is holding lab equipment?
7. Is holding/around animals?8. Is white?9. Asian?
10. African-American?

Any that look like this???

Albert EinsteinTheoretical Physicist
Best known for…E=MC2

Charles DarwinNaturalist
Best known for…The voyage of the
BeagleThe Origin of Species
Natural Selection

Nikola TeslaInventor and
Electrical Engineer
Known for… Birth of commercial
electricity (electricity and
magnetism)
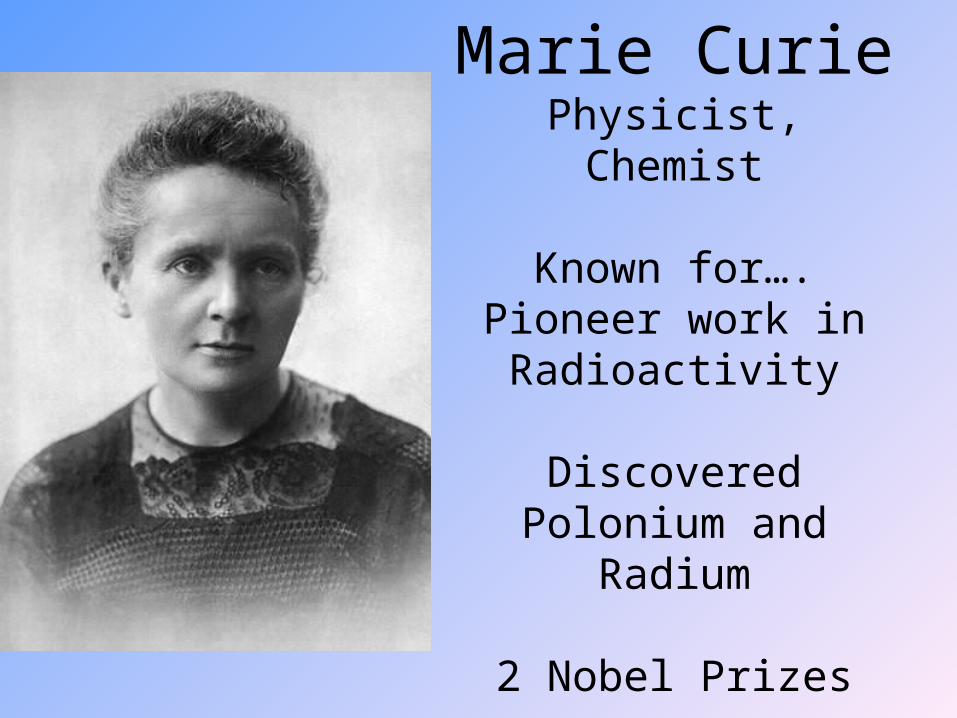
Marie CuriePhysicist, Chemist
Known for….Pioneer work in
Radioactivity
Discovered Polonium and Radium
2 Nobel Prizes
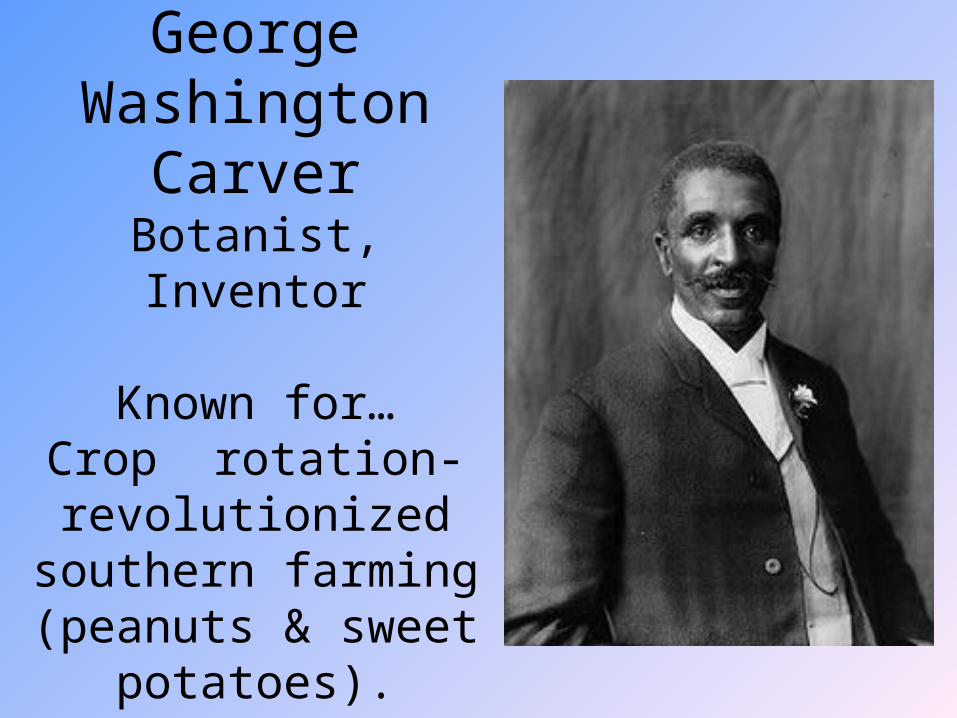
George Washington
CarverBotanist, Inventor
Known for…Crop rotation- revolutionized
southern farming (peanuts & sweet
potatoes).

Dr. Charles Drew
Physician & Researcher
Known for…Developing blood banks
early in WWII

Rachel Carson
Marine Biologist helped advance the
environmental movement.
Best Known For….
Silent Spring
Led to the formation of the EPA.

Rosalind FranklinBiophysicist
X-ray Crystallographer
Known for….X-ray images of
DNA.

Jane GoodallPrimatologist
EthologistAnthropolgist
Known for…. 45 year study of
chimpanzee social and family interactions

One more….
YOU!!!


Methods of Science
To answer questions, scientists use many approaches, but they all use common steps – SCIENTIFIC METHOD
1. Problem/Question
Develop a question or problem that can be solved through experimentation
2. Observation/Research
Make observations and research your topic of interest.
3. Hypothesis Possible explanation for the problem. - Must be testable!- Example: If soil temperatures rise, then plant growth will increase.
4. ExperimentDevelop a procedure to test your hypothesis. Must be measurable (quantifiable).

5. Collect & Analyze Results/Data- Data is information obtained from
an experiment- Can disprove or prove a hypothesis- Include tables, graphs & photographs- Numbers, descriptors
6. Conclusion- Statement that accepts or rejects the hypothesis
- Make recommendations for further study

Experimental Variables
1. Independent Variable– On the X axis– Intentionally manipulated variable– Ex: John is going to use 25 g, 50g, 100g and
250g of sugar in his experiment
2. Dependent Variable– On the Y axis– Factor that may change as a result of
changes made in the independent variable– Ex: Size of the loaf of bread based on amount
of sugar used.

Situation 1– Independent Variable:– Dependant Variable:– Control:
1. Anne read that there had been a sewage spill in one of the local creeks that runs into the local river that is used for recreation, electric power and drinking water. She also read that the factor which causes fish kills in the water seems to be a lowering of the dissolved oxygen.
She also learned that the microorganisms in the sewage were using up the oxygen and if the weather remained cool the DO level would
probably remain acceptable. She collected samples of water from the creek, took them back to the lab and put them into several containers
of the same size into which she put the same amount of water. She varied the temperatures of each container from below room
temperature to above room temperature but kept each at a constant temperature. Each day she performed a dissolved oxygen test on the samples and recorded her data. At the end of 5 days she was able to
draw conclusions from her experiment.

2. John and his lab group were studying how abiotic influence affect organisms. They were told that they were to work with brine shrimp and to determine the pH at which they survive best. They worked with plastic tubing that could be closed off at each end. They began by putting 10 brine shrimp in the tubing in a solution of water. In one end they injected a small amount of a 1% solution of HCL. In the other end a 1% solution of KOH was injected. They observed the shrimp for 30 minutes, recorded their preferences at one-minute intervals and repeated the experiment 3 times.
Situation 2Situation 2- Independent Variable:
- Dependant Variable:- Control:

3. Amy's lab assignment was to determine how members of a species are affected by intraspecific competition. (Competition by members within the same species). She used radish seeds and planted them in small pots. She put the same amount of dirt in each pot. In the first five pots she planted one seed. In the second five pots she planted 10 seeds and in the third five pots she planted 20 seeds. She placed them in a well lighted area and watered her plants whenever the soil surface was dry. At the end of three weeks she removed the plants from each pot including the roots and determined the biomass from each pot. From this she was able to determine the average biomass.
Situation 3Situation 3- Independent Variable:
- Dependant Variable:- Control:

Situation 4Situation 4- Independent Variable:
- Dependant Variable:- Control:
4. Bob’s lab in APES was to measure the effect of toxic materials on brine shrimp and determine the LD50 (lethal
dose 50%). His group was assigned to determine the LD50 of copper sulfate (CuSO4). They used two petri dishes per
concentration. In two petri dishes they put a 10% solution of CuSO4 . In the next a 1% solution, in the next 0.1% , in the next 0.01% and in the last they used 0% copper suflate.
They put 10 brine shrimp in each petri dish and they examined them at the end of 24 and 48 hours. From this
they were able to determine the approximate concentration at which 50% of the brine shrimp died within 48 hours.

Situation 5Situation 5- Independent Variable:
- Dependant Variable:- Control:
5. Katherine wanted to determine which of several popular herbicides was most effective on weeds. She grew five flats of 100 grass seeds each for 5 days. She then took each of five herbicides and sprayed the same
amount on each flat. Each flat received the same amount of water and sunlight. She observed the flats and the end of 12, 24, 36 and 48 hours and counted how many plants
in each flat died within the various time periods.

Control & Experimental Groups
• Control Group– Serves as the standard of comparison– No treatment given- control group is exposed
to the same conditions as the experimental group (except for the variable being tested).
• Experimental Group– Independent variable is changed– Ex: temperature or water given to a plant

OBSERVATIONS

OBSERVATION

Scientific Method PracticeWork on the scientific method pages in your
packet.
When you finish, work on the review page.
TEST ________TEST ________REVIEW SHEET & REVIEW SHEET &
PACKET are DUE PACKET are DUE
at the TESTat the TEST

SCIENTIFIC METHOD LAB

Representing DataRepresenting Data
Graphing- A visual representation of data collected in an experiment
1. Line
Shows trends
easily

2. Bar
Shows counts.
3. Pie
Shows percent
of a whole.

4. Pictographuses images to
depict information
If I wanted to make a graph of how much rainfall occurred in each month, how
should I plot my data for a bar graph?
(What should be put on the X and Y axis?)

ALWAYS USE…
L I N TL I N T

GRAPHS

Work on the graphing pages in your packet

Metric System (SI System)
• The Universal language of measurement• Easily communicated to others
• Decimal system based on the number 10
Used to measure length, volume, mass, weight, density
and temperature

METRIC VS CUSTOMARY

Only 3 countries do NOT use the metric system
United States, Burma & Liberia

KILO HECTO DECA BASE DECI CENTI MILLI“King Henry Died By drinking chocolate milk”
Prefix Abbrev. DefinitionMega 1,000,000 x basic unit
Kilo k x basic unit
h 100 x basic unit
Deka 10 x basic unit
BASEBASE m, g, or L 1 x basic unit
Deci d of the basic unit
c 1/100 of the basic unit
Milli m of the basic unit
µ 1/1,000,000 of the basic unit
MM10001000
HectoHecto
D D (sometimes da)(sometimes da)
1/101/10
CentiCenti
MicrMicroo
1/10001/1000

KILO HECTO DECA BASE DECI CENTI MILLI 1000X 100X 10X 1X 1/10X 1/100X 1000X
K mcdg, m, LDH
“King Henry Died By drinking chocolate milk”


Length: Measurement of distance between two points.• basic unit is the meter
• Kilometer –
• Millimeter –
• Megameter –
• Centimeter –
1000m1/1000m
1,000,000m
1/100m
K H D B d c m# is LARGER
# is SMALLER

Why did I get a speeding ticket in Canada?

MASSMASS: : the amount of matter in an object.
Basic unit is the gram (g)– Nickel = 5 g– Person 52 kg
What is the difference between What is the difference between mass and weight?mass and weight?
Weight is the force which a given mass Weight is the force which a given mass feels due to the gravity at its place.feels due to the gravity at its place.
(F = m x a)

• Basic unit is the Liter (L)
• 1 can of coke is 355 mL
• 1 large Nalgene bottle is 1L
VOLUMEVOLUME: : Measure of the amount of liquid material

DENSITYDENSITY: : used to compare substances based on mass and volume.
• Basic unit is g/mL• Density = mass/volume (D=M/V)
Example an unknown sample:
Mass = 1g and Volume = 1 mL
D = 1g/1mL = 1g/mL
FYI: 1 mL = 1cm3
WATER!
SA
ME
MA
SS
BU
T
DIF
FE
RE
NT
VO
LUM
ES
! WH
AT
HA
PP
EN
ED
TO
TH
E D
EN
SIT
Y?


TEMPERATURE• Average kinetic energy in atoms.
• Measured in degrees Celsius or Kelvin• C K K = C + 273• K C C = K – 273• C= 5/9 (F-32)• F= 9/5 C +32
• Water boils at 100C• Water freezes at 0C• Body Temp 37C

METRIC MEASURMENTS

UNIT ONE TEST IS ON _______
–PACKET IS DUE AT THE TEST
–REVIEW PAGE IS DUE FOR A QUIZ GRADE AT THE TEST


OLD NOTES beyond this point….

METRIC SYSTEM CONVERSIONS

KILO1000Units
HECTO100
Units
DEKA10
UnitsDECI
0.1Unit
CENTI0.01Unit
MILLI0.001Unit
MetersLitersGrams
Ladder Method
How do you use the “ladder” method?
1st – Determine your starting point.
2nd – Count the “jumps” to your ending point.
3rd – Move the decimal the same number of jumps in the same direction.
4 km = _________ m
12
3
How many jumps does it take?
Starting Point Ending Point
4.1
__.2
__.3
__. = 4000 m

Try these conversions using the ladder method.
a. 1cm = _______ m b. 1m = _______ km c. 10gm = _______ mg
d. 112 mL= _______ L e. 14.7 g = _______ kg
Conversion Practice
0.01
0.01470.112
0.001 10,000
f. 1000 mg = _______ g g. 1 L = _______ mL h. 160 cm = _______ mm
i. 14 km = _______ m j. 109 g = _______ kg k. 250 m = _______ km
1
0.10914,000
1000 1600
0.25
Try MORE conversions using the ladder method.

Work on Metric Work on Metric Conversions In your Conversions In your
PacketPacketWhat you don’t finish in class
today becomes HOMEWORK
QUIZ on METRIC
CONVERSIONS in 2 Days!

Write the correct abbreviation for each metric unit.
1) Kilogram _____ 3) Centigram _____ 5) Milimeter _____ 2) Meter _____ 4) Dekaliter _____ 6) Hectoliter _____
Try these conversions, using the ladder method.
7) 55 mm= _______ m 12) 0.075 m = _______ cm 17) 2,355,000mm = _______km
8) 7000 cm= _______ hm 13) 3456kg= __________mg 18) 0.042 hm= ________ km
9) 275 mm= _______ cm 14) 3500 km= _________ m 19) 1355 km= _________ m
10) 1000 ml= _______ L 15) 3500 km= _________ m 20) 6435 ml= _________ kl
11) 25 cm= _______ Dm 16) 1355m = _________km 21) 3.5kg = ___________mg
22) 1 g = _________ kg
Metric Conversion Challenge
Kg
m
cg
DL
mm
HL
0.055
0.7
27.5
1.0
0.025
7.5
3.456 X 10⁹
3,500,000
0.039
1.355
2.355
0.0042
1,355,000
0.006435
3,500,000
0.001
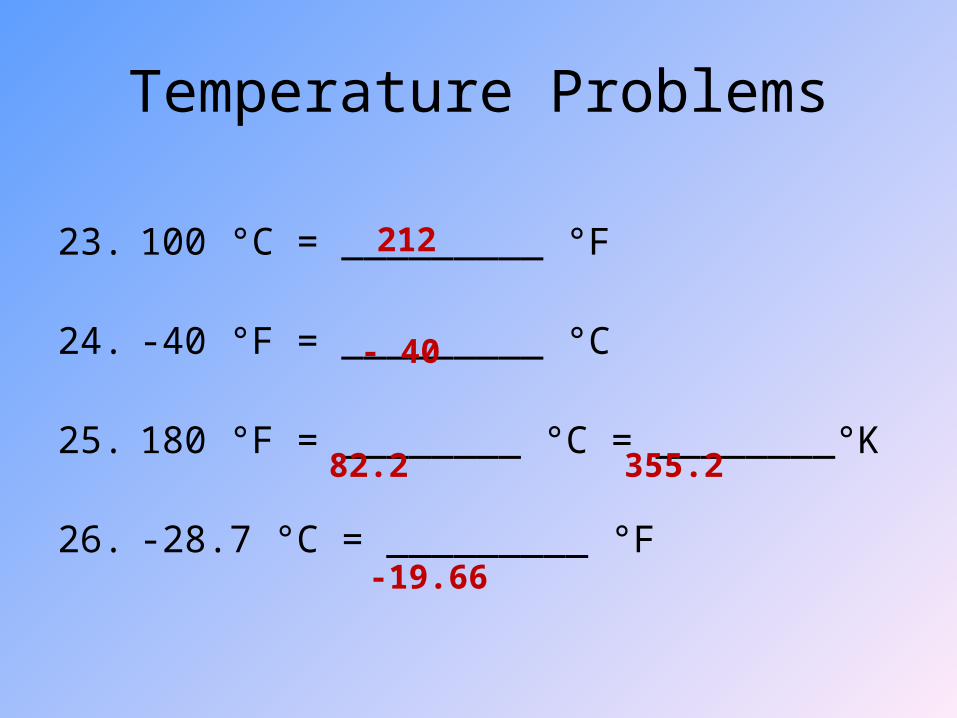
Temperature Problems
23. 100 °C = _________ °F
24. -40 °F = _________ °C
25. 180 °F = ________ °C = ________°K
26. -28.7 °C = _________ °F
212
- 40
82.2 355.2
-19.66

DIMENSIONAL ANALYSIS• Mathematically converting from one
unit of measurement into another.
• Uses ratios to convert units

DIMENSIONAL ANALYSISDimensional Analysis: Mathematically
converting one unit of measurement to another
1 cm = _________m
1 dm = _________km
10 g = _________mg
112 mL= _________dL
14.7g = _________g
1 cm
1 00 cm
1 m= 0.01m
0.01m
1dm 1m
10dm
1Km
1000m= 0.0001Km
0.0001
10,000
0.0112
14.7

English/Metric ConversionsEnglish/Metric Conversions• Similar process as metric to metric
conversion.• Convert 12 inches into centimeters.
1. Lookup conversion rate (2.54cm=1in.)2. Setup. 3. Solve!
12 in. ? cm 1 in.
12 in. 2.54cm 1 in.
multiply across the top and divide
by the bottom
= 30.48 cm

SI English PracticeWork on Page 7 in
your packet.
When you are done, check your answers and move onto SI-English Conversion Practice half sheet.
QUIZ TOMORROW QUIZ TOMORROW ON METRIC ON METRIC
CONVERSIONSCONVERSIONS

GRAPHING ECOLOGY
Do 2 of the 4 graphs outlined on page 8 on a separate piece
of graph paper.
Must have LINT & BE NEAT (use a ruler) !!!!
Recommended