SESSustainable Energy Solutions, L.L.C.
IETC May 24, 2016
Tom Theising, C.E.M., C.D.S.M.
(979) 709-6389
Back to Basics10 Steps to Preparing
for a Successful Energy Assessment
SESSustainable Energy Solutions, L.L.C.
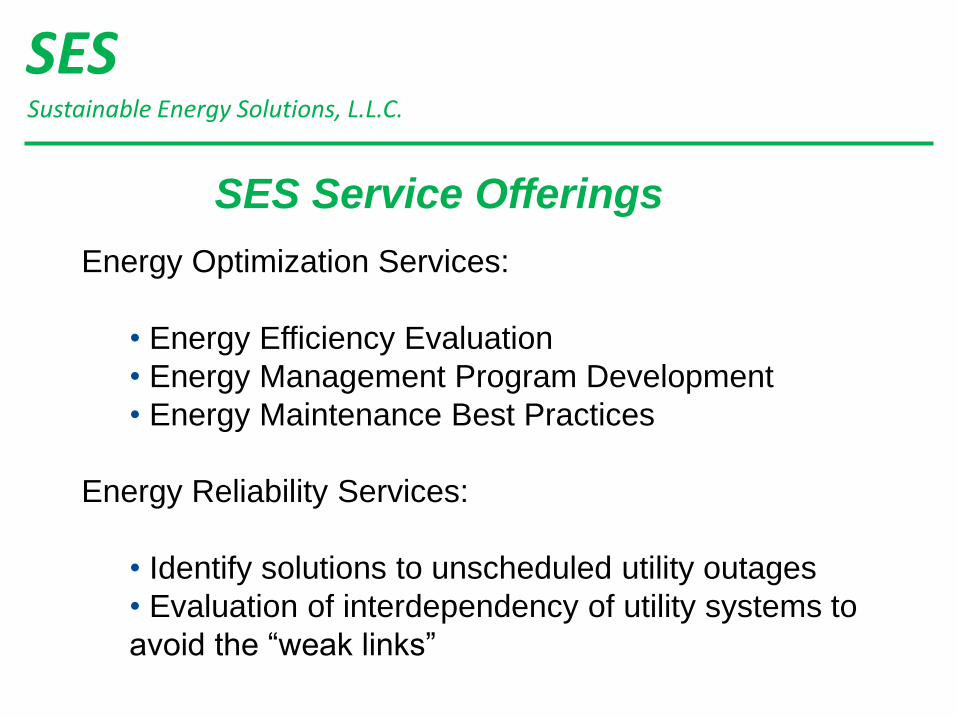
Energy Optimization Services:
• Energy Efficiency Evaluation
• Energy Management Program Development
• Energy Maintenance Best Practices
Energy Reliability Services:
• Identify solutions to unscheduled utility outages
• Evaluation of interdependency of utility systems to
avoid the “weak links”
SES Service Offerings
SESSustainable Energy Solutions, L.L.C.
Primary Costs within a Typical Industry:
• Raw Materials
• Energy
• Personnel
• Maintenance
SESSustainable Energy Solutions, L.L.C.
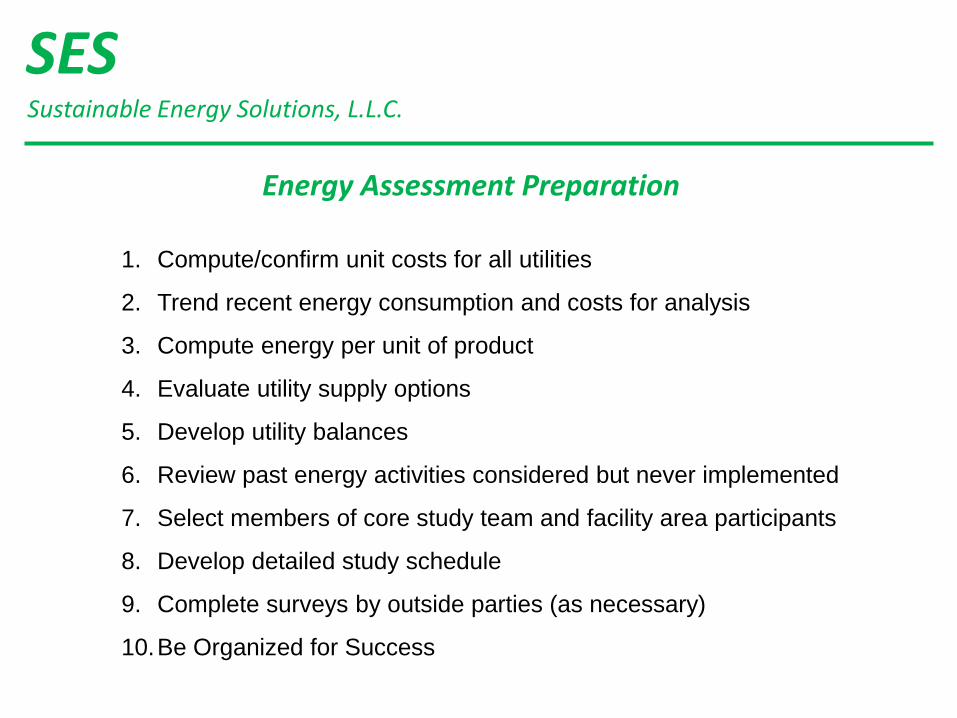
1. Compute/confirm unit costs for all utilities
2. Trend recent energy consumption and costs for analysis
3. Compute energy per unit of product
4. Evaluate utility supply options
5. Develop utility balances
6. Review past energy activities considered but never implemented
7. Select members of core study team and facility area participants
8. Develop detailed study schedule
9. Complete surveys by outside parties (as necessary)
10.Be Organized for Success
Energy Assessment Preparation
SESSustainable Energy Solutions, L.L.C.
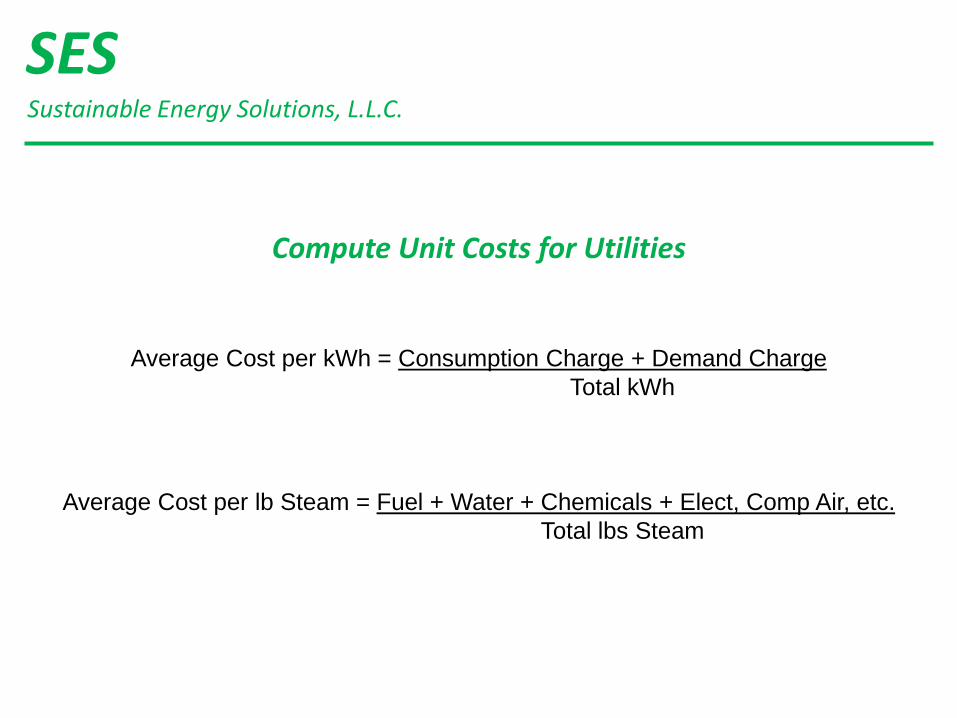
Compute Unit Costs for Utilities
Average Cost per kWh = Consumption Charge + Demand Charge
Total kWh
Average Cost per lb Steam = Fuel + Water + Chemicals + Elect, Comp Air, etc.
Total lbs Steam
SESSustainable Energy Solutions, L.L.C.
SESSustainable Energy Solutions, L.L.C.
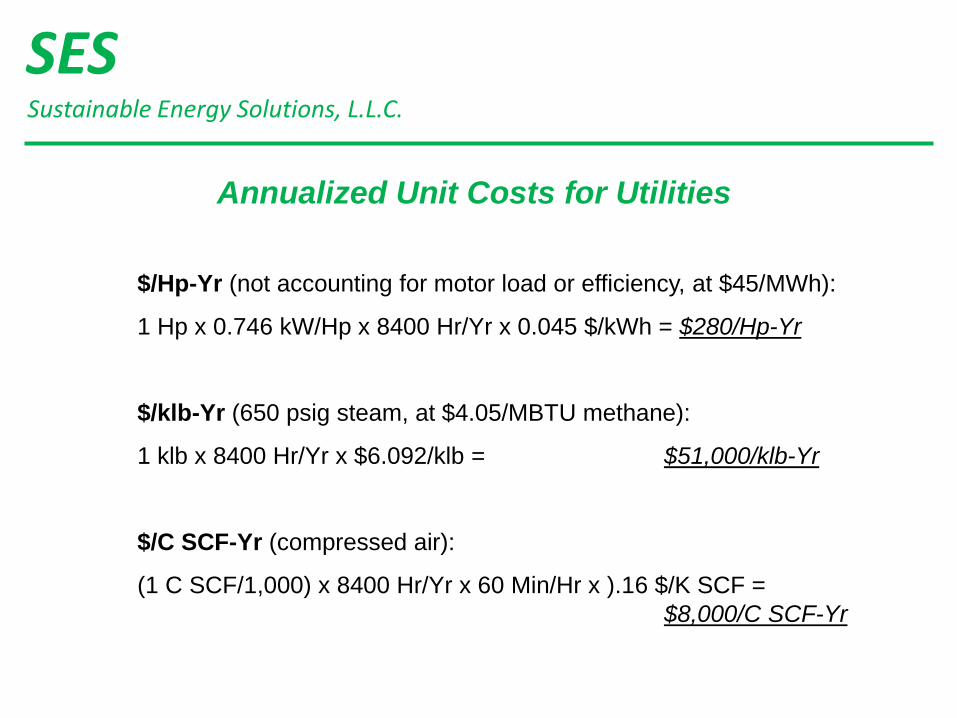
Annualized Unit Costs for Utilities
$/Hp-Yr (not accounting for motor load or efficiency, at $45/MWh):
1 Hp x 0.746 kW/Hp x 8400 Hr/Yr x 0.045 $/kWh = $280/Hp-Yr
$/klb-Yr (650 psig steam, at $4.05/MBTU methane):
1 klb x 8400 Hr/Yr x $6.092/klb = $51,000/klb-Yr
$/C SCF-Yr (compressed air):
(1 C SCF/1,000) x 8400 Hr/Yr x 60 Min/Hr x ).16 $/K SCF =
$8,000/C SCF-Yr

SESSustainable Energy Solutions, L.L.C.
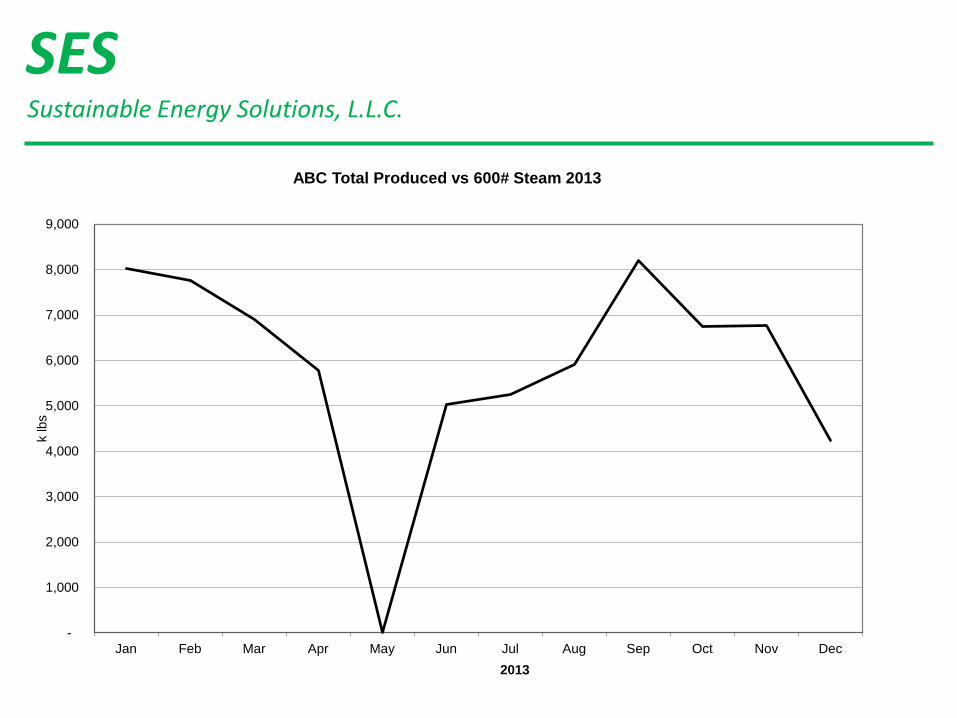
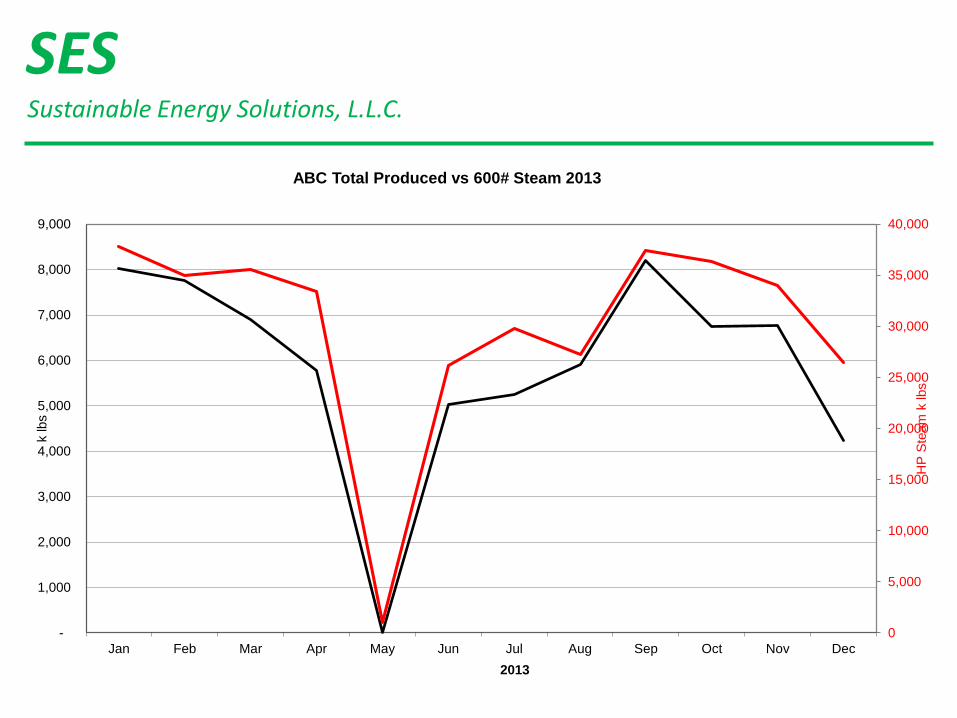
Identify Energy Consumption Trends
• Monthly Energy Consumption Data
• Monthly Production Amount
• Annual Price Trends
SESSustainable Energy Solutions, L.L.C.
-
1,000
2,000
3,000
4,000
5,000
6,000
7,000
8,000
9,000
Jan Feb Mar Apr May Jun Jul Aug Sep Oct Nov Dec
k lbs
2013
ABC Total Produced vs 600# Steam 2013
SESSustainable Energy Solutions, L.L.C.
0
5,000
10,000
15,000
20,000
25,000
30,000
35,000
40,000
-
1,000
2,000
3,000
4,000
5,000
6,000
7,000
8,000
9,000
Jan Feb Mar Apr May Jun Jul Aug Sep Oct Nov Dec
HP
Ste
am
k lbs
k lbs
2013
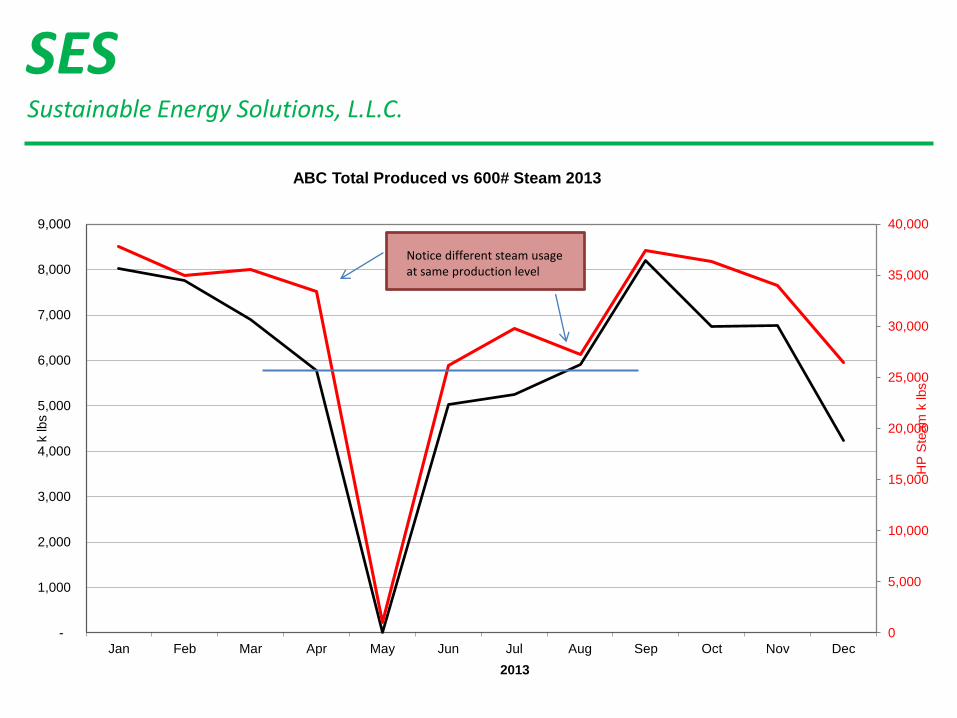
ABC Total Produced vs 600# Steam 2013
SESSustainable Energy Solutions, L.L.C.
0
5,000
10,000
15,000
20,000
25,000
30,000
35,000
40,000
-
1,000
2,000
3,000
4,000
5,000
6,000
7,000
8,000
9,000
Jan Feb Mar Apr May Jun Jul Aug Sep Oct Nov Dec
HP
Ste
am
k lbs
k lbs
2013
ABC Total Produced vs 600# Steam 2013
Notice different steam usage at same production level
SESSustainable Energy Solutions, L.L.C.
0
5,000
10,000
15,000
20,000
25,000
30,000
35,000
40,000
-
1,000
2,000
3,000
4,000
5,000
6,000
7,000
8,000
9,000
Jan Feb Mar Apr May Jun Jul Aug Sep Oct Nov Dec
HP
Ste
am
k lbs
k lbs
2013
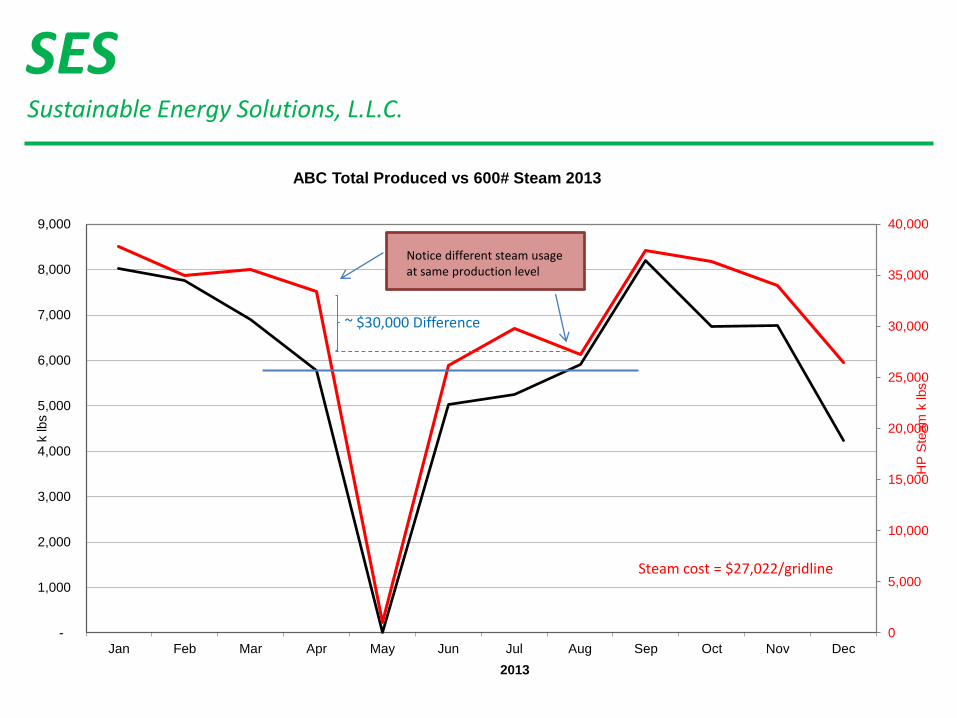
ABC Total Produced vs 600# Steam 2013
Notice different steam usage at same production level
Steam cost = $27,022/gridline
~ $30,000 Difference
SESSustainable Energy Solutions, L.L.C.
A Dollar Not Spent on Energyis a
Dollar of Increased Profit

SESSustainable Energy Solutions, L.L.C.
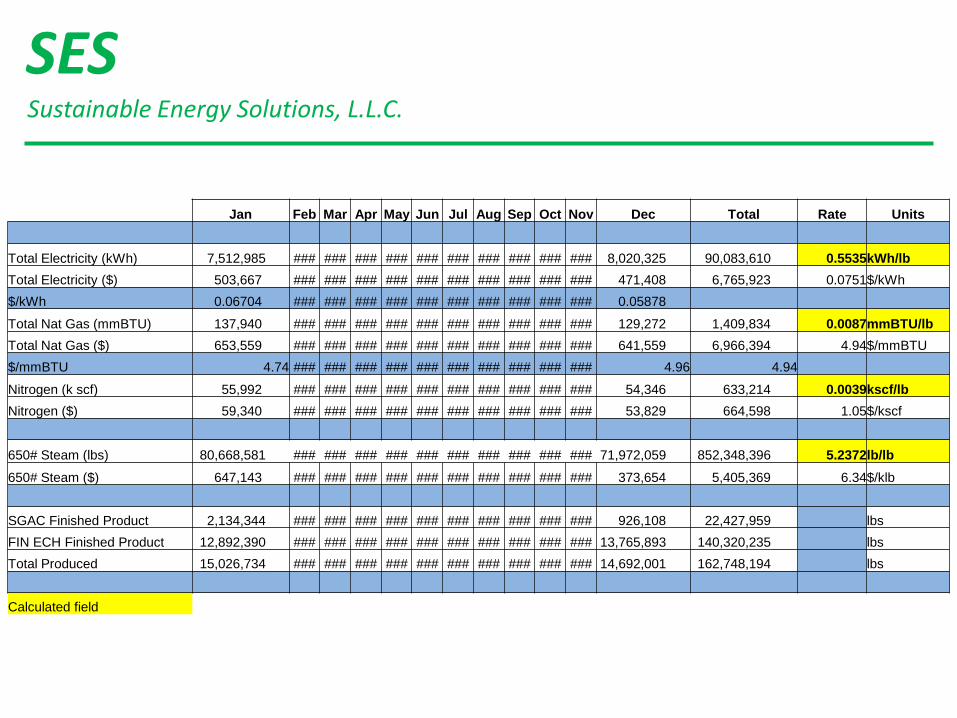
Compute Energy Costs per Unit of Product
• Assists in understanding manufacturing costs
• Can reveal opportunities for improvements
• Energy Conservation Measures (ECM)
• Use the data compiled for developing the trends
• Annually, Monthly, Continuous
SESSustainable Energy Solutions, L.L.C.
Jan Feb Mar Apr May Jun Jul Aug Sep Oct Nov Dec Total Rate Units
Total Electricity (kWh) 7,512,985 ### ### ### ### ### ### ### ### ### ### 8,020,325 90,083,610 0.5535kWh/lb
Total Electricity ($) 503,667 ### ### ### ### ### ### ### ### ### ### 471,408 6,765,923 0.0751$/kWh
$/kWh 0.06704 ### ### ### ### ### ### ### ### ### ### 0.05878
Total Nat Gas (mmBTU) 137,940 ### ### ### ### ### ### ### ### ### ### 129,272 1,409,834 0.0087mmBTU/lb
Total Nat Gas ($) 653,559 ### ### ### ### ### ### ### ### ### ### 641,559 6,966,394 4.94$/mmBTU
$/mmBTU 4.74 ### ### ### ### ### ### ### ### ### ### 4.96 4.94
Nitrogen (k scf) 55,992 ### ### ### ### ### ### ### ### ### ### 54,346 633,214 0.0039kscf/lb
Nitrogen ($) 59,340 ### ### ### ### ### ### ### ### ### ### 53,829 664,598 1.05$/kscf
650# Steam (lbs) 80,668,581 ### ### ### ### ### ### ### ### ### ### 71,972,059 852,348,396 5.2372lb/lb
650# Steam ($) 647,143 ### ### ### ### ### ### ### ### ### ### 373,654 5,405,369 6.34$/klb
SGAC Finished Product 2,134,344 ### ### ### ### ### ### ### ### ### ### 926,108 22,427,959 lbs
FIN ECH Finished Product 12,892,390 ### ### ### ### ### ### ### ### ### ### 13,765,893 140,320,235 lbs
Total Produced 15,026,734 ### ### ### ### ### ### ### ### ### ### 14,692,001 162,748,194 lbs
Calculated field
SESSustainable Energy Solutions, L.L.C.
Evaluate Utility Supply Options
• Change tariff
• Revise contract terms
• Aggregate multiple supplies
• Negotiate refund for errors
• Data miscalculations
• Sales tax
SESSustainable Energy Solutions, L.L.C.
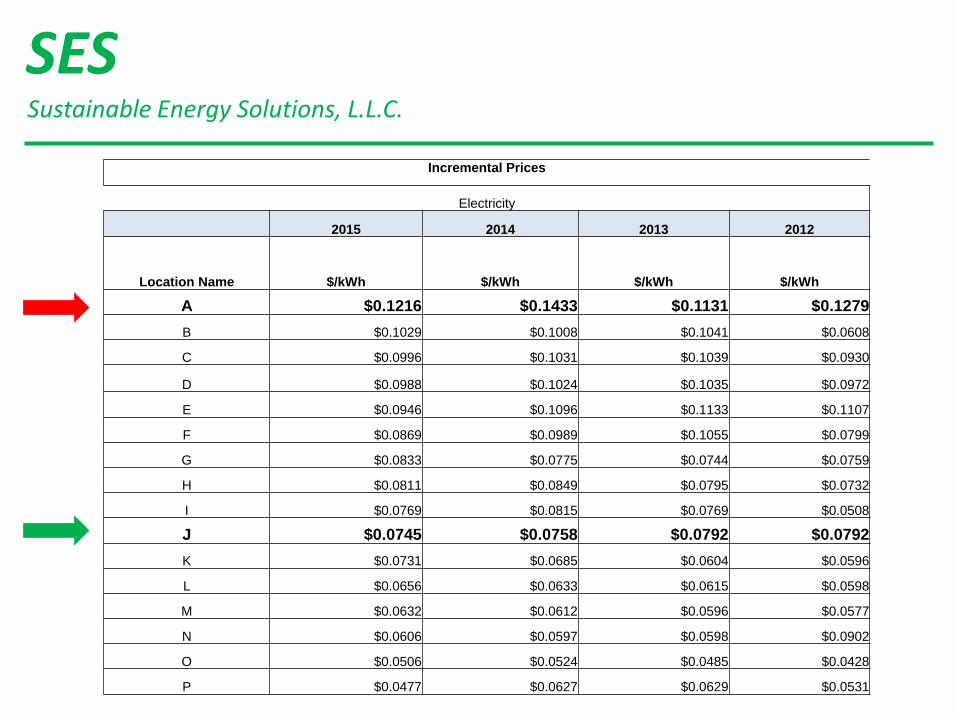
Incremental Prices
Electricity
2015 2014 2013 2012
Location Name $/kWh $/kWh $/kWh $/kWh
A $0.1216 $0.1433 $0.1131 $0.1279
B $0.1029 $0.1008 $0.1041 $0.0608
C $0.0996 $0.1031 $0.1039 $0.0930
D $0.0988 $0.1024 $0.1035 $0.0972
E $0.0946 $0.1096 $0.1133 $0.1107
F $0.0869 $0.0989 $0.1055 $0.0799
G $0.0833 $0.0775 $0.0744 $0.0759
H $0.0811 $0.0849 $0.0795 $0.0732
I $0.0769 $0.0815 $0.0769 $0.0508
J $0.0745 $0.0758 $0.0792 $0.0792
K $0.0731 $0.0685 $0.0604 $0.0596
L $0.0656 $0.0633 $0.0615 $0.0598
M $0.0632 $0.0612 $0.0596 $0.0577
N $0.0606 $0.0597 $0.0598 $0.0902
O $0.0506 $0.0524 $0.0485 $0.0428
P $0.0477 $0.0627 $0.0629 $0.0531
SESSustainable Energy Solutions, L.L.C.
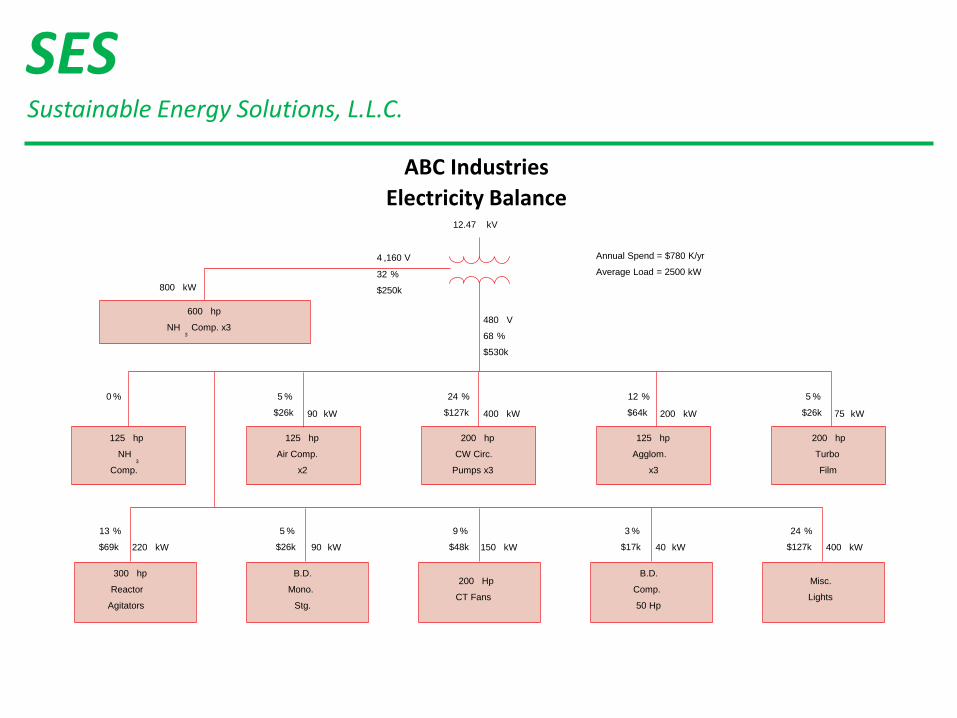
Develop Utility Balances
• Begin with spend and units consumed
• Brainstorm consumers
• Estimate loads
• Apply % estimates to spend and units
SESSustainable Energy Solutions, L.L.C.
Annual Spend = $780 K/yr
Average Load = 2500 kW
12.47 kV
4 ,160 V
32 %
$250k
480 V
68 %
$530k
kW800
600 hp
NH3
Comp. x3
hp125
NH3
Comp.
hp125
Air Comp.
x2
200 hp
CW Circ.
Pumps x3
125 hp
Agglom.
x3
200 hp
Turbo
Film
300 hp
Reactor
Agitators
B.D.
Mono.
Stg.
200 Hp
CT Fans
B.D.
Comp.
50 Hp
Misc.
Lights
%0 %24
$127k 400 kW
%12
$64k 200 kW
%5
$26k kW75
24 %
$127k kW400
%3
$17k 40 kW
9 %
$48k 150 kW
%5
$26k 90 kW
%13
$69k 220 kW
%5
$26k 90 kW
ABC Industries
Electricity Balance
SESSustainable Energy Solutions, L.L.C.
SESSustainable Energy Solutions, L.L.C.
SESSustainable Energy Solutions, L.L.C.
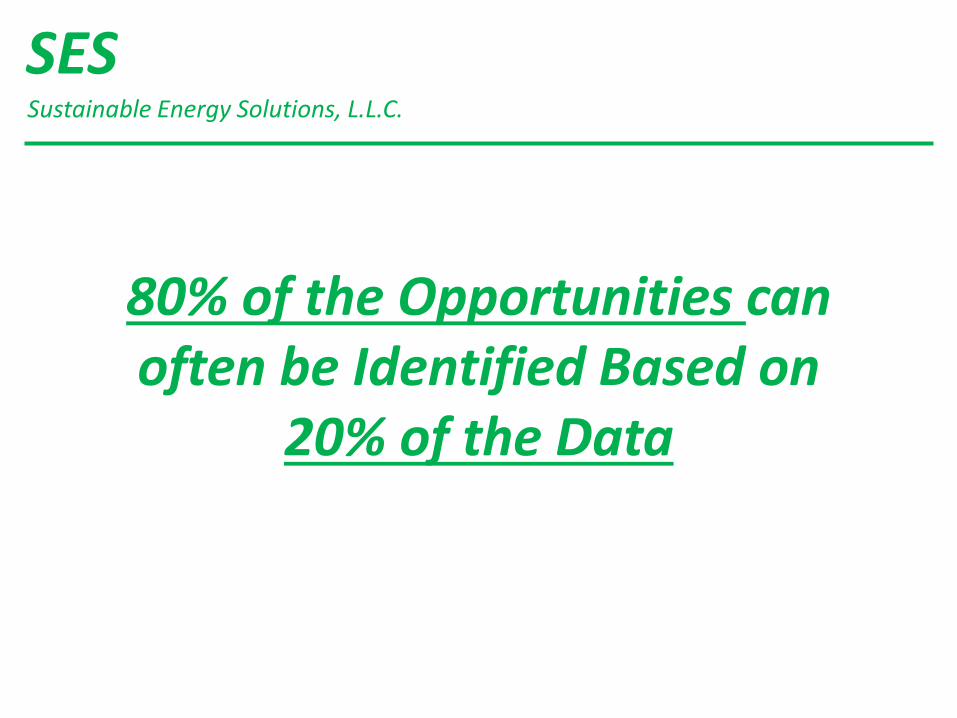
80% of the Opportunities can often be Identified Based on
20% of the Data
SESSustainable Energy Solutions, L.L.C.
Review Past ECMs that were Not Implemented for Opportunity
• Previous assessment reports
• Recommendations may have been confusing
• Personnel change left items unaddressed
• Dust these off and apply current economics
SESSustainable Energy Solutions, L.L.C.
Select Assessment Team Members
• Core representatives from:
• Utilities
• Production
• Maintenance
• Hands-On
• Supplier representatives
• Occasional representatives
SESSustainable Energy Solutions, L.L.C.
Develop a Detailed Assessment Schedule
• Review:
• Trend Plots
• Incremental Prices
• Develop energy balance
• Discuss operating schedules and activities
• How to look for opportunities
• Idea collection
SESSustainable Energy Solutions, L.L.C.
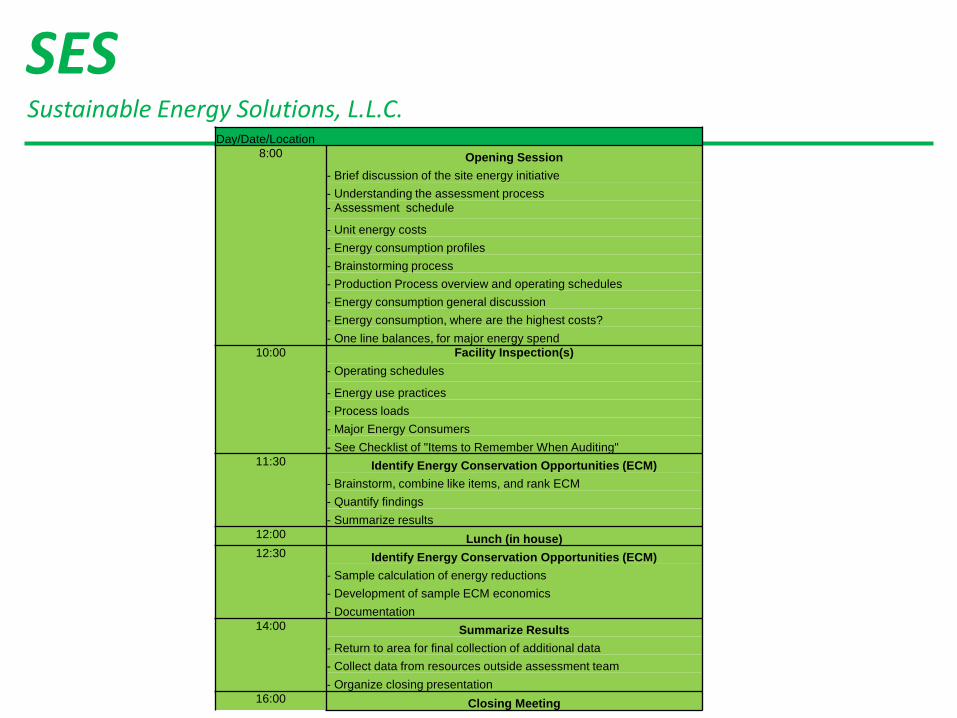
Day/Date/Location
8:00 Opening Session
- Brief discussion of the site energy initiative
- Understanding the assessment process
- Assessment schedule
- Unit energy costs
- Energy consumption profiles
- Brainstorming process
- Production Process overview and operating schedules
- Energy consumption general discussion
- Energy consumption, where are the highest costs?
- One line balances, for major energy spend
10:00 Facility Inspection(s)
- Operating schedules
- Energy use practices
- Process loads
- Major Energy Consumers
- See Checklist of "Items to Remember When Auditing"
11:30 Identify Energy Conservation Opportunities (ECM)
- Brainstorm, combine like items, and rank ECM
- Quantify findings
- Summarize results
12:00 Lunch (in house)
12:30 Identify Energy Conservation Opportunities (ECM)
- Sample calculation of energy reductions
- Development of sample ECM economics
- Documentation
14:00 Summarize Results
- Return to area for final collection of additional data
- Collect data from resources outside assessment team
- Organize closing presentation
16:00 Closing Meeting
SESSustainable Energy Solutions, L.L.C.
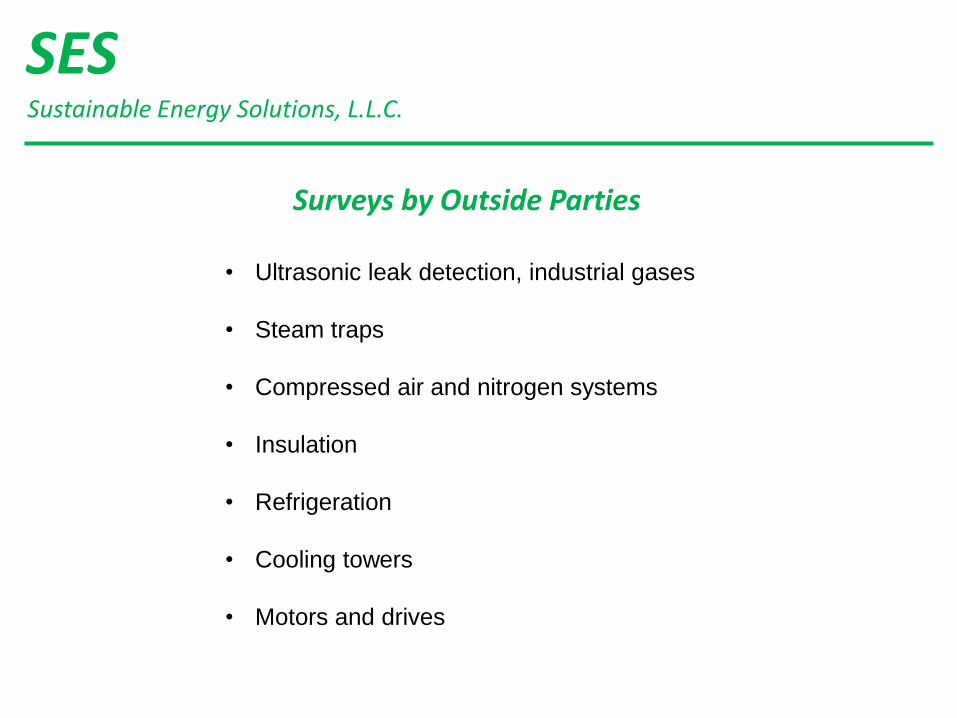
Surveys by Outside Parties
• Ultrasonic leak detection, industrial gases
• Steam traps
• Compressed air and nitrogen systems
• Insulation
• Refrigeration
• Cooling towers
• Motors and drives
SESSustainable Energy Solutions, L.L.C.
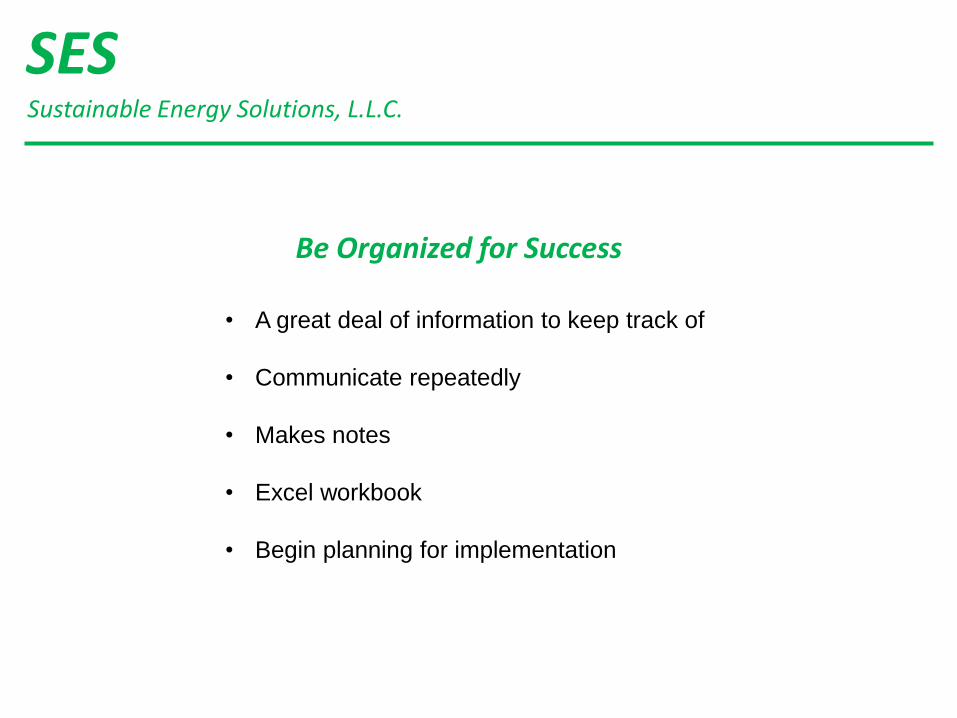
Be Organized for Success
• A great deal of information to keep track of
• Communicate repeatedly
• Makes notes
• Excel workbook
• Begin planning for implementation
SESSustainable Energy Solutions, L.L.C.
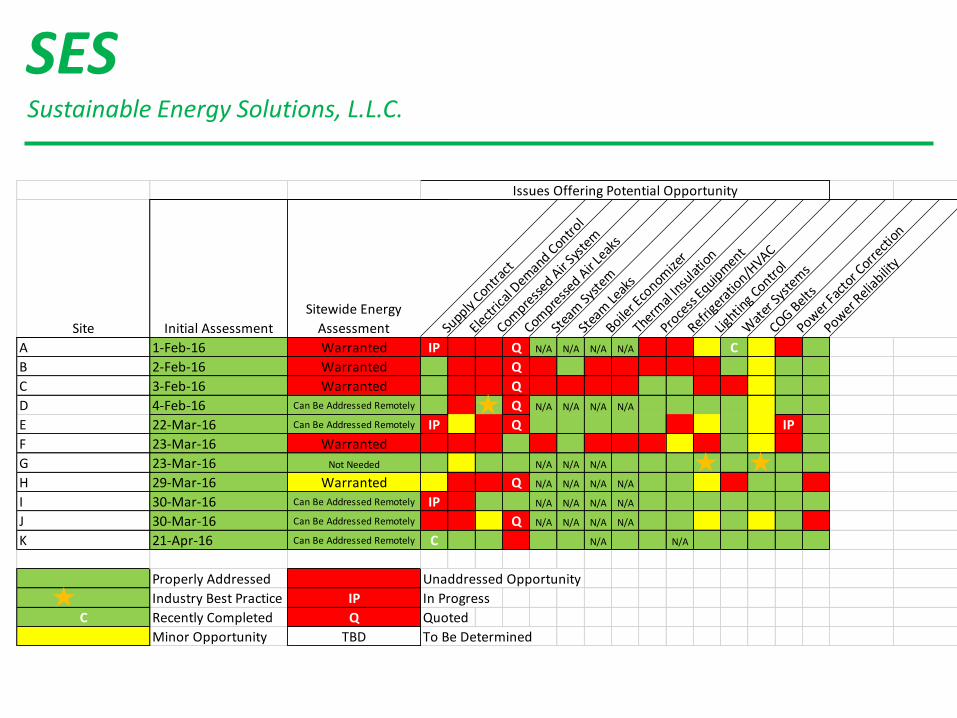
Issues Offering Potential Opportunity
Site Initial Assessment
Sitewide Energy
Assessment Supply
Contract
Elect
rical
Demand C
ontrol
Compre
ssed A
ir Sys
tem
Compre
ssed A
ir Le
aks
Stea
m Sy
stem
Stea
m Le
aks
Boiler E
conom
izer
Thermal
Insu
latio
n
Proce
ss E
quipm
ent
Refrigera
tion/H
VAC
Lightin
g Contro
l
Wat
er Sy
stem
s
COG Belts
Power F
acto
r Corr
ectio
n
Power R
eliabilit
y
A 1-Feb-16 Warranted IP Q N/A N/A N/A N/A C
B 2-Feb-16 Warranted Q
C 3-Feb-16 Warranted Q
D 4-Feb-16 Can Be Addressed Remotely Q N/A N/A N/A N/A
E 22-Mar-16 Can Be Addressed Remotely IP Q IP
F 23-Mar-16 Warranted
G 23-Mar-16 Not Needed N/A N/A N/A
H 29-Mar-16 Warranted Q N/A N/A N/A N/A
I 30-Mar-16 Can Be Addressed Remotely IP N/A N/A N/A N/A
J 30-Mar-16 Can Be Addressed Remotely Q N/A N/A N/A N/A
K 21-Apr-16 Can Be Addressed Remotely C N/A N/A
Properly Addressed Unaddressed Opportunity
Industry Best Practice IP In Progress
C Recently Completed Q Quoted
Minor Opportunity TBD To Be Determined

SESSustainable Energy Solutions, L.L.C.
Any Questions?
Thank you for you attention!
For more information please contact:
Tom Theising, C.E.M., C.D.S.M.
970-709-6389
Managing PEOPLE, Managing
ENERGY
Facility and Energy Management Solutions
Fred Schoeneborn, CEM
FCS Consulting Services, Inc.
IETC - 2016 New Orleans – May 24, 2016
Facility and Energy Management Solutions
WII –FM
Human-Nature Radio Station
Facility and Energy Management Solutions
Fred Schoeneborn, CEM
• President, FCS Consulting Services, Inc.
• 38-year career with Mobil Oil -- Global Energy
Manager – Reported to 2 CEOs
• Worked in Mobil Oil Headquarters
• Mobil Energy Program Won 1 DOE & 3 EPA
Awards
• Provides consultancy to Major Corporations
• Member of the Industrial Energy Technology
Conference Advisory Board
Facility and Energy Management Solutions
Agenda
• Why & How do companies join “outside” Energy
Efficiency Efforts ?
• What Benefits / Risks do companies see in
working with “outside” energy efforts ?
• What can YOU do to enhance participation ?
Facility and Energy Management Solutions
Why Companies join --
• Companies focus on $ generation, always the next
quarter (Reason for being) ----– EE not at the table.
• It takes a Wake – Up call - to see the EE message.
• Mobil – Business Week benchmarking showed cost
per employee, compared to Oil Majors
• GM – On the brink of Bankruptcy
• Exxon – Merger with Mobil
Facility and Energy Management Solutions
How Companies join - Concerns
• What are OTHERS doing?
• Can we achieve the results, we signed up for?
• “Voluntary” is OK, but we still made a commitment.
• “Legal issue” by sharing with industry
• PR can become negative PR
Core corporate axiom of an
Energy Program
Energy Costs are Controllable
They should be managed with the
same expertise and passion used to
manage other parts of the business
Facility and Energy Management Solutions
Facility and Energy Management Solutions
DuPont Energy Efficiency Axiom
“There is no growth product we
know that will give us the same
return as:
Energy Reduction”
Facility and Energy Management Solutions
Celanese Energy Efficiency Axiom
“In today's business climate,
commitment to sustainable energy
reduction is critical to sustained
operations.”
Facility and Energy Management Solutions
ArcelorMittal Energy Efficiency Axiom
“ The most important element in the effort
to get projects done may not be $ or
resources,
IT IS THE Desire to make it happen”
Facility and Energy Management Solutions
Nissan Energy Efficiency Axiom
“Energy Efficiency is all about
reducing WASTE ---and WASTE ls
anything that we can not sell”
Facility and Energy Management Solutions
Five Key factors while developing a program
(from The Eastman corporate program)
• Measurement.
• Thinking outside the box.
• Maintain momentum.
• Leveraging relationships.
• Maintaining the gain.

Facility and Energy Management Solutions
Why Companies Engage - Benefits
• Visionary - Leader Image, Stewardship, Part of
industry, Award recipient
• Network of peer contacts, What are competitors
doing, Where do we stand?
• Sustainability, Cost control
• Ability to reach government decision - makers-
potential new contracts
.
Facility and Energy Management Solutions
Why Companies Engage - Benefits
• Network with other energy managers
• Career development – “just in case”
• “Real – world” energy training
• R&D opportunities, not found at companies
• Recognition and awards, PR opportunities
Facility and Energy Management Solutions
Why Companies Engage - Concerns
• We now have a competitive advantage- But ..--
• What will participation cost?
• Is this another “Flavor of the month” Program?
-- Is it an Ego-trip for program owner?
• What if we don’t reach goals of program?
• Do we have the staff? Are savings real?
Facility and Energy Management Solutions
How can you enhance participation?
• Always lead with $ benefits - Not features when
selling. Avoid Tech Jargon !
• Use One-Pagers !! To make a point.
• Speak the language of the company—
Production unit equivalent or $ (not BTUs)
• Leave behind a physical “Info give –away”.
• Avoid committee settings – do “one on ones”
Facility and Energy Management Solutions
How can you enhance participation?
• Provide pass-along papers to their management.
• Show enthusiasm !!
• Prepare an “elevator speech” for all levels in the
organization.
• Remember they are NOT an Energy Efficiency
company – Value their time
Facility and Energy Management Solutions
How can you enhance participation?
• Share real experiences
• Show your pedigree. Management wants to see it.
• Teach measuring opportunities - baselining.
• Energy is a-political in the corporate politics.
• TRAINING Is welcome in today’s companies
Facility and Energy Management Solutions
Three Big Tips
• Remember, the limited time you fight for with
senior management – “Thank you for your time”
• Communication / marketing / selling – your
biggest challenge. Teach the energy manager how
to sell your ideas – they all have managers.
• CCs are the target – hidden - audience of a memo.
Facility and Energy Management Solutions
Implementation The Discipline of getting things DONE
“Everything depends on Execution ---
Having just a Vision is no Solution”
Facility and Energy Management Solutions
Thank you

Decreased Production Leads to
Energy Efficiency Opportunities
Sharon Nolen, P.E., CEM
Manager, Worldwide Energy Program
A global specialty chemical company headquartered in
Kingsport, Tennessee
Approximately 15,000 employees and 50 manufacturing sites
around the globe
Serving customers in approximately 100 countries
A company dedicated to environmental stewardship, social
responsibility and economic growth
2016 ENERGY STAR® Partner of the Year Sustained Excellence
2016 Ethisphere’s World’s Most Ethical® Companies
2016 Glassdoor Employees’ Choice Best Places to Work (# 11)
2015 revenue of $9.6 billion
Who we are
2
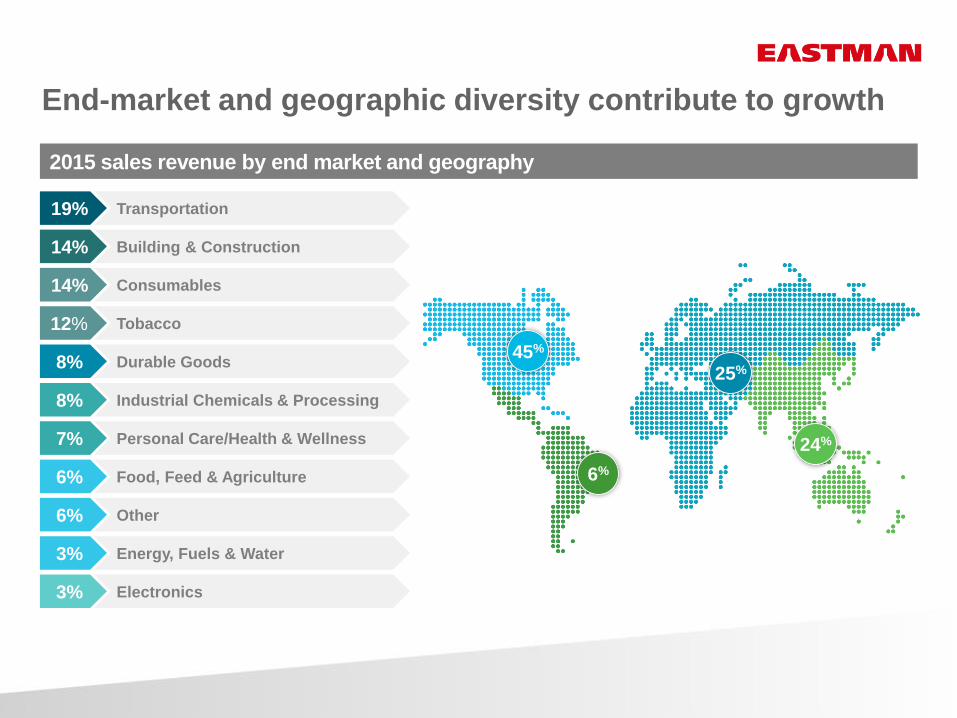
End-market and geographic diversity contribute to growth
2015 sales revenue by end market and geography
Electronics
Energy, Fuels & Water
Other
Food, Feed & Agriculture
Personal Care/Health & Wellness
Industrial Chemicals & Processing
Durable Goods
Tobacco
Consumables
Building & Construction
Transportation
3%
3%
6%
6%
7%
8%
8%
12%
14%
14%
19%
45%
24%
25%
6%
Eastman’s energy management program
Eastman Chemical Company started in Kingsport, TN in 1920
This plant (now one of the largest chemical manufacturing sites in North America) began operating its first CHP system in the 1920’s
Eastman has a long history of incorporating energy efficiency in operations including site initiatives, sub-metering, training, and energy projects
In 2010, the company set an ambitious public goal through the DOE Better Building, Better Plants program that caused a complete revamp of the worldwide energy program
An Executive Level Steering Team was formed under the Sustainability Council and became the Design and Natural Resources Sub-council.
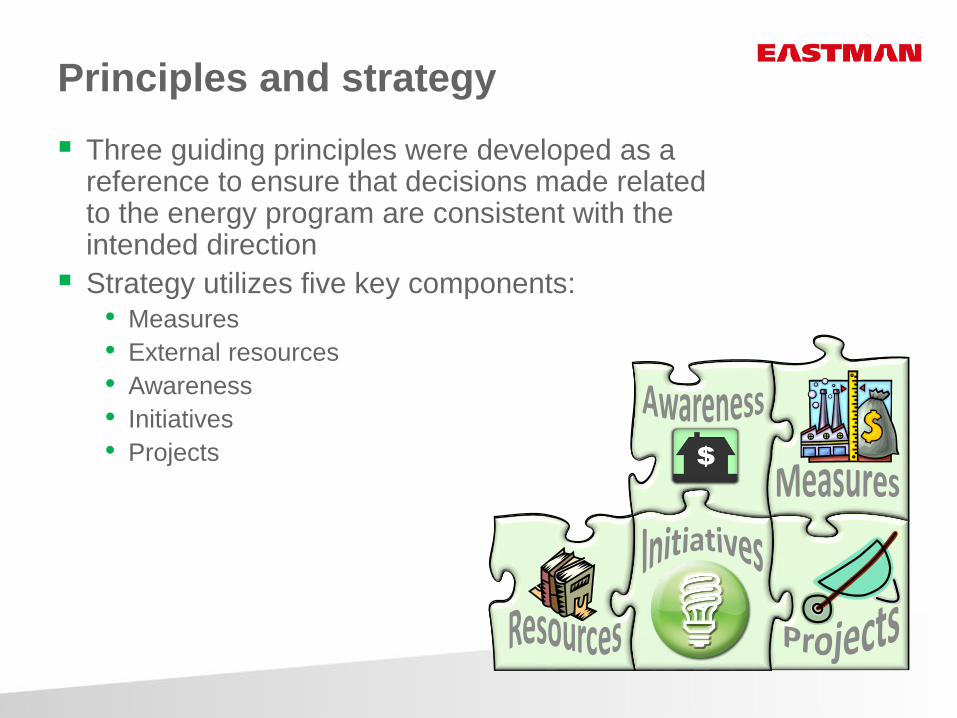
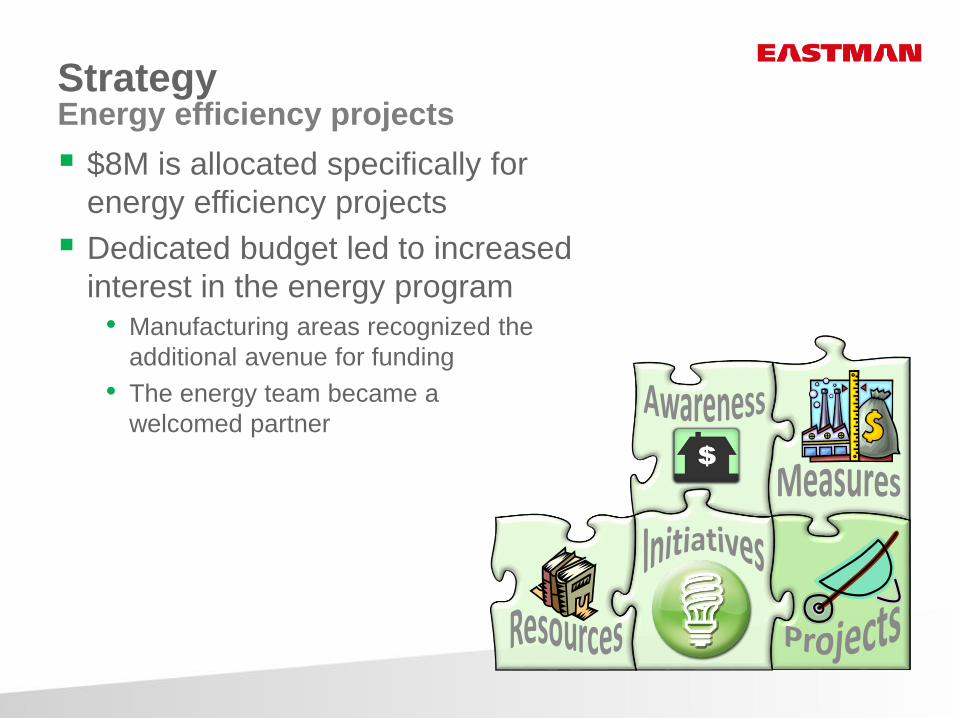
Principles and strategy
Three guiding principles were developed as a reference to ensure that decisions made related to the energy program are consistent with the intended direction
Strategy utilizes five key components:
• Measures
• External resources
• Awareness
• Initiatives
• Projects
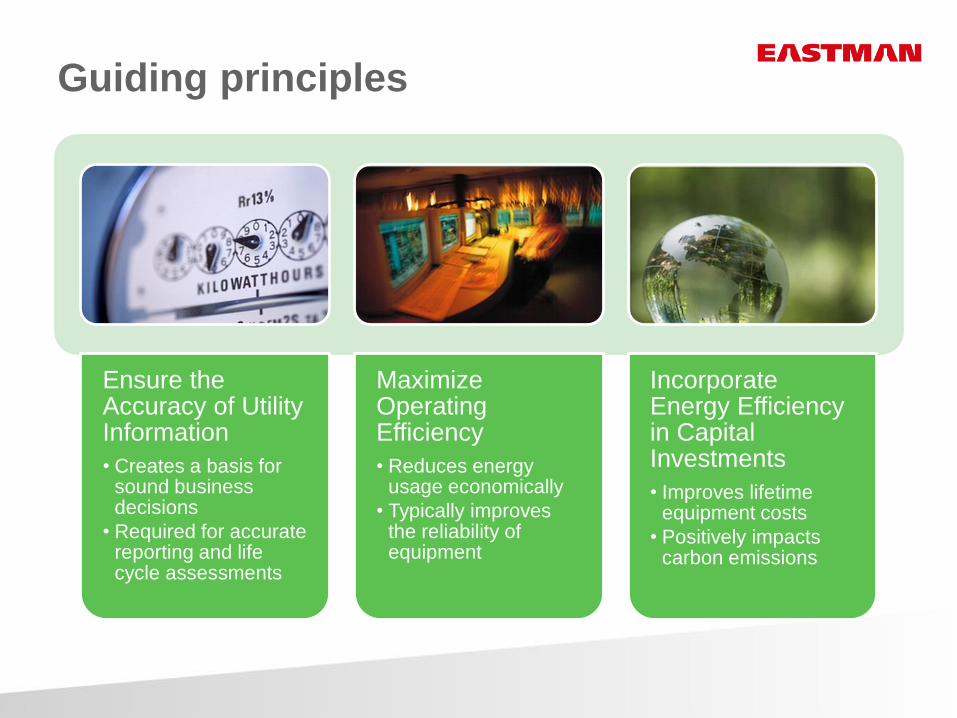
Guiding principles
Ensure the Accuracy of Utility Information
• Creates a basis for sound business decisions
• Required for accurate reporting and life cycle assessments
Maximize Operating Efficiency
• Reduces energy usage economically
• Typically improves the reliability of equipment
Incorporate Energy Efficiency in Capital Investments
• Improves lifetime equipment costs
• Positively impacts carbon emissions
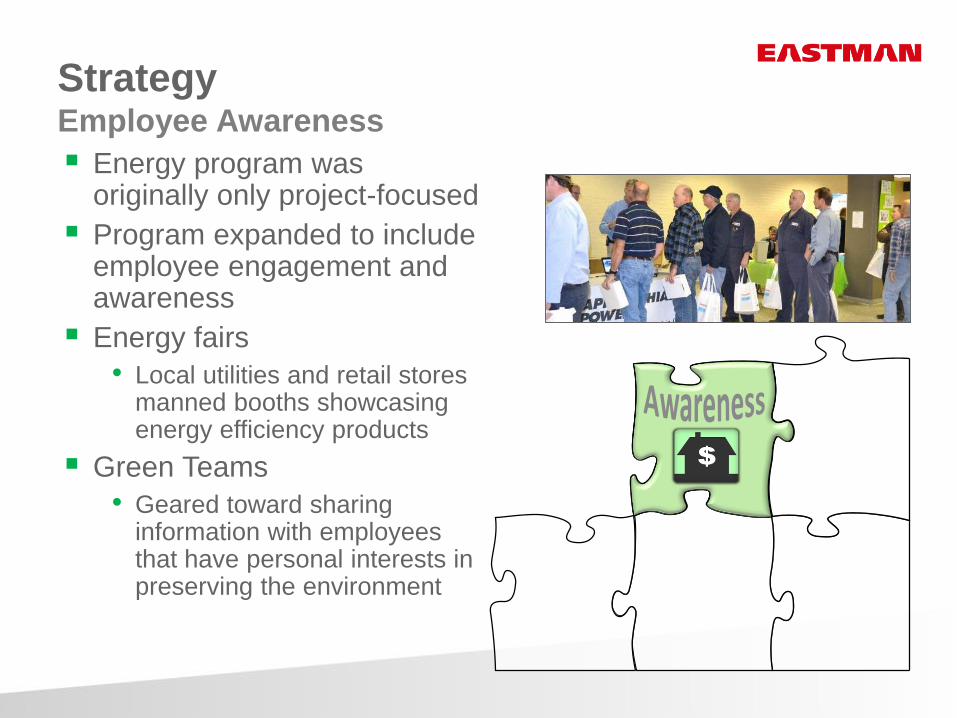
StrategyEmployee Awareness
Energy program was originally only project-focused
Program expanded to include employee engagement and awareness
Energy fairs
• Local utilities and retail stores manned booths showcasing energy efficiency products
Green Teams
• Geared toward sharing information with employees that have personal interests in preserving the environment
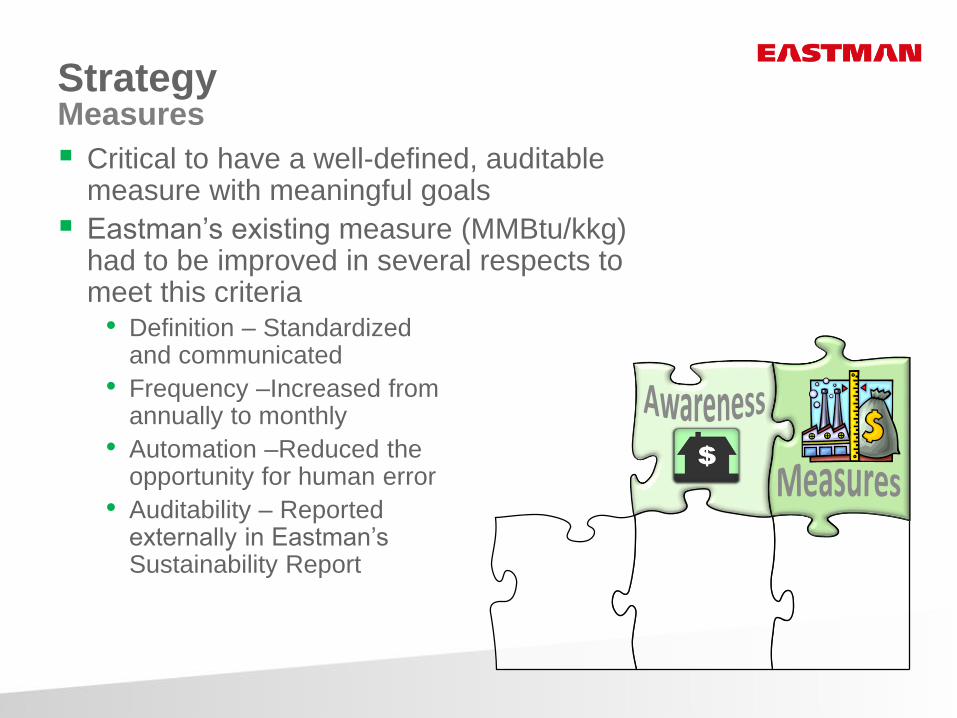
Strategy
Critical to have a well-defined, auditable measure with meaningful goals
Eastman’s existing measure (MMBtu/kkg) had to be improved in several respects to meet this criteria
• Definition – Standardized and communicated
• Frequency –Increased from annually to monthly
• Automation –Reduced the opportunity for human error
• Auditability – Reported externally in Eastman’s Sustainability Report
Measures
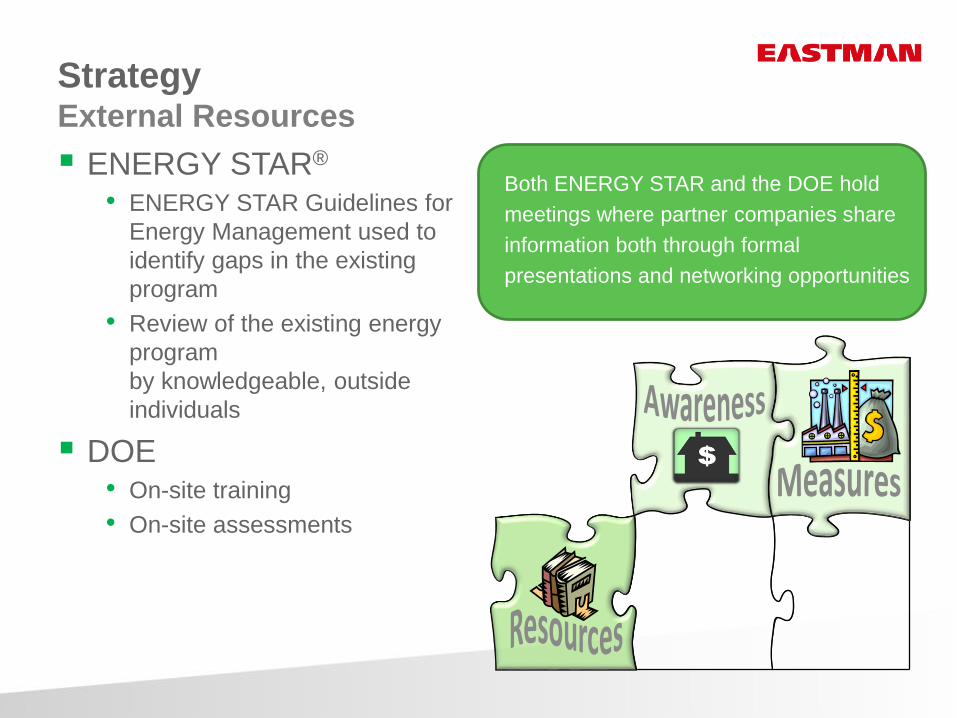
Strategy External Resources
ENERGY STAR®
• ENERGY STAR Guidelines for
Energy Management used to
identify gaps in the existing
program
• Review of the existing energy
program
by knowledgeable, outside
individuals
DOE• On-site training
• On-site assessments
Both ENERGY STAR and the DOE hold
meetings where partner companies share
information both through formal
presentations and networking opportunities
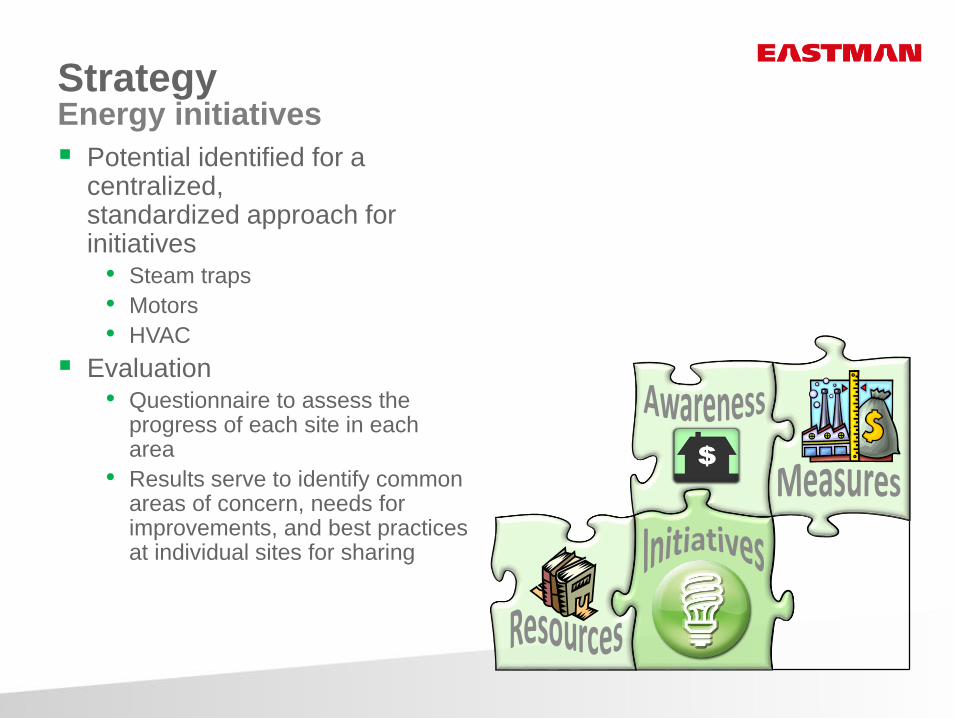
Strategy
Potential identified for a centralized, standardized approach for initiatives
• Steam traps
• Motors
• HVAC
Evaluation• Questionnaire to assess the
progress of each site in each area
• Results serve to identify common areas of concern, needs for improvements, and best practices at individual sites for sharing
Energy initiatives
Strategy
$8M is allocated specifically for
energy efficiency projects
Dedicated budget led to increased
interest in the energy program
• Manufacturing areas recognized the
additional avenue for funding
• The energy team became a
welcomed partner
Energy efficiency projects
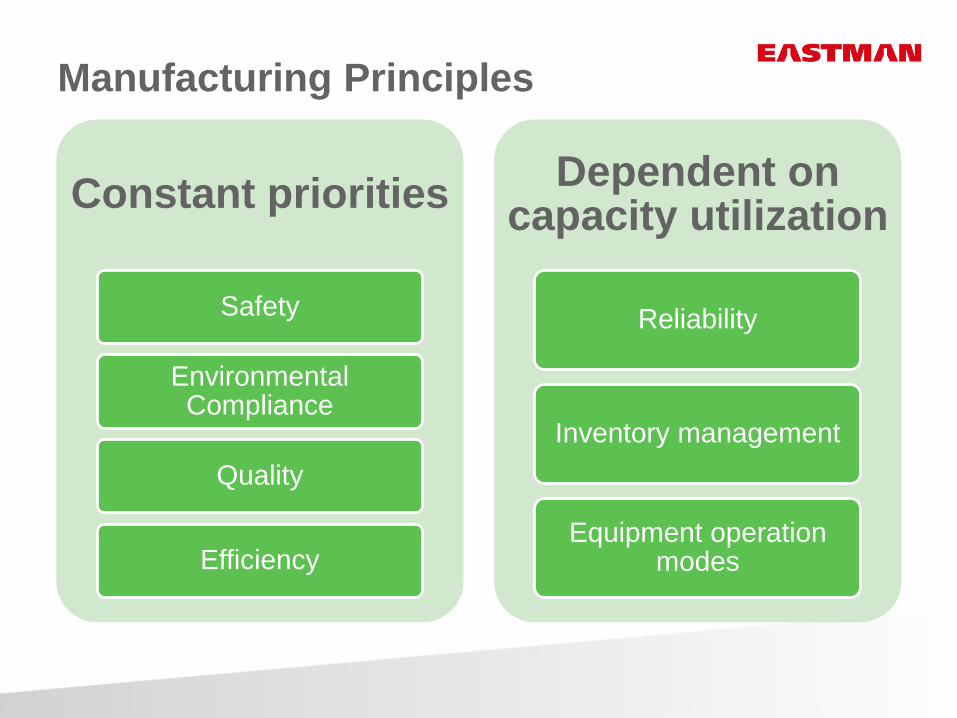
Manufacturing Principles
Constant priorities
Safety
Environmental Compliance
Quality
Efficiency
Dependent on capacity utilization
Reliability
Inventory management
Equipment operation modes
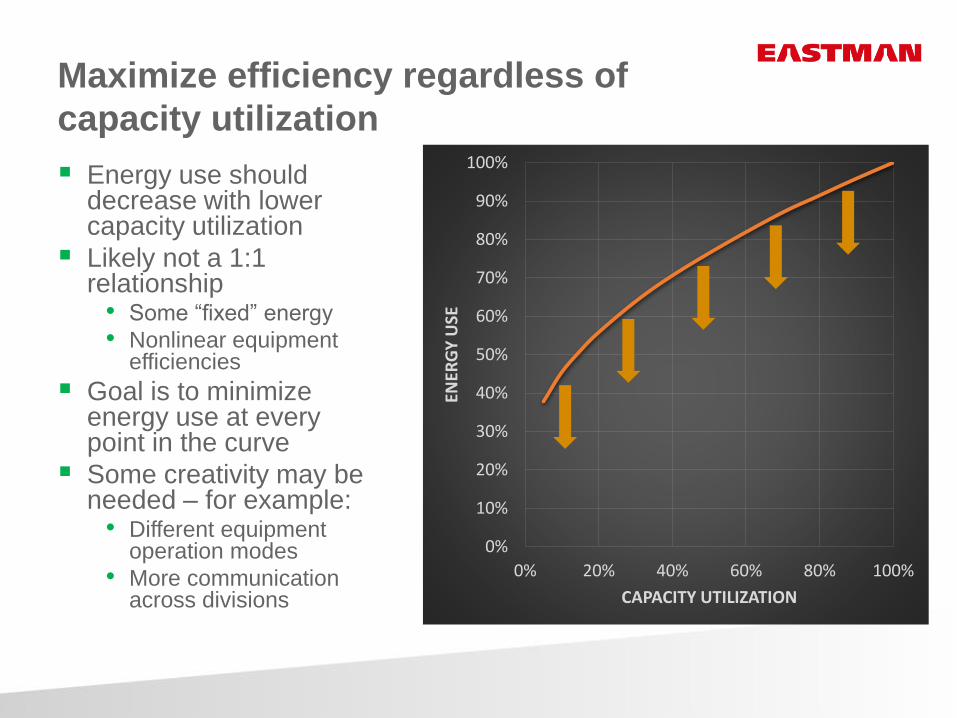
Maximize efficiency regardless of
capacity utilization
Energy use should decrease with lower capacity utilization
Likely not a 1:1 relationship
• Some “fixed” energy
• Nonlinear equipment efficiencies
Goal is to minimize energy use at every point in the curve
Some creativity may be needed – for example:
• Different equipment operation modes
• More communication across divisions
0%
10%
20%
30%
40%
50%
60%
70%
80%
90%
100%
0% 20% 40% 60% 80% 100%
ENER
GY
USE
CAPACITY UTILIZATION
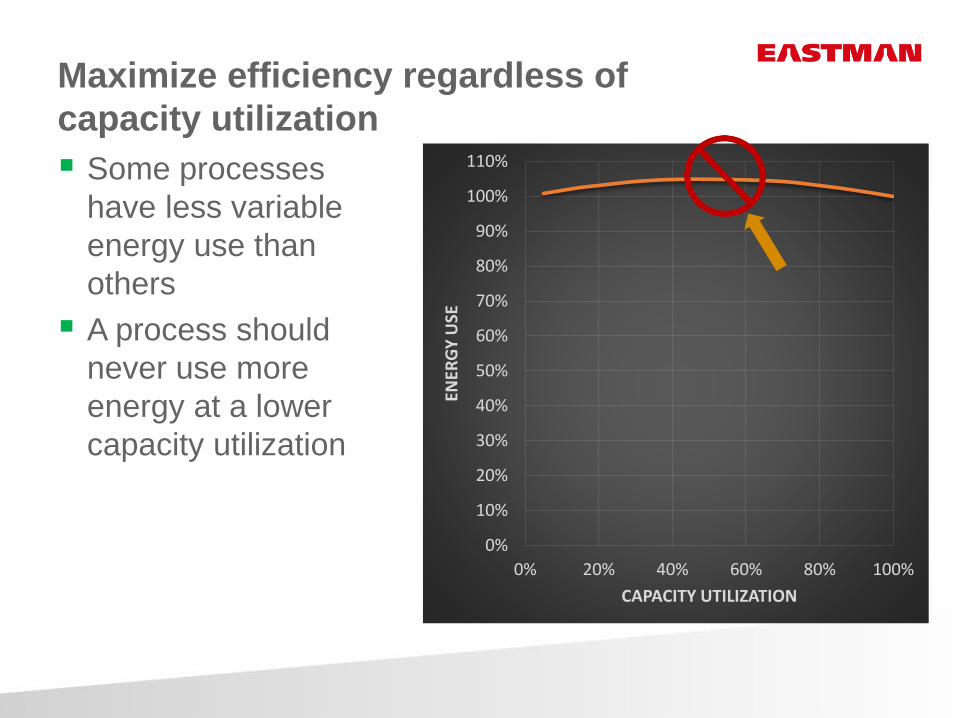
Maximize efficiency regardless of
capacity utilization
Some processes
have less variable
energy use than
others
A process should
never use more
energy at a lower
capacity utilization
0%
10%
20%
30%
40%
50%
60%
70%
80%
90%
100%
110%
0% 20% 40% 60% 80% 100%
ENER
GY
USE
CAPACITY UTILIZATION
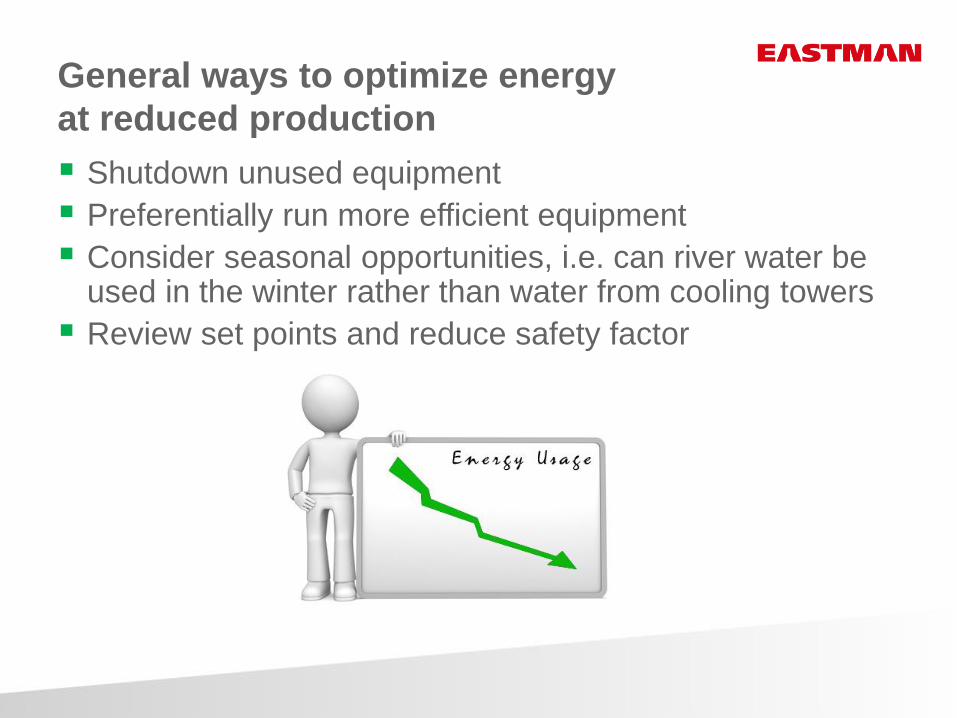
General ways to optimize energy
at reduced production
Shutdown unused equipment
Preferentially run more efficient equipment
Consider seasonal opportunities, i.e. can river water be used in the winter rather than water from cooling towers
Review set points and reduce safety factor

ExamplesProduction campaignsReliability adjustments
Equipment optimization
Background
• Higher production rates generate higher yields for the
hydroquinone (HQ) process
• Yield and conversion costs may be optimized by running at
maximum production rates
Problem
• Existing operating strategy of maintaining slower rates (when not
sold out) to meet demand led to inefficient operation
HQ campaign strategyProject description
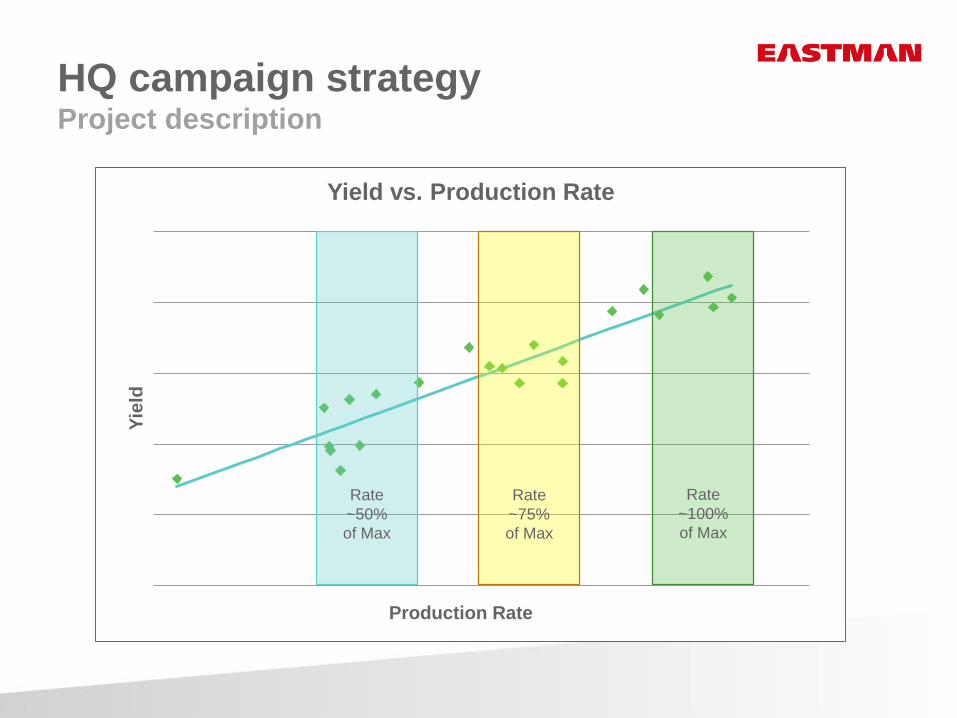
HQ campaign strategyProject description
Yie
ld
Production Rate
Yield vs. Production Rate
Rate
~100%
of Max
Rate
~75%
of Max
Rate
~50%
of Max
Project Constraints• Minimum length of shutdown for full financial benefit: 4 weeks
• Maximum acceptable yearend inventory: 2M kg
• Maximum acceptable inventory at any one time: 2.5M kg
• Latest possible shutdown to avoid winterization concerns: November
Campaign Strategy (while the HQ plant is not sold out)
• Maximize production rates while running and build inventory
• Take extended shutdowns to control inventory to acceptable levels
HQ campaign strategyProject description
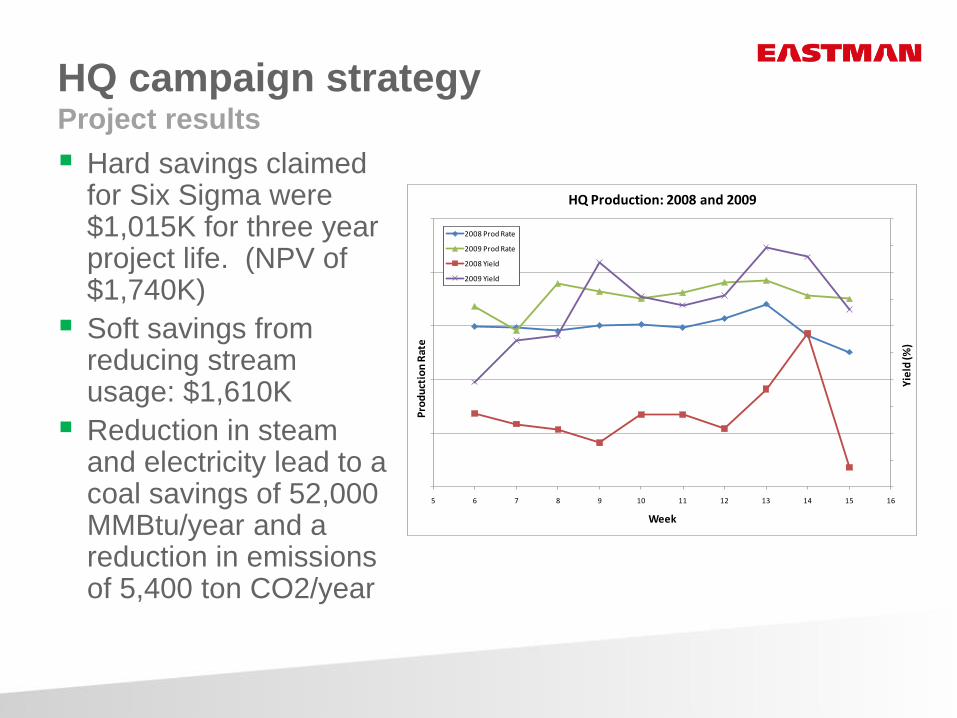
Hard savings claimed for Six Sigma were $1,015K for three year project life. (NPV of $1,740K)
Soft savings from reducing stream usage: $1,610K
Reduction in steam and electricity lead to a coal savings of 52,000 MMBtu/year and a reduction in emissions of 5,400 ton CO2/year
5 6 7 8 9 10 11 12 13 14 15 16
Yie
ld (%
)
Pro
du
ctio
n R
ate
Week
HQ Production: 2008 and 2009
2008 Prod Rate
2009 Prod Rate
2008 Yield
2009 Yield
HQ campaign strategyProject results
ExamplesProduction campaigns
Reliability adjustmentsEquipment optimization
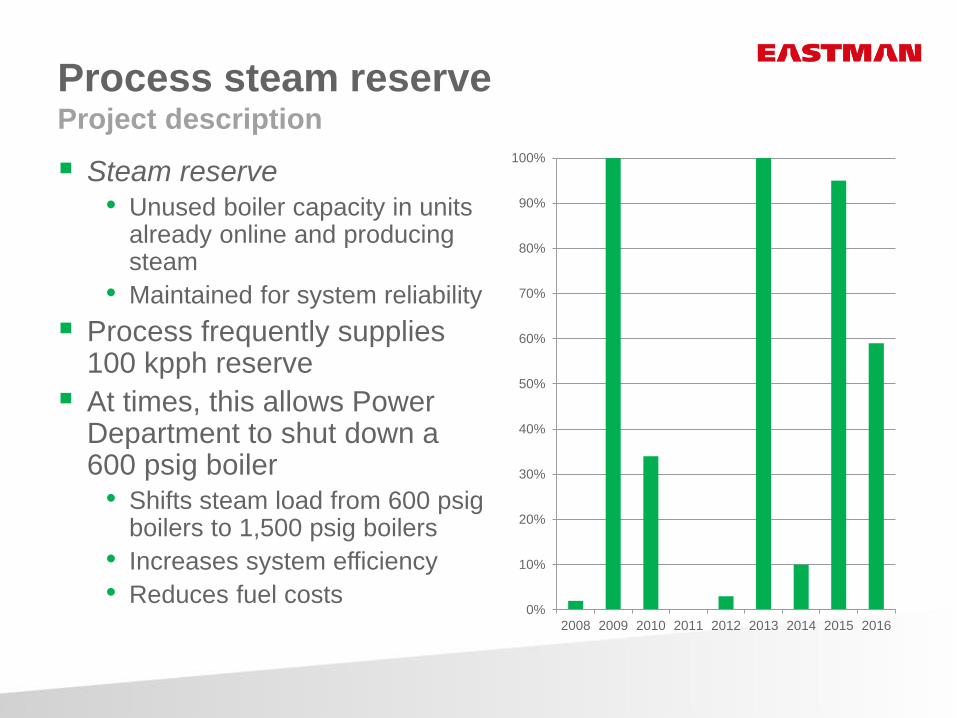
Steam reserve
• Unused boiler capacity in units already online and producing steam
• Maintained for system reliability
Process frequently supplies 100 kpph reserve
At times, this allows Power Department to shut down a 600 psig boiler
• Shifts steam load from 600 psig boilers to 1,500 psig boilers
• Increases system efficiency
• Reduces fuel costs0%
10%
20%
30%
40%
50%
60%
70%
80%
90%
100%
2008 2009 2010 2011 2012 2013 2014 2015 2016
Process steam reserveProject description
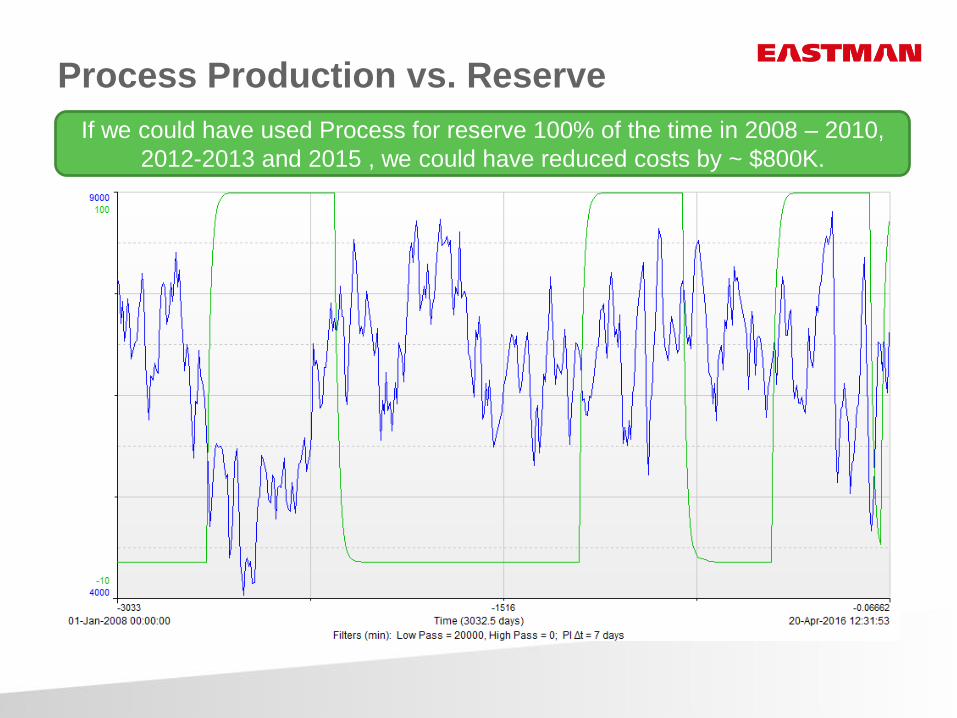
Process Production vs. Reserve
If we could have used Process for reserve 100% of the time in 2008 – 2010,
2012-2013 and 2015 , we could have reduced costs by ~ $800K.

ExamplesProduction campaigns
Reliability adjustments
Equipment optimization

Background
• Manufacturing area requires a very large flow of compressed air
for manufacturing
• Dedicated, complex system of many compressors
• Blend of turbine and motor drives
Problem
• Air demand fluctuates with production
• Difficult to define the optimum operating strategy given:
Constraints of the individual compressors
Individual compressor efficiencies
Impacts of compressor drives on cogeneration system efficiency
and steam / electric balance
Equipment optimizationProject description
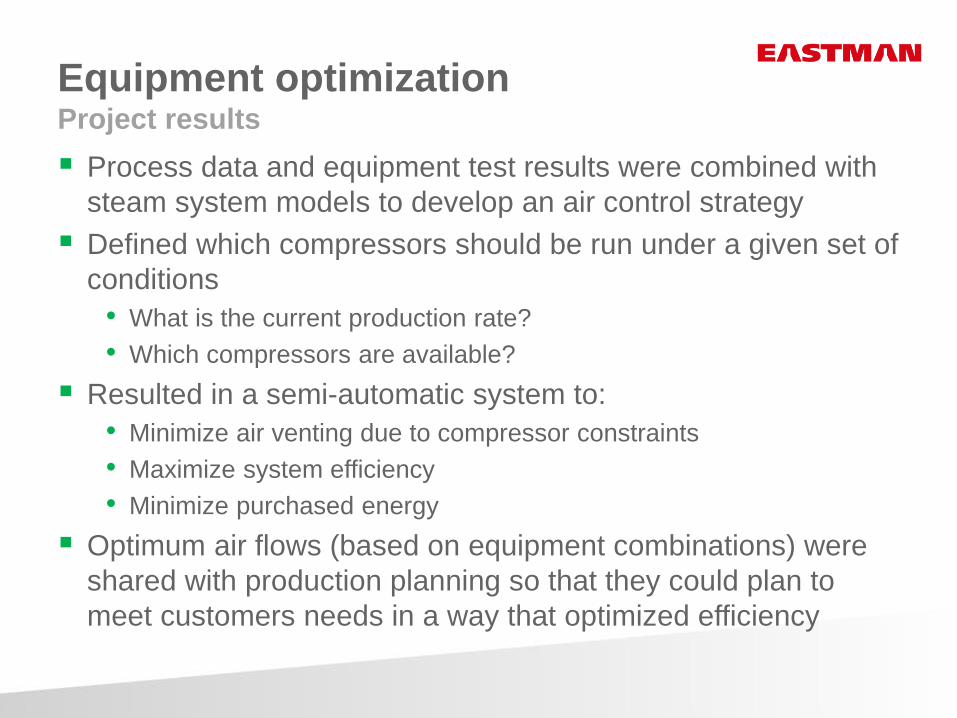
Process data and equipment test results were combined with
steam system models to develop an air control strategy
Defined which compressors should be run under a given set of
conditions
• What is the current production rate?
• Which compressors are available?
Resulted in a semi-automatic system to:
• Minimize air venting due to compressor constraints
• Maximize system efficiency
• Minimize purchased energy
Optimum air flows (based on equipment combinations) were
shared with production planning so that they could plan to
meet customers needs in a way that optimized efficiency
Equipment optimizationProject results
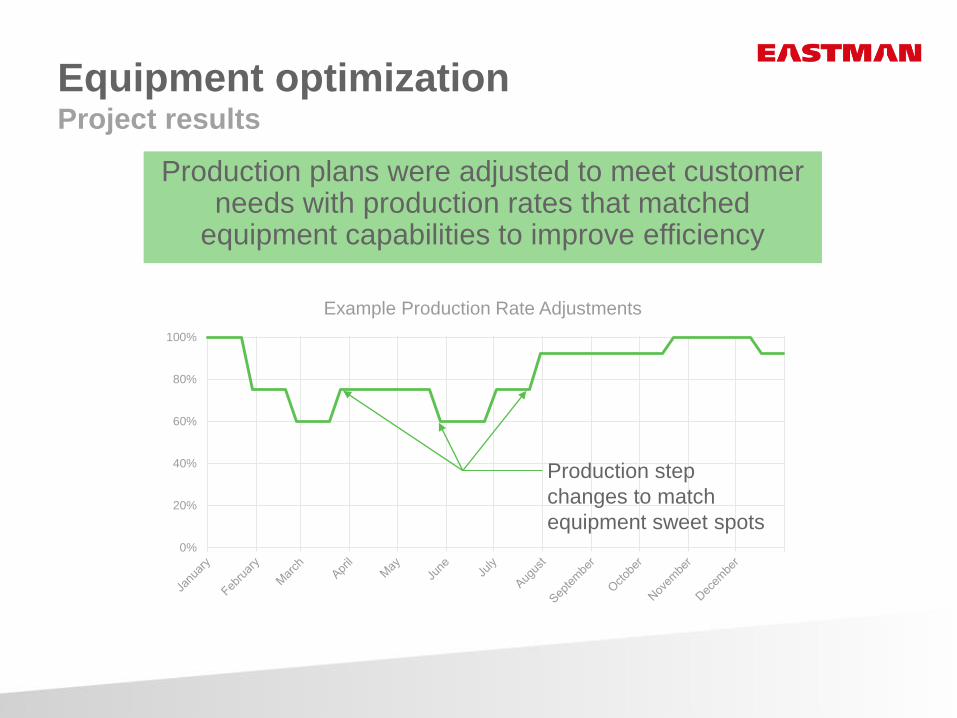
Production plans were adjusted to meet customer needs with production rates that matched
equipment capabilities to improve efficiency
Equipment optimizationProject results
0%
20%
40%
60%
80%
100%
Example Production Rate Adjustments
Production step
changes to match
equipment sweet spots
Dealing with barriers
Additional coordination with other
organizations may be required
such as Production Planning
Additional attention may be
required by manufacturing
• Address cultural barriers that could
prevent successful implementation
• Mitigate any risks introduced with
extra startups and shutdowns
Maintain the gains
If production rates remain high for a period of time, strategies developed to increase efficiency at partial capacity utilization may be forgotten (especially with employee turnover)
Many strategies will force operators away from their comfort zones
Critical to ensure any strategies are institutionalized
• Incorporate into standard operating procedures
• Set up automatic trigger points based on production rate
• Develop measures to compare actual performance to ideal energy/production relationship
Summary
Lower production may produce additional opportunities to
improve efficiency
Several general strategies may be applied across
different manufacturing sectors
Many of the solutions do not require capital
Lock in long-term benefits by institutionalizing strategies

Questions
“Integrated Site Energy Planning”
Industrial Energy Technology ConferenceMay 24th, 2016 New Orleans, Louisiana
Creating Roadmaps to Breakthrough Energy Productivity
Energy Managers’ Workshop
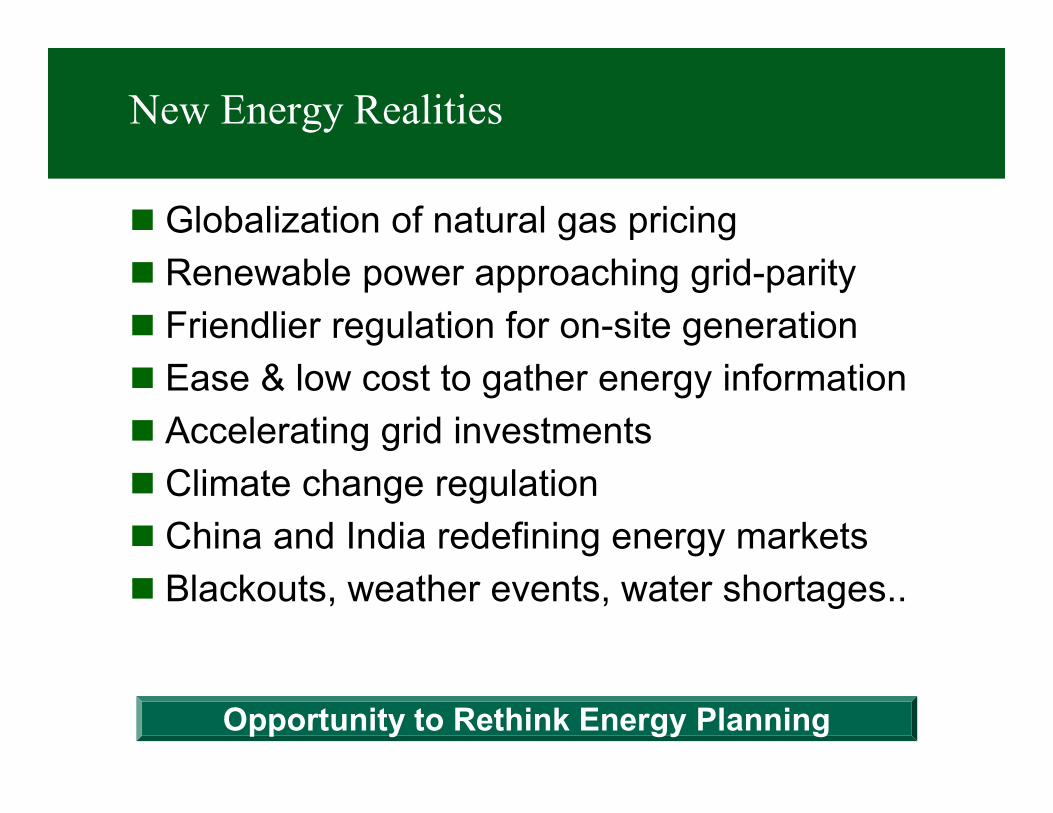
New Energy Realities
� Globalization of natural gas pricing
� Renewable power approaching grid-parity
� Friendlier regulation for on-site generation
� Ease & low cost to gather energy information
� Accelerating grid investments
� Climate change regulation
� China and India redefining energy markets
� Blackouts, weather events, water shortages..
Opportunity to Rethink Energy Planning
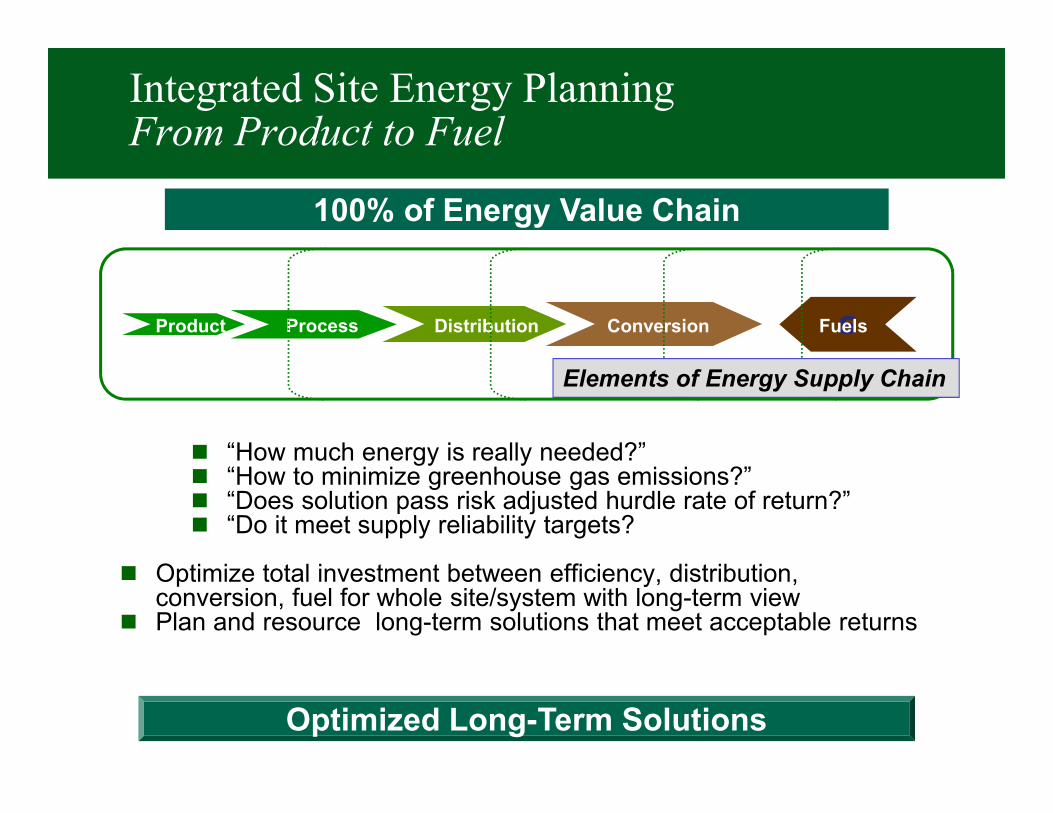
Product Process Distribution Conversion sFuels
Elements of Energy Supply Chain
Integrated Site Energy PlanningFrom Product to Fuel
� “How much energy is really needed?”� “How to minimize greenhouse gas emissions?”� “Does solution pass risk adjusted hurdle rate of return?”� “Do it meet supply reliability targets?
� Optimize total investment between efficiency, distribution, conversion, fuel for whole site/system with long-term view
� Plan and resource long-term solutions that meet acceptable returns
Optimized Long-Term Solutions
100% of Energy Value Chain
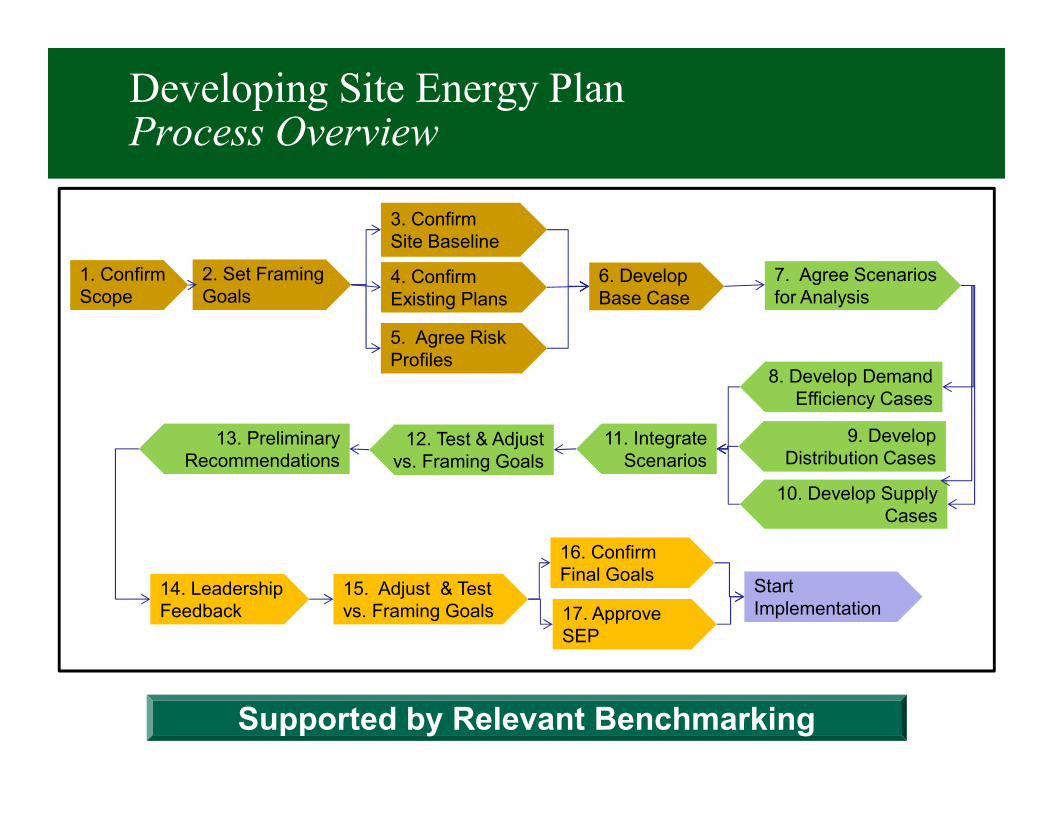
Developing Site Energy PlanProcess Overview
Supported by Relevant Benchmarking
2. Set Framing Goals
3. ConfirmSite Baseline
5. Agree Risk Profiles
1. Confirm Scope
4. Confirm Existing Plans
6. DevelopBase Case
7. Agree Scenarios for Analysis
10. Develop Supply Cases
9. DevelopDistribution Cases
8. Develop Demand Efficiency Cases
11. Integrate Scenarios
12. Test & Adjust vs. Framing Goals
13. Preliminary Recommendations
14. Leadership Feedback
15. Adjust & Test vs. Framing Goals
16. Confirm Final Goals
17. Approve SEP
Start Implementation

Site View of EnergyUnique Risks & Opportunities
Costs Reliability
Emissions
• High/Low energy prices• Volatility• Market pressures
• Utility infrastructure• Weather• Internal infrastructure• Production interruptions
• Carbon legislation• Carbon Taxes/Pricing
Need Site Specific Energy Road Map

Establish Site Energy Baseline
� Detailed picture of site energy flows� Electricity, gas, water, heating and cooling� Major processes and equipment� Usage and cost� By season� By production loading
� Sources of direct and indirect emissions� End-uses� Fuels and utilities
� Visually intuitive Sankey diagrams often used
Comprehensive Current Energy Picture
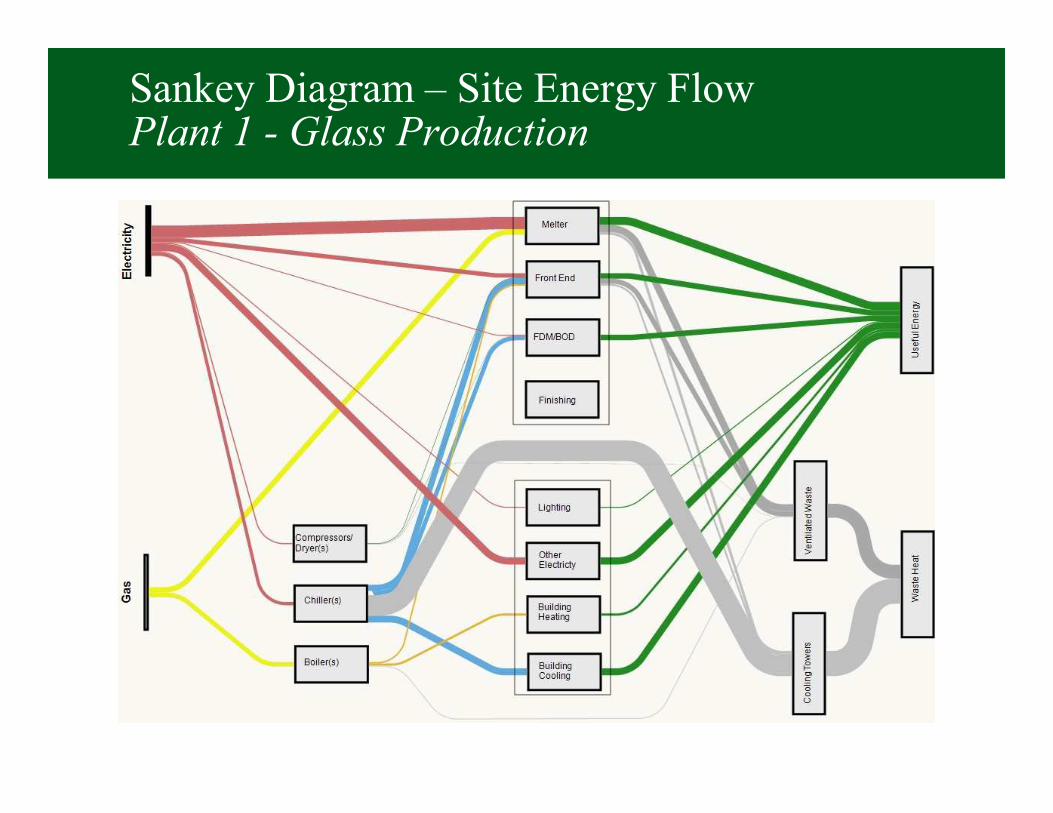
Sankey Diagram – Site Energy FlowPlant 1 - Glass Production
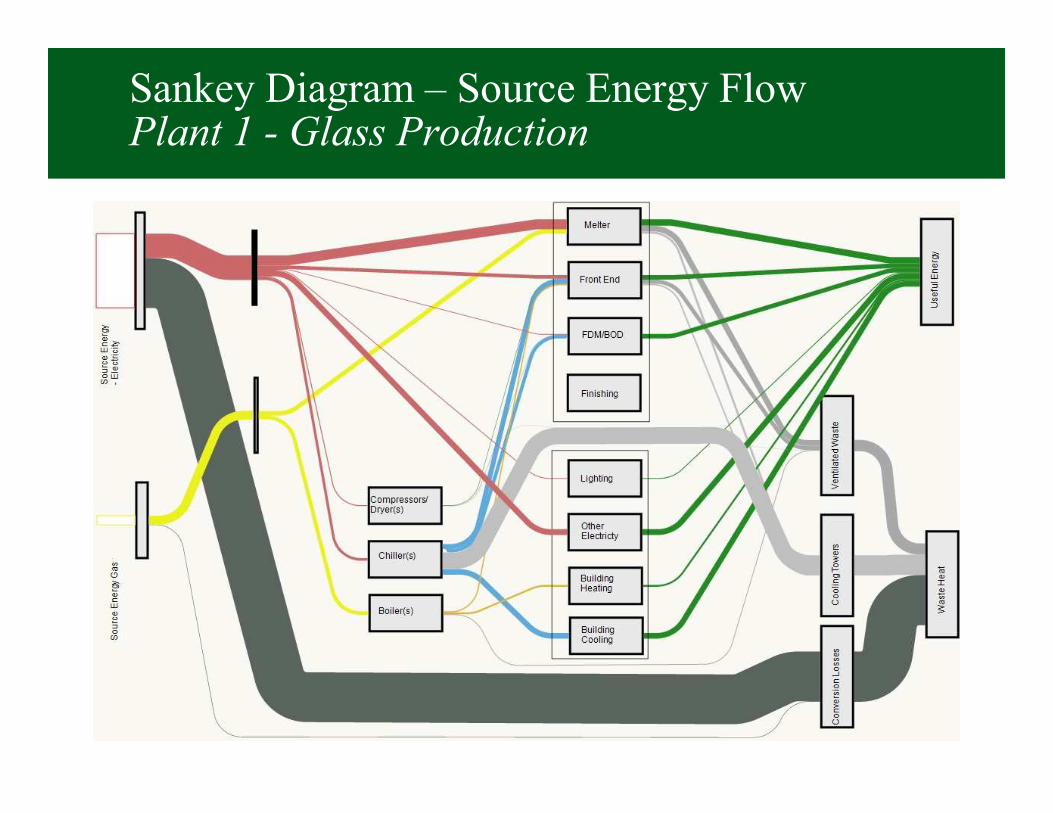
Sankey Diagram – Source Energy FlowPlant 1 - Glass Production
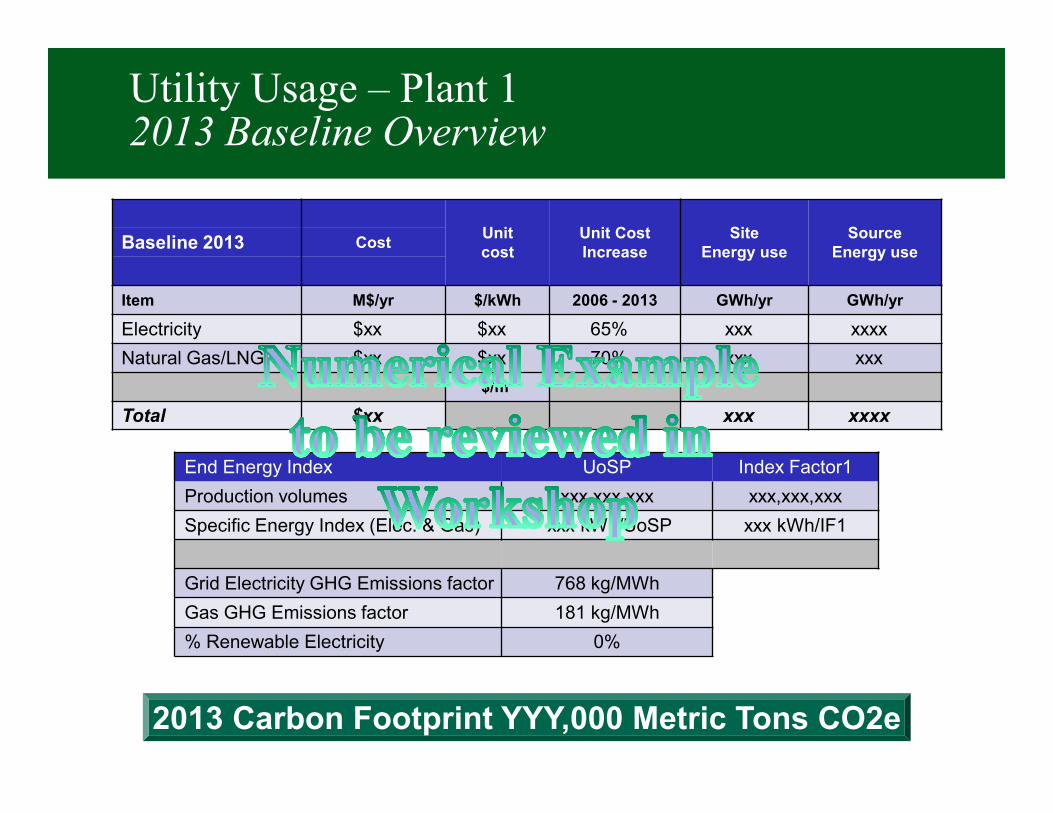
Utility Usage – Plant 1 2013 Baseline Overview
Unitcost
Unit Cost Increase
SiteEnergy use
SourceEnergy use
Baseline 2013 Cost
Item M$/yr $/kWh 2006 - 2013 GWh/yr GWh/yr
Electricity $xx $xx 65% xxx xxxx
Natural Gas/LNG $xx $xx 70% xxx xxx
$/m³
Total $xx xxx xxxx
End Energy Index UoSP Index Factor1
Production volumes xxx,xxx,xxx xxx,xxx,xxx
Specific Energy Index (Elec. & Gas) xxx kWh/UoSP xxx kWh/IF1
Grid Electricity GHG Emissions factor 768 kg/MWh
Gas GHG Emissions factor 181 kg/MWh
% Renewable Electricity 0%
2013 Carbon Footprint YYY,000 Metric Tons CO2e
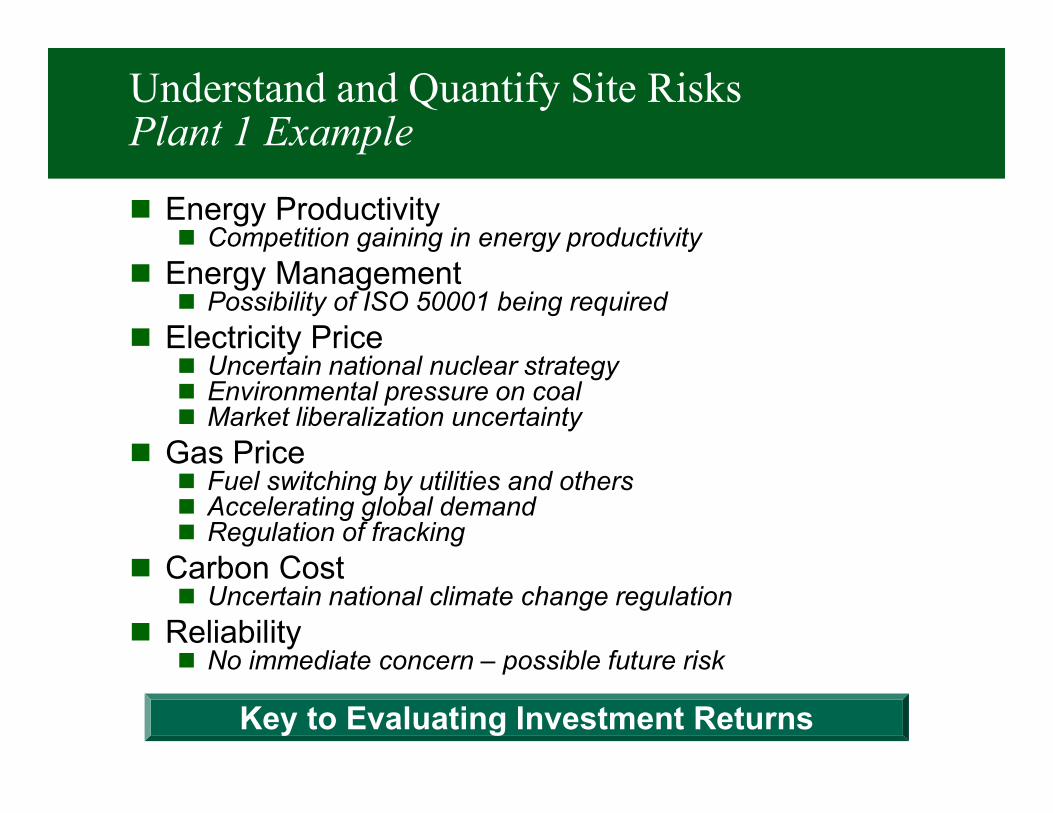
Understand and Quantify Site RisksPlant 1 Example
� Energy Productivity� Competition gaining in energy productivity
� Energy Management � Possibility of ISO 50001 being required
� Electricity Price� Uncertain national nuclear strategy� Environmental pressure on coal� Market liberalization uncertainty
� Gas Price� Fuel switching by utilities and others� Accelerating global demand � Regulation of fracking
� Carbon Cost� Uncertain national climate change regulation
� Reliability� No immediate concern – possible future risk
Key to Evaluating Investment Returns
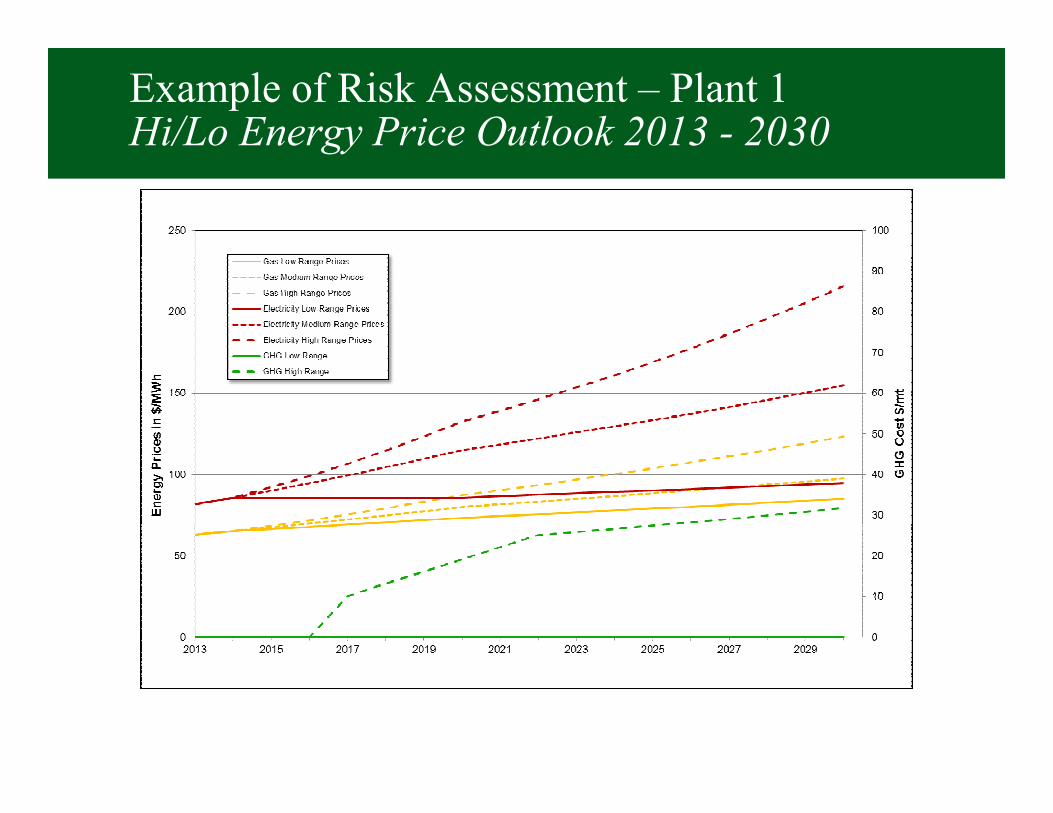
Example of Risk Assessment – Plant 1Hi/Lo Energy Price Outlook 2013 - 2030
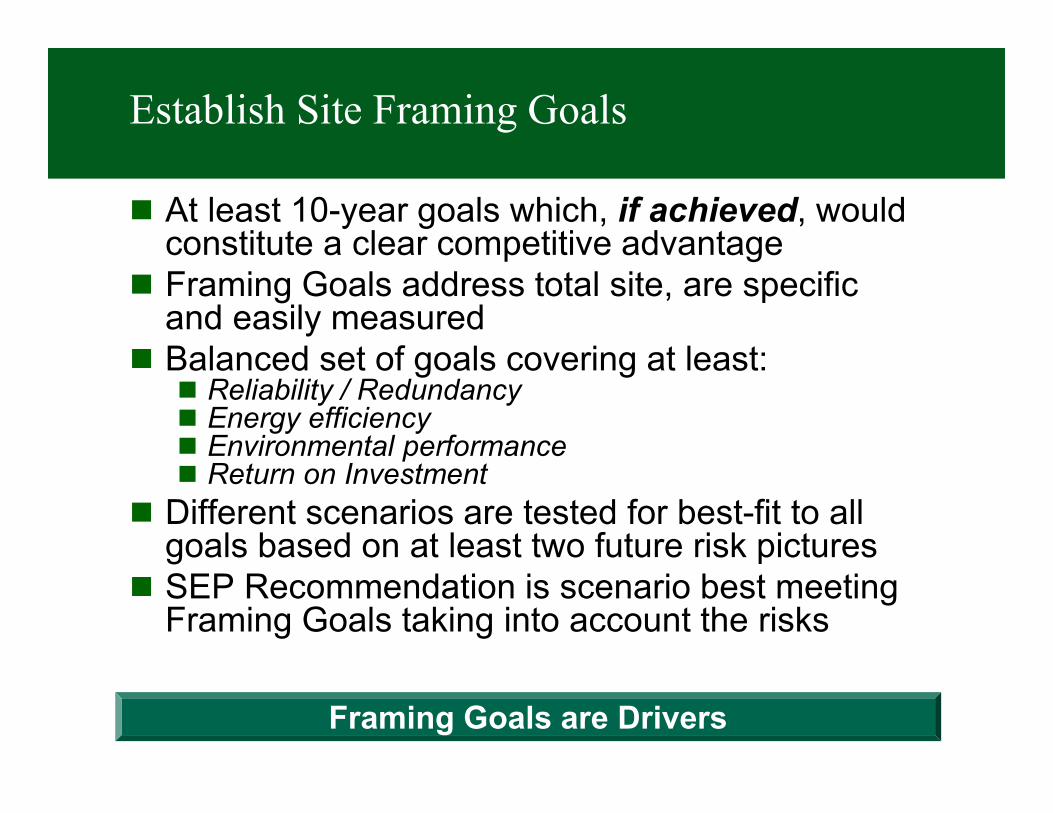
Establish Site Framing Goals
� At least 10-year goals which, if achieved, would constitute a clear competitive advantage
� Framing Goals address total site, are specific and easily measured
� Balanced set of goals covering at least:� Reliability / Redundancy� Energy efficiency� Environmental performance� Return on Investment
� Different scenarios are tested for best-fit to all goals based on at least two future risk pictures
� SEP Recommendation is scenario best meeting Framing Goals taking into account the risks
Framing Goals are Drivers
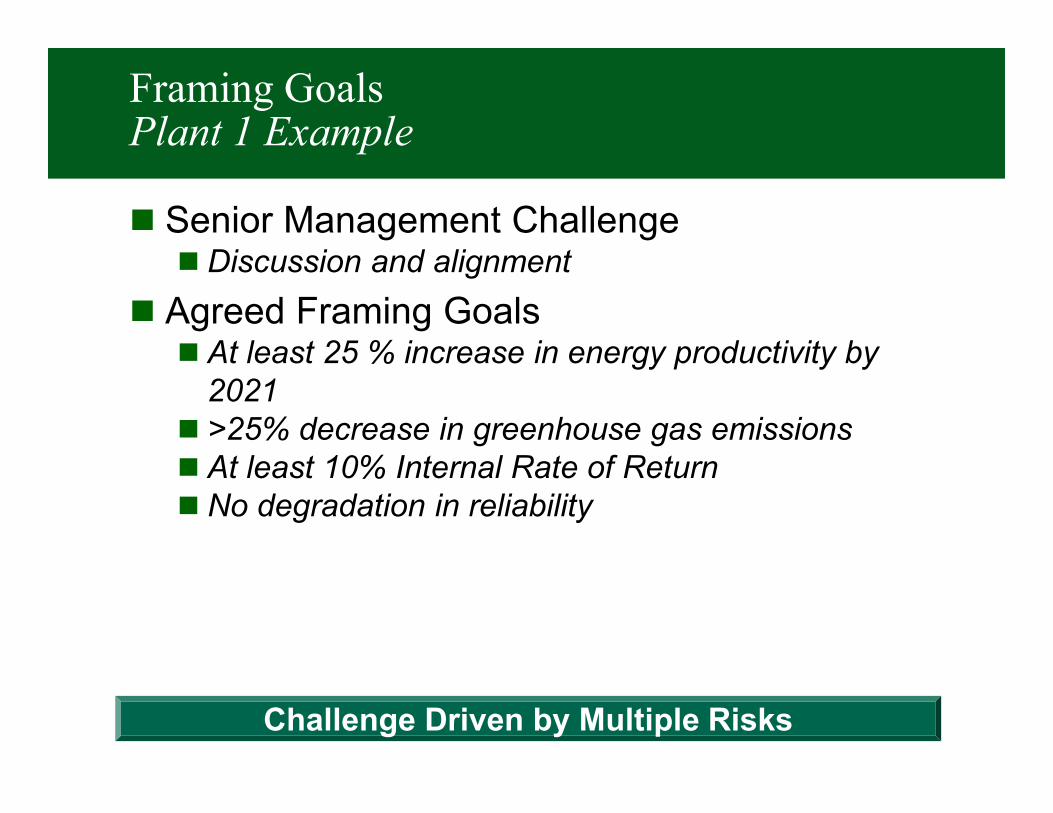
Framing GoalsPlant 1 Example
� Senior Management Challenge� Discussion and alignment
� Agreed Framing Goals� At least 25 % increase in energy productivity by
2021� >25% decrease in greenhouse gas emissions� At least 10% Internal Rate of Return� No degradation in reliability
Challenge Driven by Multiple Risks
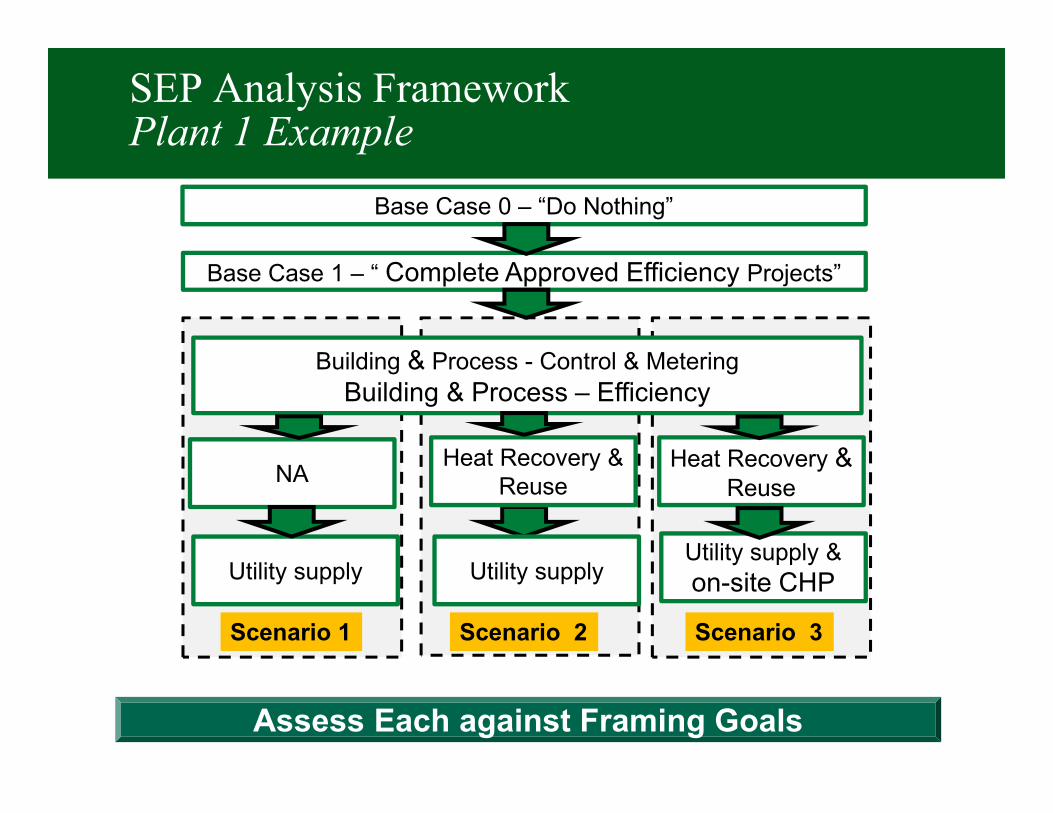
SEP Analysis FrameworkPlant 1 Example
Base Case 0 – “Do Nothing”
Base Case 1 – “ Complete Approved Efficiency Projects”
Building & Process - Control & Metering
Building & Process – Efficiency
Scenario 1 Scenario 2 Scenario 3
NAHeat Recovery &
ReuseHeat Recovery &
Reuse
Utility supply Utility supplyUtility supply &
on-site CHP
Assess Each against Framing Goals
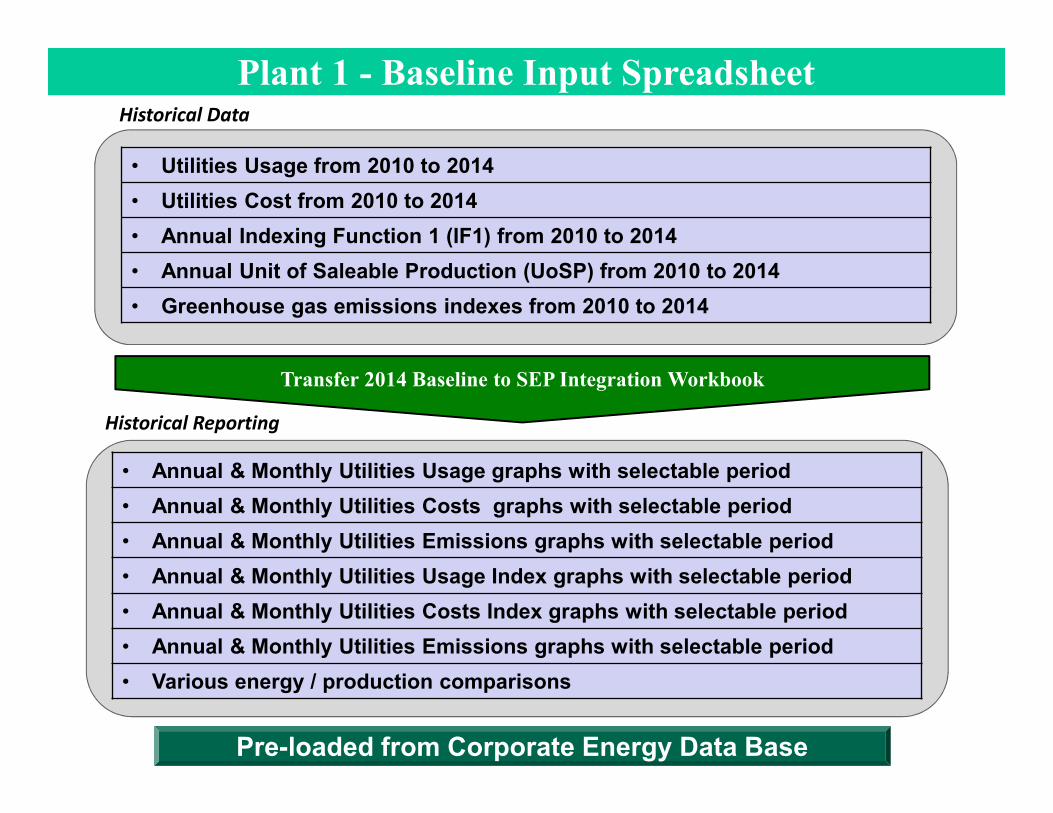
• Utilities Usage from 2010 to 2014
• Utilities Cost from 2010 to 2014
• Annual Indexing Function 1 (IF1) from 2010 to 2014
• Annual Unit of Saleable Production (UoSP) from 2010 to 2014
• Greenhouse gas emissions indexes from 2010 to 2014
Historical Data
Historical Reporting
Plant 1 - Baseline Input Spreadsheet
• Annual & Monthly Utilities Usage graphs with selectable period
• Annual & Monthly Utilities Costs graphs with selectable period
• Annual & Monthly Utilities Emissions graphs with selectable period
• Annual & Monthly Utilities Usage Index graphs with selectable period
• Annual & Monthly Utilities Costs Index graphs with selectable period
• Annual & Monthly Utilities Emissions graphs with selectable period
• Various energy / production comparisons
Transfer 2014 Baseline to SEP Integration Workbook
Pre-loaded from Corporate Energy Data Base
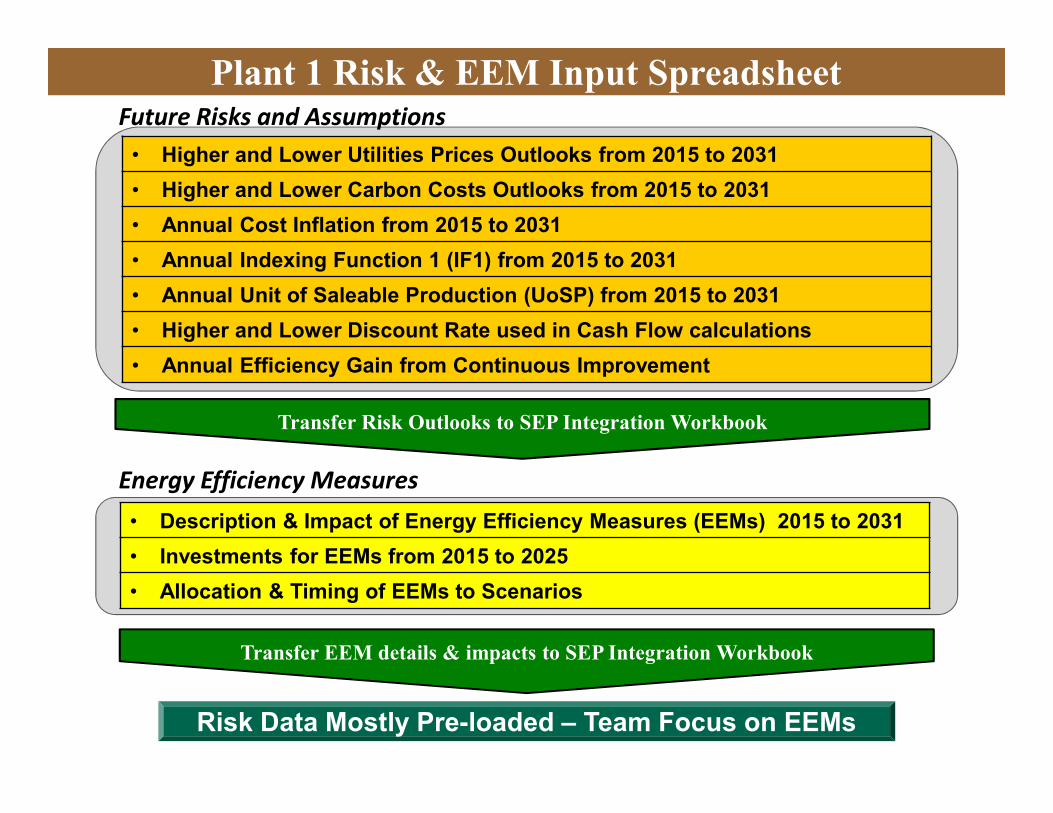
Future Risks and Assumptions
Energy Efficiency Measures
Plant 1 Risk & EEM Input Spreadsheet
• Higher and Lower Utilities Prices Outlooks from 2015 to 2031
• Higher and Lower Carbon Costs Outlooks from 2015 to 2031
• Annual Cost Inflation from 2015 to 2031
• Annual Indexing Function 1 (IF1) from 2015 to 2031
• Annual Unit of Saleable Production (UoSP) from 2015 to 2031
• Higher and Lower Discount Rate used in Cash Flow calculations
• Annual Efficiency Gain from Continuous Improvement
• Description & Impact of Energy Efficiency Measures (EEMs) 2015 to 2031
• Investments for EEMs from 2015 to 2025
• Allocation & Timing of EEMs to Scenarios
Transfer EEM details & impacts to SEP Integration Workbook
Transfer Risk Outlooks to SEP Integration Workbook
Risk Data Mostly Pre-loaded – Team Focus on EEMs
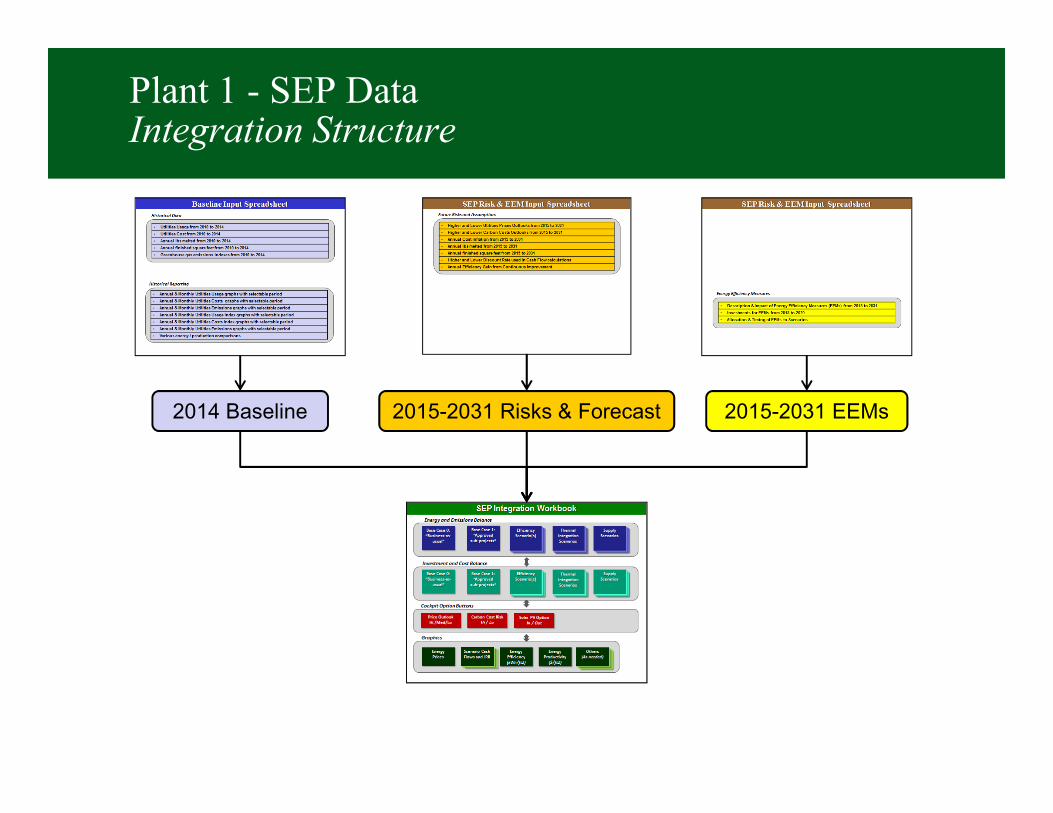
Plant 1 - SEP DataIntegration Structure
2014 Baseline 2015-2031 Risks & Forecast 2015-2031 EEMs
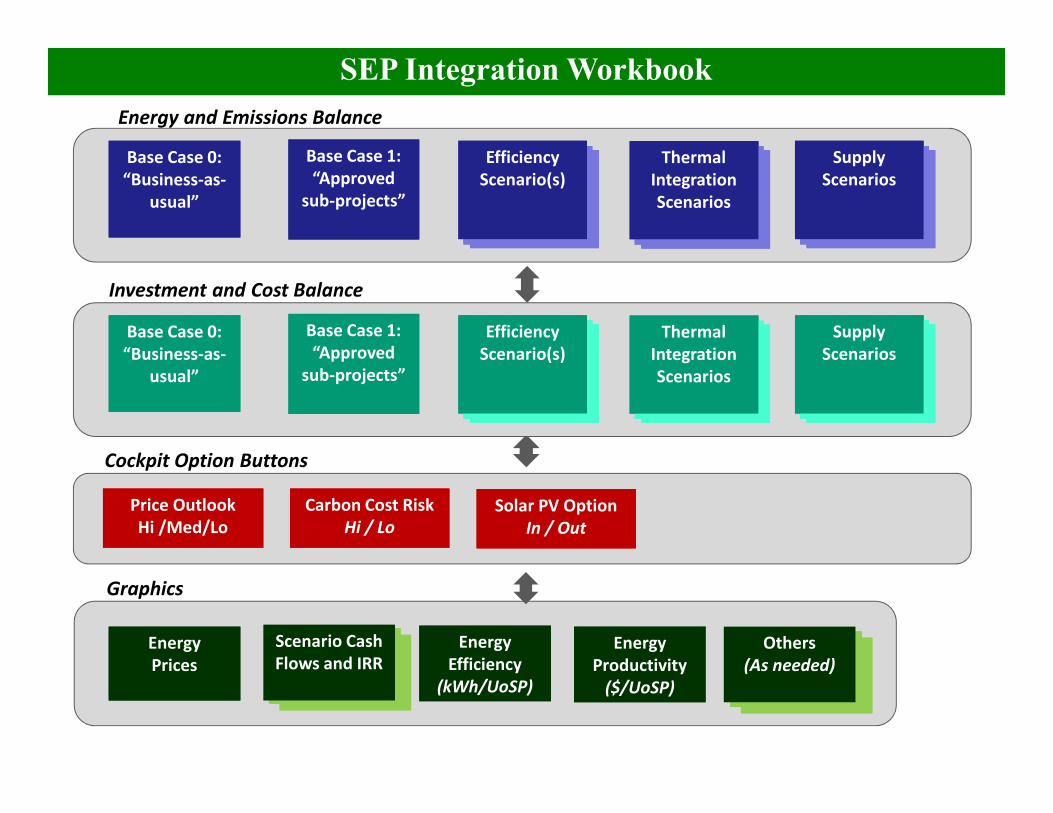
Price Outlook
Hi /Med/Lo
Price Outlook
Hi /Med/Lo
Cockpit Option Buttons
Energy
Prices
Energy
Prices
Graphics
Carbon Cost Risk
Hi / Lo
Carbon Cost Risk
Hi / Lo
Base Case 0:
“Business-as-
usual”
Base Case 0:
“Business-as-
usual”
Base Case 1:
“Approved
sub-projects”
Base Case 1:
“Approved
sub-projects”
Energy and Emissions Balance
Efficiency
Scenario(s)
Efficiency
Scenario(s)
Thermal
Integration
Scenarios
Thermal
Integration
Scenarios
Supply
Scenarios
Supply
Scenarios
Base Case 0:
“Business-as-
usual”
Base Case 0:
“Business-as-
usual”
Base Case 1:
“Approved
sub-projects”
Base Case 1:
“Approved
sub-projects”
Investment and Cost Balance
Efficiency
Scenario(s)
Efficiency
Scenario(s)
Thermal
Integration
Scenarios
Thermal
Integration
Scenarios
Supply
Scenarios
Supply
Scenarios
Solar PV Option
In / Out
Solar PV Option
In / Out
Energy
Productivity
($/UoSP)
Energy
Productivity
($/UoSP)
Energy
Efficiency
(kWh/UoSP)
Energy
Efficiency
(kWh/UoSP)
Scenario Cash
Flows and IRROthers
(As needed)
SEP Integration Workbook
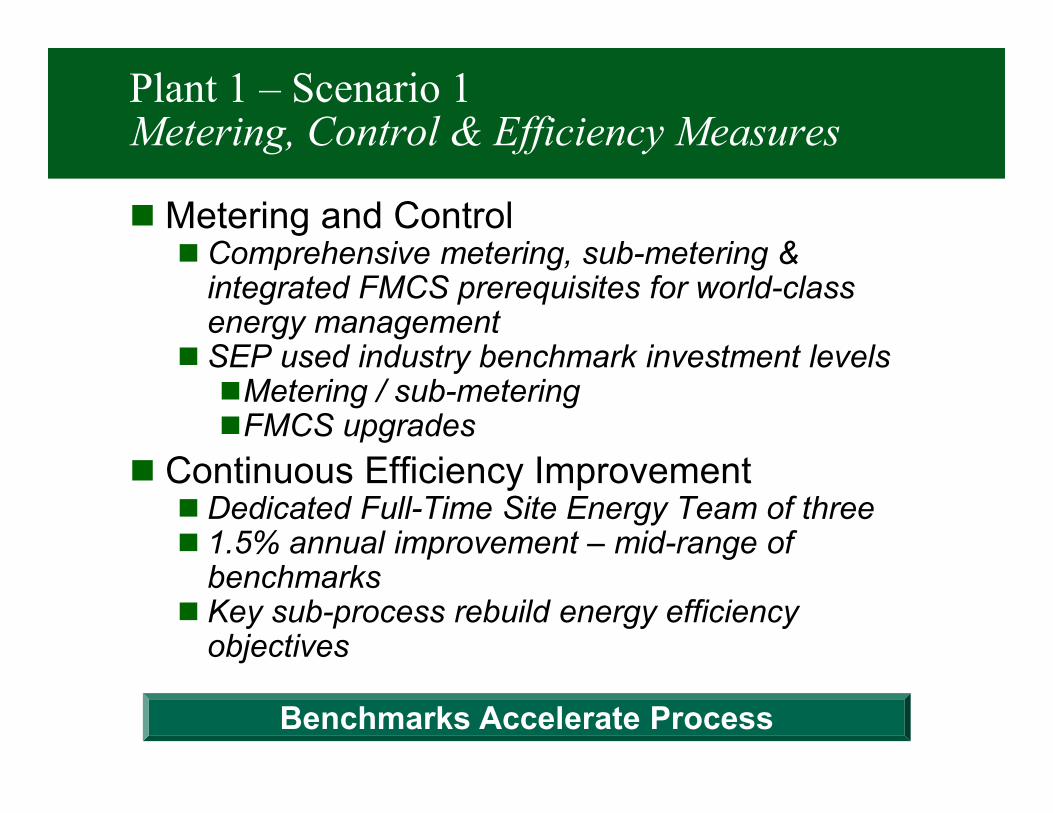
Plant 1 – Scenario 1Metering, Control & Efficiency Measures
� Metering and Control � Comprehensive metering, sub-metering &
integrated FMCS prerequisites for world-class energy management
� SEP used industry benchmark investment levels�Metering / sub-metering�FMCS upgrades
� Continuous Efficiency Improvement� Dedicated Full-Time Site Energy Team of three� 1.5% annual improvement – mid-range of
benchmarks� Key sub-process rebuild energy efficiency
objectives
Benchmarks Accelerate Process
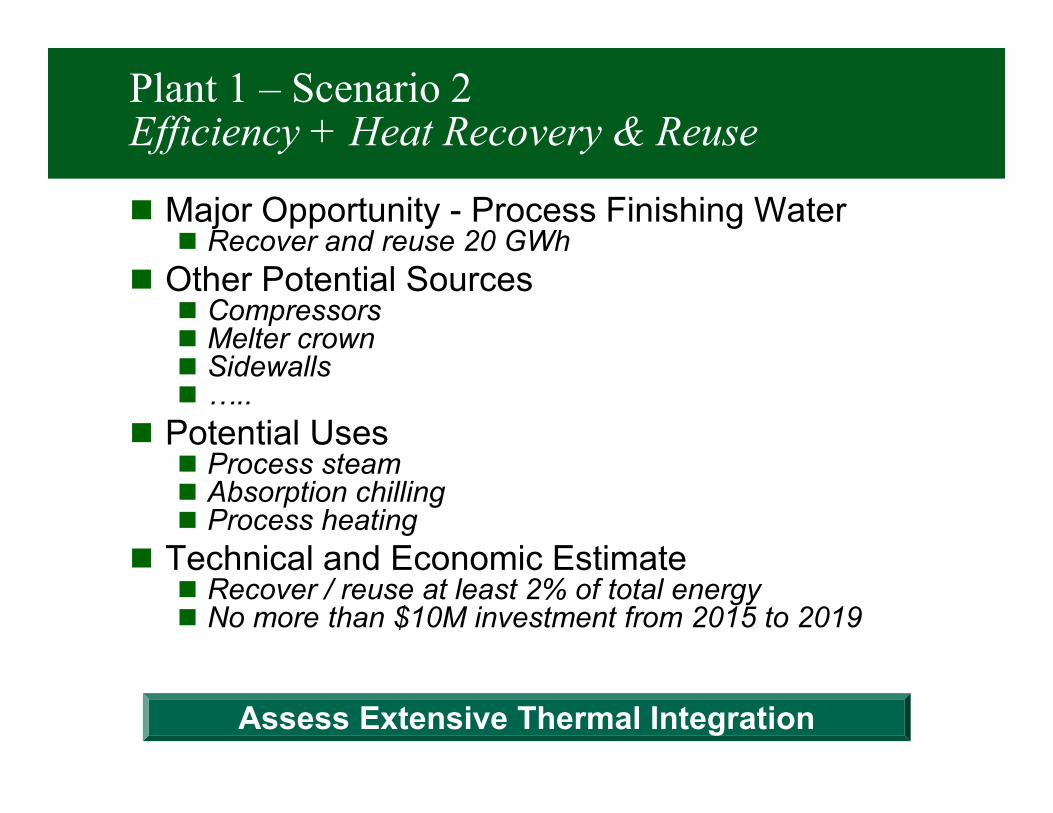
Plant 1 – Scenario 2Efficiency + Heat Recovery & Reuse
� Major Opportunity - Process Finishing Water� Recover and reuse 20 GWh
� Other Potential Sources� Compressors� Melter crown� Sidewalls� …..
� Potential Uses� Process steam� Absorption chilling� Process heating
� Technical and Economic Estimate� Recover / reuse at least 2% of total energy � No more than $10M investment from 2015 to 2019
Assess Extensive Thermal Integration
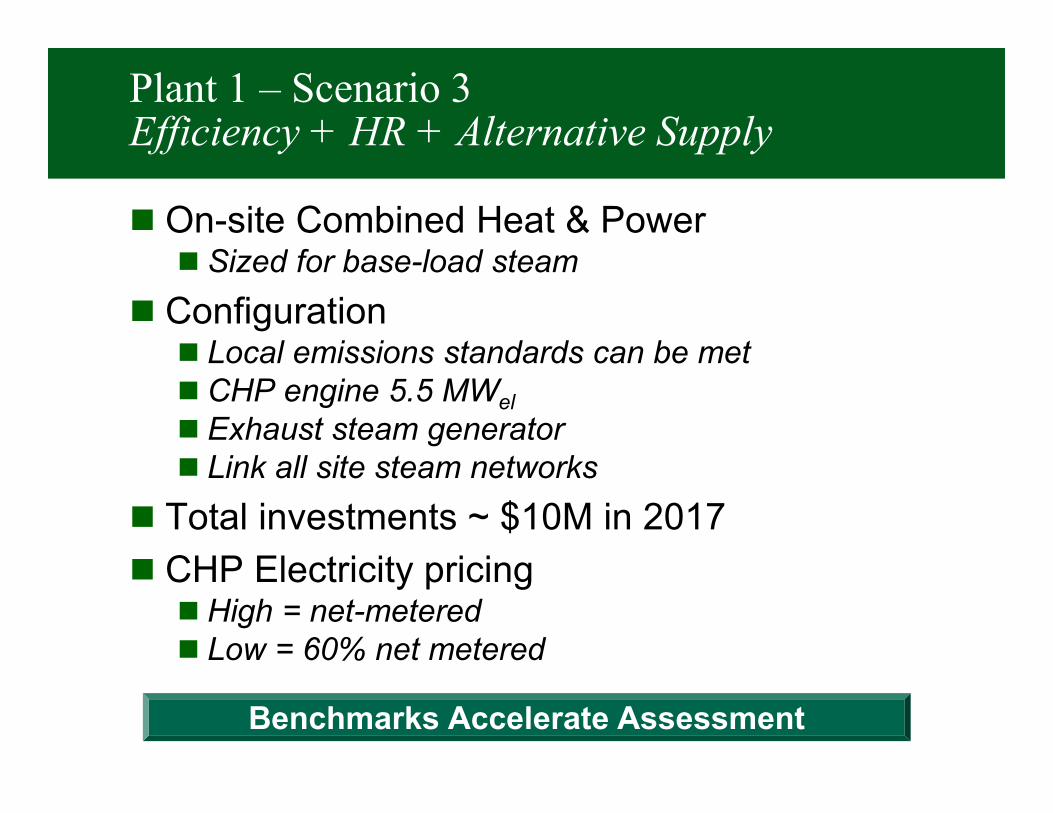
Plant 1 – Scenario 3Efficiency + HR + Alternative Supply
� On-site Combined Heat & Power� Sized for base-load steam
� Configuration� Local emissions standards can be met� CHP engine 5.5 MWel
� Exhaust steam generator� Link all site steam networks
� Total investments ~ $10M in 2017
� CHP Electricity pricing� High = net-metered� Low = 60% net metered
Benchmarks Accelerate Assessment
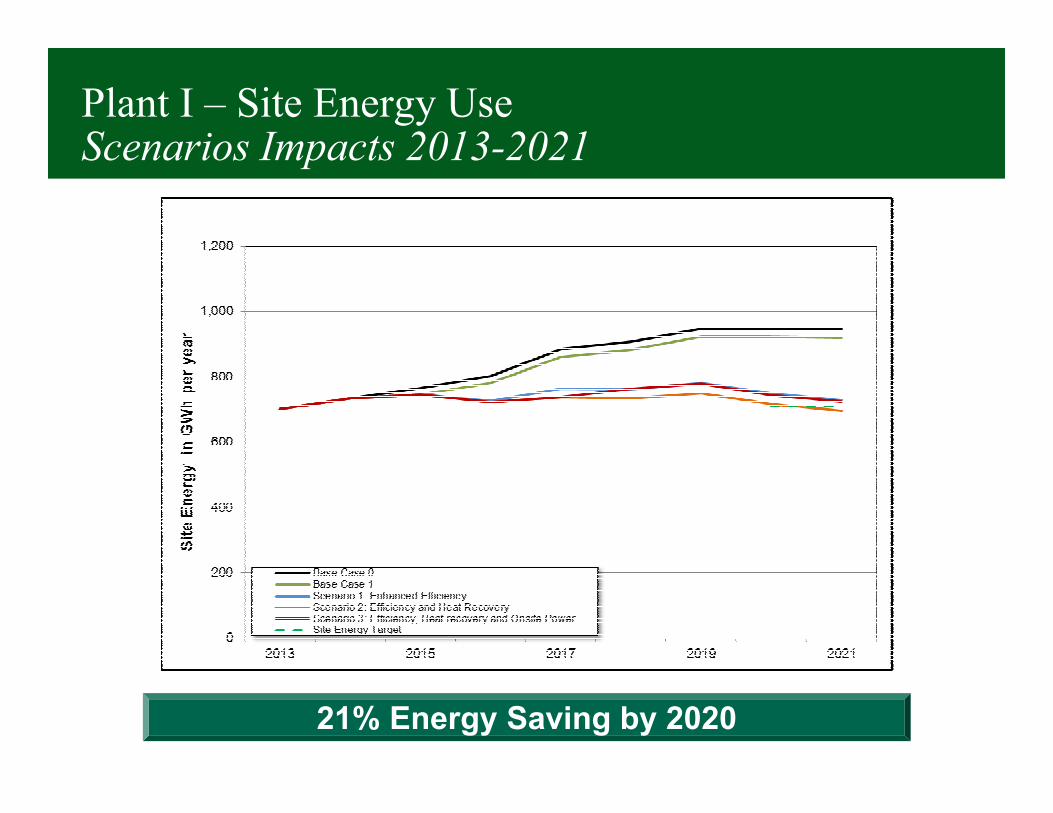
Plant I – Site Energy UseScenarios Impacts 2013-2021
21% Energy Saving by 2020
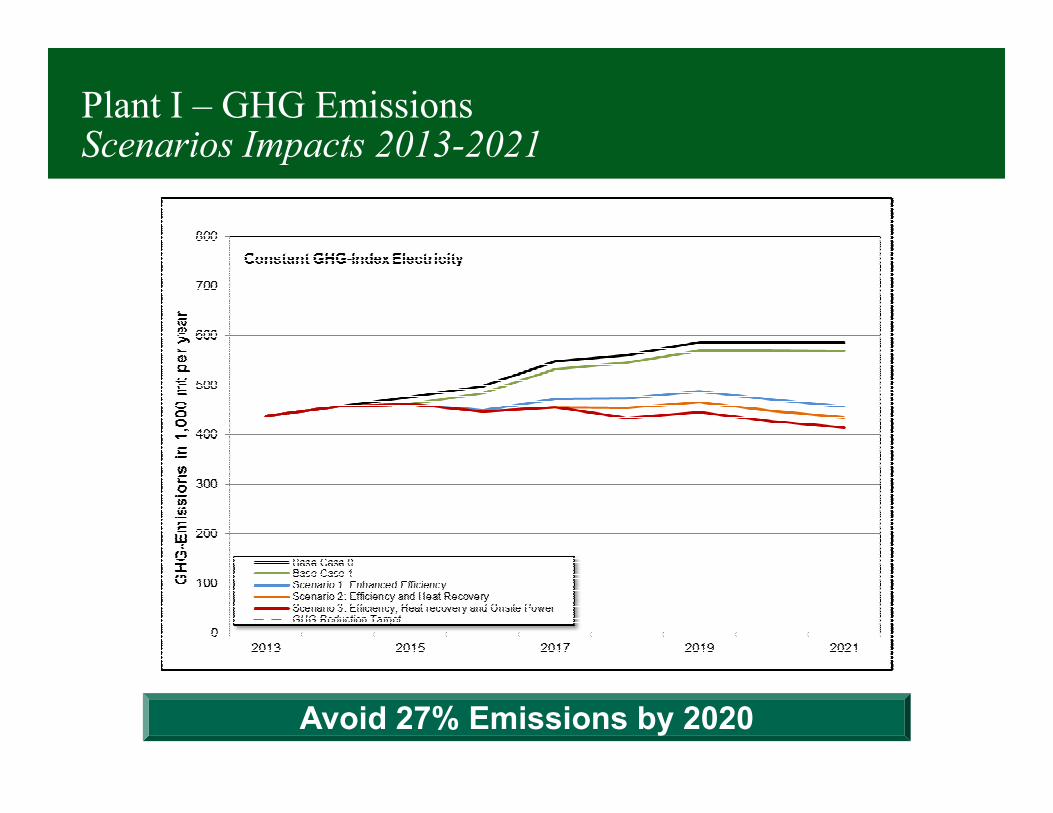
Plant I – GHG EmissionsScenarios Impacts 2013-2021
Avoid 27% Emissions by 2020
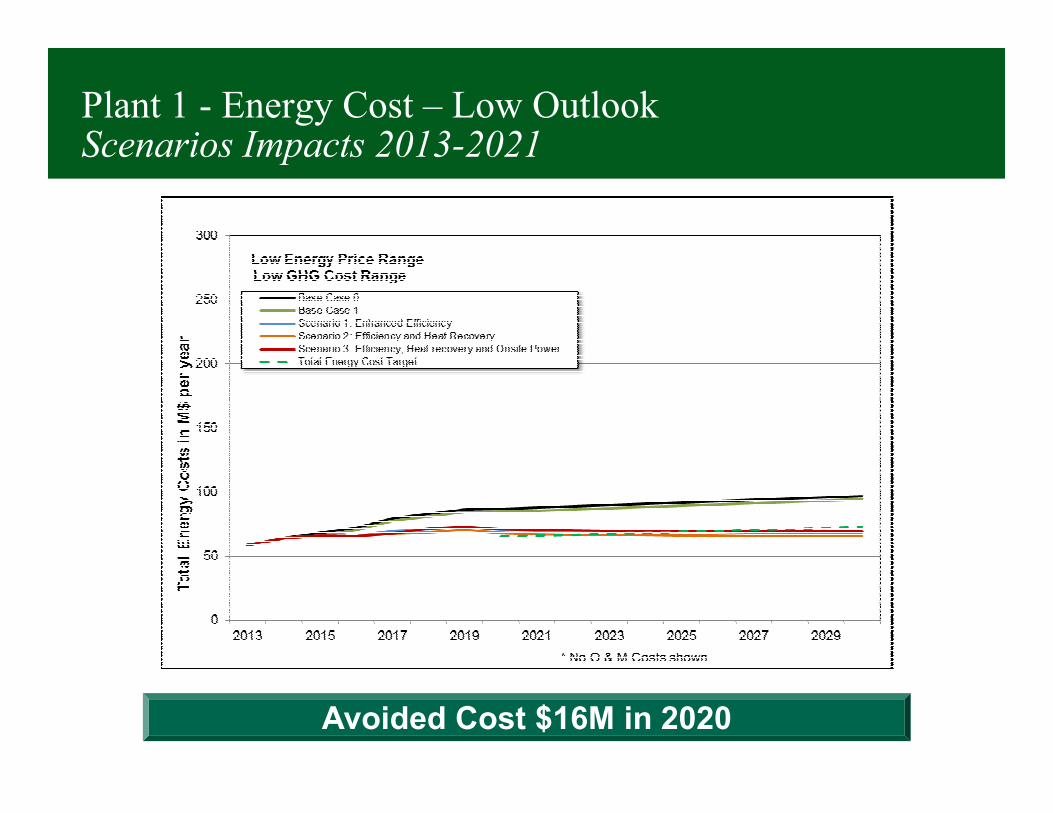
Plant 1 - Energy Cost – Low OutlookScenarios Impacts 2013-2021
Avoided Cost $16M in 2020

Plant 1 - Energy Cost – High OutlookScenarios Impacts 2013-2021
Avoided Cost $30M in 2020

Plant 1 SEP ResultsPerformance against Framing Goals
SEP Plant 1
Constant GHG-Index Electricity Low Energy Price Range
Low GHG Cost Range Low Interest Rate Range
Achieved targets 2020Site Energy Reduction Index
% of Target achieved
Total Energy Cost Reduction
% of Target achieved
GHG Reduction Index
% of Target achieved
Internal Rate of Return (IRR)
% of Target achieved
Base Case 1 X% X% X% X% X% X% - -
Scenario 1: Enhanced Efficiency X% X% X% X% X% X% X% X%
Scenario 2: Efficiency and Heat Recovery
X% X% X% X% X% X% X% X%
Scenario 3: Efficiency, Heat recovery and Onsite Power
X% X% X% X% X% X% X% X%
Simple Overview of Complex Questions
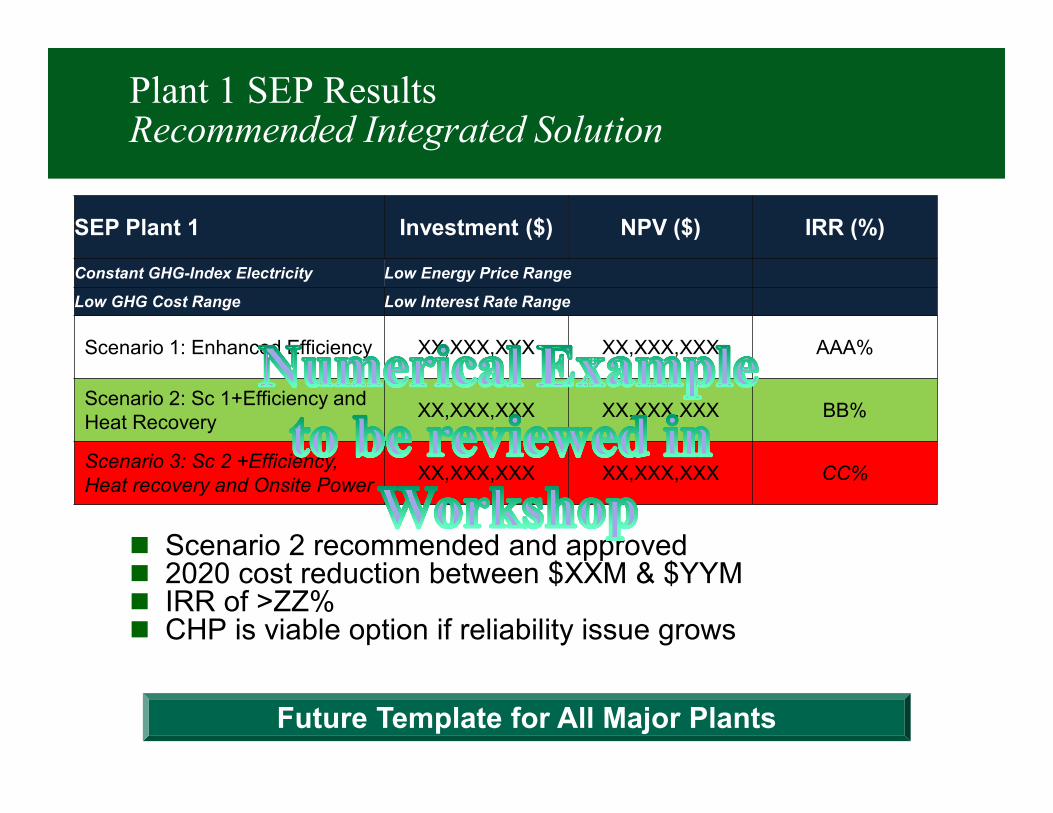
Plant 1 SEP ResultsRecommended Integrated Solution
� Scenario 2 recommended and approved� 2020 cost reduction between $XXM & $YYM� IRR of >ZZ%� CHP is viable option if reliability issue grows
SEP Plant 1 Investment ($) NPV ($) IRR (%)
Constant GHG-Index Electricity Low Energy Price Range
Low GHG Cost Range Low Interest Rate Range
Scenario 1: Enhanced Efficiency XX,XXX,XXX XX,XXX,XXX AAA%
Scenario 2: Sc 1+Efficiency and Heat Recovery
XX,XXX,XXX XX,XXX,XXX BB%
Scenario 3: Sc 2 +Efficiency, Heat recovery and Onsite Power
XX,XXX,XXX XX,XXX,XXX CC%
Future Template for All Major Plants
Integrated Site Energy PlanningConclusions
� Applicable to large and small sites
� Assumption-based approach manages missing and poor data
� Relatively fast to reach decision-grade plan
� Integration tools allows multiple options to be tested
� Basis for energy risk management
� Eye-opener for senior management
Multi-Year Investment Energy Road Map
1 Southeast Energy Efficiency Alliance | www.seealliance.org
EPA’s Clean Power Plan: What Southeastern Energy Managers Need to Know
Abby Fox, Policy Manager May 24, 2016
2 Southeast Energy Efficiency Alliance | www.seealliance.org
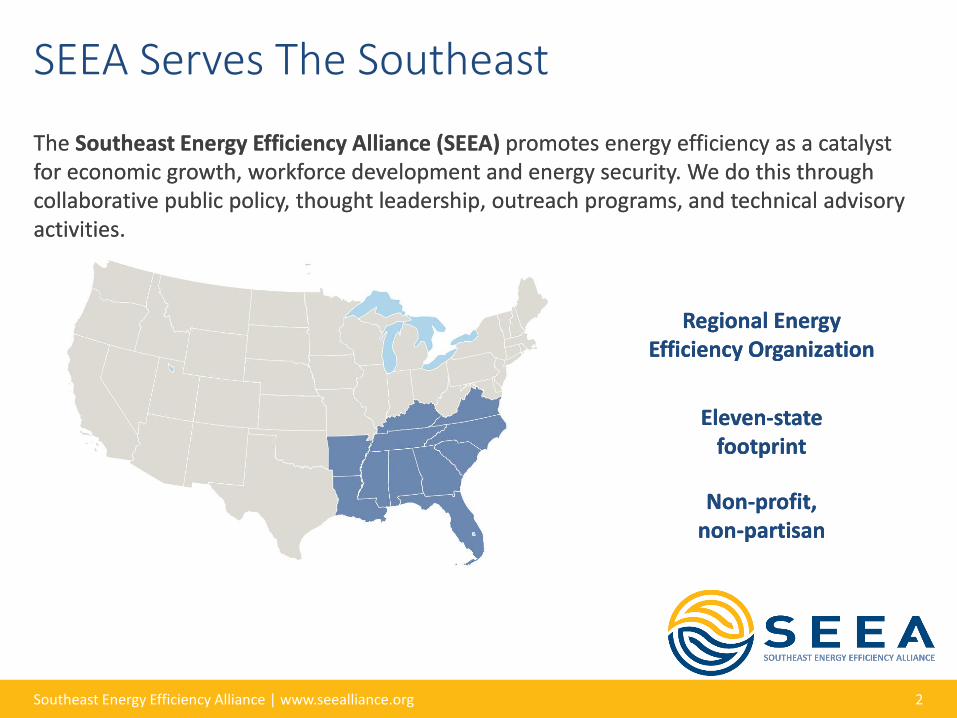
Regional Energy Efficiency Organization
Eleven-state footprint
Non-profit, non-partisan
The Southeast Energy Efficiency Alliance (SEEA) promotes energy efficiency as a catalyst for economic growth, workforce development and energy security. We do this through collaborative public policy, thought leadership, outreach programs, and technical advisory activities.
SEEA Serves The Southeast

CLEAN POWER PLAN OVERVIEW
4 Southeast Energy Efficiency Alliance | www.seealliance.org
The Basics
▪ Regulates carbon dioxide emissions from existing sources within the power sector
▪ Numerous control strategies (including energy efficiency)
▪ Two forms of goals:
▪ Rate-based (intensity)
▪ Mass-based (carbon “budget”)
▪ Likely to drive greater investment in energy efficiency
5 Southeast Energy Efficiency Alliance | www.seealliance.org
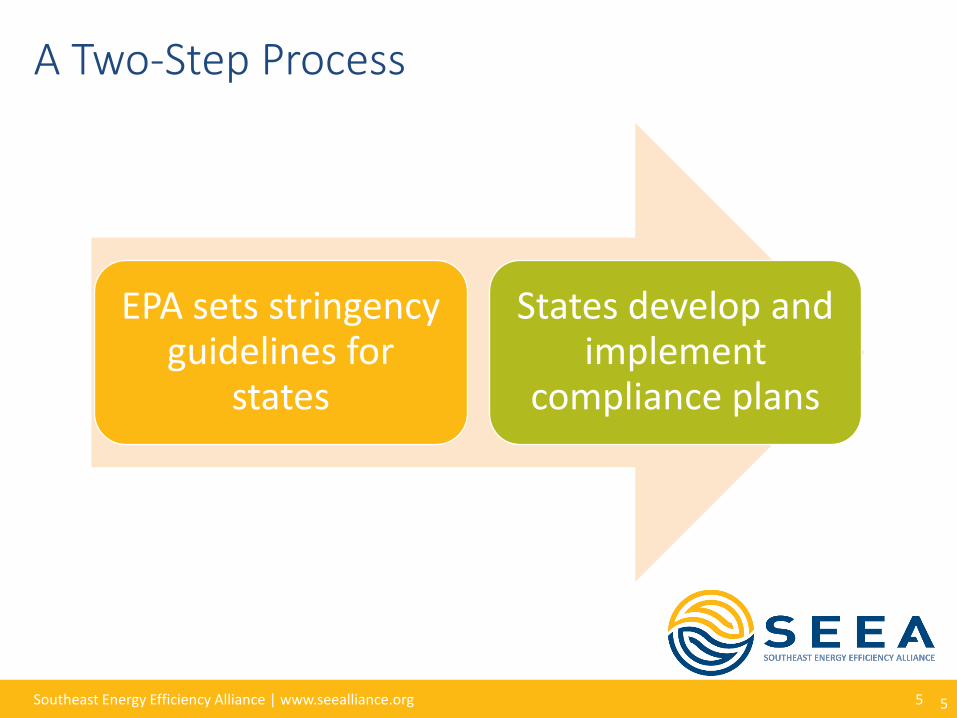
A Two-Step Process
EPA sets stringency guidelines for
states
States develop and implement
compliance plans
5
WHAT DOES THIS LOOK LIKE IN PRACTICE
FOR ENERGY EFFICIENCY?
7 Southeast Energy Efficiency Alliance | www.seealliance.org
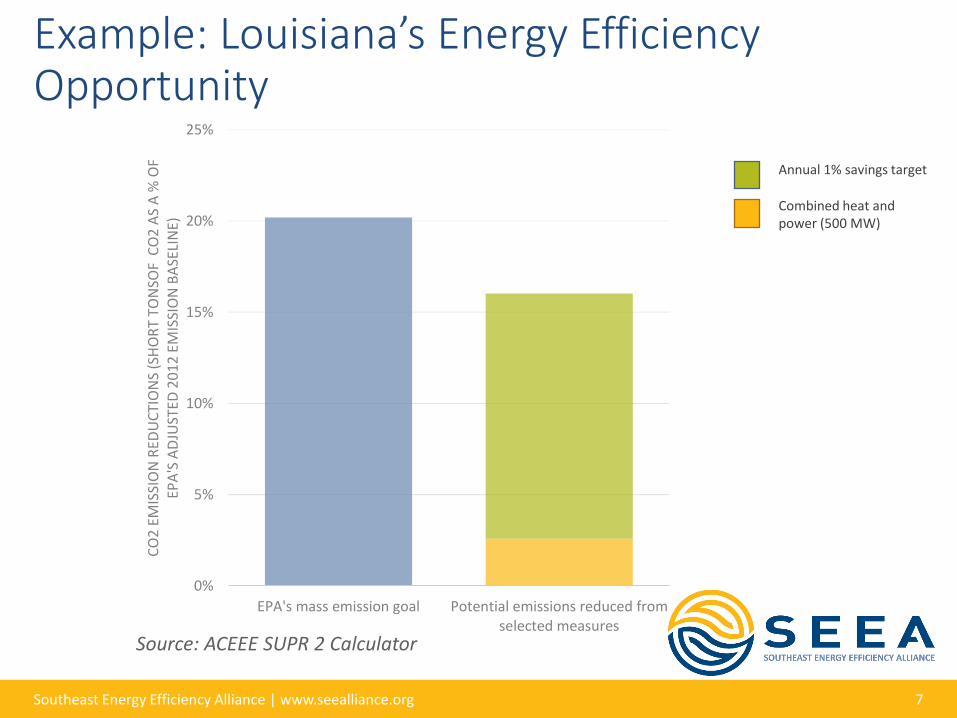
Example: Louisiana’s Energy Efficiency Opportunity
0%
5%
10%
15%
20%
25%
EPA's mass emission goal Potential emissions reduced fromselected measures
CO
2 E
MIS
SIO
N R
EDU
CTI
ON
S (S
HO
RT
TON
SOF
CO
2 A
S A
% O
F EP
A'S
AD
JUST
ED 2
01
2 E
MIS
SIO
N B
ASE
LIN
E) Combined heat and
power (500 MW)
Annual 1% savings target
Source: ACEEE SUPR 2 Calculator
8 Southeast Energy Efficiency Alliance | www.seealliance.org
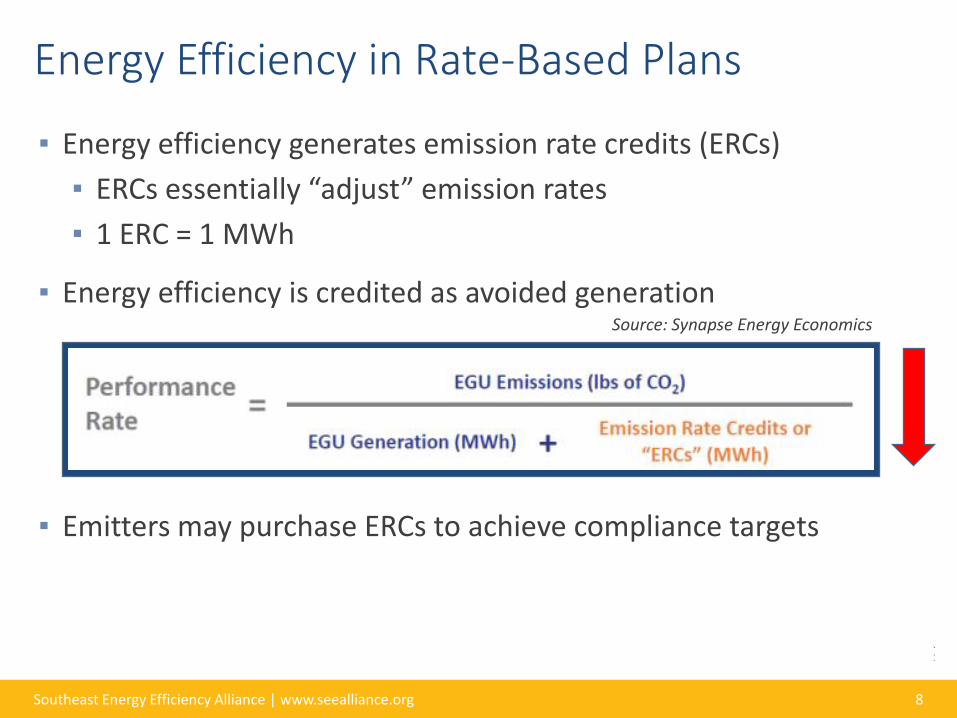
▪ Energy efficiency generates emission rate credits (ERCs)
▪ ERCs essentially “adjust” emission rates
▪ 1 ERC = 1 MWh
▪ Energy efficiency is credited as avoided generation
▪ Emitters may purchase ERCs to achieve compliance targets
Energy Efficiency in Rate-Based Plans
Source: Synapse Energy Economics
9 Southeast Energy Efficiency Alliance | www.seealliance.org
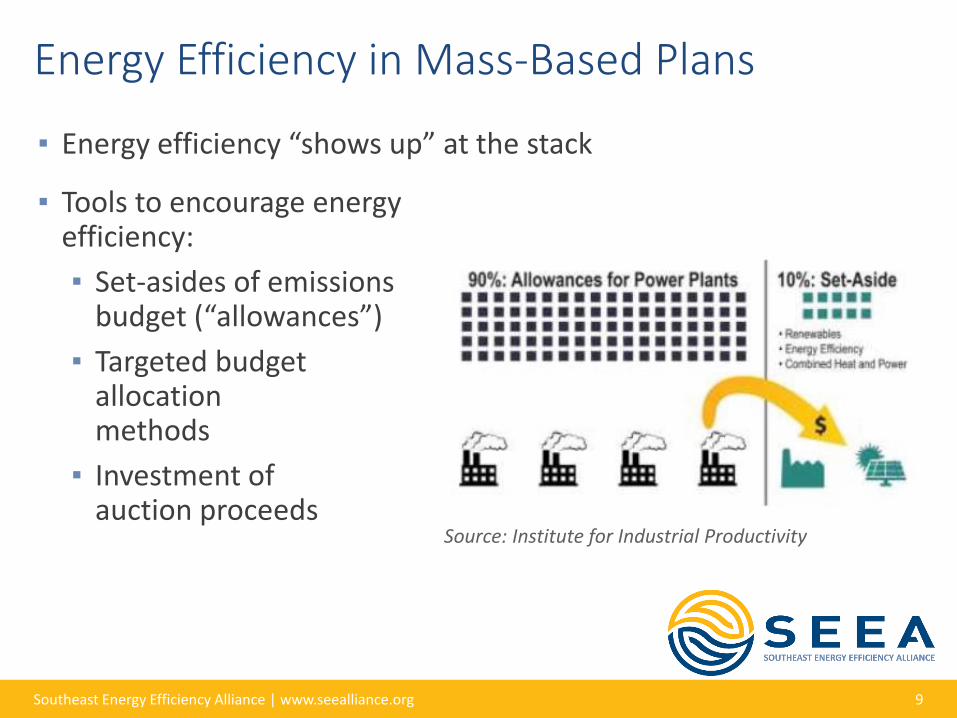
Energy Efficiency in Mass-Based Plans
▪ Energy efficiency “shows up” at the stack
▪ Tools to encourage energy efficiency:
▪ Set-asides of emissions budget (“allowances”)
▪ Targeted budget allocation methods
▪ Investment of auction proceeds Source: Institute for Industrial Productivity
10 Southeast Energy Efficiency Alliance | www.seealliance.org
Key Takeaways
▪ EPA’s Clean Power Plan has the potential to drive new, cost-effective investments in energy efficiency.
▪ Energy efficiency can meet compliance obligations at least cost (and maximum benefit).
▪ Industrial customers may see increased revenue streams or incentive availability for energy efficiency projects.
▪ MAKE IT COUNT!

11 Southeast Energy Efficiency Alliance | www.seealliance.org
2_Title Slide
DOE eGuide for Strategic Energy
ManagementRidah Sabouni, CEM, PMP, CMVP
Senior Engineer, Energetics Incorporated
May 2016

Energetics at a Glance
Integrated delivery of technical, analytical, andcommunication services for over 35 years
120+ staff members include engineers, scientists, project managers, and communication specialists
• 30+ Subject Matter Experts:Advanced Manufacturing, Energy Management, Wind, Solar, Bioenergy, Battery Storage, CHP, Fuel-efficient Vehicle Technologies, Green Building Technologies, Smart Grid, Climate Change Adaptation, and Policy/Regulatory Affairs
• Over 50% with Advanced Degrees (Ph.D., J.D., M.S.)
• 55 BS/BA Engineering/Science Degrees
• Certifications including PMP, PE, CEM, LEED, CMVP
Providing clients with solutions that: • Increase energy efficiency
• Diversify energy supply• Measure impacts of new energy technologies
• Benchmark energy and carbon footprints
• Create consensus around strategic priorities• Modernize infrastructure
2

3
Client Offerings
Implementation &
Deployment
Evaluation &
Metrics
Outreach &
Communications
Planning &
Roadmapping
Analysis &
Modeling
Private Clients
4
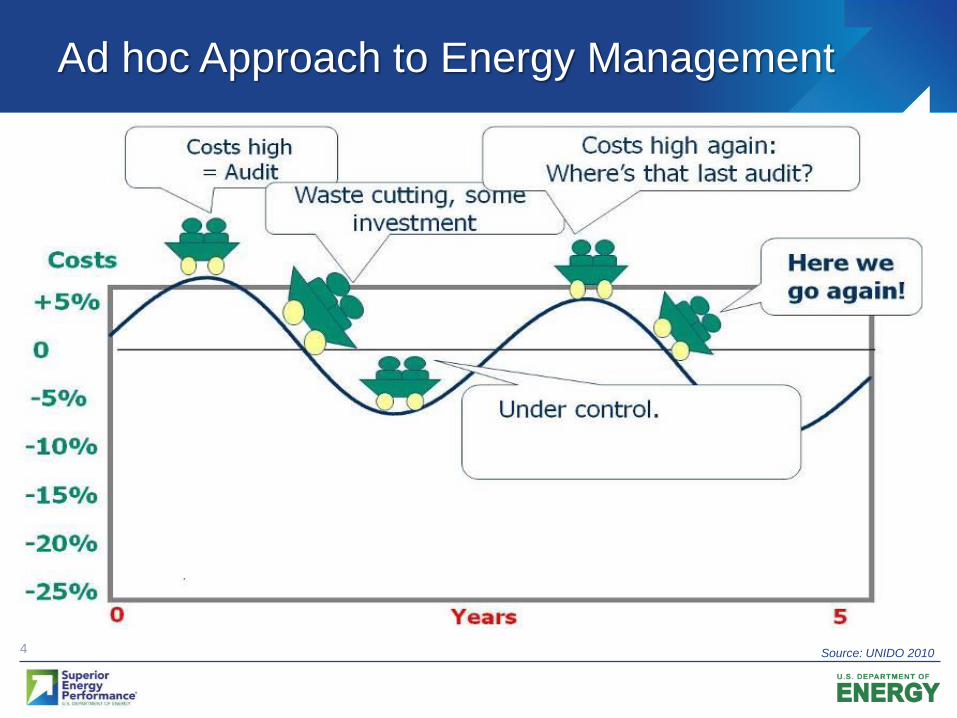
Ad hoc Approach to Energy Management
Source: UNIDO 2010
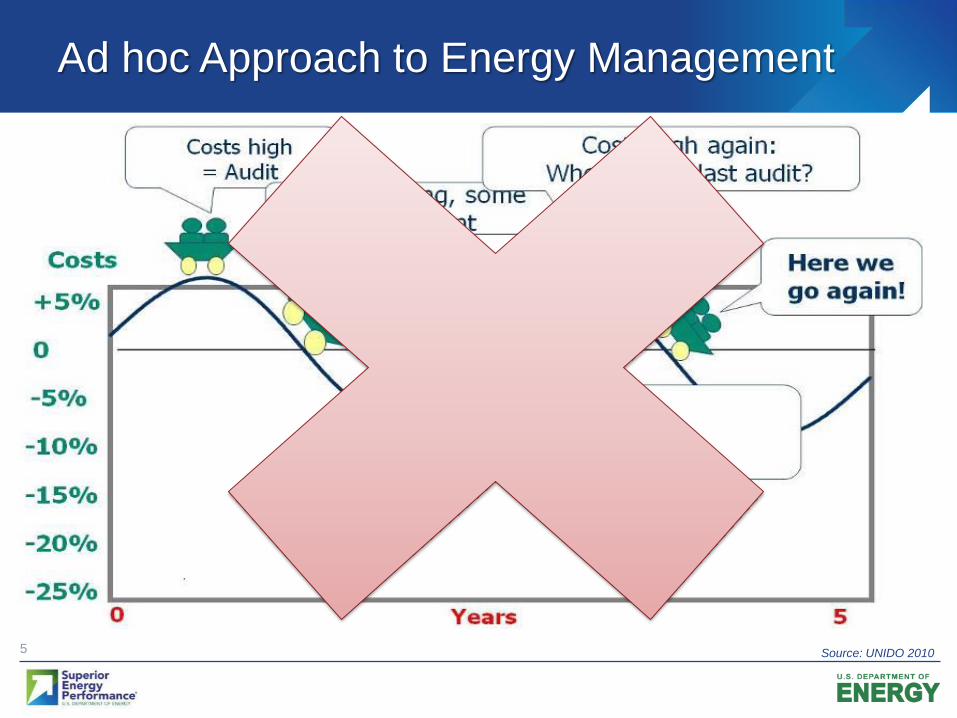
5
Ad hoc Approach to Energy Management
Source: UNIDO 2010
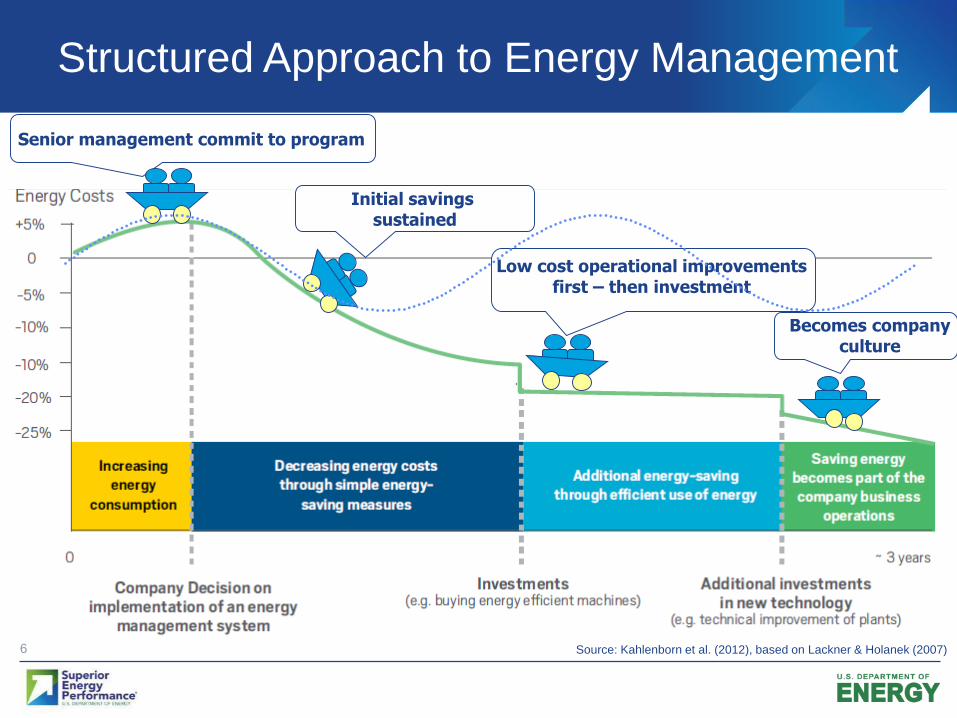
6
Senior management commit to program
Initial savings sustained
Low cost operational improvements first – then investment
Becomes company culture
Source: Kahlenborn et al. (2012), based on Lackner & Holanek (2007)
Structured Approach to Energy Management
7
What is Strategic Energy Management?
Strategic energy management (SEM) is… A culture for continual improvement of energy performance and efficiency
A structured approach that elevates and integrates energy management into
normal business practices--as has previously happened for safety & quality

8
What is Strategic Energy Management?
Source: http://www.smithsonianmag.com/history/lunch-atop-a-skyscraper-photograph-the-story-behind-the-famous-shot-43931148/?no-ist

9
What is Strategic Energy Management?
Strategic energy management (SEM) is… A culture for continual improvement of energy performance and efficiency
A structured approach that elevates and integrates energy management into
normal business practices--as has previously happened for safety & quality
Involves staff from the board room to the shop floor: Organizational change in
culture
Positions your organization to achieve energy and cost savings through informed
decision making
Enables the implementation of energy saving practices for facilities, processes,
equipment and operations.
Organizations of any size can benefit from some form of SEM
So, if you are interested in implementing SEM at your industrial facility, how
should you get started??
10
Getting Started with SEM…
11
Getting Started with SEM…
12
Getting Started with SEM…
13
Getting Started with SEM…
14
Getting Started with SEM…

15
15
Getting Started with SEM…
16
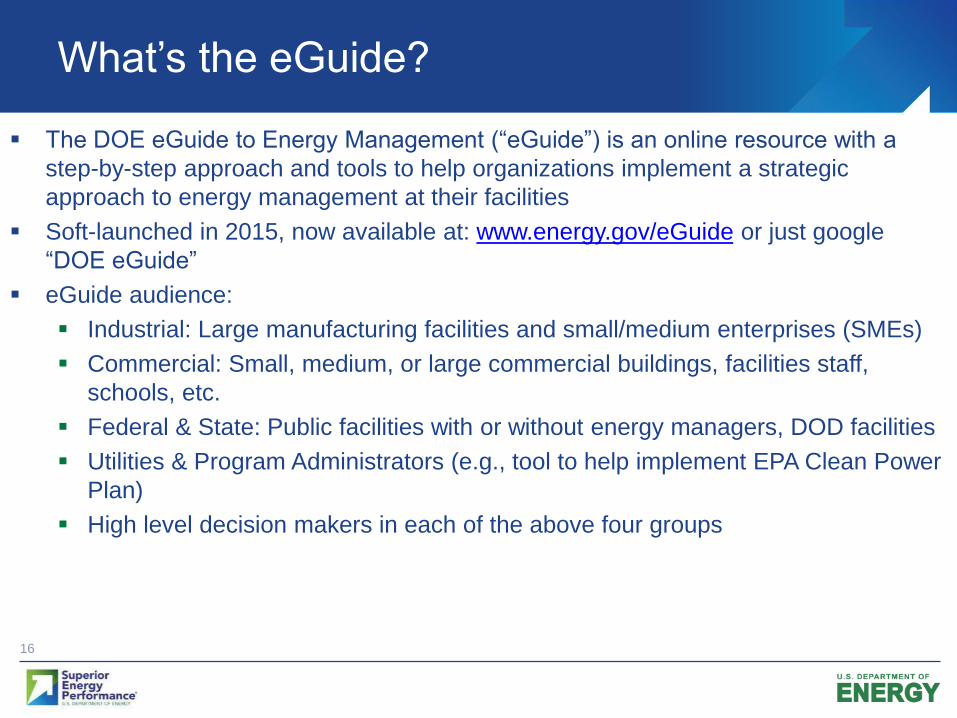
The DOE eGuide to Energy Management (“eGuide”) is an online resource with a
step-by-step approach and tools to help organizations implement a strategic
approach to energy management at their facilities
Soft-launched in 2015, now available at: www.energy.gov/eGuide or just google
“DOE eGuide”
eGuide audience:
Industrial: Large manufacturing facilities and small/medium enterprises (SMEs)
Commercial: Small, medium, or large commercial buildings, facilities staff,
schools, etc.
Federal & State: Public facilities with or without energy managers, DOD facilities
Utilities & Program Administrators (e.g., tool to help implement EPA Clean Power
Plan)
High level decision makers in each of the above four groups
What’s the eGuide?
17
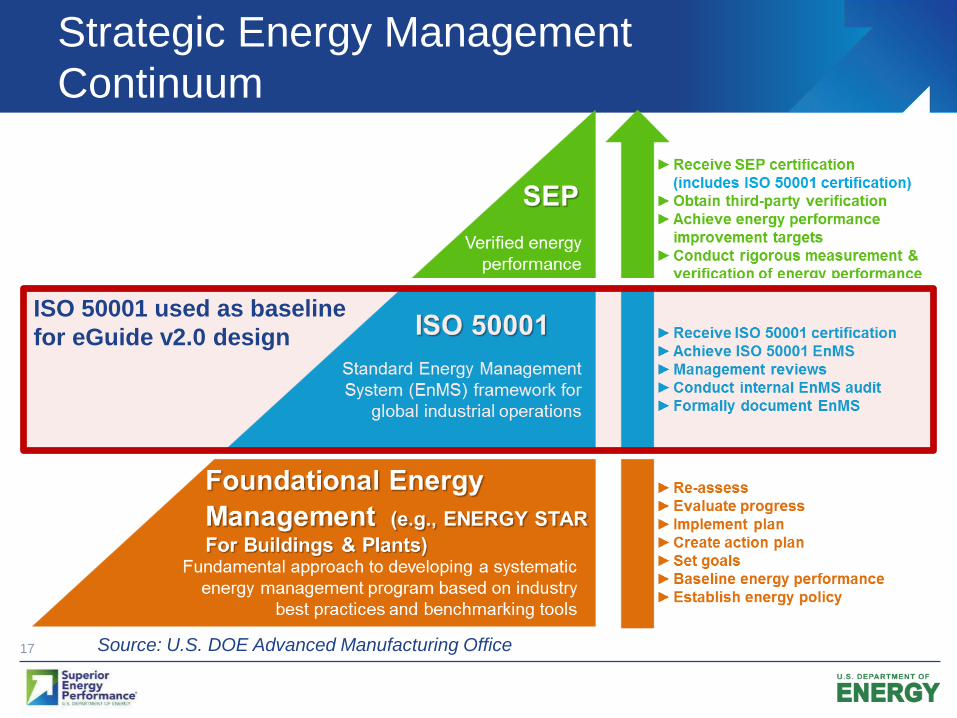
Strategic Energy Management
Continuum
Source: U.S. DOE Advanced Manufacturing Office
ISO 50001 used as baseline
for eGuide v2.0 design

18
ISO 50001–Energy Management Systems (EnMS)
International standard that draws from best practices around the world.
Developed with input from 56 countries, many countries now adopting it as
a national standard.
ISO 50001 specifies
requirements for establishing,
implementing, maintaining
and improving an EnMS.
Light blue text represents new data-driven sections in
ISO 50001 that are not in ISO 9001 & ISO 14001
It does not prescribe
specific energy performance
improvement criteria.
19
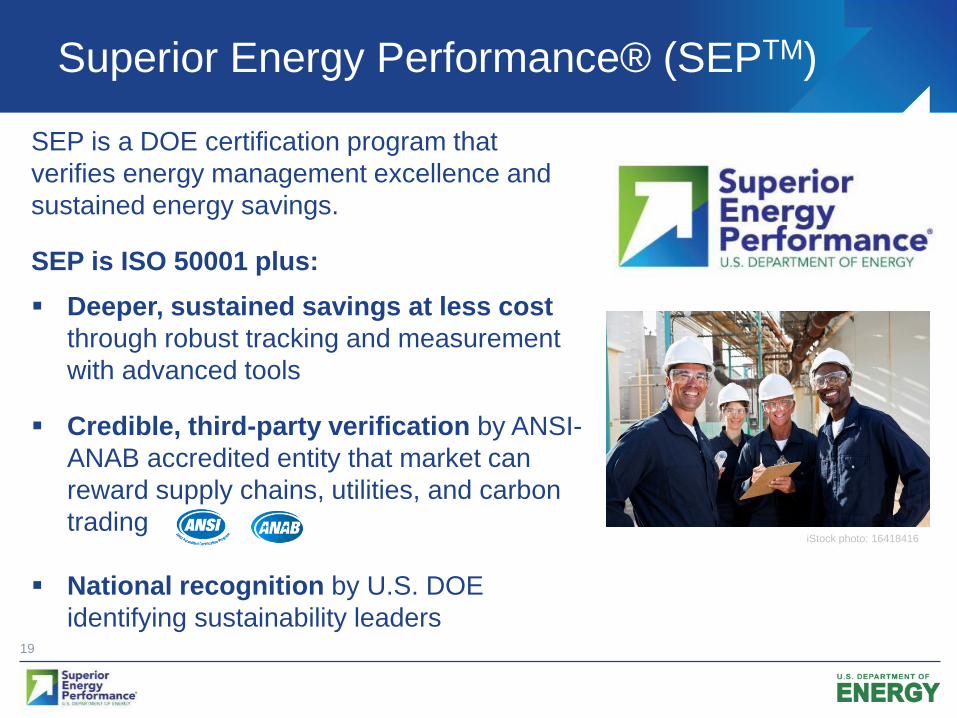
SEP is a DOE certification program that
verifies energy management excellence and
sustained energy savings.
SEP is ISO 50001 plus:
Deeper, sustained savings at less cost
through robust tracking and measurement
with advanced tools
Credible, third-party verification by ANSI-
ANAB accredited entity that market can
reward supply chains, utilities, and carbon
trading
National recognition by U.S. DOE
identifying sustainability leaders
iStock photo: 16418416
Superior Energy Performance® (SEPTM)
20
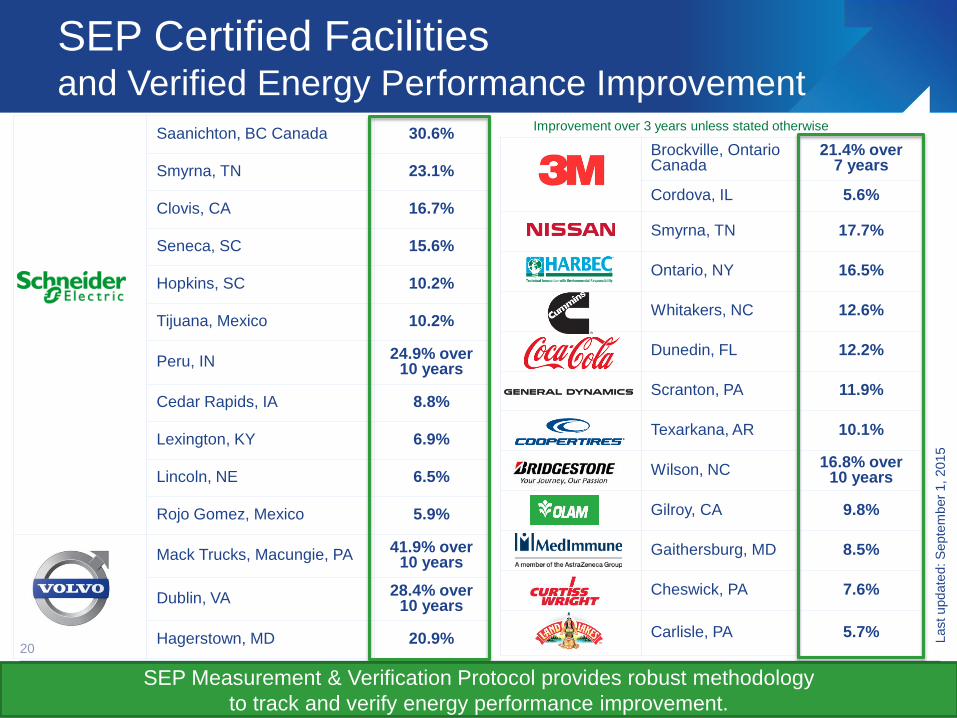
SEP Certified Facilities and Verified Energy Performance Improvement
Brockville, Ontario Canada
21.4% over7 years
Cordova, IL 5.6%
Smyrna, TN 17.7%
Ontario, NY 16.5%
Whitakers, NC 12.6%
Dunedin, FL 12.2%
Scranton, PA 11.9%
Texarkana, AR 10.1%
Wilson, NC16.8% over
10 years
Gilroy, CA 9.8%
Gaithersburg, MD 8.5%
Cheswick, PA 7.6%
Carlisle, PA 5.7%
Saanichton, BC Canada 30.6%
Smyrna, TN 23.1%
Clovis, CA 16.7%
Seneca, SC 15.6%
Hopkins, SC 10.2%
Tijuana, Mexico 10.2%
Peru, IN24.9% over
10 years
Cedar Rapids, IA 8.8%
Lexington, KY 6.9%
Lincoln, NE 6.5%
Rojo Gomez, Mexico 5.9%
Mack Trucks, Macungie, PA41.9% over
10 years
Dublin, VA28.4% over
10 years
Hagerstown, MD 20.9% Last update
d: S
epte
mber
1, 2015
Improvement over 3 years unless stated otherwise
SEP Measurement & Verification Protocol provides robust methodology
to track and verify energy performance improvement.
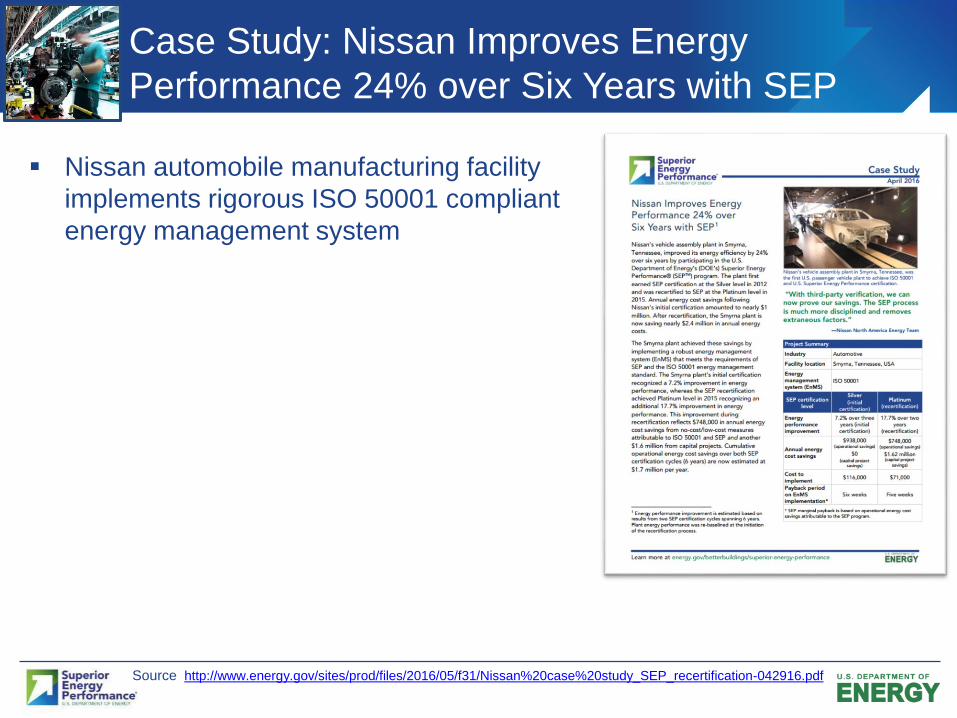
Nissan automobile manufacturing facility
implements rigorous ISO 50001 compliant
energy management system
Case Study: Nissan Improves Energy
Performance 24% over Six Years with SEP
Source http://www.energy.gov/sites/prod/files/2016/05/f31/Nissan%20case%20study_SEP_recertification-042916.pdf
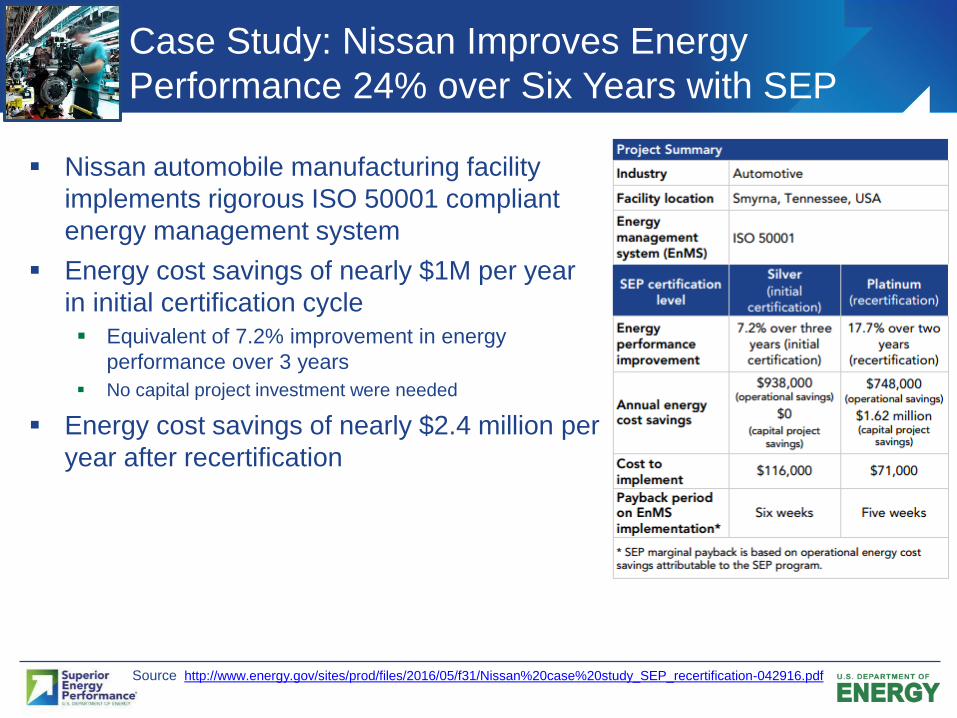
Nissan automobile manufacturing facility
implements rigorous ISO 50001 compliant
energy management system
Energy cost savings of nearly $1M per year
in initial certification cycle
Equivalent of 7.2% improvement in energy
performance over 3 years
No capital project investment were needed
Energy cost savings of nearly $2.4 million per
year after recertification
Case Study: Nissan Improves Energy
Performance 24% over Six Years with SEP
Source http://www.energy.gov/sites/prod/files/2016/05/f31/Nissan%20case%20study_SEP_recertification-042916.pdf
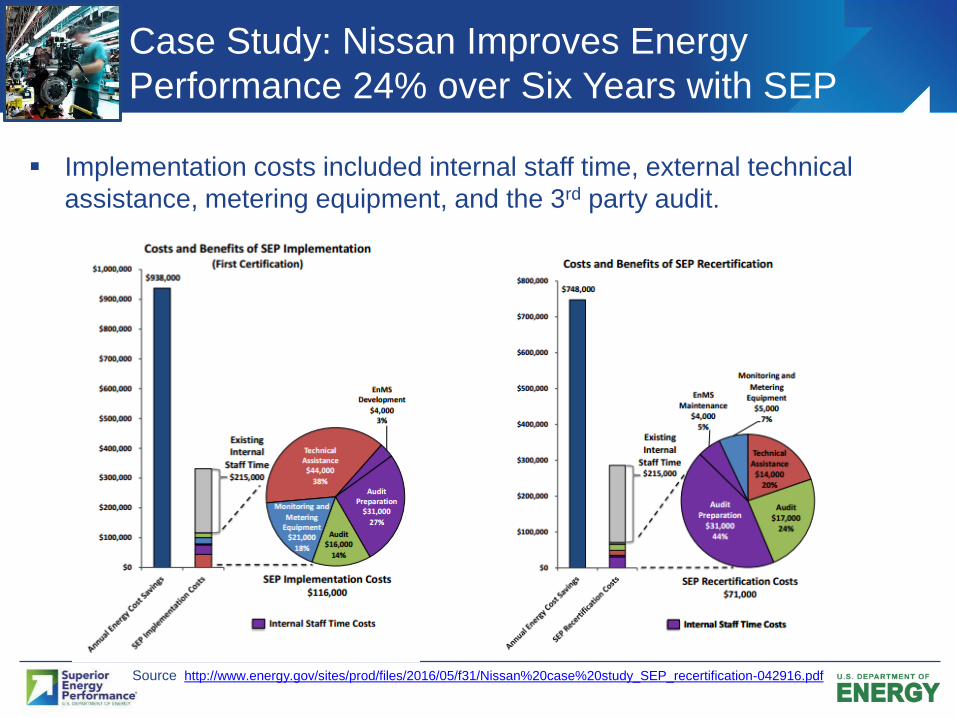
Implementation costs included internal staff time, external technical
assistance, metering equipment, and the 3rd party audit.
Case Study: Nissan Improves Energy
Performance 24% over Six Years with SEP
Source http://www.energy.gov/sites/prod/files/2016/05/f31/Nissan%20case%20study_SEP_recertification-042916.pdf
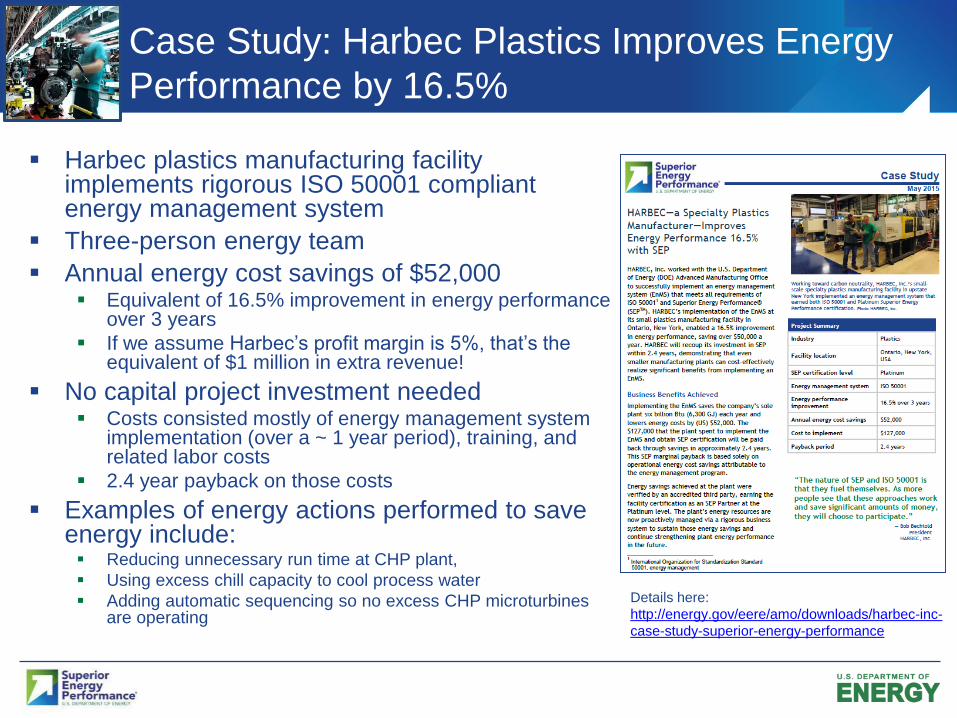
Harbec plastics manufacturing facility implements rigorous ISO 50001 compliant energy management system
Three-person energy team
Annual energy cost savings of $52,000 Equivalent of 16.5% improvement in energy performance
over 3 years
If we assume Harbec’s profit margin is 5%, that’s the equivalent of $1 million in extra revenue!
No capital project investment needed Costs consisted mostly of energy management system
implementation (over a ~ 1 year period), training, and related labor costs
2.4 year payback on those costs
Examples of energy actions performed to save energy include: Reducing unnecessary run time at CHP plant,
Using excess chill capacity to cool process water
Adding automatic sequencing so no excess CHP microturbinesare operating
Case Study: Harbec Plastics Improves Energy
Performance by 16.5%
Details here:
http://energy.gov/eere/amo/downloads/harbec-inc-
case-study-superior-energy-performance

25
Strategic Energy Management
Continuum
Source: U.S. DOE Advanced Manufacturing Office
ISO 50001 used as baseline
for eGuide v2.0 design
26
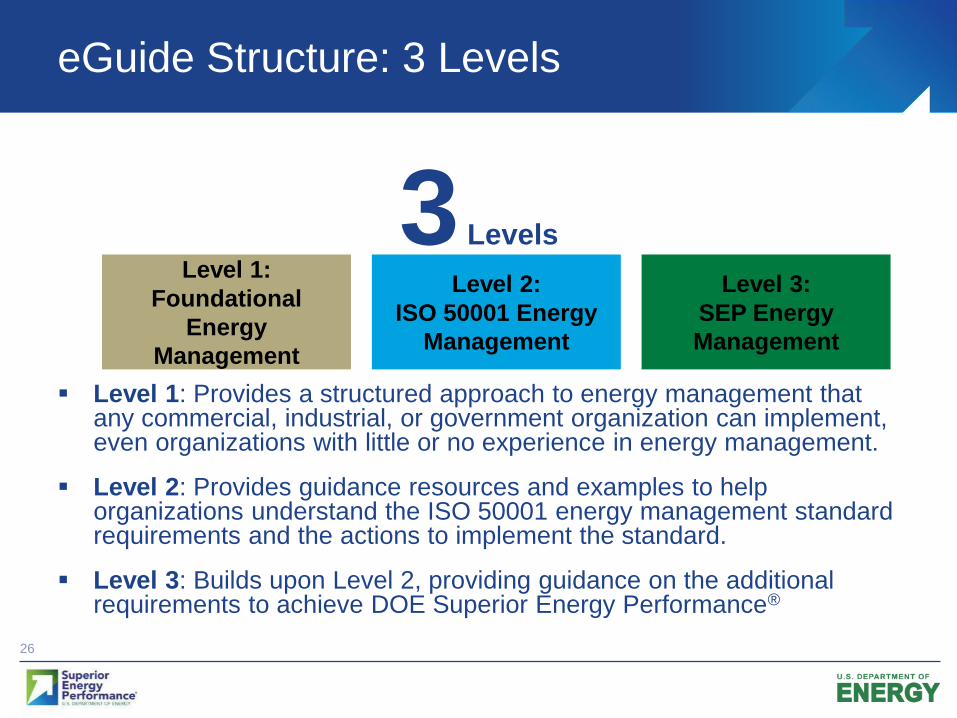
3 Levels
Level 1: Provides a structured approach to energy management that any commercial, industrial, or government organization can implement, even organizations with little or no experience in energy management.
Level 2: Provides guidance resources and examples to help organizations understand the ISO 50001 energy management standard requirements and the actions to implement the standard.
Level 3: Builds upon Level 2, providing guidance on the additional requirements to achieve DOE Superior Energy Performance®
eGuide Structure: 3 Levels
Level 1:
Foundational
Energy
Management
Level 2:
ISO 50001 Energy
Management
Level 3:
SEP Energy
Management
27
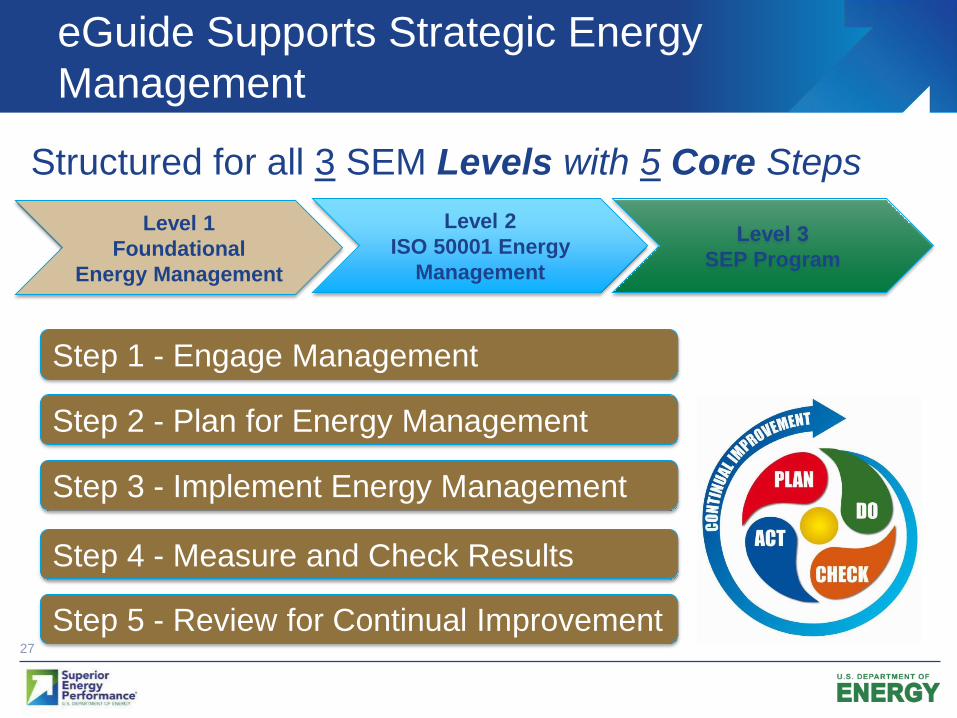
eGuide Supports Strategic Energy
Management
Structured for all 3 SEM Levels with 5 Core Steps
Step 1 - Engage Management
Step 2 - Plan for Energy Management
Step 3 - Implement Energy Management
Step 4 - Measure and Check Results
Step 5 - Review for Continual Improvement
Level 1
Foundational
Energy Management
Level 2
ISO 50001 Energy
Management
Level 3
SEP Program
28
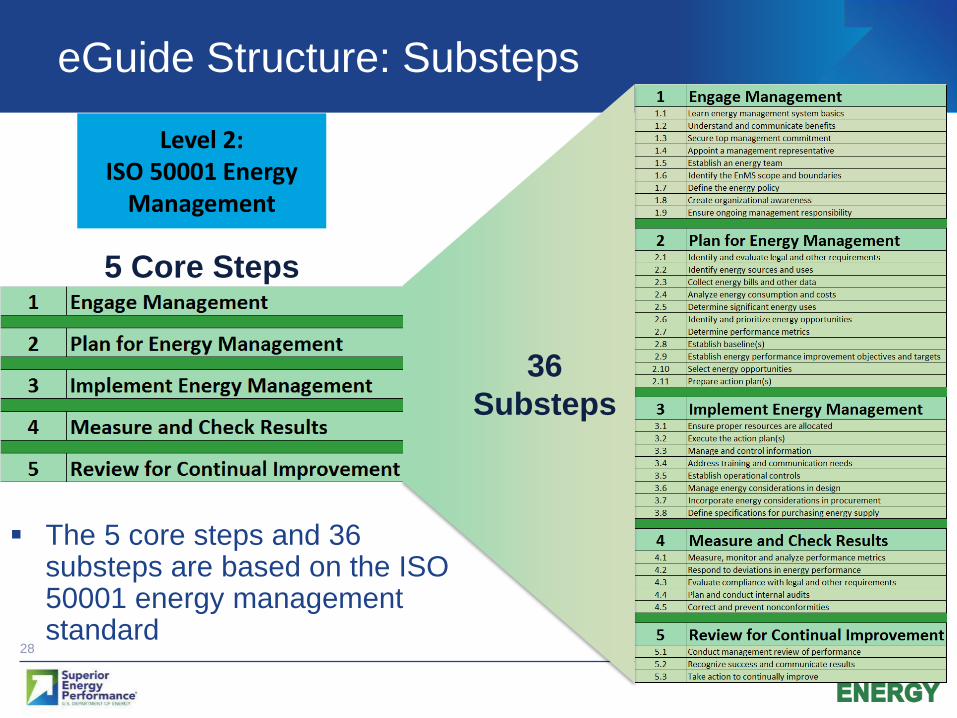
eGuide Structure: Substeps
Level 2:ISO 50001 Energy
Management
36
Substeps
The 5 core steps and 36 substeps are based on the ISO 50001 energy management standard
5 Core Steps
29
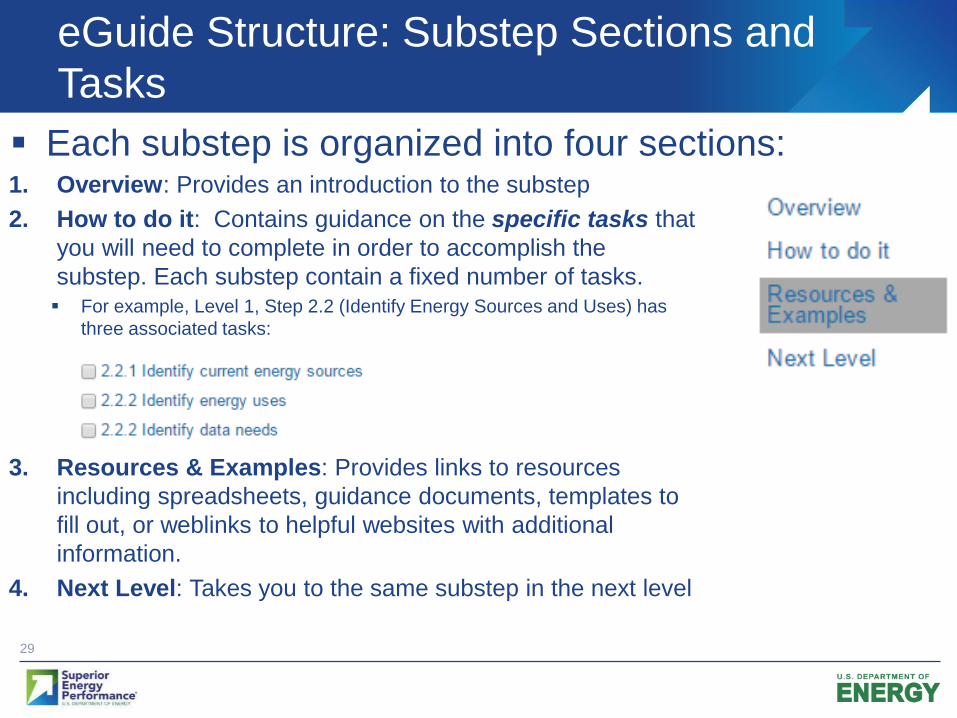
Each substep is organized into four sections:
eGuide Structure: Substep Sections and
Tasks
1. Overview: Provides an introduction to the substep
2. How to do it: Contains guidance on the specific tasks that
you will need to complete in order to accomplish the
substep. Each substep contain a fixed number of tasks. For example, Level 1, Step 2.2 (Identify Energy Sources and Uses) has
three associated tasks:
3. Resources & Examples: Provides links to resources
including spreadsheets, guidance documents, templates to
fill out, or weblinks to helpful websites with additional
information.
4. Next Level: Takes you to the same substep in the next level
30
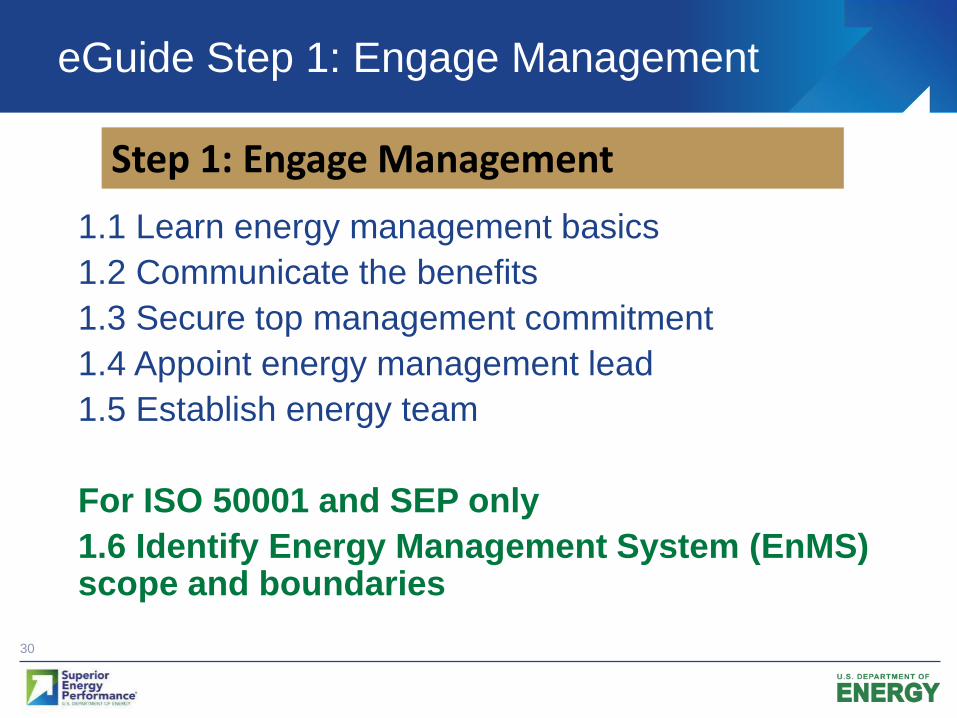
eGuide Step 1: Engage Management
1.1 Learn energy management basics
1.2 Communicate the benefits
1.3 Secure top management commitment
1.4 Appoint energy management lead
1.5 Establish energy team
For ISO 50001 and SEP only
1.6 Identify Energy Management System (EnMS) scope and boundaries
Step 1: Engage Management
31
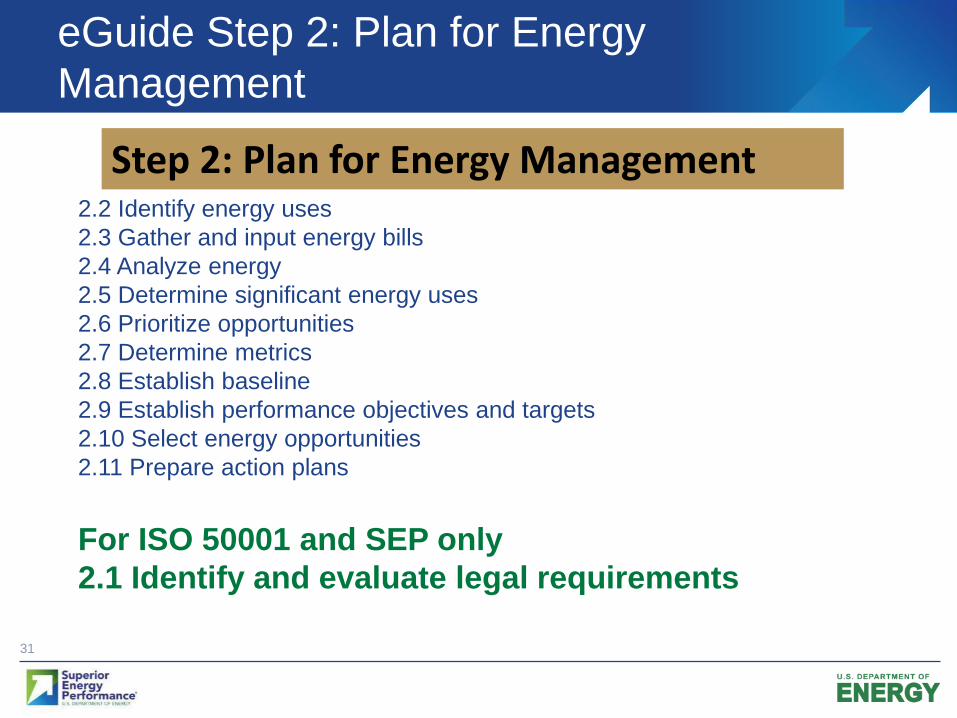
eGuide Step 2: Plan for Energy
Management
2.2 Identify energy uses
2.3 Gather and input energy bills
2.4 Analyze energy
2.5 Determine significant energy uses
2.6 Prioritize opportunities
2.7 Determine metrics
2.8 Establish baseline
2.9 Establish performance objectives and targets
2.10 Select energy opportunities
2.11 Prepare action plans
For ISO 50001 and SEP only
2.1 Identify and evaluate legal requirements
Step 2: Plan for Energy Management
32
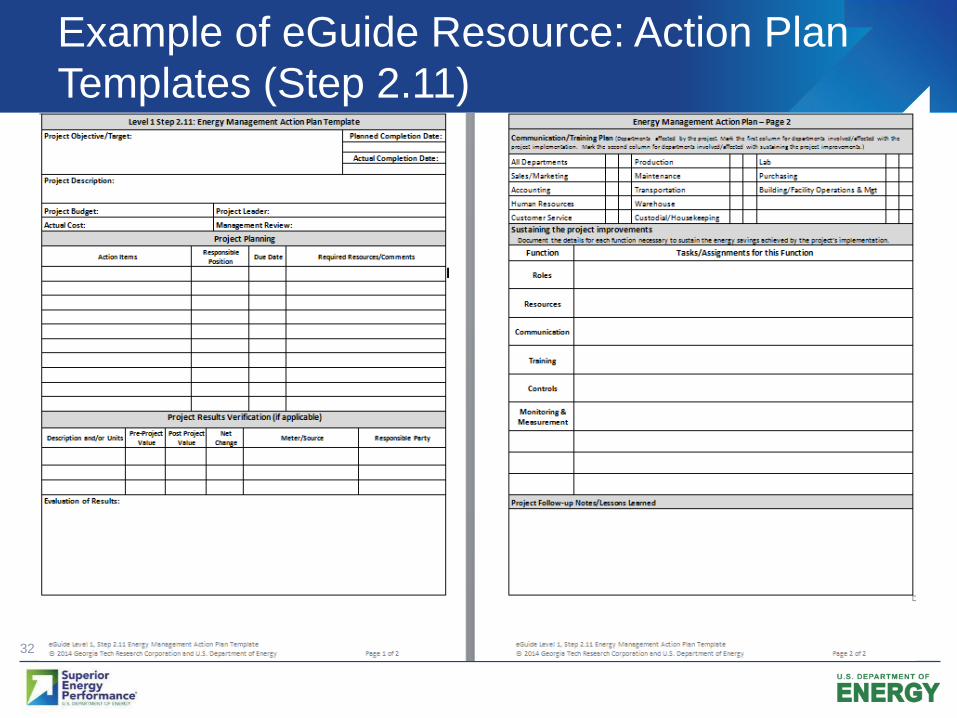
Example of eGuide Resource: Action Plan
Templates (Step 2.11)
33
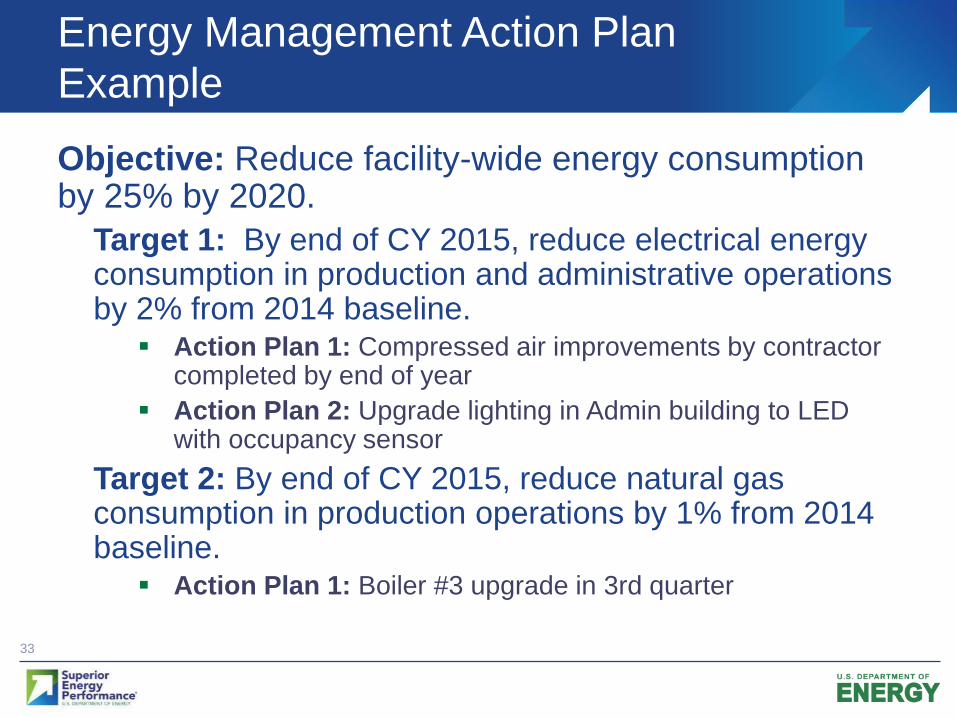
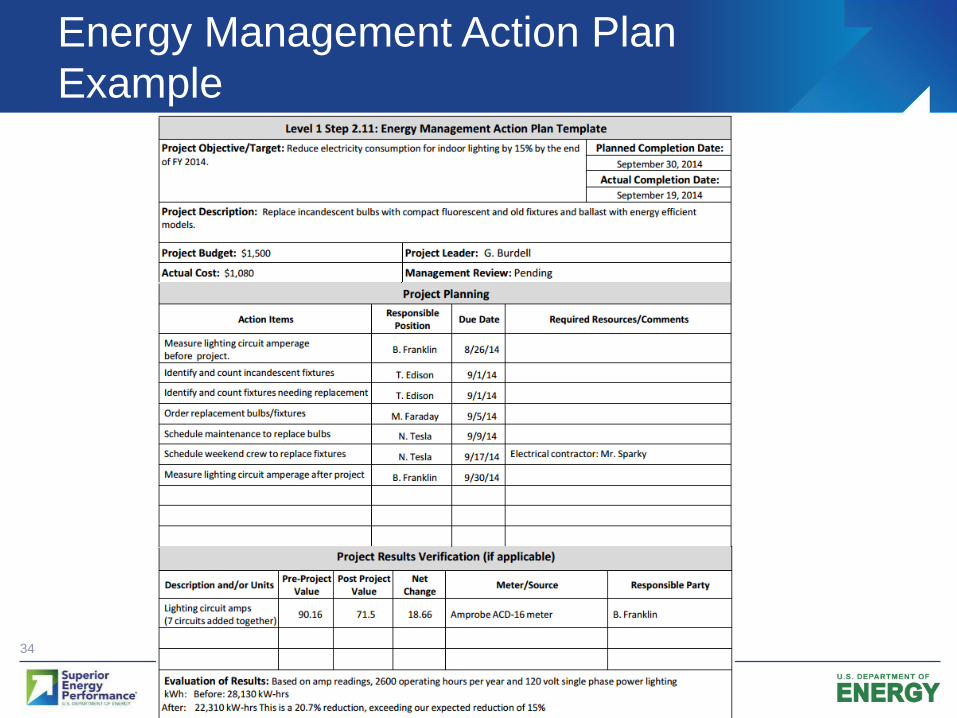
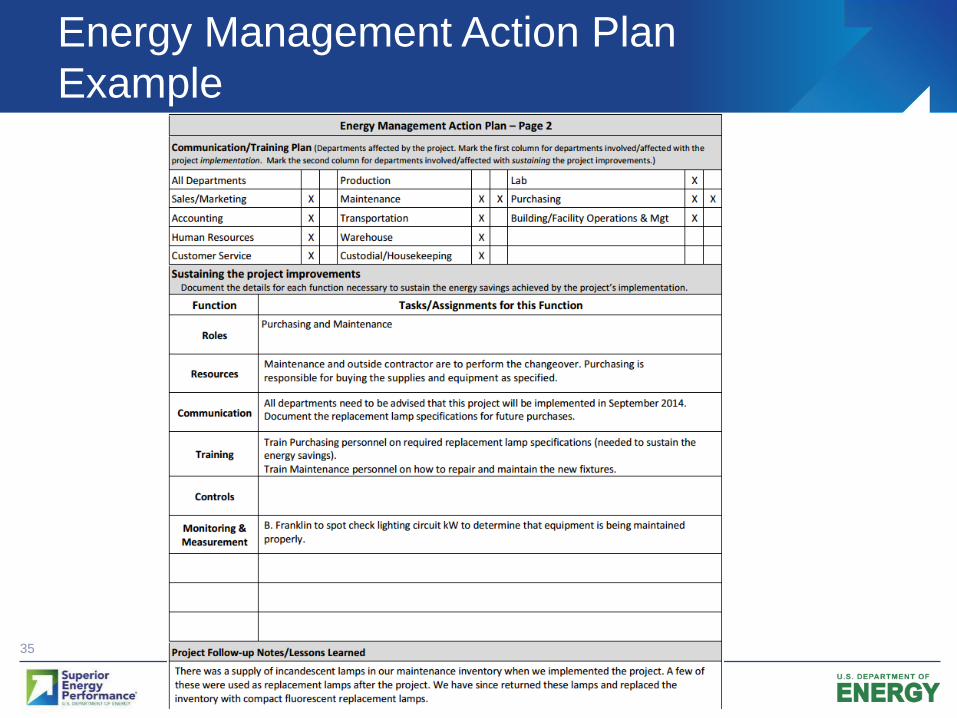
Energy Management Action Plan
Example
Objective: Reduce facility-wide energy consumption by 25% by 2020.
Target 1: By end of CY 2015, reduce electrical energy consumption in production and administrative operations by 2% from 2014 baseline.
Action Plan 1: Compressed air improvements by contractor completed by end of year
Action Plan 2: Upgrade lighting in Admin building to LED with occupancy sensor
Target 2: By end of CY 2015, reduce natural gas consumption in production operations by 1% from 2014 baseline.
Action Plan 1: Boiler #3 upgrade in 3rd quarter
34
Energy Management Action Plan
Example
35
Energy Management Action Plan
Example

36
Example of eGuide Resource: Energy
Performance Indicator (EnPI) Tool
EnPI tool features
Regression analysis
Tracking of energy performance
improvement on a non-normalized basis
Corporate roll-up across multiple facilities
Inputs:
Monthly or weekly energy consumption
data and other variables (e.g., HDD,
CDD, production, etc)
Outputs:
Energy savings, cost savings, CO2-e
savings
More information on the tool—including
download instructions: https://ecenter.ee.doe.gov/EM/tools/Pages/EnPI.aspx
EnPI is a free, excel-based energy performance tracking tool
Tool purpose: assist organizations in calculating energy performance
indicators while normalizing for variables such as weather, production,
occupancy, etc.

37
Example of eGuide Resource: Energy
Footprint Tool
Allows users to easily track multiple energy sources,
consumption, related factors, and energy end-uses
Key tracking & features include:
Energy consumption Up to 20 tracked sources
Related factors Up to 20 tracked factors
Energy end-use Up to 10 end-use groups
Up to 30 components each
Charts for all tracked data
Export to the EnPI toolMore information on the tool—including
download instructions: https://ecenter.ee.doe.gov/EM/tools/Pages/EnergyFootprint.aspx
38
eGuide Step 3: Implement Energy
Management
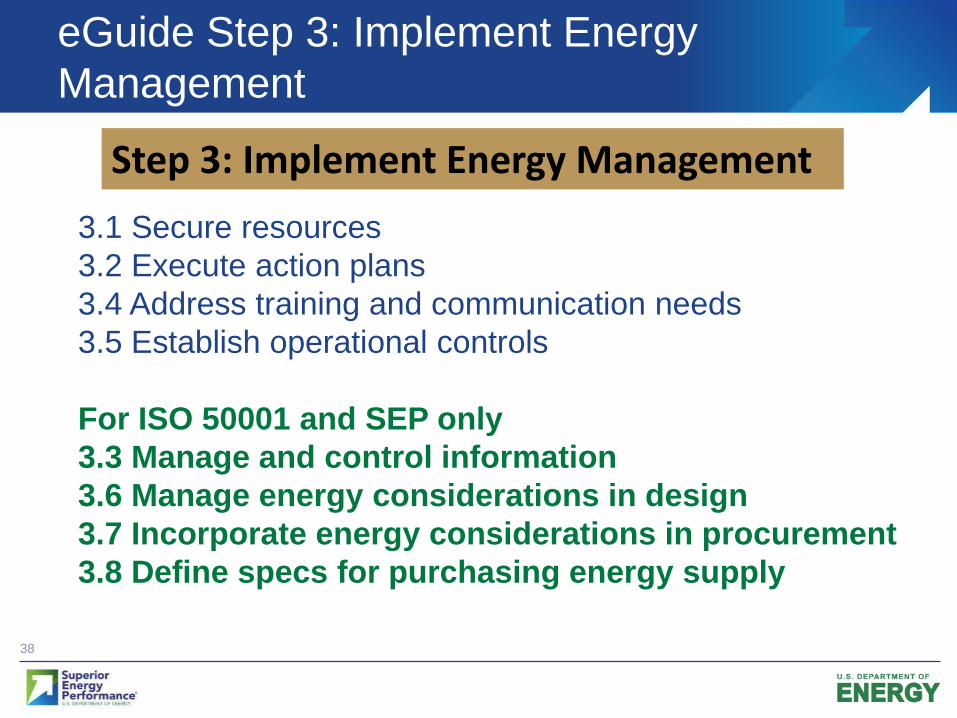
3.1 Secure resources
3.2 Execute action plans
3.4 Address training and communication needs
3.5 Establish operational controls
For ISO 50001 and SEP only
3.3 Manage and control information
3.6 Manage energy considerations in design
3.7 Incorporate energy considerations in procurement
3.8 Define specs for purchasing energy supply
Step 3: Implement Energy Management
39
eGuide Step 4: Measure and Check
Results
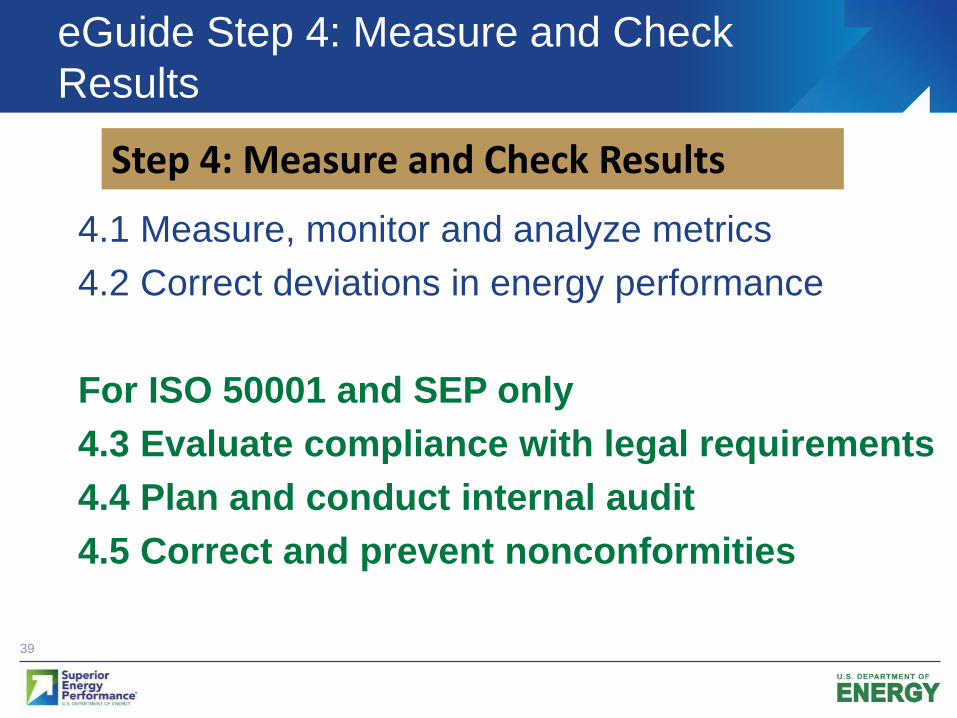
4.1 Measure, monitor and analyze metrics
4.2 Correct deviations in energy performance
For ISO 50001 and SEP only
4.3 Evaluate compliance with legal requirements
4.4 Plan and conduct internal audit
4.5 Correct and prevent nonconformities
Step 4: Measure and Check Results

40
eGuide Step 5: Review for Continual
Improvement
5.1 Management review of performance
5.2 Recognize success and communicate results
5.3 Take action to continually improve
Step 5: Review for Continual Improvement
41
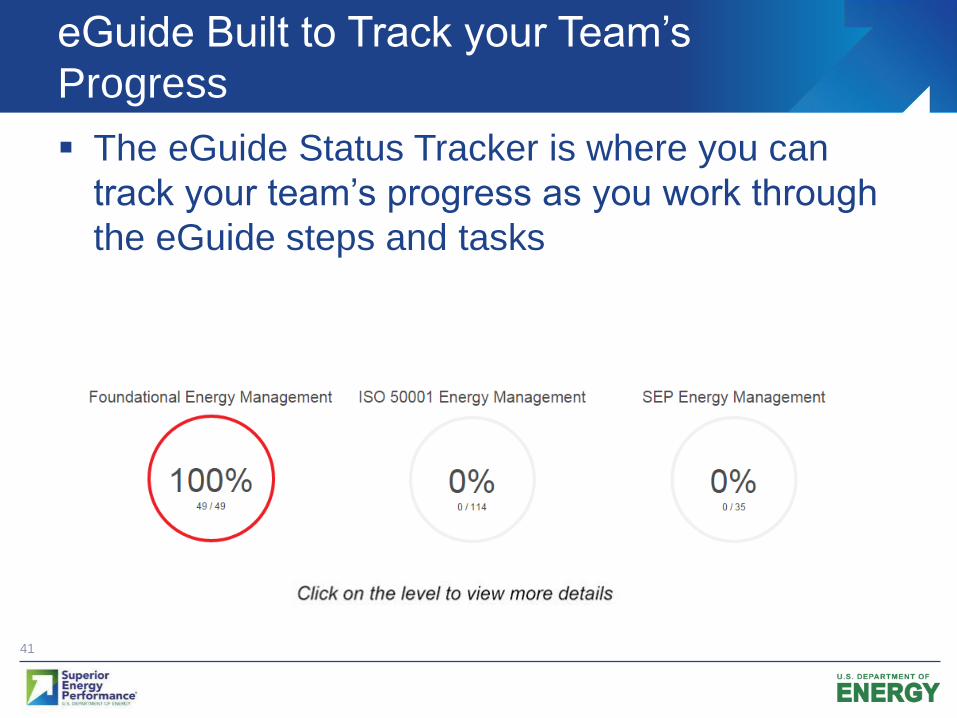
The eGuide Status Tracker is where you can
track your team’s progress as you work through
the eGuide steps and tasks
eGuide Built to Track your Team’s
Progress
42
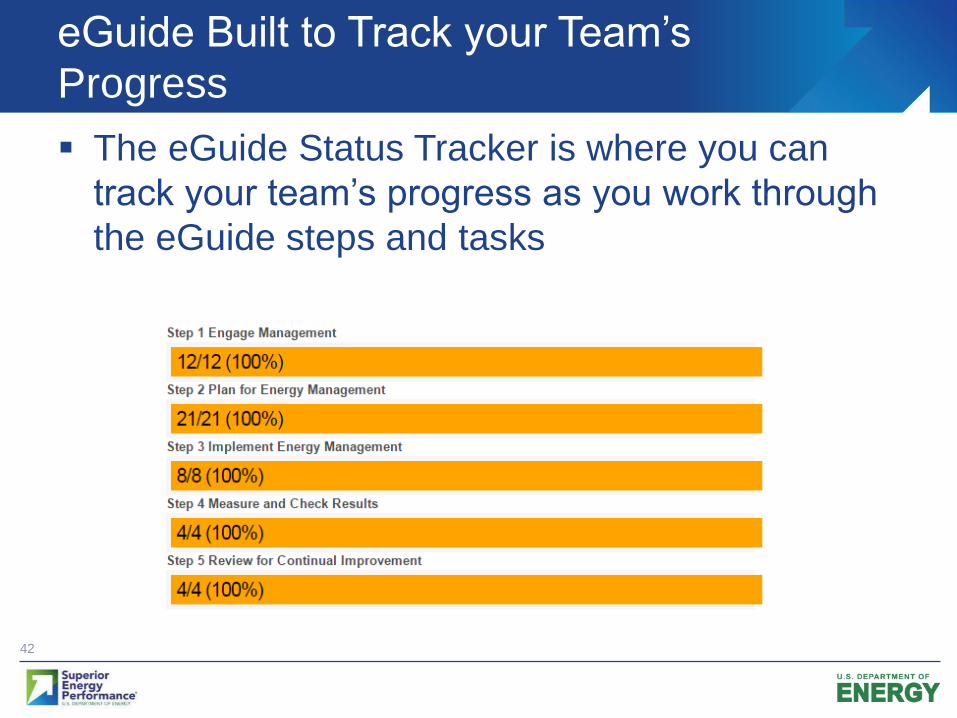
The eGuide Status Tracker is where you can
track your team’s progress as you work through
the eGuide steps and tasks
eGuide Built to Track your Team’s
Progress
43
eGuide is a valuable tool to help industrial facilities more easily and
more effectively implement a strategic energy management
program, including ISO 50001 and Superior Energy Performance
eGuide is designed to be a resource and source of information and
tools at any stage of a SEM program’s development
eGuide resources include:
Templates and worksheets such as action plan templates or energy
team rosters
Energy Footprint Tool
EnPI Tool
Helpful links with more information
Go to www.energy.gov/eGuide and explore!
Contact me if you if you have any eGuide feedback
Take-Aways

45
Columbia, MD ● Washington, DC ● Utica, NY ● Dubai, UAE
www.energetics.com
www.linkedin.com/company/energetics
Thank you! Any questions?
Ridah SabouniSenior Engineer (PMP, CEM, CMVP)
202-681-4743
www.energy.gov/eGuide
Click To Edit Master
Title Style
Energy Treasure Hunt
Exchanges
1
Robert Bruce
Lung, ORISE
Fellow, U.S. DOE
May 23, 2016
Better Buildings, Better Plants
Better Plants is a key component of the
President’s Better Buildings Initiative
Industrial end users partner with DOE to
improve energy efficiency
Through Better Plants:
Organizations set long-term efficiency goals
DOE provides technical assistance and national
recognition for their leadership
Organizations have two opportunities to
engage in Better Plants:
1. Broader-based Program level
2. Higher-level Challenge
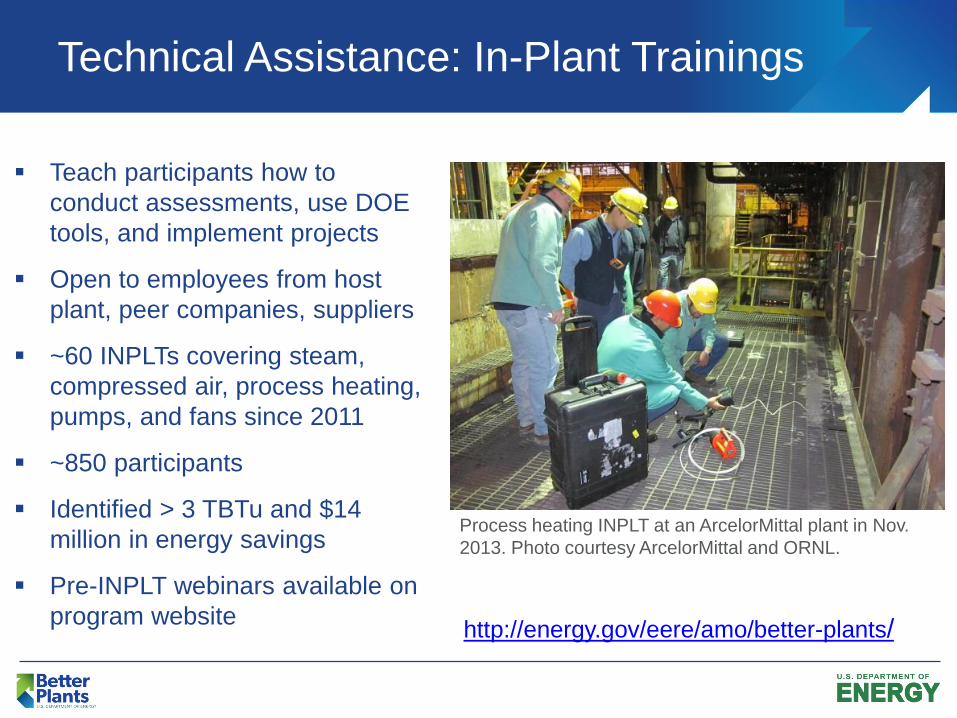
Technical Assistance: In-Plant Trainings
Teach participants how to
conduct assessments, use DOE
tools, and implement projects
Open to employees from host
plant, peer companies, suppliers
~60 INPLTs covering steam,
compressed air, process heating,
pumps, and fans since 2011
~850 participants
Identified > 3 TBTu and $14
million in energy savings
Pre-INPLT webinars available on
program website
Process heating INPLT at an ArcelorMittal plant in Nov.
2013. Photo courtesy ArcelorMittal and ORNL.
http://energy.gov/eere/amo/better-plants/
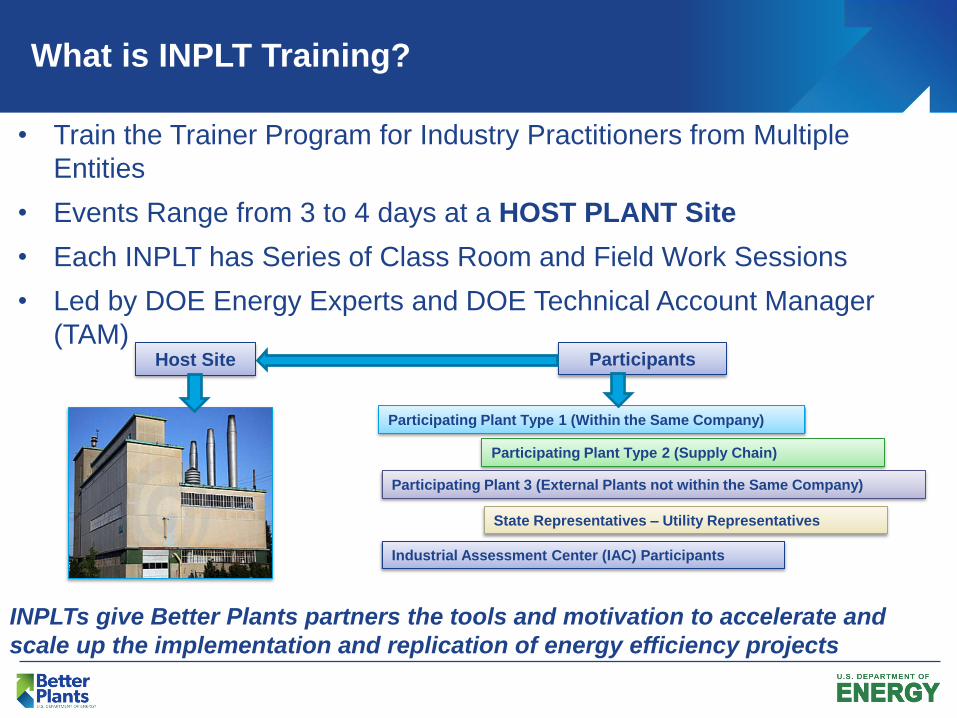
What is INPLT Training?
INPLTs give Better Plants partners the tools and motivation to accelerate and
scale up the implementation and replication of energy efficiency projects
• Train the Trainer Program for Industry Practitioners from Multiple
Entities
• Events Range from 3 to 4 days at a HOST PLANT Site
• Each INPLT has Series of Class Room and Field Work Sessions
• Led by DOE Energy Experts and DOE Technical Account Manager
(TAM)
Participating Plant Type 2 (Supply Chain)
Participating Plant Type 1 (Within the Same Company)
Participating Plant 3 (External Plants not within the Same Company)
Host Site Participants
State Representatives – Utility Representatives
Industrial Assessment Center (IAC) Participants

Identifying Energy Saving Opportunities
Networking (Trainees/Utilities/State/Vendors)
Project Implementation and Replication
Leveraging Resources (State/Utilities/Peer Plants)
Training in a Real World Environment
INPLT Model - The Five Major Objectives
A three day training event focused on:
• Learning how to conduct treasure hunts and doing
one in your plant
• Four elements DOE brings to treasure hunt
exchange:
• Profiling energy-using equipment
• Data collection
• Energy calculators/calculation methods
• Relevant diagnostic equipment
6
Overview – Treasure Hunt Exchange
Advantages of a Treasure Hunt Exchange
• A Treasure Hunt Exchange is both a training and treasure
hunt • Does not require sophisticated technical analysis
• Calculations are simple
• Can be applied by employees of varying disciplines
• At least one employee will be able to facilitate future energy
treasure hunts
• Places a dollar and Btu value on ideas immediately
• Ideas that employees have generated
• Opportunity ideas are solicited from many disciplines not just
technical / engineering
• Leverages existing EPA Guidance on energy treasure hunts
(https://www.energystar.gov/sites/default/files/buildings/tools/Energy_Treasure_Hunt_Guide_Jan2014.pdf)
Advantages of a Treasure Hunt Exchange
• Opportunities can be implemented rapidly
• Opportunities can be replicated across similar processes
and businesses
• The Treasure Hunt process can be replicated and
repeated (through this training)
• Management “buy in” can be achieved during the
Treasure Hunt Exchange
• Historically more than 50% of opportunities are
implemented
All Participants: • Understand what is a treasure hunt exchange
• Understand the value/benefits of a treasure hunt
exchange
• Understand how to evaluate equipment energy use
(both idle and non-idle times)
• How to identify equipment and process opportunities
• Understand methods for collecting energy data and
common data collection tools
• Understand how to effectively present outcomes of the
treasure hunt
9
Learning Objectives
Learning objectives for future facilitators
• Treasure hunt facilitation
• Use of Tools to calculate opportunity value
• What to look for in a treasure hunt
• How to select processes, plants, departments for treasure hunts
• Use of diagnostic tools and techniques
• The importance of Team makeup – processes and people
• Prioritizing energy-saving opportunities
• Replication across facilities, departments, business units
• Preparation of treasure hunt outcome for management presentation

Energy Treasure Hunt Vs. Expert Assessment
Treasure Hunt Frequently repeatable process
(repeat annually, quarterly . . . )
Internal resources
Focus on operational
opportunities
Expert Assessment Standalone event (assess as
needed)
External resources
Focus on system performance
and technology
Treasure Hunts
Expert Assessment
No Cost
Low Cost
Capital
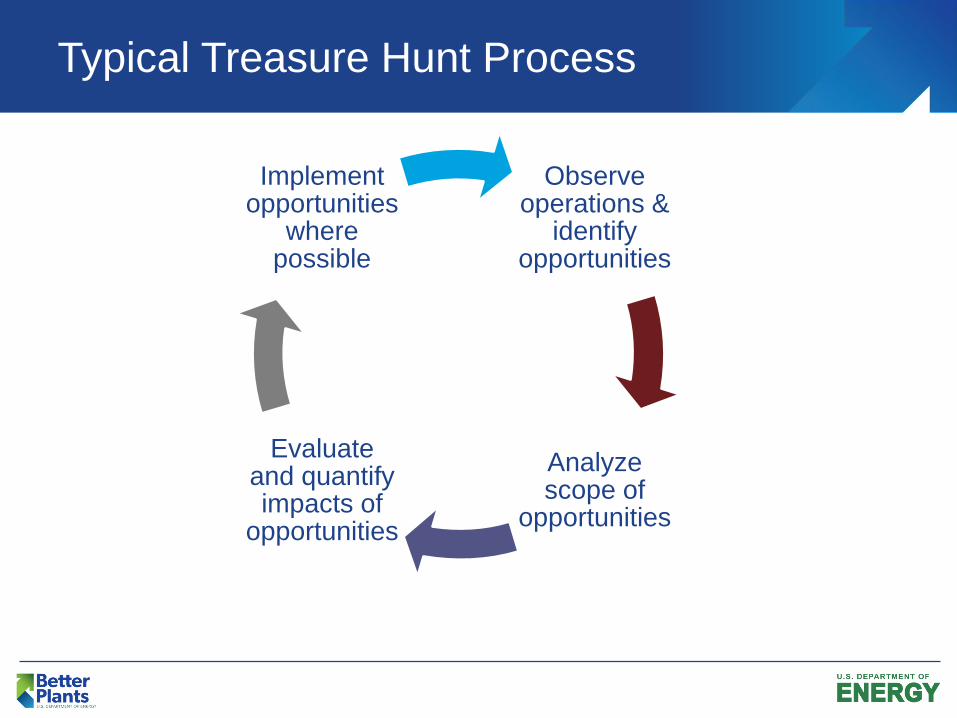
Typical Treasure Hunt Process
Observe operations &
identify opportunities
Analyze scope of
opportunities
Evaluate and quantify impacts of
opportunities
Implement opportunities
where possible
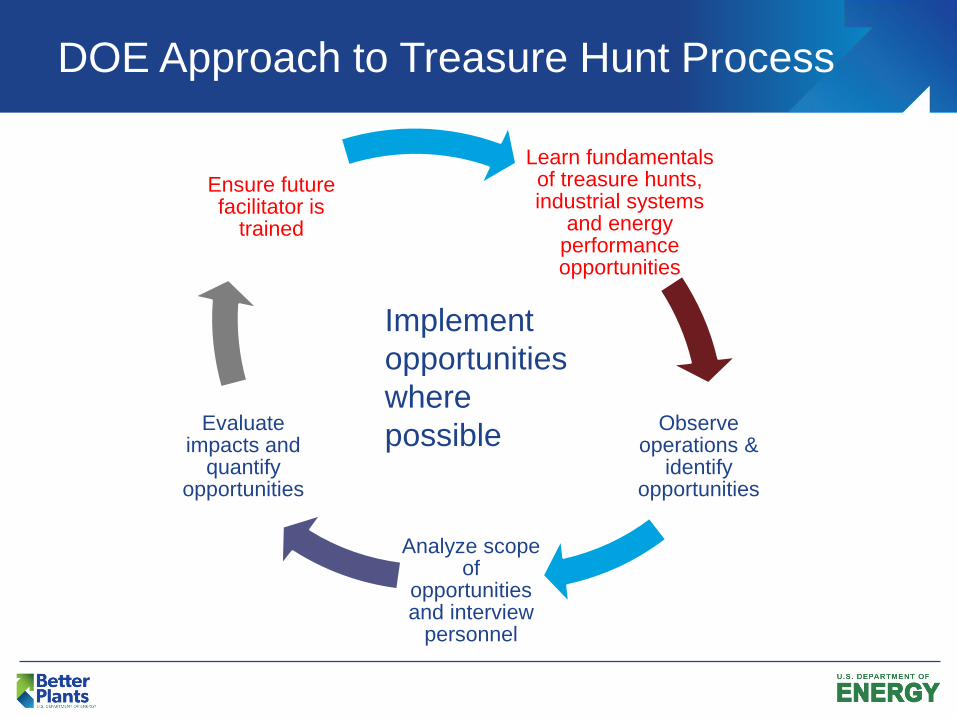
DOE Approach to Treasure Hunt Process
Learn fundamentals of treasure hunts, industrial systems
and energy performance opportunities
Observe operations &
identify opportunities
Analyze scope of
opportunities and interview
personnel
Evaluate impacts and
quantify opportunities
Ensure future facilitator is
trained
Implement
opportunities
where
possible

Advantages of a Treasure Hunt Exchange
• Opportunities can be implemented rapidly
• Opportunities can be replicated across similar processes
and businesses
• The Treasure Hunt Exchange process can be replicated
and repeated (through this training)
• Management “buy in” can be achieved during the
Treasure Hunt Exchange
• Historically more than 50% of opportunities are
implemented

Energy Culture
• All departments have a role to play
in improving energy efficiency •Successful energy programs are horizontal in an organization, not vertical
Pro
duction
Safety
Human Resources
Environmental
Energy
Ma
inte
nance
Pro
cure
ment
Engin
eering
Pro
jects
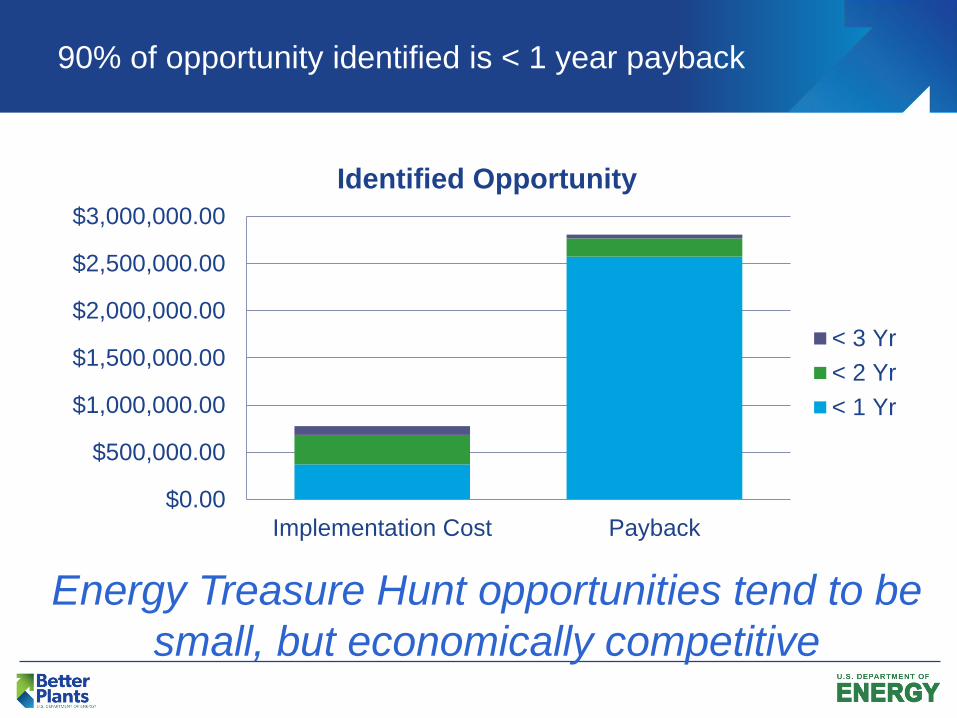
90% of opportunity identified is < 1 year payback
$0.00
$500,000.00
$1,000,000.00
$1,500,000.00
$2,000,000.00
$2,500,000.00
$3,000,000.00
Implementation Cost Payback
Identified Opportunity
< 3 Yr
< 2 Yr
< 1 Yr
Energy Treasure Hunt opportunities tend to be
small, but economically competitive
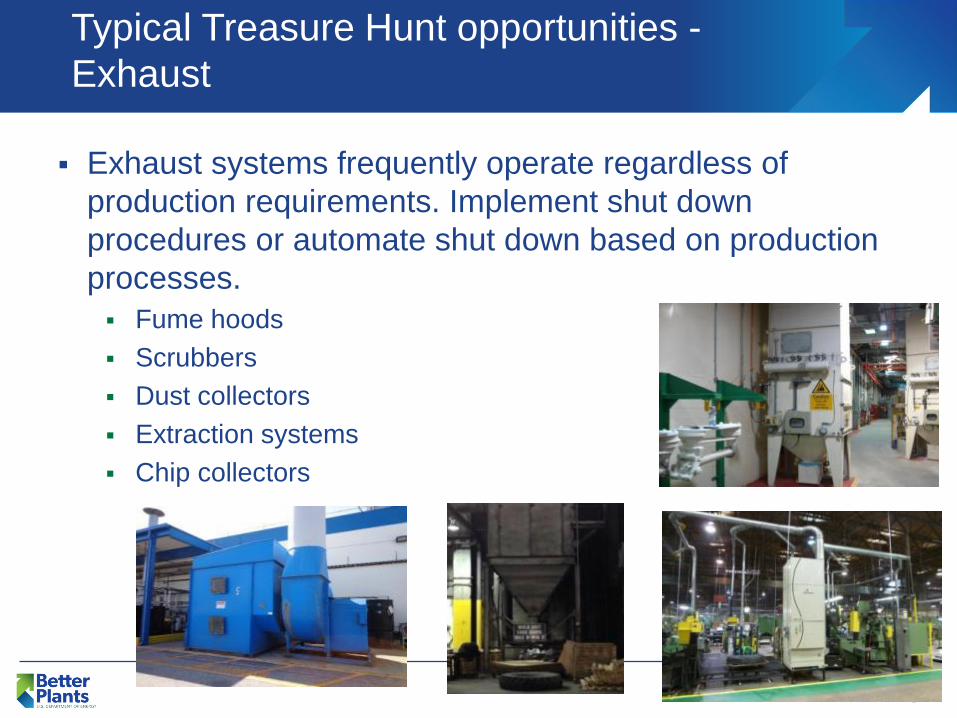
Typical Treasure Hunt opportunities -
Exhaust
Exhaust systems frequently operate regardless of
production requirements. Implement shut down
procedures or automate shut down based on production
processes.
Fume hoods
Scrubbers
Dust collectors
Extraction systems
Chip collectors

Typical Treasure Hunt opportunities –
Lighting
Lighting
Assess where day lighting possible and experiment by
dimming or turning off lights.
Suggest shut down procedures or install occupancy
sensors and calculate the savings.
Identify unnecessary lighting such as tops of ovens,
warehouse shelves, and storage areas.
Retrofit lighting with more efficient technology
LED technology can save more on maintenance than
energy in some applications
Typical Treasure Hunt opportunities –
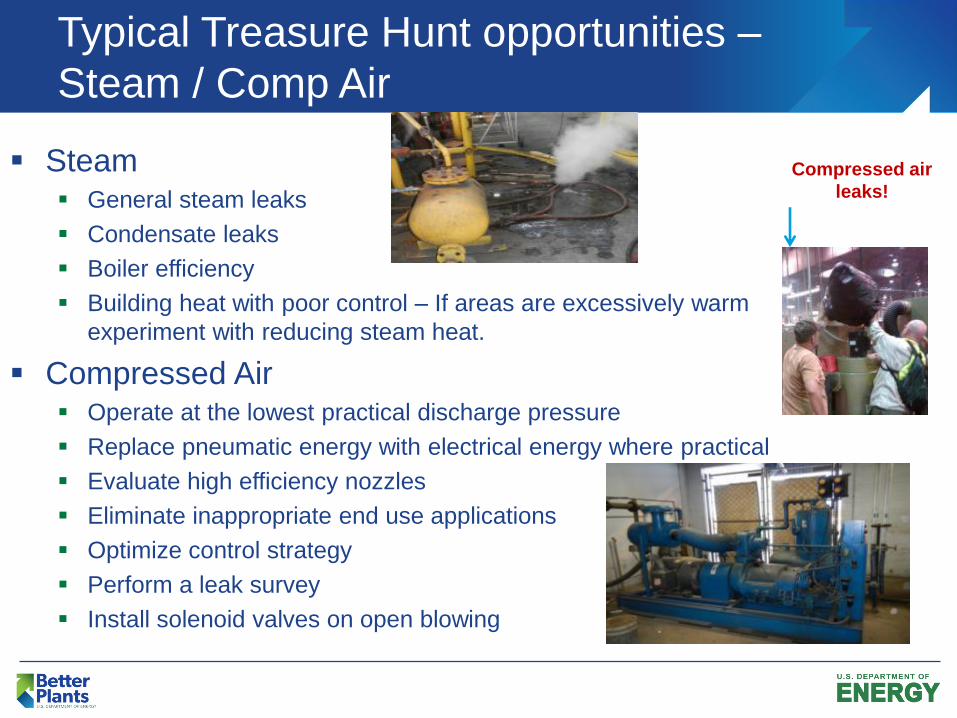
Steam / Comp Air
Steam General steam leaks
Condensate leaks
Boiler efficiency
Building heat with poor control – If areas are excessively warm
experiment with reducing steam heat.
Compressed Air Operate at the lowest practical discharge pressure
Replace pneumatic energy with electrical energy where practical
Evaluate high efficiency nozzles
Eliminate inappropriate end use applications
Optimize control strategy
Perform a leak survey
Install solenoid valves on open blowing
Compressed air
leaks!
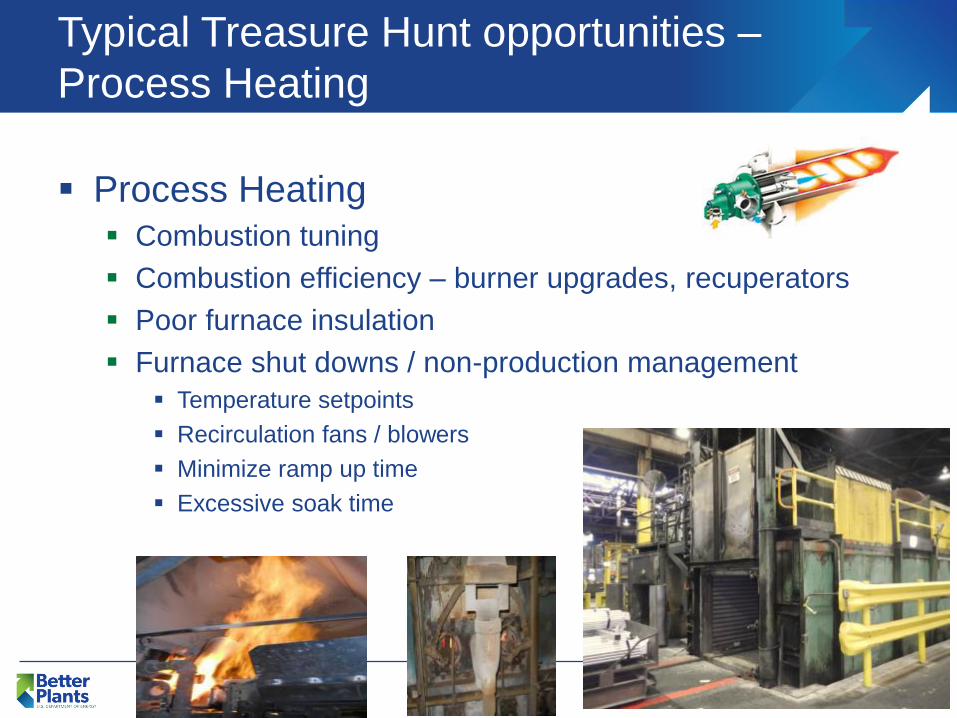
Typical Treasure Hunt opportunities –
Process Heating
Process Heating
Combustion tuning
Combustion efficiency – burner upgrades, recuperators
Poor furnace insulation
Furnace shut downs / non-production management
Temperature setpoints
Recirculation fans / blowers
Minimize ramp up time
Excessive soak time
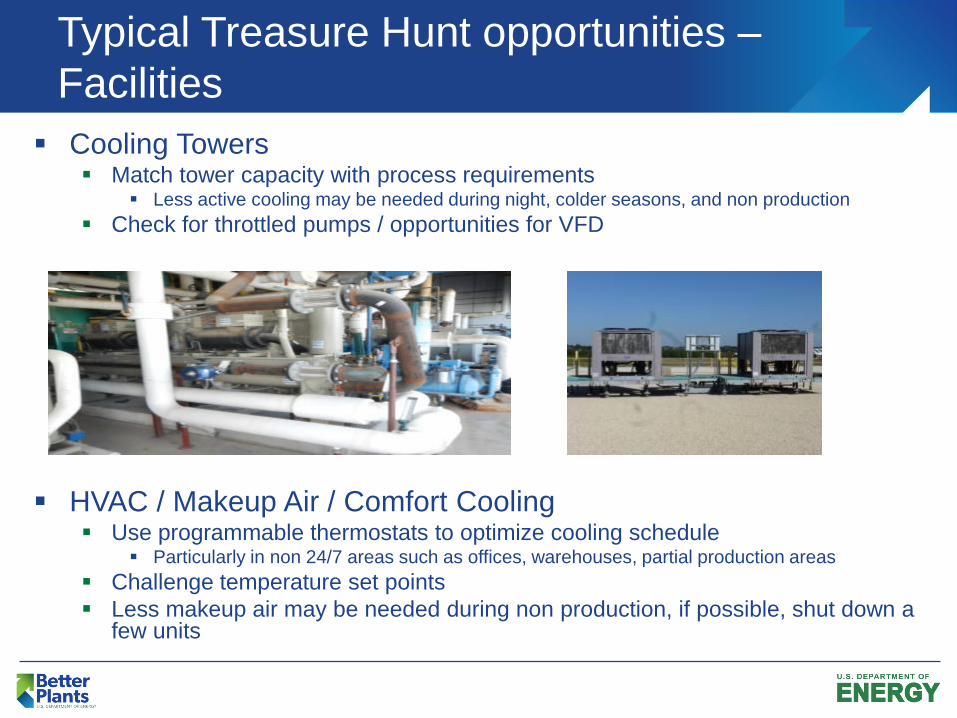
Typical Treasure Hunt opportunities –
Facilities
Cooling Towers Match tower capacity with process requirements
Less active cooling may be needed during night, colder seasons, and non production
Check for throttled pumps / opportunities for VFD
HVAC / Makeup Air / Comfort Cooling Use programmable thermostats to optimize cooling schedule
Particularly in non 24/7 areas such as offices, warehouses, partial production areas
Challenge temperature set points
Less makeup air may be needed during non production, if possible, shut down a few units
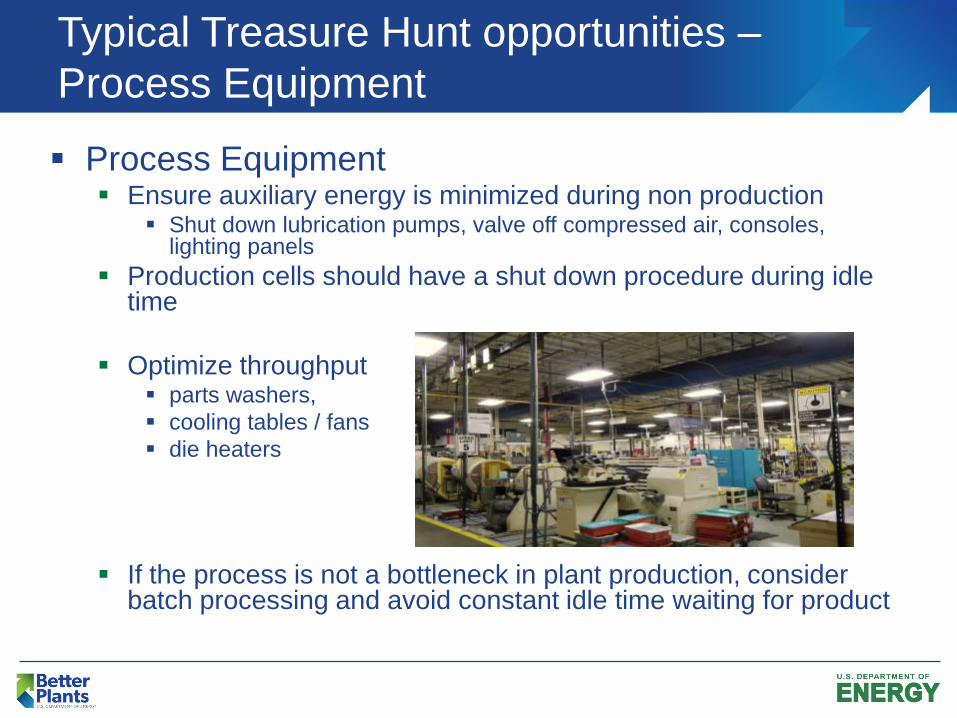
Typical Treasure Hunt opportunities –
Process Equipment
Process Equipment Ensure auxiliary energy is minimized during non production
Shut down lubrication pumps, valve off compressed air, consoles, lighting panels
Production cells should have a shut down procedure during idle time
Optimize throughput parts washers,
cooling tables / fans
die heaters
If the process is not a bottleneck in plant production, consider batch processing and avoid constant idle time waiting for product
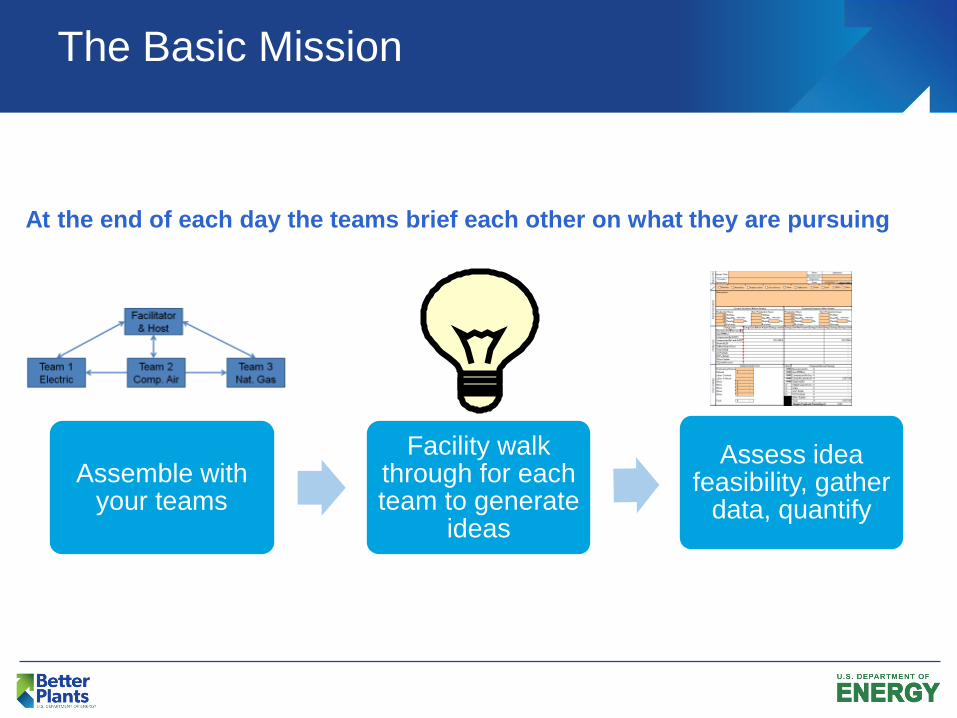
The Basic Mission
Assemble with your teams
Facility walk through for each team to generate
ideas
Assess idea feasibility, gather
data, quantify
At the end of each day the teams brief each other on what they are pursuing
The 4 Fundamentals: Energy Profiling
Mechanism to point out significant energy users
Usually snapshots of plant processes
Can include:
Equipment specifications
Checklists
Block diagrams
Energy mapping, e.g. pie charts, Sankey diagrams, DOE
footprint tool
DOE facilitator will spend extra time with team
leaders to develop these tools
24
The 4 Fundamentals: Data Collection
DOE facilitator will train attendees on information to
collect: Name plate data
Utility bills
Operating parameters
Background information
Team leads to understand data collection protocols Must quantify a “before” and “after” state for the equipment
What data to collect
When to collect data
How to leverage technology, e.g. dashboard systems to input data
Data must be entered in common tool, e.g. spreadsheet
The 4 Fundamentals: Data Calculation
Each opportunity is documented and quantified
using a standard tool, e.g. Excel spreadsheet
Tool must be have certain functionalities:
Standardized algorithms to generate ROIs
Utility rates/rebates embedded
Conversions to energy units, e.g. kWh to MMBtu
Teams need to calculate energy savings for each
opportunity
The 4 Fundamentals: Diagnostic Equipment
Pelican 1510
Case Field measurements are essential to determine
energy savings
DOE will lend diagnostic tools on Treasure Hunt
Exchanges
Facilitator or TAM will train team leads on
What are relevant diagnostic tools
How to use diagnostic tools and understand their output
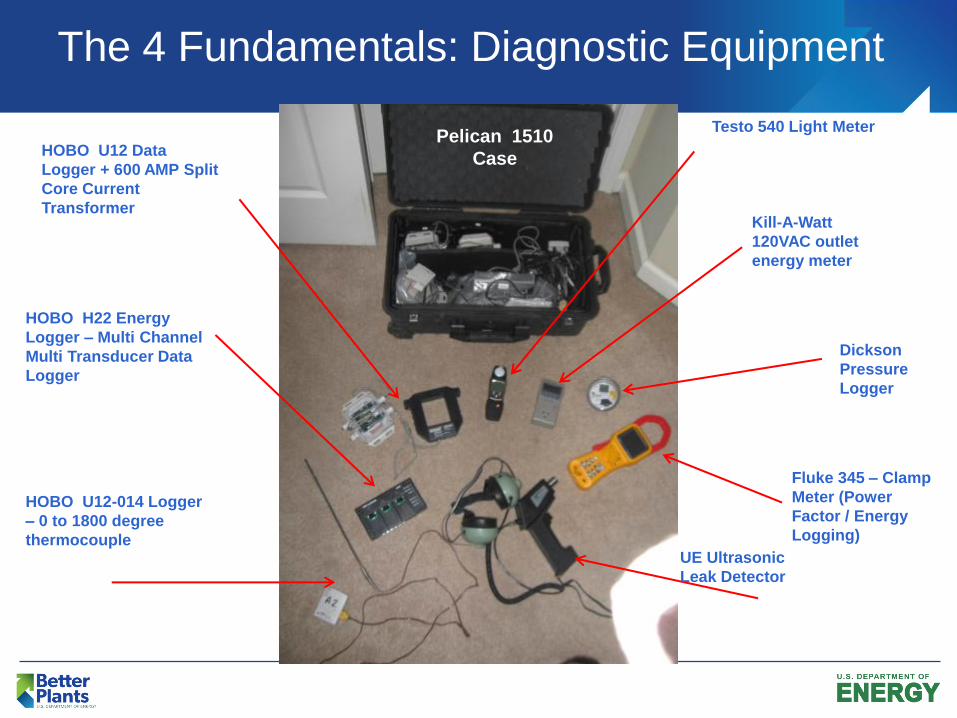
The 4 Fundamentals: Diagnostic Equipment
HOBO U12 Data
Logger + 600 AMP Split
Core Current
Transformer
HOBO H22 Energy
Logger – Multi Channel
Multi Transducer Data
Logger
HOBO U12-014 Logger
– 0 to 1800 degree
thermocouple
Testo 540 Light Meter
Dickson
Pressure
Logger
Kill-A-Watt
120VAC outlet
energy meter
Fluke 345 – Clamp
Meter (Power
Factor / Energy
Logging)
UE Ultrasonic
Leak Detector
Pelican 1510
Case

Questions / Comments
Thank You!
Recommended