Supporting NHS Wales to Deliver World Class Healthcare
All Wales Stroke Services All Wales Stroke Services Improvement CollaborativeImprovement Collaborative

Slide 2
All Wales Stroke Services Improvement CollaborativeAll Wales Stroke Services Improvement Collaborative
Mike DavidgeSenior Improvement Advisor
NHS Institute for Innovation & Improvement

Slide 3
All Wales Stroke Services Improvement CollaborativeAll Wales Stroke Services Improvement Collaborative
The Model for ImprovementThe Model for Improvement

Slide 4
All Wales Stroke Services Improvement CollaborativeAll Wales Stroke Services Improvement Collaborative
Types of measureTypes of measure
Time from onset of symptoms to admissionTime from onset of symptoms to stat aspirinTime from admission to stat aspirinTime from admission to ROSIER assessmentTime from symptom onset to CT scanTime from admission to CT scanTime from admission to admission to a specialist stroke wardCrude mortality rate Per 1000 patientsLength of Stay% return to usual place of residenceAverage change in function score% of patients readmitted within 30 days% eligible patients who have thrombolysis within 3 hours of admission% patients who have CT scan within 24 hours of symptom onset% compliance with First Hours bundle% compliance with First Days bundle% compliance with First 3 Days bundle% compliance with First 7 Days bundle
Flo
wO
utc
om
eP
roce
ss

Slide 5
All Wales Stroke Services Improvement CollaborativeAll Wales Stroke Services Improvement Collaborative
The care bundlesThe care bundles
• First hours bundle (Rapid recognition)
• First day bundle(Emergency treatment)
• First 3 day bundle(Early mobilisation)
• First 7 day bundle(Specialist care)
• % patients who receive stat aspirin• % patients who have diagnosis screen with ROSIER• % patients who have diagnosis confirmed by clinician• % patients who have CT scan within 24 hours of admission• % patients who have swallow assessment within 24 hours of
admission• % eligible patients who start regular aspirin within 24 hours of
admission• % patients admitted directly to stroke ward• % patients who have a manual handling assessment in first 72 hours• % patients with physiological signs monitored for first 72 hours• % patients who have their nutritional screening reported in first 72
hours• % patients who have their physiotherapy assessment in first 72
hours• % patients who were sat out of bed or mobilised in first 72 hours• % patients who have an OT assessment in first 7 days• % patients who have goals set and agreed in first 7 days• % patients who receive care information in appropriate format in first
7 days• % patients who are notified of an estimated date of discharge within
7 days

Slide 6
All Wales Stroke Services Improvement CollaborativeAll Wales Stroke Services Improvement Collaborative
CCollect – the right data in a
sustainable way
AAnalyse – the right measures
presented in a helpful
way
RReview – whether your changes are
having the desired effect
Measurement is a processMeasurement is a process
Supporting NHS Wales to Deliver World Class Healthcare
CCollectollect

Supporting NHS Wales to Deliver World Class Healthcare
The process of measurement The process of measurement at Luton & Dunstable Hospitalat Luton & Dunstable Hospital

Slide 9
All Wales Stroke Services Improvement CollaborativeAll Wales Stroke Services Improvement Collaborative
Why we wanted to do thisWhy we wanted to do this• Measurement is vital
• Regular and consistent measurement is a vital part of service improvement
• It is used to demonstrate that progress is being made or sustained
• It can tie process changes to improvements in performance across the pathway
• But its an add-on• Despite these obvious advantages, measurement for
improvement is often tacked on to existing workloads of staff who do not necessarily have the relevant information skills with the result that it is time consuming and seen as something of a chore

Slide 10
All Wales Stroke Services Improvement CollaborativeAll Wales Stroke Services Improvement Collaborative
What we were hoping to achieveWhat we were hoping to achieve• The team will be able to get everything they need to
present the chosen measures from the hospital systems• not needing therefore to get the information from a book or
an independent database, from the patient’s notes or by entering batches of NHS numbers by hand as a special effort.
• The systems include iPM with theatre module, Footman Walker and CRIS (radiology)
• Both data extraction and analysis will be automated

Slide 11
All Wales Stroke Services Improvement CollaborativeAll Wales Stroke Services Improvement Collaborative
How we went about itHow we went about it• Decide measures
• We started with a set of measures for the existing stroke pathway.
• Identify data• We worked backwards to identify all the steps in the
process that creates these measures to the point where data is first captured and entered into an IT or manual system.
• Map current process• We described and evaluated the current process.
• Create new process• We discussed the potential for a new more automated
process with the relevant staff.

Slide 12
All Wales Stroke Services Improvement CollaborativeAll Wales Stroke Services Improvement Collaborative
The measures usedThe measures used
• % having CT scan <24 hrs• % direct to Ward 17 (ASU)• Change in Bartel score• % mortality in hospital• % thrombolysed• Length of stay• % discharged to usual residence• Time in A&E• Nr ward moves• % cared for in stroke ward > 50% of time

Slide 13
All Wales Stroke Services Improvement CollaborativeAll Wales Stroke Services Improvement Collaborative
Required data itemsRequired data items
• Admission source• Admitting Bartel score• Date of admission/transfer
to stroke unit• Date of discharge/death• Date of discharge/transfer
from stroke unit• Date of thrombolysis• Date/Time of admission
• Date/Time of arrival in A&E• Date/Time of departure
from A&E• Date/Time of scan• Discharge Destination• Discharging Bartel score• Discharge reason• Procedure code used• Ward of admission

Slide 14
All Wales Stroke Services Improvement CollaborativeAll Wales Stroke Services Improvement Collaborative
The current process mappedThe current process mapped
Patient arrives in
A&E
Patient departs
A&E
Patient arrives in
ACU
Patient has scan
Patient transfer to stroke unit
Patient discharge
from stroke unit
A&E Receptionist enters arrival
date/time onto F/W
A&E clinical staff enter departure
date/time onto F/W
Ward clerk enters transfer date/time onto
IPM
Ward clerk enters
admission date/time and
source of admission into
ward book
Radiology staff enter scan
date/time onto CRIS
Ward clerk enters
admission date/time into
ward book
Therapy staff enter Bartel scores into
notes
Ward clerk enters
discharge date/time and
disposal method/
destination into ward book
Ward clerk enters
discharge date/time and ward/ disposal
method/ destination onto IPM
Ward clerk enters
admission date/time, ward and source of admission onto IPM
Post discharge
Clinical coders add diagnosis and procedure codes to IPM
record
Stroke co-ord enters scan
time into stroke DB

Slide 15
All Wales Stroke Services Improvement CollaborativeAll Wales Stroke Services Improvement Collaborative
Observations on current processObservations on current process• Data in hospital systems not always used
• Although most of the required data items are entered into hospital systems, these are not used to generate many of the current measures.
• Instead a combination of manual and stand-alone systems are used.
• Result: duplicate data entry.• Analysis is time consuming
• Charts are largely created manually from data re-entered into Excel.
• This approach wastes valuable staff time.

Slide 16
All Wales Stroke Services Improvement CollaborativeAll Wales Stroke Services Improvement Collaborative
What we proposed for the futureWhat we proposed for the future• Use hospital systems data
• Extraction of data will be performed by the information team in response to a brief and repeated on a regular agreed basis (maybe monthly).
• The output will be a set of patient level data
• Create Excel tool to analyse & display measures• Patient level data will be cut and pasted into an Excel
tool on a regular (monthly) basis.• The tool will display weekly and monthly charts as
required and can therefore be presented and discussed at multi-disciplinary meetings etc and displayed on ward ‘mission control’ boards.

Slide 17
All Wales Stroke Services Improvement CollaborativeAll Wales Stroke Services Improvement Collaborative
IssuesIssues• Who is on the pathway?
• Identifying the right patients from hospital systems• Add pathway identifier to IPM
• Bartel score only currently recorded in notes• Add facility to enter Bartel scores into IPM
• Where do we get thrombolysis information from?• Clinical coders confirm that they code as procedure
(X292,X298) so can be obtained from IPM
• What about scan time?• Info team will link CRIS, Footman Walker and IPM to
create single record per patient containing all the right data components
• Where does this leave the stroke database?• Info team have already designed an IPM module that
could be used instead

Slide 18
All Wales Stroke Services Improvement CollaborativeAll Wales Stroke Services Improvement Collaborative
The principles involvedThe principles involved
• Need to understand the patient pathway• Need to understand where data is collected now
and flag up any gaps
Patient arrives in
A&E
Patient departs
A&E
Patient arrives in
ACU
Patient has scan
Patient transfer to stroke unit
Patient discharge
from stroke unit
A&E Receptionist enters arrival date/time onto
F/W
A&E clinical staff enter departure
date/time onto F/W
Ward clerk enters transfer date/time onto
IPM
Ward clerk enters
admission date/time and
source of admission into
ward book
Radiology staff enter scan
date/time onto CRIS
Ward clerk enters
admission date/time into
ward book
Therapy staff enter Bartel scores into
notes
Ward clerk enters
discharge date/time and
disposal method/
destination into ward book
Ward clerk enters
discharge date/time and ward/ disposal
method/ destination onto IPM
Ward clerk enters
admission date/time, ward and source of admission onto IPM
Post discharge
Clinical coders add diagnosis and procedure codes to IPM
record
Stroke co-ordenters scan
time into stroke DB
Patient arrives in
A&E
Patient departs
A&E
Patient arrives in
ACU
Patient has scan
Patient transfer to stroke unit
Patient discharge
from stroke unit
A&E Receptionist enters arrival date/time onto
F/W
A&E clinical staff enter departure
date/time onto F/W
Ward clerk enters transfer date/time onto
IPM
Ward clerk enters
admission date/time and
source of admission into
ward book
Radiology staff enter scan
date/time onto CRIS
Ward clerk enters
admission date/time into
ward book
Therapy staff enter Bartel scores into
notes
Ward clerk enters
discharge date/time and
disposal method/
destination into ward book
Ward clerk enters
discharge date/time and ward/ disposal
method/ destination onto IPM
Ward clerk enters
admission date/time, ward and source of admission onto IPM
Post discharge
Clinical coders add diagnosis and procedure codes to IPM
record
Stroke co-ordenters scan
time into stroke DB
Slide 19
All Wales Stroke Services Improvement CollaborativeAll Wales Stroke Services Improvement Collaborative
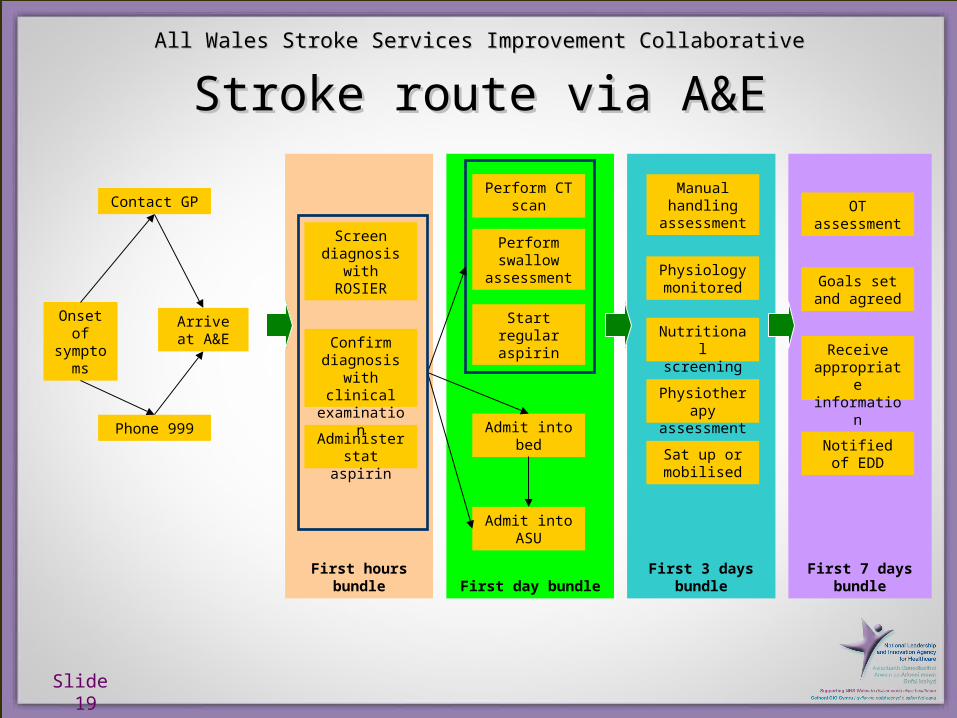
First 7 days bundle
First 3 days bundleFirst day bundleFirst hours bundle
Stroke route via A&EStroke route via A&E
Onset of
symptoms
Contact GP
Phone 999
Arrive at A&E
Admit into bed
Admit into ASU
Screen diagnosis
with ROSIER
Administer stat aspirin
Perform CT scan
Perform swallow
assessment
Start regular aspirin
Manual handling
assessment
Nutritional screening
Physiology monitored
Physiotherapy
assessment
Sat up or mobilised
OT assessment
Notified of EDD
Receive appropriate information
Goals set and agreed
Confirm diagnosis
with clinical examination

Slide 20
All Wales Stroke Services Improvement CollaborativeAll Wales Stroke Services Improvement Collaborative
Groupwork: What is your pathway?Groupwork: What is your pathway?
• Draw your own timeline• Are there any differences from our generic one?• Do things happen in a specified order all the
time?• Record what happens most often
• Make a note of any issues you want to clarify back at base
• Be prepared to share your timeline

Supporting NHS Wales to Deliver World Class Healthcare
Feedback and sharingFeedback and sharing

Slide 22
All Wales Stroke Services Improvement CollaborativeAll Wales Stroke Services Improvement Collaborative
Groupwork: Where is data collected?Groupwork: Where is data collected?• Refer to your timeline• Start to complete the data collection planning sheet• Who records this – the person or role responsible• At what point – real time or how long afterwards• Where is it stored – named hospital system, little black book etc• How reliable – how many will be missing?• Issues – things to check or actions to do
• Tackle ‘Who records this’ first• Use ‘Not collected’ or ‘Not sure’
Phase Data item Format Who records this At what point Where is it storedHow reliably do we collect Issues to resolve
Date of symptom onset Date
Time of symptom onset Time
Date of stat aspirin Date
Time of stat aspirin Time
Date assessed with ROSIER Date
Time assessed with ROSIER Time
Confirmed stroke Yes/No
Firs
t ho
urs
Supporting NHS Wales to Deliver World Class Healthcare
Feedback on issuesFeedback on issues
Slide 24
All Wales Stroke Services Improvement CollaborativeAll Wales Stroke Services Improvement Collaborative
Planning your data collectionPlanning your data collection
• How are you going to ensure you get the right data?
• How will you get hold of data already collected?• How will you collect data items that you don’t
currently collect?• Plan to test with the next patient

Slide 25
All Wales Stroke Services Improvement CollaborativeAll Wales Stroke Services Improvement Collaborative
PostscriptPostscript
• The Luton new system was delayed because of lack of information analyst time
• Moral: The more automated you make things, the more reliant you are on specialist informatics skills

Supporting NHS Wales to Deliver World Class Healthcare
AAnalysenalyse

Supporting NHS Wales to Deliver World Class Healthcare
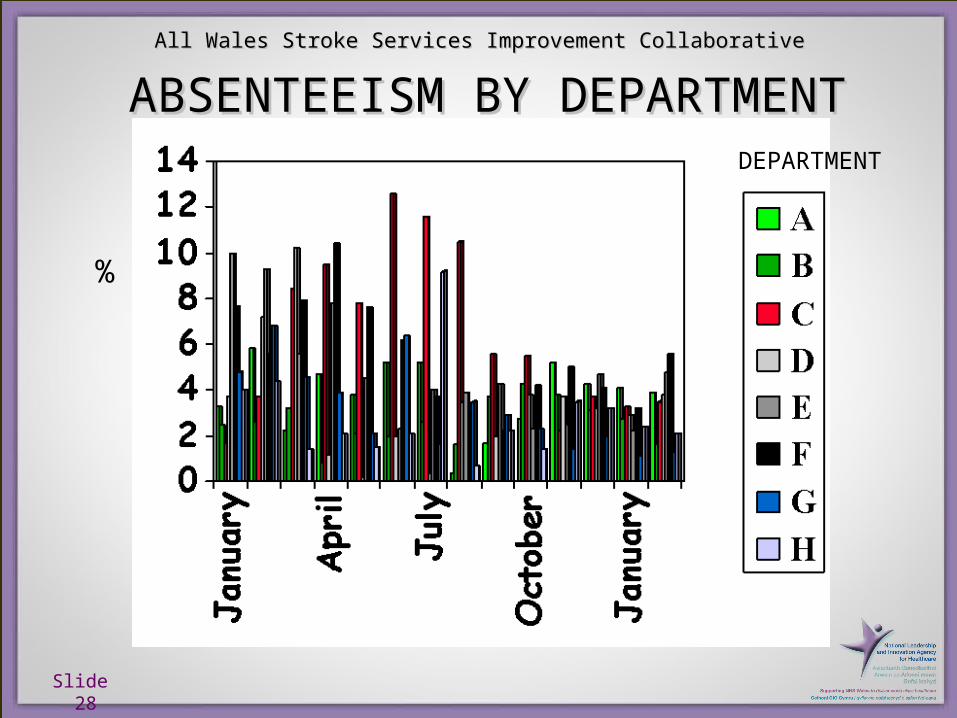
The type of presentation you use The type of presentation you use has a crucial effect on how you has a crucial effect on how you
react to datareact to data
Slide 28
All Wales Stroke Services Improvement CollaborativeAll Wales Stroke Services Improvement Collaborative
DEPARTMENT
%
ABSENTEEISM BY DEPARTMENTABSENTEEISM BY DEPARTMENT
Slide 29
All Wales Stroke Services Improvement CollaborativeAll Wales Stroke Services Improvement Collaborative
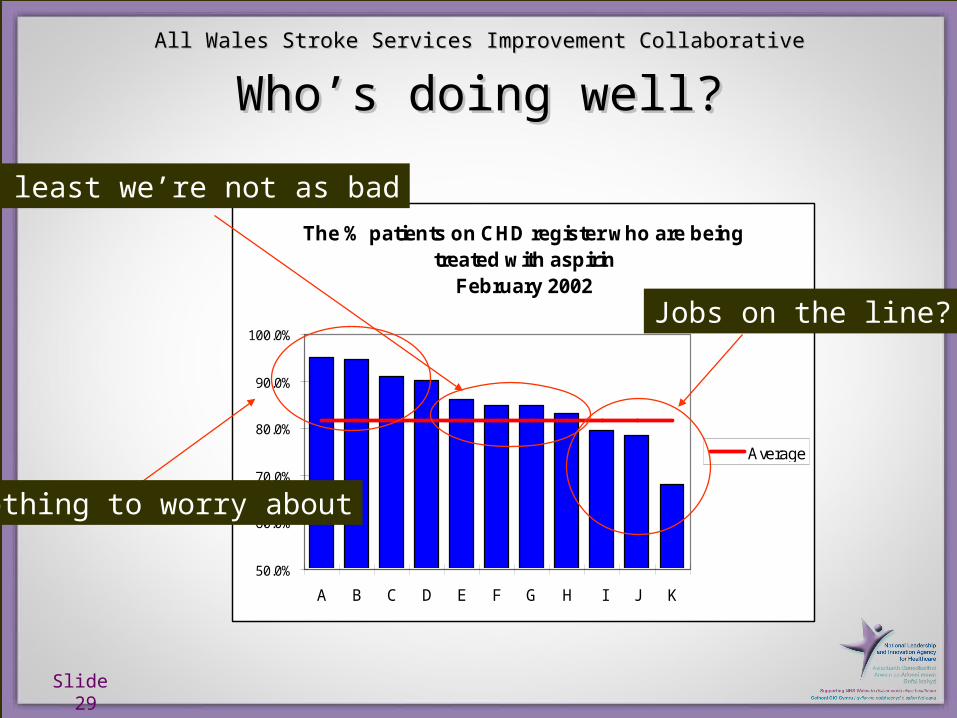
The % patients on CHD register who are being treated with aspirin
February 2002
50.0%
60.0%
70.0%
80.0%
90.0%
100.0%
A B C D E F G H I J K
Average
Jobs on the line?
At least we’re not as bad
Nothing to worry about
Who’s doing well?Who’s doing well?

Slide 30
All Wales Stroke Services Improvement CollaborativeAll Wales Stroke Services Improvement Collaborative
Take two numbersTake two numbers
29
12
0
5
10
15
20
25
30
35
Q1 Q2

Slide 31
All Wales Stroke Services Improvement CollaborativeAll Wales Stroke Services Improvement Collaborative
We have 2 quarterly data points - is We have 2 quarterly data points - is this an improvement?this an improvement?
Executive Time Series
0
20
40
60
80
100
J F M A M J J A S O N D
Months
So
me
thin
g I
mp
ort
an
t
Higher is better

Slide 32
All Wales Stroke Services Improvement CollaborativeAll Wales Stroke Services Improvement Collaborative
Are we assuming something like Are we assuming something like this?this?
Executive Time Series - linear trend
0
20
40
60
80
100
J F M A M J J A S O N D
Months
So
meth
ing
Im
po
rtan
t

Slide 33
All Wales Stroke Services Improvement CollaborativeAll Wales Stroke Services Improvement Collaborative
But it could be like this ...But it could be like this ...
Executive Time Series - no trend
0
20
40
60
80
100
J F M A M J J A S O N D
Months
So
meth
ing
Im
po
rtan
t

Slide 34
All Wales Stroke Services Improvement CollaborativeAll Wales Stroke Services Improvement Collaborative
Or this ...Or this ...
Executive Time Series - seasonal dip
0
20
40
60
80
100
J F M A M J J A S O N D
Months
So
me
thin
g I
mp
ort
an
t

Slide 35
All Wales Stroke Services Improvement CollaborativeAll Wales Stroke Services Improvement Collaborative
Or this!Or this!
Executive Time Series - one month blip
0
20
40
60
80
100
J F M A M J J A S O N D
Months
So
meth
ing
Im
po
rtan
t

Supporting NHS Wales to Deliver World Class Healthcare
How often you measure can also have How often you measure can also have an effect on how you look at the resultsan effect on how you look at the results

Slide 37
All Wales Stroke Services Improvement CollaborativeAll Wales Stroke Services Improvement Collaborative
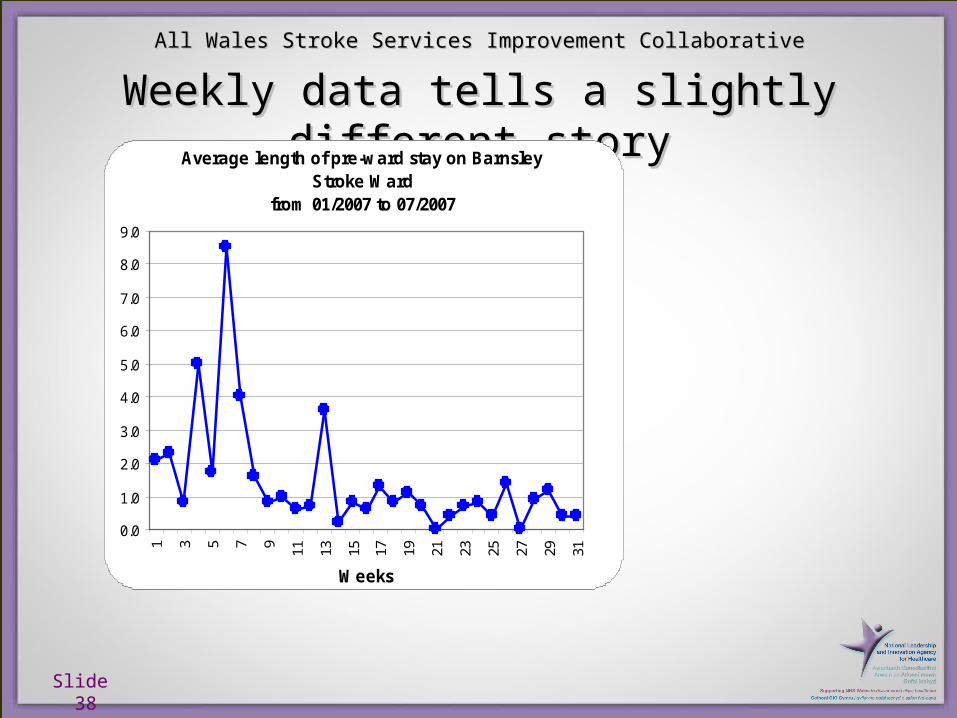
Monthly data shows improvementMonthly data shows improvement
Average length of pre-ward stay on Barnsley Stroke Ward
from 01/2007 to 07/2007
0
0.5
1
1.5
2
2.5
3
3.5
1 2 3 4 5 6 7
Months
The chart shows the average monthly length of time before patients got to the Stroke ward
Slide 38
All Wales Stroke Services Improvement CollaborativeAll Wales Stroke Services Improvement Collaborative
Weekly data tells a slightly different storyWeekly data tells a slightly different storyAverage length of pre-ward stay on Barnsley
Stroke Wardfrom 01/2007 to 07/2007
0.0
1.0
2.0
3.0
4.0
5.0
6.0
7.0
8.0
9.0
1 3 5 7 9 11 13 15 17 19 21 23 25 27 29 31Weeks

Slide 39
All Wales Stroke Services Improvement CollaborativeAll Wales Stroke Services Improvement Collaborative
Patient level data adds another level of Patient level data adds another level of understandingunderstanding
Patient length of pre-ward stay on Barnsley Stroke Ward
from 01/2007 to 07/2007
0.0
5.0
10.0
15.0
20.0
25.0
30.0
35.0
Patients
Supporting NHS Wales to Deliver World Class Healthcare
Spreadsheet DemoSpreadsheet Demo
Slide 41
All Wales Stroke Services Improvement CollaborativeAll Wales Stroke Services Improvement Collaborative
GroupworkGroupwork
• Discuss how you will ensure the spreadsheet gets completed
• Hint: Put names in the frame!

Supporting NHS Wales to Deliver World Class Healthcare
RRevieweview

Supporting NHS Wales to Deliver World Class Healthcare
It is a waste of time collecting and It is a waste of time collecting and analysing your data if you don't take analysing your data if you don't take
action on the resultsaction on the results
Slide 44
All Wales Stroke Services Improvement CollaborativeAll Wales Stroke Services Improvement Collaborative
GroupworkGroupwork
• Discuss:• Where you will display your measures• When you will meet to review them• Who needs to be there
• Use the Review Meeting Guide handout to prompt you

Supporting NHS Wales to Deliver World Class Healthcare
FeedbackFeedback

Slide 46
All Wales Stroke Services Improvement CollaborativeAll Wales Stroke Services Improvement Collaborative
SummarySummary
• You have clarified your timeline• Planned your data collection• Agreed who will own the spreadsheet• Decided how you will take action on the results• Or ...• You know what you have to do to achieve all
these
Recommended