Journal of Physics Conference Series
OPEN ACCESS
Structure and luminescence of sol-gel synthesizedanatase nanoparticlesTo cite this article U Houmlrmann et al 2010 J Phys Conf Ser 209 012039
View the article online for updates and enhancements
You may also likeTaming excitons in IIndashVI semiconductornanowires and nanobeltsXinlong Xu Qing Zhang Jun Zhang et al
-
Quasiparticle and excitonic effects inWSi2N4 monolayerMohaddeseh Norouzi Azizabad andHosein Alavi-Rad
-
On mobility of electrons in a shallow Fermisea over a rough seafloorKamran Behnia
-
Recent citationsRules for Selecting Metal CocatalystBased on Charge Transfer and SeparationEfficiency between ZnO Nanoparticles andNoble Metal Cocatalyst Ag Au PtQianxia Liu et al
-
Point of Anchor Impacts on InterfacialCharge Transfer of Metal OxideNanoparticlesYi Peng et al
-
Excitons and Excess Electrons inNanometer Size Molecular PolyoxotitanateClusters Electronic Spectra ExcitonDynamics and Surface StatesJianhua Bao et al
-
This content was downloaded from IP address 12611412160 on 16102021 at 0554
Structure and luminescence of sol-gel synthesized anatase
nanoparticles
U Houmlrmann1 U Kaiser
1 M Albrecht
2 J Geserick
3 and N Huumlsing
3
1 Ulm University Electron Microscopy Group of Materials Science Albert-Einstein-
Allee 11 89081 Ulm Germany 2 Leibniz Institute for Crystal Growth Max-Born-Str 6 12489 Berlin Germany
3 Ulm University Institute of Inorganic Chemistry I Albert-Einstein-Allee 11 89081
Ulm Germany
E-mail utehoermannuni-ulmde
Abstract Two samples of mesoporous anatase nanoparticles prepared by the sol-gel method
were characterised by Cs-corrected high resolution transmission electron microscopy
(HRTEM) X-ray powder diffraction (XRD) and Raman spectroscopy Statistical evaluation of
TEM data showed an average diameter of these crystallites of 88 nm and 111 nm
respectively Optical spectroscopy by cathodoluminescence (CL) in a scanning electron
microscope (SEM) showed free exciton transitions related to the direct and the indirect band
gap of anatase TiO2 From the analysis of the excited states of the free excitons an exciton
binding energy of 10 meV and a Bohr radius of 235 nm is obtained The small Bohr radius
could explain the absence of quantum confinement in the particles presented in this study
1 Introduction
Anatase is a wide band gap semiconductor with indirect band gap [1] The band gap of bulk anatase
was calculated by Wunderlich [2] to 320 eV which is in accordance with experimental results
Applications of mesostructured nanocrystalline titania are based on photoexcitation In particular
titania is an important material in photo catalysis [3] due to its high catalytic activity Other
applications using photon excitations are the Graumltzel type solar cell [4] and electrochromic devices [5]
It is therefore of great interest to get access to basic materials properties such as the Bohr radius
effective masses and band structure to understand the size dependence of the electronic properties
While size dependence has been extensively studied and measured in terms of size dependent Raman
shifts or photo luminescence transition lines [16] the existence of a quantum confinement effect in
anatase and rutile nanoparticles is still under debate eg questioned by Monticone et al [7] who
performed absorption measurements of anatase TiO2 with sizes ranging from 2-8nm and found no
indications for the existence of quantum confinement at all These authors explained their findings by
a size dependence of the effective hole mass in this material system
2 Experiment The anatase nanoparticles were synthesised in a sol-gel process at room temperature at pH=2 The
sample denoted SDS was prepared from ethylene glycol modified titanate (EGMT) in the presence of
16th International Conference on Microscopy of Semiconducting Materials IOP PublishingJournal of Physics Conference Series 209 (2010) 012039 doi1010881742-65962091012039
ccopy 2009 IOP Publishing Ltd 1
the surfactant sodium dodecyl sulphate (SDS) in a molar ratio of SDSTi = 021 For the sample
denoted as Brij56 glycol modified titanate (GMT) was converted in the presence of the surfactant
Brij56 in a molar ratio of Brij56Ti=0031 After drying the samples they were calcined for 4 h at 400
degC in air in order to remove the surfactant
Nitrogen sorption measurements were performed on a NOVA 4000e and Autosorp MP1 instrument
(Quantachrome) The surface area was calculated according to Brunauer Emmett and Teller (BET) in
the pp0 range of 005-03 and the pore size distribution was determined according to Barrett Joyner
and Halenda (BJH) from the desorption branch of the isotherms
XRD measurements were performed by using Cu-Kα radiation (λ = 0154 nm) on a PANalytical
MPD PRO diffractometer
For the TEM sample preparation the powders were dispersed in ethanol and 5 minutes treated in an
ultrasonic bath Afterwards the dispersion was dripped onto a holey carbon film coated copper grid
The samples were structurally characterised by Cs-corrected high resolution transmission electron
microscopy using a FEI Titan 80-300 operated at 300 kV
Raman measurements were carried out on a Jobin-Yvon LabRam using a 630 nm laser for
excitation Cathodoluminescence spectroscopy has been performed using a Zeiss DSM microscope
with a Gatan MonoCL3 cathodoluminescence system attached Light was dispersed by a 2400 lmm
grating blazed at 300 nm A Peltier cooled charge coupled device camera was used for detection
3 Results and Discussion
31 HRTEM
The HRTM images show that in both samples the anatase is nanocrystalline and mesoporous The
nanoparticles in both samples are either facetted or exhibit an irregular roundish shape Particles with
bad crystallinity or amorphous particles not shown here were observed more often in the Brij56
sample than in SDS However it has to be considered that the anatase is unstable against irradiation
under the electron beam Thus no quantification can be made on the relative amount of amorphous
anatase in the samples Defects are observed in both samples eg twins see figure 1
lower twin
upper twin
FFT twin
Figure 1 Cs-corrected HRTEM images of the anatase nanoparticles Left the SDS sample
Right the Brij56 sample with crystalline nanoparticles and a twin Inset power spectrum
Particle statistics was performed on both samples 495 particles were measured on SDS and lead to an
average particle size of 88plusmn27 nm in diameter ranging from 3 to 19 nm On the Brij56 sample 485
particles were evaluated resulting in an average diameter of 111plusmn32 nm ranging from 5 to 23 nm
16th International Conference on Microscopy of Semiconducting Materials IOP PublishingJournal of Physics Conference Series 209 (2010) 012039 doi1010881742-65962091012039
2
32 X-Ray Powder Diffractometry
Both samples were found to consist of pure anatase see figure 2 The particle sizes were determined
from the FWHM of the 101 reflection using the Scherrer equation with a form factor of K=09 The
resulting particle diameters were 70 nm for the SDS sample and 62 nm for the Brij56 sample These
values are smaller than the diameters determined from the TEM micrographs A possible explanation
for this discrepancy may be the following [8] (i) in very small particles the lattice constant depends on
the crystallite size This variation causes peak broadening (ii) twin domains contribute twice
independently to the spectrum while for the TEM analysis a twinned particle was counted only once
(iii) oxygen saturation in the surface area causes peak broadening In all these cases peak broadening
leads to an underestimate of the particle diameter from XRD Nevertheless the quantitative effect for
these powders is a matter for further investigation
Figure 2 X-ray diffraction pattern of both samples with anatase reflections indicated
33 Raman Spectroscopy
The Raman measurements show the phonon excitations for anatase The crystallite size can be
determined from the peak positions and from the full widths at half maximum (FWHM) of the Eg
peak see figure 3 [9] The Eg peak of SDS has the maximum at 1474plusmn02 cm-1
The maximum in the
Brij56 sample was found at 1452plusmn01 cm-1
The resulting particle diameters are 8 nm for SDS and 18
nm for Brij56 The FWHM measures 163plusmn05 cm-1
for SDS and 124plusmn01 cm-1
for Brij56 This leads
to 6 nm particle diameter in SDS and 8 nm in Brij56 Again in accordance with the TEM
measurements the nanoparticles are larger in the Brij56 sample
34 Nitrogen sorption
From the nitrogen sorption the BET surface area was determined to 184 m2g for the SDS sample and
140 m2g for the Brij56 sample The pore diameter was determined to 49 nm for SDS and 69 nm for
Brij56 The lower surface area and larger pore size for the Brij56 are in agreement with the results
from TEM particle statistics and Raman spectroscopy demonstrating larger particle size in Brij56
16th International Conference on Microscopy of Semiconducting Materials IOP PublishingJournal of Physics Conference Series 209 (2010) 012039 doi1010881742-65962091012039
3
75 100 125 150 175 200 225 250
02
04
06
08
10
Eg
λ=514 nm 300 K
SDS A-5
BRIJ
Norm
alis
ed In
ten
sity (
au
)
Raman-shift (cm-1)
Figure 3 Raman spectrum of both samples Shift of the Eg peak is due to phonon confinement
35 Scanning electron microscopy cathodoluminescence investigation
Cathodoluminescence (CL) measurements have been performed on both samples Optical transitions
of the samples were independent of the average crystal size of the analysed samples spatially
integrated spectra at 7 K are dominated by a broad luminescence band centred at 226 eV This broad
band has been reported to appear in anatase phase TiO2 single crystals epitaxial layers and nano-
crystals and has been attributed to self-trapped excitons at the TiO6 octahedron [10] Site selective
spectra taken with a focused electron beam revealed transitions at 335 eV with a line width of about 4
meV Spectra taken at different sites indicated spatial anti-correlation of areas showing broad band
luminescence at 226 eV and of those showing sharp UV transitions Figure 4 shows a typical CL
spectrum of the sharp transitions at higher energy resolution At the high energy site two main peaks at
33962 and 33535 eV are dominating the spectrum Both lines can be fitted by Lorentzian curves The
lines are separated by 42 meV The higher energy transition has an intensity that is about 1 of that at
lower energies Temperature dependent measurements show a shift to lower energies according to that
of the band gap of anatase TiO2 reported by Tang [11] Beside the main transition a number of phonon
replica are observed While the lower energy line at ~335eV has exclusively replica that correspond to
the B1g mode the higher energy transition at ~340eV has additional replica that are higher in intensity
than the main peak The latter is characteristic for the zero phonon line and its phonon replica of
indirect transitions in semiconductors
16th International Conference on Microscopy of Semiconducting Materials IOP PublishingJournal of Physics Conference Series 209 (2010) 012039 doi1010881742-65962091012039
4
Figure 4 CL spectra typical for both samples Left overview at different locations Right high
resolution spectrum of excitonic transitions
Tang et al [11] report on an indirect and direct gap that was found at 346 and 342 eV respectively
from absorption measurements in anatase single crystals From the energy separation of the optical
transitions their intensity relation and their specific phonon replica it is tempting to assign the
transitions found in our anatase nanocrystals to free excitonic transitions at the direct and indirect gap
of anatase TiO2 To confirm this we may in the following focus on the direct transition and its phonon
replica As can be seen in Figure 4 the 1- and 2- phonon replica have an asymmetric shape with a
steep edge at the low energy side and a high energy wing This shape if retained after background
subtraction could be characteristic for free excitons and due to the kinetic energy of the excitons that
is described by a Maxwell distribution Further support for the hypothesis of free excitons comes from
the almost linear increase of the FWHM of the luminescence peaks with increasing temperature The
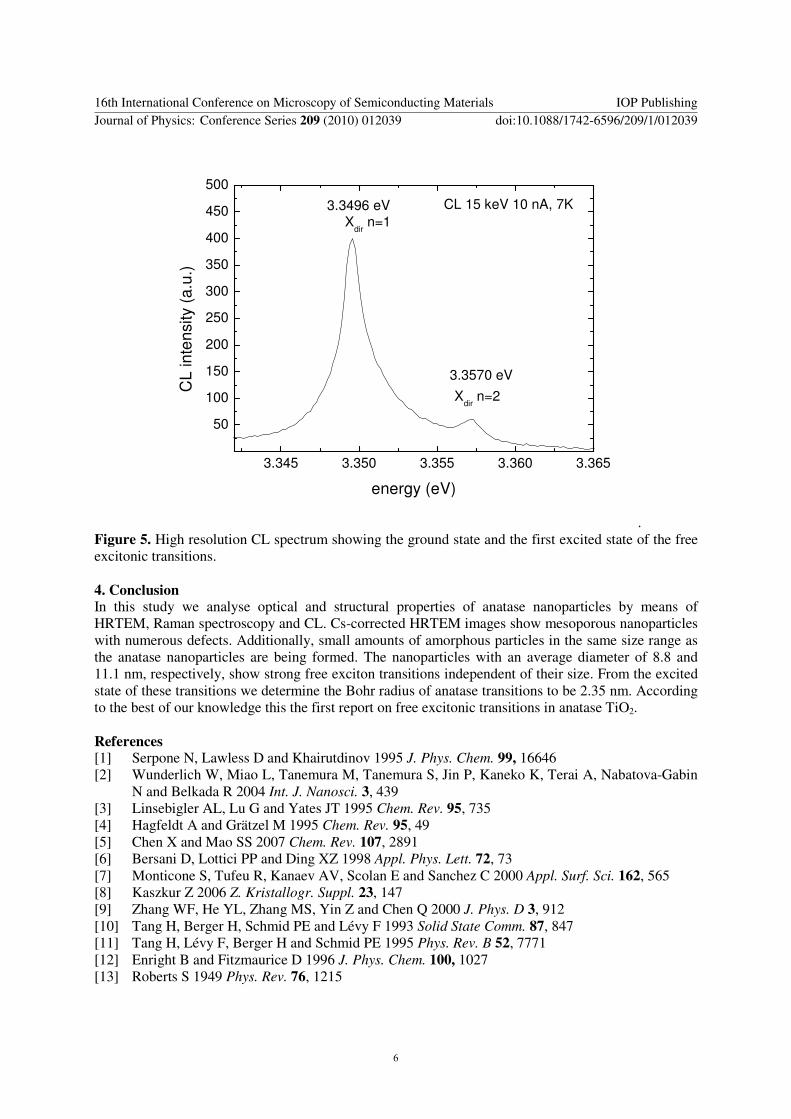
transition at 33535 eV in Figure 4 shows a high energy shoulder A spectrum of that transition at
higher resolution is shown in Figure 5 A second peak is revealed with an energy separation of 748
meV to the direct free exciton transition We attribute this transition to the excited state of the direct
free exciton and estimate the exciton binding energy and the Bohr radius from this separation To do
so we need the basic parameters such as effective masses of electrons and holes and the static
dielectric constant There are a number of different values that have been reported especially for
effective masses of electrons and holes and for the static dielectric constant Taking me=10m0 and
mh=08m0 from [12] we obtain from
)2()( 2224neEnE g εmicro hminus= (1)
and
)( 00 mmmm ee +=micro (2)
a dielectric constant of 318 which is in good agreement with literature data ( 31=ε [13]) We can
also estimate a Bohr radius for the free exciton of 352=x
Ba nm and an exciton binding energy of 10
meV In fact we have no direct correlation between crystal size and optical transitions however
taking our value of the Bohr radius we do not expect quantum confinement effects for the particles
studied in this work since their diameter exceeds the Bohr radius by a factor of 3 Comparing our data
to that from the literature it is interesting to note that Monticone et al [7] analysing the absorption
edge of anatase nanoparticles found quantum confinement effects for anatase nanoparticles only for
with sizes in the range of 08 nm which supports our experimental findings of the bulk behaviour of
larger nanoparticles investigated in this study
16th International Conference on Microscopy of Semiconducting Materials IOP PublishingJournal of Physics Conference Series 209 (2010) 012039 doi1010881742-65962091012039
5
3345 3350 3355 3360 3365
50
100
150
200
250
300
350
400
450
500
CL 15 keV 10 nA 7K
Xdir
n=2
Xdir
n=1
33570 eV
33496 eV
CL
in
ten
sity (
au
)
energy (eV)
Figure 5 High resolution CL spectrum showing the ground state and the first excited state of the free
excitonic transitions
4 Conclusion In this study we analyse optical and structural properties of anatase nanoparticles by means of
HRTEM Raman spectroscopy and CL Cs-corrected HRTEM images show mesoporous nanoparticles
with numerous defects Additionally small amounts of amorphous particles in the same size range as
the anatase nanoparticles are being formed The nanoparticles with an average diameter of 88 and
111 nm respectively show strong free exciton transitions independent of their size From the excited
state of these transitions we determine the Bohr radius of anatase transitions to be 235 nm According
to the best of our knowledge this the first report on free excitonic transitions in anatase TiO2
References [1] Serpone N Lawless D and Khairutdinov 1995 J Phys Chem 99 16646
[2] Wunderlich W Miao L Tanemura M Tanemura S Jin P Kaneko K Terai A Nabatova-Gabin
N and Belkada R 2004 Int J Nanosci 3 439
[3] Linsebigler AL Lu G and Yates JT 1995 Chem Rev 95 735
[4] Hagfeldt A and Graumltzel M 1995 Chem Rev 95 49
[5] Chen X and Mao SS 2007 Chem Rev 107 2891
[6] Bersani D Lottici PP and Ding XZ 1998 Appl Phys Lett 72 73
[7] Monticone S Tufeu R Kanaev AV Scolan E and Sanchez C 2000 Appl Surf Sci 162 565
[8] Kaszkur Z 2006 Z Kristallogr Suppl 23 147
[9] Zhang WF He YL Zhang MS Yin Z and Chen Q 2000 J Phys D 3 912
[10] Tang H Berger H Schmid PE and Leacutevy F 1993 Solid State Comm 87 847
[11] Tang H Leacutevy F Berger H and Schmid PE 1995 Phys Rev B 52 7771
[12] Enright B and Fitzmaurice D 1996 J Phys Chem 100 1027
[13] Roberts S 1949 Phys Rev 76 1215
16th International Conference on Microscopy of Semiconducting Materials IOP PublishingJournal of Physics Conference Series 209 (2010) 012039 doi1010881742-65962091012039
6

Structure and luminescence of sol-gel synthesized anatase
nanoparticles
U Houmlrmann1 U Kaiser
1 M Albrecht
2 J Geserick
3 and N Huumlsing
3
1 Ulm University Electron Microscopy Group of Materials Science Albert-Einstein-
Allee 11 89081 Ulm Germany 2 Leibniz Institute for Crystal Growth Max-Born-Str 6 12489 Berlin Germany
3 Ulm University Institute of Inorganic Chemistry I Albert-Einstein-Allee 11 89081
Ulm Germany
E-mail utehoermannuni-ulmde
Abstract Two samples of mesoporous anatase nanoparticles prepared by the sol-gel method
were characterised by Cs-corrected high resolution transmission electron microscopy
(HRTEM) X-ray powder diffraction (XRD) and Raman spectroscopy Statistical evaluation of
TEM data showed an average diameter of these crystallites of 88 nm and 111 nm
respectively Optical spectroscopy by cathodoluminescence (CL) in a scanning electron
microscope (SEM) showed free exciton transitions related to the direct and the indirect band
gap of anatase TiO2 From the analysis of the excited states of the free excitons an exciton
binding energy of 10 meV and a Bohr radius of 235 nm is obtained The small Bohr radius
could explain the absence of quantum confinement in the particles presented in this study
1 Introduction
Anatase is a wide band gap semiconductor with indirect band gap [1] The band gap of bulk anatase
was calculated by Wunderlich [2] to 320 eV which is in accordance with experimental results
Applications of mesostructured nanocrystalline titania are based on photoexcitation In particular
titania is an important material in photo catalysis [3] due to its high catalytic activity Other
applications using photon excitations are the Graumltzel type solar cell [4] and electrochromic devices [5]
It is therefore of great interest to get access to basic materials properties such as the Bohr radius
effective masses and band structure to understand the size dependence of the electronic properties
While size dependence has been extensively studied and measured in terms of size dependent Raman
shifts or photo luminescence transition lines [16] the existence of a quantum confinement effect in
anatase and rutile nanoparticles is still under debate eg questioned by Monticone et al [7] who
performed absorption measurements of anatase TiO2 with sizes ranging from 2-8nm and found no
indications for the existence of quantum confinement at all These authors explained their findings by
a size dependence of the effective hole mass in this material system
2 Experiment The anatase nanoparticles were synthesised in a sol-gel process at room temperature at pH=2 The
sample denoted SDS was prepared from ethylene glycol modified titanate (EGMT) in the presence of
16th International Conference on Microscopy of Semiconducting Materials IOP PublishingJournal of Physics Conference Series 209 (2010) 012039 doi1010881742-65962091012039
ccopy 2009 IOP Publishing Ltd 1
the surfactant sodium dodecyl sulphate (SDS) in a molar ratio of SDSTi = 021 For the sample
denoted as Brij56 glycol modified titanate (GMT) was converted in the presence of the surfactant
Brij56 in a molar ratio of Brij56Ti=0031 After drying the samples they were calcined for 4 h at 400
degC in air in order to remove the surfactant
Nitrogen sorption measurements were performed on a NOVA 4000e and Autosorp MP1 instrument
(Quantachrome) The surface area was calculated according to Brunauer Emmett and Teller (BET) in
the pp0 range of 005-03 and the pore size distribution was determined according to Barrett Joyner
and Halenda (BJH) from the desorption branch of the isotherms
XRD measurements were performed by using Cu-Kα radiation (λ = 0154 nm) on a PANalytical
MPD PRO diffractometer
For the TEM sample preparation the powders were dispersed in ethanol and 5 minutes treated in an
ultrasonic bath Afterwards the dispersion was dripped onto a holey carbon film coated copper grid
The samples were structurally characterised by Cs-corrected high resolution transmission electron
microscopy using a FEI Titan 80-300 operated at 300 kV
Raman measurements were carried out on a Jobin-Yvon LabRam using a 630 nm laser for
excitation Cathodoluminescence spectroscopy has been performed using a Zeiss DSM microscope
with a Gatan MonoCL3 cathodoluminescence system attached Light was dispersed by a 2400 lmm
grating blazed at 300 nm A Peltier cooled charge coupled device camera was used for detection
3 Results and Discussion
31 HRTEM
The HRTM images show that in both samples the anatase is nanocrystalline and mesoporous The
nanoparticles in both samples are either facetted or exhibit an irregular roundish shape Particles with
bad crystallinity or amorphous particles not shown here were observed more often in the Brij56
sample than in SDS However it has to be considered that the anatase is unstable against irradiation
under the electron beam Thus no quantification can be made on the relative amount of amorphous
anatase in the samples Defects are observed in both samples eg twins see figure 1
lower twin
upper twin
FFT twin
Figure 1 Cs-corrected HRTEM images of the anatase nanoparticles Left the SDS sample
Right the Brij56 sample with crystalline nanoparticles and a twin Inset power spectrum
Particle statistics was performed on both samples 495 particles were measured on SDS and lead to an
average particle size of 88plusmn27 nm in diameter ranging from 3 to 19 nm On the Brij56 sample 485
particles were evaluated resulting in an average diameter of 111plusmn32 nm ranging from 5 to 23 nm
16th International Conference on Microscopy of Semiconducting Materials IOP PublishingJournal of Physics Conference Series 209 (2010) 012039 doi1010881742-65962091012039
2
32 X-Ray Powder Diffractometry
Both samples were found to consist of pure anatase see figure 2 The particle sizes were determined
from the FWHM of the 101 reflection using the Scherrer equation with a form factor of K=09 The
resulting particle diameters were 70 nm for the SDS sample and 62 nm for the Brij56 sample These
values are smaller than the diameters determined from the TEM micrographs A possible explanation
for this discrepancy may be the following [8] (i) in very small particles the lattice constant depends on
the crystallite size This variation causes peak broadening (ii) twin domains contribute twice
independently to the spectrum while for the TEM analysis a twinned particle was counted only once
(iii) oxygen saturation in the surface area causes peak broadening In all these cases peak broadening
leads to an underestimate of the particle diameter from XRD Nevertheless the quantitative effect for
these powders is a matter for further investigation
Figure 2 X-ray diffraction pattern of both samples with anatase reflections indicated
33 Raman Spectroscopy
The Raman measurements show the phonon excitations for anatase The crystallite size can be
determined from the peak positions and from the full widths at half maximum (FWHM) of the Eg
peak see figure 3 [9] The Eg peak of SDS has the maximum at 1474plusmn02 cm-1
The maximum in the
Brij56 sample was found at 1452plusmn01 cm-1
The resulting particle diameters are 8 nm for SDS and 18
nm for Brij56 The FWHM measures 163plusmn05 cm-1
for SDS and 124plusmn01 cm-1
for Brij56 This leads
to 6 nm particle diameter in SDS and 8 nm in Brij56 Again in accordance with the TEM
measurements the nanoparticles are larger in the Brij56 sample
34 Nitrogen sorption
From the nitrogen sorption the BET surface area was determined to 184 m2g for the SDS sample and
140 m2g for the Brij56 sample The pore diameter was determined to 49 nm for SDS and 69 nm for
Brij56 The lower surface area and larger pore size for the Brij56 are in agreement with the results
from TEM particle statistics and Raman spectroscopy demonstrating larger particle size in Brij56
16th International Conference on Microscopy of Semiconducting Materials IOP PublishingJournal of Physics Conference Series 209 (2010) 012039 doi1010881742-65962091012039
3
75 100 125 150 175 200 225 250
02
04
06
08
10
Eg
λ=514 nm 300 K
SDS A-5
BRIJ
Norm
alis
ed In
ten
sity (
au
)
Raman-shift (cm-1)
Figure 3 Raman spectrum of both samples Shift of the Eg peak is due to phonon confinement
35 Scanning electron microscopy cathodoluminescence investigation
Cathodoluminescence (CL) measurements have been performed on both samples Optical transitions
of the samples were independent of the average crystal size of the analysed samples spatially
integrated spectra at 7 K are dominated by a broad luminescence band centred at 226 eV This broad
band has been reported to appear in anatase phase TiO2 single crystals epitaxial layers and nano-
crystals and has been attributed to self-trapped excitons at the TiO6 octahedron [10] Site selective
spectra taken with a focused electron beam revealed transitions at 335 eV with a line width of about 4
meV Spectra taken at different sites indicated spatial anti-correlation of areas showing broad band
luminescence at 226 eV and of those showing sharp UV transitions Figure 4 shows a typical CL
spectrum of the sharp transitions at higher energy resolution At the high energy site two main peaks at
33962 and 33535 eV are dominating the spectrum Both lines can be fitted by Lorentzian curves The
lines are separated by 42 meV The higher energy transition has an intensity that is about 1 of that at
lower energies Temperature dependent measurements show a shift to lower energies according to that
of the band gap of anatase TiO2 reported by Tang [11] Beside the main transition a number of phonon
replica are observed While the lower energy line at ~335eV has exclusively replica that correspond to
the B1g mode the higher energy transition at ~340eV has additional replica that are higher in intensity
than the main peak The latter is characteristic for the zero phonon line and its phonon replica of
indirect transitions in semiconductors
16th International Conference on Microscopy of Semiconducting Materials IOP PublishingJournal of Physics Conference Series 209 (2010) 012039 doi1010881742-65962091012039
4
Figure 4 CL spectra typical for both samples Left overview at different locations Right high
resolution spectrum of excitonic transitions
Tang et al [11] report on an indirect and direct gap that was found at 346 and 342 eV respectively
from absorption measurements in anatase single crystals From the energy separation of the optical
transitions their intensity relation and their specific phonon replica it is tempting to assign the
transitions found in our anatase nanocrystals to free excitonic transitions at the direct and indirect gap
of anatase TiO2 To confirm this we may in the following focus on the direct transition and its phonon
replica As can be seen in Figure 4 the 1- and 2- phonon replica have an asymmetric shape with a
steep edge at the low energy side and a high energy wing This shape if retained after background
subtraction could be characteristic for free excitons and due to the kinetic energy of the excitons that
is described by a Maxwell distribution Further support for the hypothesis of free excitons comes from
the almost linear increase of the FWHM of the luminescence peaks with increasing temperature The
transition at 33535 eV in Figure 4 shows a high energy shoulder A spectrum of that transition at
higher resolution is shown in Figure 5 A second peak is revealed with an energy separation of 748
meV to the direct free exciton transition We attribute this transition to the excited state of the direct
free exciton and estimate the exciton binding energy and the Bohr radius from this separation To do
so we need the basic parameters such as effective masses of electrons and holes and the static
dielectric constant There are a number of different values that have been reported especially for
effective masses of electrons and holes and for the static dielectric constant Taking me=10m0 and
mh=08m0 from [12] we obtain from
)2()( 2224neEnE g εmicro hminus= (1)
and
)( 00 mmmm ee +=micro (2)
a dielectric constant of 318 which is in good agreement with literature data ( 31=ε [13]) We can
also estimate a Bohr radius for the free exciton of 352=x
Ba nm and an exciton binding energy of 10
meV In fact we have no direct correlation between crystal size and optical transitions however
taking our value of the Bohr radius we do not expect quantum confinement effects for the particles
studied in this work since their diameter exceeds the Bohr radius by a factor of 3 Comparing our data
to that from the literature it is interesting to note that Monticone et al [7] analysing the absorption
edge of anatase nanoparticles found quantum confinement effects for anatase nanoparticles only for
with sizes in the range of 08 nm which supports our experimental findings of the bulk behaviour of
larger nanoparticles investigated in this study
16th International Conference on Microscopy of Semiconducting Materials IOP PublishingJournal of Physics Conference Series 209 (2010) 012039 doi1010881742-65962091012039
5
3345 3350 3355 3360 3365
50
100
150
200
250
300
350
400
450
500
CL 15 keV 10 nA 7K
Xdir
n=2
Xdir
n=1
33570 eV
33496 eV
CL
in
ten
sity (
au
)
energy (eV)
Figure 5 High resolution CL spectrum showing the ground state and the first excited state of the free
excitonic transitions
4 Conclusion In this study we analyse optical and structural properties of anatase nanoparticles by means of
HRTEM Raman spectroscopy and CL Cs-corrected HRTEM images show mesoporous nanoparticles
with numerous defects Additionally small amounts of amorphous particles in the same size range as
the anatase nanoparticles are being formed The nanoparticles with an average diameter of 88 and
111 nm respectively show strong free exciton transitions independent of their size From the excited
state of these transitions we determine the Bohr radius of anatase transitions to be 235 nm According
to the best of our knowledge this the first report on free excitonic transitions in anatase TiO2
References [1] Serpone N Lawless D and Khairutdinov 1995 J Phys Chem 99 16646
[2] Wunderlich W Miao L Tanemura M Tanemura S Jin P Kaneko K Terai A Nabatova-Gabin
N and Belkada R 2004 Int J Nanosci 3 439
[3] Linsebigler AL Lu G and Yates JT 1995 Chem Rev 95 735
[4] Hagfeldt A and Graumltzel M 1995 Chem Rev 95 49
[5] Chen X and Mao SS 2007 Chem Rev 107 2891
[6] Bersani D Lottici PP and Ding XZ 1998 Appl Phys Lett 72 73
[7] Monticone S Tufeu R Kanaev AV Scolan E and Sanchez C 2000 Appl Surf Sci 162 565
[8] Kaszkur Z 2006 Z Kristallogr Suppl 23 147
[9] Zhang WF He YL Zhang MS Yin Z and Chen Q 2000 J Phys D 3 912
[10] Tang H Berger H Schmid PE and Leacutevy F 1993 Solid State Comm 87 847
[11] Tang H Leacutevy F Berger H and Schmid PE 1995 Phys Rev B 52 7771
[12] Enright B and Fitzmaurice D 1996 J Phys Chem 100 1027
[13] Roberts S 1949 Phys Rev 76 1215
16th International Conference on Microscopy of Semiconducting Materials IOP PublishingJournal of Physics Conference Series 209 (2010) 012039 doi1010881742-65962091012039
6
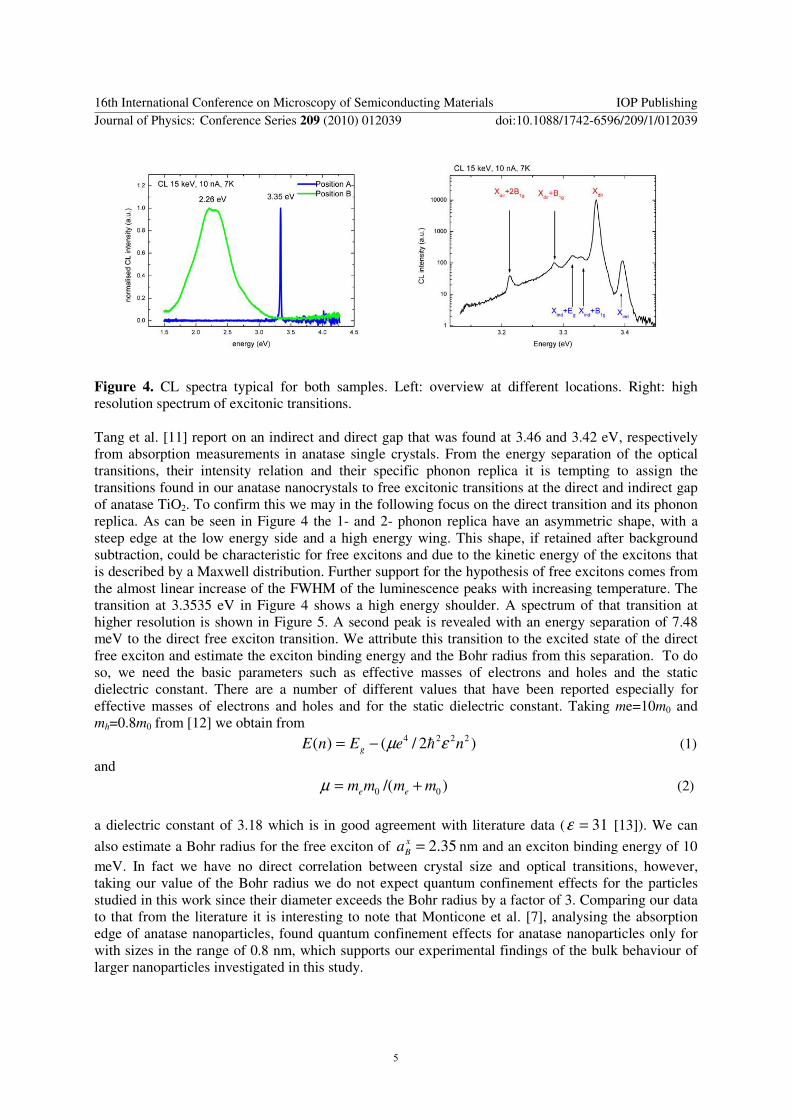
Recommended