Boise State UniversityScholarWorksCivil Engineering Faculty Publications andPresentations Department of Civil Engineering
6-1-2014
Strength and Stiffness Characterization ofControlled Low-Strength Material Using NativeHigh-Plasticity ClayBhaskar ChittooriBoise State University
Anand J. PuppalaUniversity of Texas at Arlington
Anil RaaviUniversity of Texas at Arlington
This is an author-produced, peer-reviewed version of this article. The final, definitive version of this document can be found online at Journal ofMaterials in Civil Engineering, published by the American Society of Civil Engineers. Copyright restrictions may apply. doi:10.1061/(ASCE)MT.1943-5533.0000965

Strength and Stiffness Characterization of Controlled Low Strength Material (CLSM) Using Native High Plasticity Clay
Bhaskar ChittooriAssistant Professor
Dept. of Civil EngineeringBoise State University
Anand J. PuppalaDistinguished Teaching Professor and Associate Dean
(Corresponding Author)Dept. of Civil Engineering
The University of Texas at [email protected]
Anil RaaviFormer Graduate Student
Dept. of Civil EngineeringThe University of Texas at Arlington
ABSTRACT
A research attempt was made to design a CLSM mix that can be used as bedding and haunch material for a pipeline, by using the native soil as fine aggregate. Several CLSM mix designs were attempted using native high plasticity clay as fine aggregate material. Comprehensive material characterization studies including flowability to strength tests were performed. These results were analyzed to address the applicability of each mix to serve as pipe bedding/backfilling zones in a pipeline construction. Both flowability and density test results are first evaluated and as a result several mixes are formulated. These mixes were further subjected to engineering characterization related studies and this paper presents these testresults. Setting time, strength and stiffness results as well as excavatability evaluations of these mixtures are covered as a part of these studies. These results indicate that the CLSMs can be produced using native high plasticity soils with strength properties always matching specified requirements. Certain relaxation on setting time periods could further help in developing economical mix designs. CLSMs that meet project specifications are recommended for field implementation.
CE Database subject headings: Flowable fill, Controlled Low Strength Material (CLSM), High Plasticity Clay, Flowable Mortar, soil-cement slurry
INTRODUCTION AND BACKGROUND
Sustainability is becoming a key aspect in major construction projects as developing sustainable or utilization of native or reusable materials can substantially reduce project costs and minimize negative impacts on the environment (Puppala and Hanchanloet, 1999; Abreu et al., 2008; Chittoori et al., 2012). The research team at The University of Texas at Arlington is making one such attempt for a major pipeline construction project; by developing a sustainable Controlled Low Strength Material (CLSM) using in situ excavated high plasticity material prevalent along the pipeline alignment (Puppala et al., 2007, Puppala et al., 2012).
This is an author-produced, peer-reviewed version of this article. The final, definitive version of this document can be found online at Journal of Materials in Civil Engineering, published by the American Society of Civil Engineers. Copyright restrictions may apply. doi: 10.1061/(ASCE)MT.1943-5533.0000965
1
The present research study focused on the development of CLSM mix-designs using native high plastic clay materials present along the pipeline alignment. If successful, the clay based CLSMs will enhance sustainability aspects of major construction projects by reutilization of large amounts of excavated fine clayey soils. Reutilization of excavated materials will positively impact both economic and environmental issues as landfilling these materials is both expensive and raises vehicle emissions due to transportation of material from site to landfill. Reutilizing the excavated material can, also minimize other issues such as damage to local city pavements around the construction project site due to constant use by the dump trucks. Hence, the development of native clay based CLSMs is an appropriate sustainable solution to this problem.
The mix designs in detail along with the literature available on various natural and manmade materials that can be utilized in the CLSM mix designs are extensively covered by Kumar et al. (2007) and Raavi (2012). Details of the research investigations were also summarized in Raavi (2012) and these indicate that a laboratory mix design was attempted to develop CLSMs using native clays as fine aggregate materials.
As a part of the research several tests including flow, density, strength and excavatability related tests were conducted on CLSMs mixed with fat clays (CH alone) and a mixture of fat and lean clays (CL and CH material mixture). Main focus of the analysis was centered on whether the CLSMs designed have characteristics that are expected of traditional CLSMs to be used in pipe bedding and pipe zone materials. This present paper covers undrained shear strength test results obtained by performing unconfined compression strength (UCS) tests along with the interpretation of stiffness properties and excavatability assessments of the same CLSM mixes.
MATERIALS AND METHODS
Two different soils from sites A and B locations along the proposed pipeline alignment were selected in this research. Soil from site A was classified as low plastic clay (CL), while the one from site B was classified as high plastic soil. Table 1 presents the gradation and plasticity characteristics of these soils. Using these two soils, two types of fine aggregates were prepared to be used as an ingredient in CLSM mix design in place of conventional fine aggregates such as Foundry sand or ASTM C-33 Sand. The first type is termed as Soil A and it consists of high plastic soil alone from site A while the second type, termed as Soil B, consisted of a combination of high and low plastic soils from sites A and B in 1:1 ratio.
Cement, lime and fly ash were used as binders, individually and in combinations with varying proportions. Portland cement Type I/II, quick lime and Class C Fly Ash were used in this research. The Class C fly ash contained about 30% Calcium Oxide (Cao) and 55% Silica (SiO2) along with other minor constituents. Also, a non-chloride set accelerator, calcium formate (C2H2CaO4), was added to some of the CLSM mix designs to further investigate the changes in performance of CLSMs when set accelerators were used to reduce the setting time of these mixes. Table 2 lists all the notations used for different CLSM mixes prepared in this research.
Test Procedures
The strength of the CLSM samples was determined by conducting Unconfined Compression Strength (UCS) test which gives a quick and reliable indication of the strength of the prepared sample. UCS test was conducted as per ASTM D2166. Another important aspect that needs to be tested is ‘setting time’ which determines the time lag between the lifts of CLSM layers placed during construction. This was determined using Vicat apparatus as per ASTM C403 method. Both these test procedures are explained in detail in the following sections.
Unconfined Compressive Strength Test
The CLSM samples prepared here were subjected to unconfined compressive strength (UCS) testing as per ASTM D 2166 method at 7 and 28 days. The cylindrical specimens were prepared by pouring the representative mix material into single-use plastic casting molds; dimensions of these molds are 15 cm height and 7.5 cm diameter with a cross-section area of 176.6 cm2. The maturation begun on a countertop for seven days, and then under saturated conditions into the humidity controlled room for twenty one days. For each CLSM mix, the UCS was calculated by taking average from tests on two identical specimens. Tests were conducted at seven and twenty-eight days of maturation, immediately after removing specimens from the casting molds. Also, the loading rate was maintained at 1% strain per minute or 1.42 mm/min.
This is an author-produced, peer-reviewed version of this article. The final, definitive version of this document can be found online at Journal of Materials in Civil Engineering, published by the American Society of Civil Engineers. Copyright restrictions may apply. doi: 10.1061/(ASCE)MT.1943-5533.0000965
2
Setting Time
ASTM C 403 procedure was followed for evaluating the setting time for all the mix designs; this proceduremeasured the time required for the material to resist 2.5 cm penetration of Vicat’s needle. The apparatus for this test included a plastic conical mold, a plastic plate, a sampling and mixing receptacle, a filling apparatus, a plunger, a penetration needle, and a pipette. The container used was a plastic conical mold with bottom diameter of 7 cm and a top diameter of 6 cm, and a length of 4 cm. The mold was non-absorptive, rigid and watertight. The penetration needle used a plunger that can apply loads of 7 kPa. The conical plate and the plastic plate assembly was placed on a flat level surface, and the components were held together firmly while filling the material. The CLSM material was thoroughly mixed in the receptacle and then poured in to the conical mold until it was filled. The excess material was removed by using a straightedge.
Just prior to starting the penetration test, the water bled from the surface was removed with the help of the pipette. The needle assembly was placed in contact with the surface of the tested specimen, and it was then released to start the test. The readings were taken until the depth of penetration retarded to twenty five mm from the mold surface, avoiding the areas where the CLSM has been disturbed by previous trails, as required by the ASTM test procedure. The time required for achieving that penetration was recorded as the setting time.
ANALYSIS OF TEST RESULTSTest results obtained from the experimental program are comprehensively evaluated here to determine their compressive strength, elastic moduli, setting time and excavatability issues of the various CLSM mixes designed in the present experimental program. It should be noted here that in this study sustainability analysis was not performed to assess the economic, environmental and social advantages of using native soil CLSMs versus conventional CLSMs. However, a detailed discussion on the relative advantages and disadvantages of using treated native materials versus imported materials was presented in Puppala et al. (2012).
Unconfined Compressive Strength (UCS) Results
UCS tests were performed on duplicate samples for each soil/binder combinations. For a mix to be considered successful and further verified to be used as pipe bedding and haunch material, it should meet target strength of aminimum of 483 kPa (70 psi) to a maximum of 1,034 kPa (150 psi) after 28 days as per TRWD specifications. Several trial mixes were prepared to determine the optimum dosage of binder at the optimum water content as obtained from flow test results to achieve a required minimum strength of 483 kPa (70 psi). The minimum strength was specified by the owners as per the pipeline bedding material specification.
Several CLSM mixes were prepared and tested using lime, cement and fly ash binders, both individually and in combinations for both type-A and type-B soils. As explained earlier, type-A soils consist of high plasticity soils alone used as fine aggregates in the CLSMs. Type-B soils contain combined high plasticity and low plasticity soils in 1:1 proportion and these soils are used as fine aggregates for CLSMs. A total of 26 CLSM mix designs were performed which includes 13 different mixes each for type-A and type-B soils, respectively. The UCS values obtained from UCS tests at 7-days and 28-days of curing are presented in Table 3 and Table 4 for type-A and type-Bsoils, respectively.
The CLSM mixes using 20% lime and 30% fly ash binders as standalone binders did not yield required minimum strengths after 28 days of curing, hence these mixes with sole binders are not recommended for the CLSMs for the present construction. Cement binder and its dosages ranging from 6% to 15%, on the other hand, yielded strengths higher than the minimum UCS values. Hence, lime and fly ash binders are used in conjunction with cement binder in a few other CLSMs, which yielded required strengths at lower dosage quantities.
Effect of Binder Type
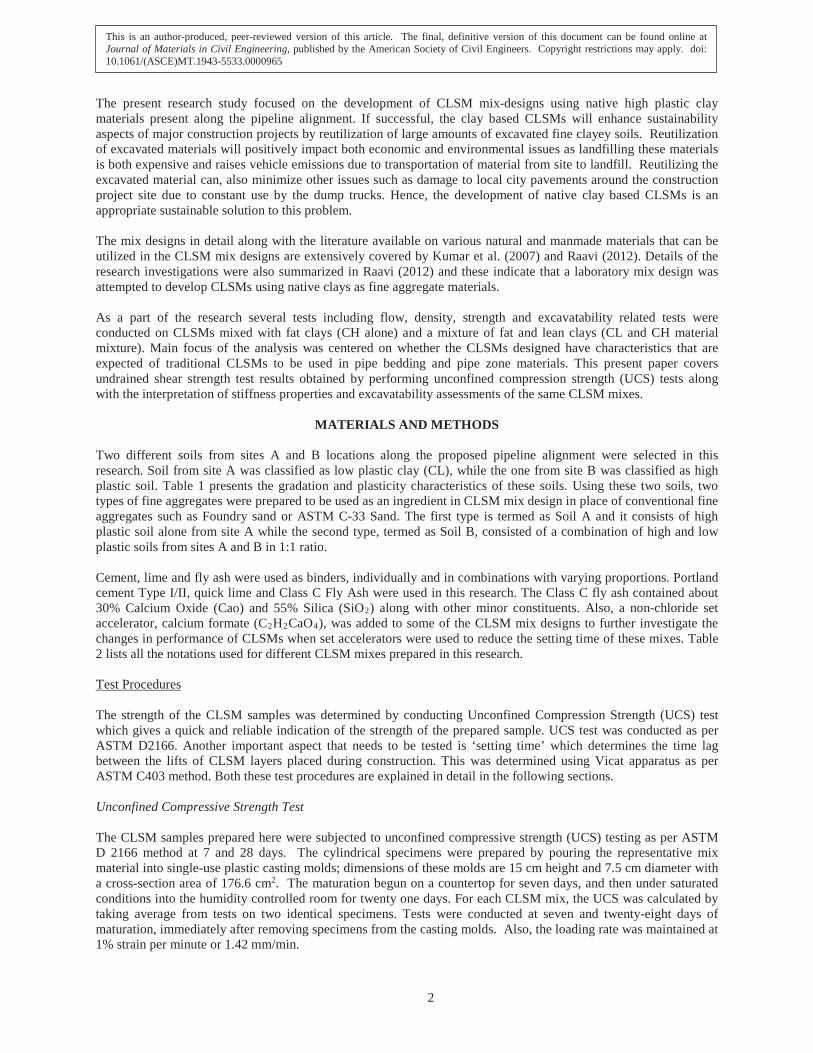
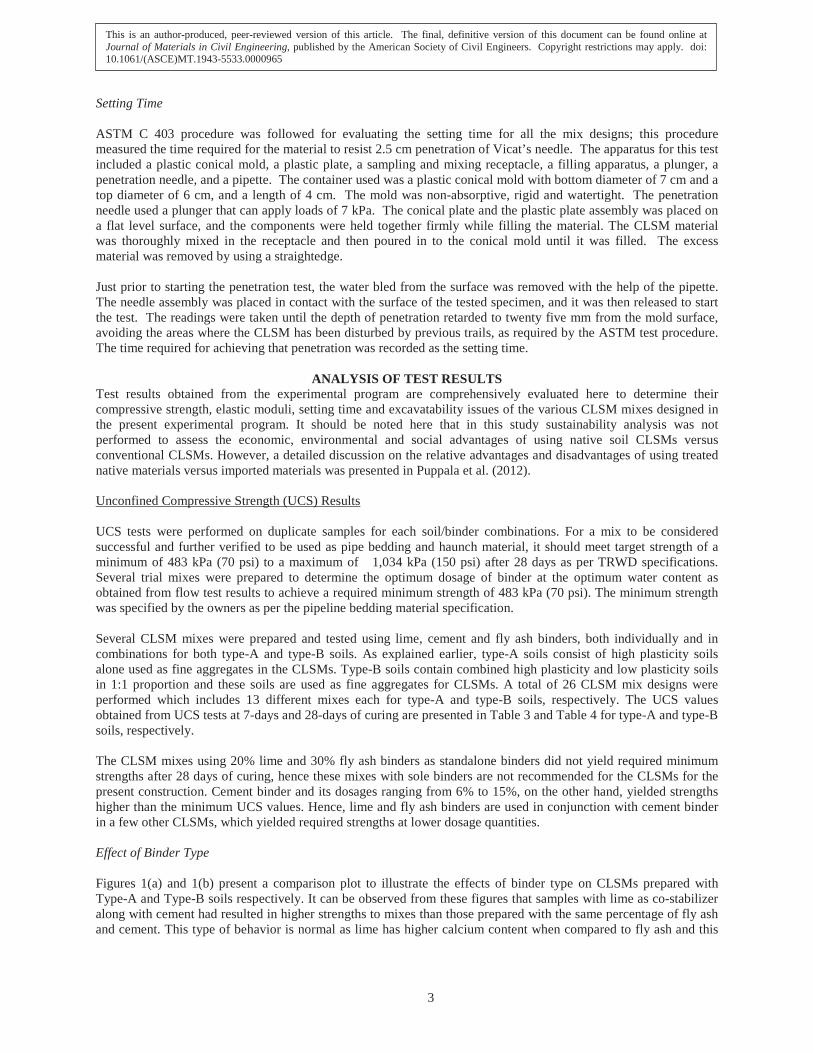
Figures 1(a) and 1(b) present a comparison plot to illustrate the effects of binder type on CLSMs prepared with Type-A and Type-B soils respectively. It can be observed from these figures that samples with lime as co-stabilizer along with cement had resulted in higher strengths to mixes than those prepared with the same percentage of fly ash and cement. This type of behavior is normal as lime has higher calcium content when compared to fly ash and this
This is an author-produced, peer-reviewed version of this article. The final, definitive version of this document can be found online at Journal of Materials in Civil Engineering, published by the American Society of Civil Engineers. Copyright restrictions may apply. doi: 10.1061/(ASCE)MT.1943-5533.0000965
3
assists in developing higher amounts of pozzolanic compounds which in turn give better strength development. It should be noted here that direct comparisons could not be made among individual binder types without combinations, as lime and fly ash stabilizers alone did not yield tangible strengths.
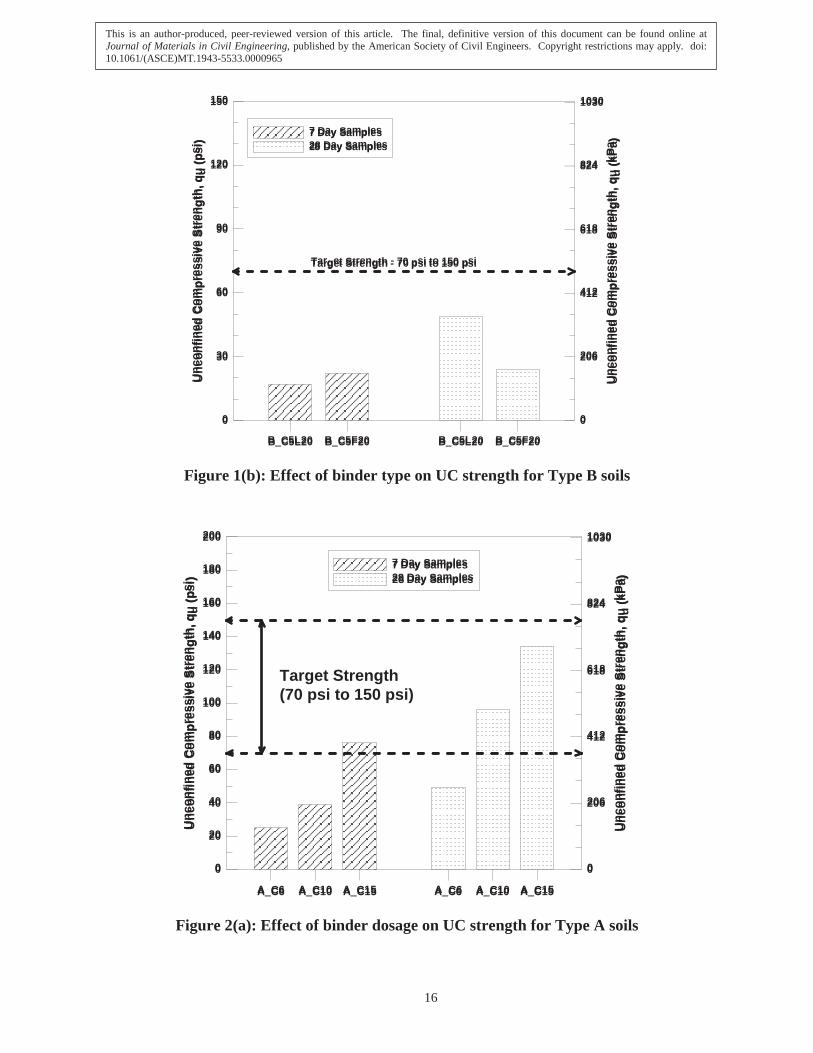
Effect of Binder Dosage
Figures 2(a) and 2(b) present a comparison plot to illustrate the effects of Cement binder and its dosages on CLSMs prepared with both type-A and type-B soils, respectively. It can be observed from these figures that Cement dosage amount has increased the UCS values. This is expected as higher cement content in a CLSM facilitates an increased pozzolanic activity and related pozzolanic strength compound formation that resulted in enhanced strengthening ofthe soil sample.
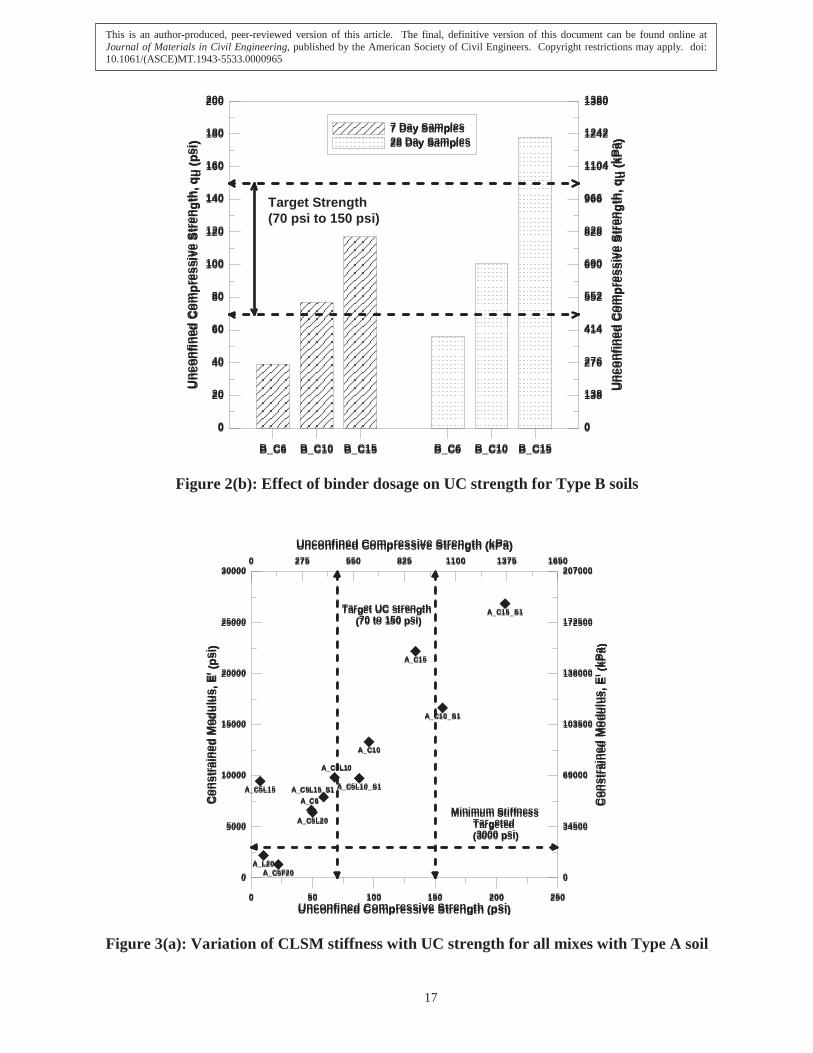
CLSM Stiffness
The elastic modulus of the CLSM material was obtained as the secant modulus at 50% of peak strength (E50) from the stress-strain plots obtained from UCS tests. Since the novel CLSM material will be used as bedding material for a buried flexible pipe, the elastic modulus values are converted to a corresponding Constrained Modulus or Modulus of soil reaction (E’) as per the Equation 1 (Howard, 1977). As per Howard (1977), the E’ values for a well compacted bedding layer can be as high as 20.7 MPa (3000 psi) and a minimum value of 4.8 MPa (700 psi) is typically recommended for compacted soil layers used as bedding materials. In this research, since the intent is to use cementitious CLSMs as bedding layers, a minimum stiffness value of 20.7 MPa (3000 psi) is targeted for satisfactory performance and selection of CLSMs.= ( )( )( ) (1)
Where
Tables 5 and 6 present secant elastic modulus (E50) and the constrained modulus (E’) for all CLSM mixes for type-A and type-B soils, respectively. The calculations are made on the UCS tests conducted on CLSM specimens cured at twenty-eight days. The range of the secant elastic moduli determined for the present CLSM mixes was 54 to 240 times the corresponding compressive strength at 28 days of curing. Kim et al. (2011) found that E50 values for rubber-added flowable fill material ranged between 87 to 172 times the UCS values. Another study conducted by Tang et al. (1996), which investigated the use of air-foam added light weight soils in CLSM mix design, showed E50values in the range of 40 to 260 times the UCS. Therefore, the stiffness values obtained in this study are well within the expected range for CLSM materials.
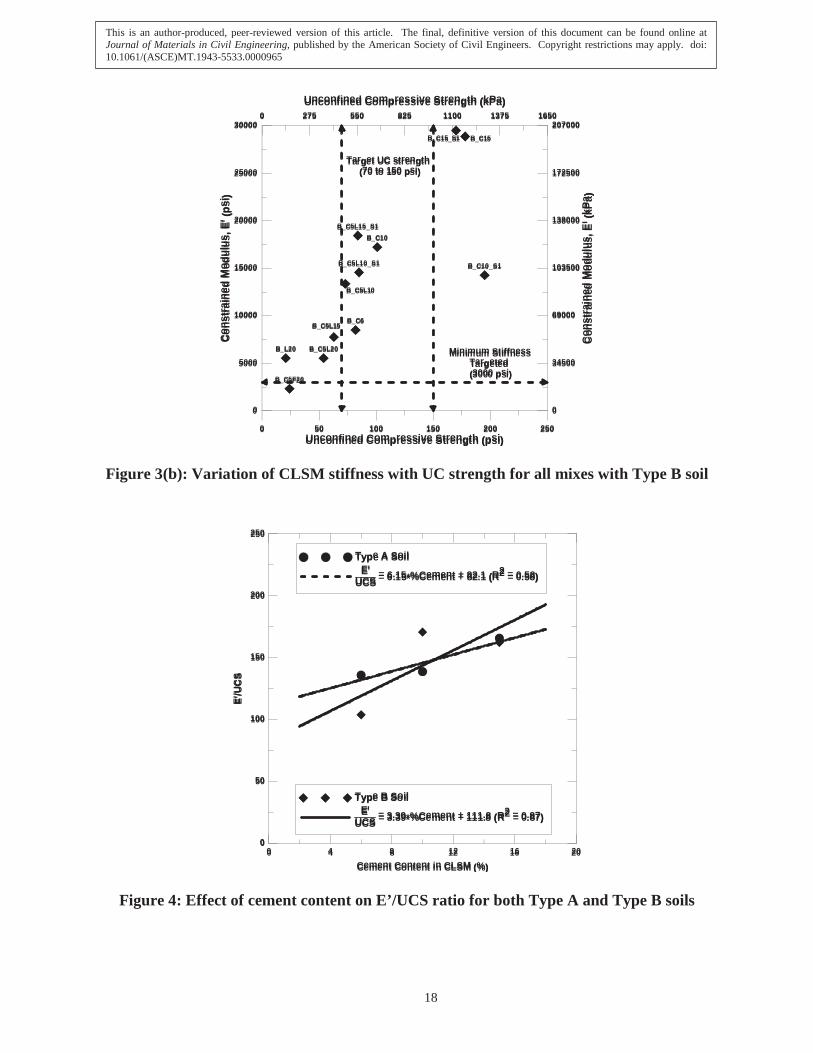
Figure 3(a) and Figure 3(b) present graphical trends between the UC strength and the Constrained Modulus values for type A and type B soils, respectively. These figures show zones of satisfactory performance within which the CLSMs exhibit properties that are acceptable for field applications. It can be observed from Figure 3(a) that mixes A_C10, A_C15 and A_C10_S1 are acceptable while Figure 3(b) shows that mixes B_C6, B_C10, B_C5_L10, B_C5_L10_S1, B_C5_L15_S1 are acceptable from the strength and stiffness perspectives. This indicates that for high plasticity clays of Type A, higher dosages of cement treatments are needed to make the mixes to meet CLSM properties whereas for mixed plasticity clays of Type B, both cement and lime additives and their combinations would help in achieving targeted CLSM properties.
Effect of Additive Type and Dosage
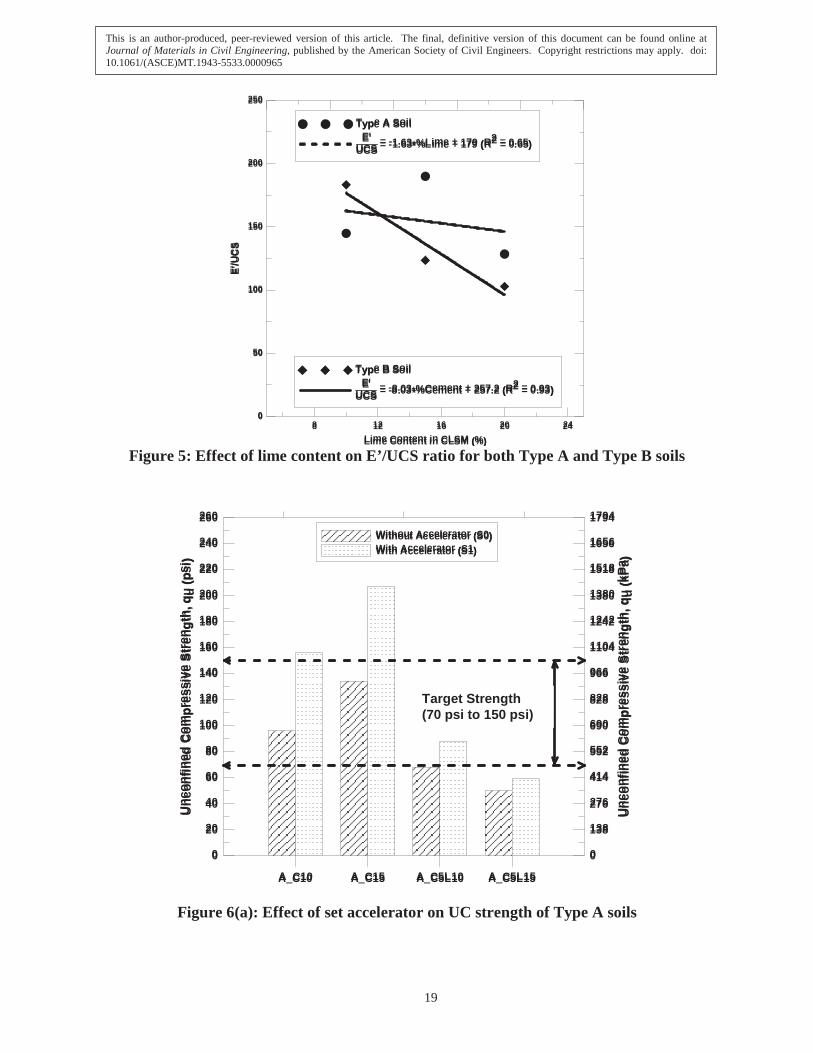
In order to study the effects of additive type and dosage on both strength and stiffness of the CLSM material, the ratio between the Constrained Modulus and UC strength (E1/qu) for various mixes is calculated and plotted against lime and cement dosage contents for both soil type mixes. Figure 4 presents the influence of cement content on the stiffness to strength ratio for both type A and type B soils, while Figure 5 presents the effects of lime content on the same ratio for both soil mixtures. Observations made in the case of the UCS strength trends are also valid for the ratios as the cement content increase resulted in an increase in stiffness to strength ratio while the lime content
This is an author-produced, peer-reviewed version of this article. The final, definitive version of this document can be found online at Journal of Materials in Civil Engineering, published by the American Society of Civil Engineers. Copyright restrictions may apply. doi: 10.1061/(ASCE)MT.1943-5533.0000965
4
addition has resulted in the decrease of this ratio. This reconfirms that cement treatment enhancements for both ultimate strength and elastic moduli of soil mixtures are larger than the lime treatments due to increased pozzolanic activity of this additive.
Setting Time
Another important aspect that should be studied while designing CLSM mix is the time period at which the mix would reach an initial strength value that allows for the placement of the next lift or layer. This aspect is especially important during construction as this determines how time for the placement of the next CLSM layer. This parameter is known as ‘setting time’ and can be determined by several laboratory test procedures. In this research,Vicat’s needle and test method was used and the test procedure followed was explained in the previous sections. These tests were conducted on each mix to determine its setting time and assess whether the results meets the required specifications. The specifications followed for pipeline trench construction require a setting time of less than five hours.
Due to the high water content needed to meet the flowability requirement of the CLSMs prepared with native clays,the researchers noted that all CLSM mixes without any chemical set accelerator did not pass the set time requirement. Table 7 presents various setting times measured for different CLSM mix proportions without any setaccelerator being used. From this table it can be observed that mixes with the cement as binder have lower setting times, as expected, because of the early strength gaining with the cement treatment. Overall, all three additives used in this research did not result in CLSM mixes that satisfy the setting time requirement.
Set accelerators are considered and added to select mix proportions whose 28 days strengths achieved the target values (483 to 1,034 kPa). As an initial attempt, set accelerator amount of 8% by dry weight of total chemical additive was used in the CLSM preparation. Setting times measured on these CLSMs did not meet required time period of five hours or less. Hence, a second attempt was made by increasing the dosage to 8% of total dry soil amount which is about 50 to 70% of the chemical additive, depending on the amount of chemical additive. Table 8presents the various setting times measured for different CLSM mix proportions with S1 set accelerator. It can be observed from this table that some of the CLSMs measured setting times close to 5 hours. However, it should be noted here that the amount of set accelerators used in these mixes was high and this could result in expensive CLSM mix designs. Hence, it would be efficient to relax the setting time requirements by adjusting the construction operation and thereby reducing the use of set accelerators in the CLSM mix design.
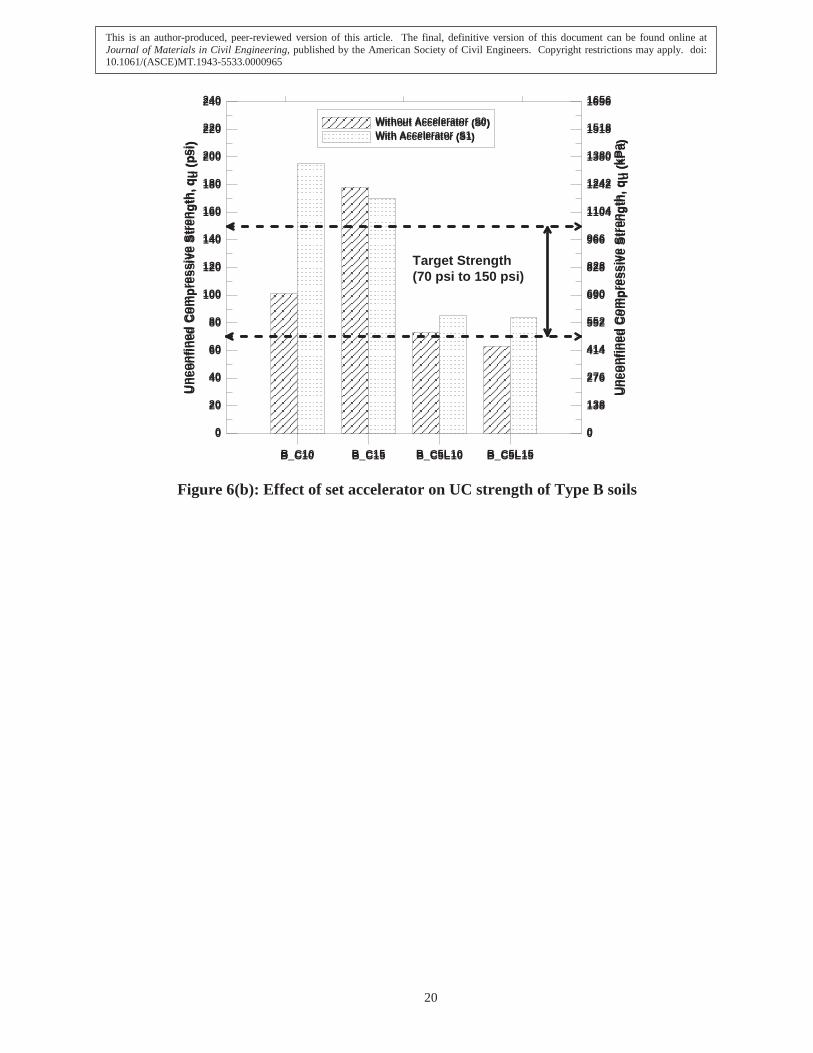
Since addition of set accelerators can alter the chemical reactions within the CLSMs, it is necessary to reexamine the strength behavior of the CLSM mixes treated with set accelerators. UCS tests were conducted on mixes with and without set accelerator dosages and test results are compared here. It is reported that accelerating admixture increases the reactivity and hydration of C2S forming CSH (calcium silica hydrate) gel and thereby increasing the rate of chemical and pozzolanic reactions and hence result in faster improvements in strengths of the CLSMs. This observation is in agreement with those reported by Ramachandran (1984).
For type A mixes, the UCS data of the two mixes with cement as sole binder treatment (A_C10_S1, and A_C15_S1), was increased by 62.5% and 54.4%, respectively; for the same mixes with a combination of cement and lime as binder treatment (A_C5L10_S1, and A_C5L15_S1), the UCS results were enhanced by 25.7% and 18.0%, respectively (see Figure 6(a)). For soil B mixes (see Figure 6(b)), the set accelerator increased UCS values by 68.3% (B_C10), exceeding the TRWD required UCS value. For soil B mixes with lime and cement as additive treatments, UCS was increased by 16.4% (B_C5L10), and by 33.3% (B_C5L15). These results confirmed set accelerator’s strengthening action. This admixture increased the reactivity, which in turn increased CLSM mix strength, especially at early maturation stages.
Excavatability
The use of CLSM as backfill material for a pipeline requires the material to be excavatable in the future for repair or maintenance of the pipeline. Hence, the CLSM should not develop high strength in the future. Several approaches are in practice to predict the long term strength of CLSM. In this research, the approach used to study the excavatability of CLSM was described in the Hamilton County and City of Ohio (HAMCIN) specification for the performance of CLSMs in the field (HAMCIN: CLSM-CDF, 1996). As per this approach a parameter known as
This is an author-produced, peer-reviewed version of this article. The final, definitive version of this document can be found online at Journal of Materials in Civil Engineering, published by the American Society of Civil Engineers. Copyright restrictions may apply. doi: 10.1061/(ASCE)MT.1943-5533.0000965
5

Removability Modulus (RE) is determined based on the in-situ unit weight and the 28-day unconfined compressive strength of the CLSM mix using Eq. 2. The mix is passed as excavatable if the RE value is less than or equal to one and if the RE value is more than 1 the CLSM mix is discarded.= . × × . 1.0 (2)Where, RE = Removability Modulus
w = In-situ unit weight (pcf)C = 28-day unconfined compressive strength (psi)
Some of the aforementioned mixes whose 28 day compressive strengths are nearer or greater than 483 kPa (70 psi)were evaluated for excavatability using the approach explained above. Materials having RE factor less than or equal to 1 are said to be excavatable. Excavatability data of the select mixes is presented in Table 9. For A type soil mixes prepared with 10% cement, 5% cement+10% lime, and 5% cement+10% lime and S1 set accelerator are found to be excavatable; whereas for type B soil, mixes with 5% cement+10% lime and 5% cement+15% lime are said to be excavatable with and without the use of set accelerator.
SUMMARY AND CONCLUSIONS
Successful native material utilization in CLSMs will reduce import of fine aggregates to the construction site, minimize carbon emissions arising from fine aggregate crushing plants, reduce the use of landfilling space and sites, and lessen the damage caused to pavement infrastructure due to export of excavated native material by large trucks. All these in turn will have societal implications as smooth construction of a pipeline without impacting the lives of public and infrastructure along the project site. Two soils, which are predominantly clayey soils in nature, were selected to evaluate their usage as fine aggregates in the CLSM mix design. Efforts were made to reduce the usage of cement to make the mix designs cost effective by varying binder types and binder proportions. This research developed a total of twenty four (24) CLSM mixes, using high plasticity clay alone, and a combination of high and low plasticity clays along with different types and dosages of chemical binders (cement, lime, and fly ash). A few of these mix designs used set accelerators to improve the setting times of CLSMs. The following summarizes the conclusions made from these research investigations.
1. Overall this research was successful in the developing mix designs for CLSM using native soils as a fine aggregate material. However, it was observed that high amounts of moisture contents will be required to make the mix flowable.
2. It was observed that an increase in cement content resulted in an increase of compressive strength and stiffness properties of the CLSM mixes made of both soil A and B.
3. It was also observed that samples with lime as co-stabilizer along with cement had resulted in higher strengths and stiffness than those prepared with the same percentages of Fly Ash and Cement. This kind of behavior is expected as lime has higher calcium content than fly ash.
4. Set accelerator used to lower the setting time enhanced the strength of A_C10_S1, A_C15_S1, B_C10_S1 and B_C15_S1 mixes making them hard to excavate in future for any repairs or maintenance. Hence, it is important to maintain a balance between the setting time and excavatability of the CLSM mix especially when using set accelerators.
5. The average 28 day compressive strength requirement of 483 to 1,034 kPa (70 to 150 psi) as per TRWD, was reached by A_C10, A_C15, A_C5L10_S1, B_C10, B_C5L10, B_C5L10_S1 and B_C5L15_S1 mixes. Table 10 presents these recommended mixes along with their relative quantities that could be tested for further evaluation and assessments in the field.
ACKNOWLEDGEMENTS
Authors would like to thank Tarrant Regional Water District (TRWD) and Integrated Pipe Line (IPL) team for their assistance with various research activities related to soil sampling and coordination among various groups and research teams. Researchers also thank Fugro Consultants Inc., Dallas Geotech group members for their help in transferring soil samples to UTA Geotechnical laboratories.
This is an author-produced, peer-reviewed version of this article. The final, definitive version of this document can be found online at Journal of Materials in Civil Engineering, published by the American Society of Civil Engineers. Copyright restrictions may apply. doi: 10.1061/(ASCE)MT.1943-5533.0000965
6
REFERENCES
Abreu, D. G., Jefferson, I., Braithwaite, P. A. and Chapman, D. N. (2008). “Why is sustainability important in geotechnical engineering?” Proc. of Geocongress – 2008, ASCE, New Orleans, LA, 821-828.
Chittoori, B., Puppala, A. J., Reddy, R., and Marshall, D. (2012), “Sustainable Reutilization of Excavated Trench Material”, GeoCongress 2012, Oakland, GSP 225, March 25-29 2012, pp. 4280-4289.
HAMCIN:CLSM-CDF (1996). “A performance specification for controlled low strength material - controlled density fill.” <http://www.cincinnati-oh.gov/dote/linkservid/4B3C34CC-FAB9-4315-B660D6B8C22DA441/showMeta/0/>, (Jun. 19, 2013).
Howard, A. (1977). “Modulus of Soil Reaction Values for Buried Flexible Pipe.” J. Geotechnical Engineering,103(1), 33-43.
Karduri, R. K. R. (2011). “Sustainable reutilization of excavated trench material.” M.S. Thesis, The University Texas, Arlington, TX, 114.
Kim, Y. T., and Kang, H. S., (2011) “Engineering characteristics of rubber-added lightweight soil as a flowable backfill material.” J. Mater. Civ. Eng., 23(9), 1289-1294.
Kumar, A., Walia, B. S., and Abjaj, A. (2007). “Influence of fly ash, lime, and polyester fibers on compaction and strength properties of expansive soil.” J. Mater. Civ. Eng., 19(3), 242–248.
Puppala, A., Saride, S., and Williammee, R. (2012). ”Sustainable Reuse of Limestone Quarry Fines and RAP inPavement Base/Subbase Layers.” J. Mater. Civ. Eng., 24(4), 418–429.
Puppala, A.J. and Hanchanloet, S. (1999) “Evaluation of a Chemical Treatment Method (Sulphuric Acid and Lignin Mixture) on Strength and Resilient Properties of Cohesive Soils.” Proceedings of the 78th Transportation Research Board Annual Meeting, CD ROM.
Puppala, A. J., Balasubramanyam, P., and Madhyannapu, R. S., (2007) “Experimental investigations on properties of controlled low-strength material.” Ground Improvement J., 11(3), 171-178.
Puppala, A. J., Chittoori, B., Shelly, H., and Marshall, D. (2012), “Chemical Amendment of Excavated Trench Material for Sustainable Reuse”, proceedings Pipelines 2012: Innovations in design, construction, operations and maintenance, Miami beach, May, 2012, pp. 552-561.
Raavi, A. (2012). “Design of controlled low strength material for bedding and backfilling using high plasticity clay.”, M.S. Thesis, The University Texas, Arlington, TX, 118.
Ramachandran, V. S. (1984). “Accelerators.” Concrete Admixtures Handbook: Properties, Science, and Technology,V. S. Ramachandran, ed., Park Ridge, N.J, 185-285.
Tang, Y. X., Tsuchida, T., Shirai, A., Ogata, H., and Shiozaki, K. (1996). “Triaxial compression characteristics of super geomaterial cured underwater.” Proc., 31st Conf. on Geotechnical Eng., 2493–2494.
This is an author-produced, peer-reviewed version of this article. The final, definitive version of this document can be found online at Journal of Materials in Civil Engineering, published by the American Society of Civil Engineers. Copyright restrictions may apply. doi: 10.1061/(ASCE)MT.1943-5533.0000965
7

Table 1: Soil properties and USCS classification
Soil Properties Borehole 15 Borehole 14
Percent Gravel, % 1.0 12.0
Percent Sand, % 12.0 25.0
Percent Silt, % 37.0 31.0
Percent Clay, % 50.0 32.0
Liquid Limit 62.0 42.0
Plasticity Index 37.0 23.0
USCS Classification CH CL
Table 2: Symbols adopted for identification of different CLSM mixes
Symbol Material and Quantity Ingredient Role
A CH Material Fine AggregateB CL and CH Mixture by same percent
C % Cement by dry weight of soil
BinderL % Lime by dry weight of soil
F % Fly Ash by dry weight of soil
S1 8% Set accelerator by dry weight of soil Additive
This is an author-produced, peer-reviewed version of this article. The final, definitive version of this document can be found online at Journal of Materials in Civil Engineering, published by the American Society of Civil Engineers. Copyright restrictions may apply. doi: 10.1061/(ASCE)MT.1943-5533.0000965
8
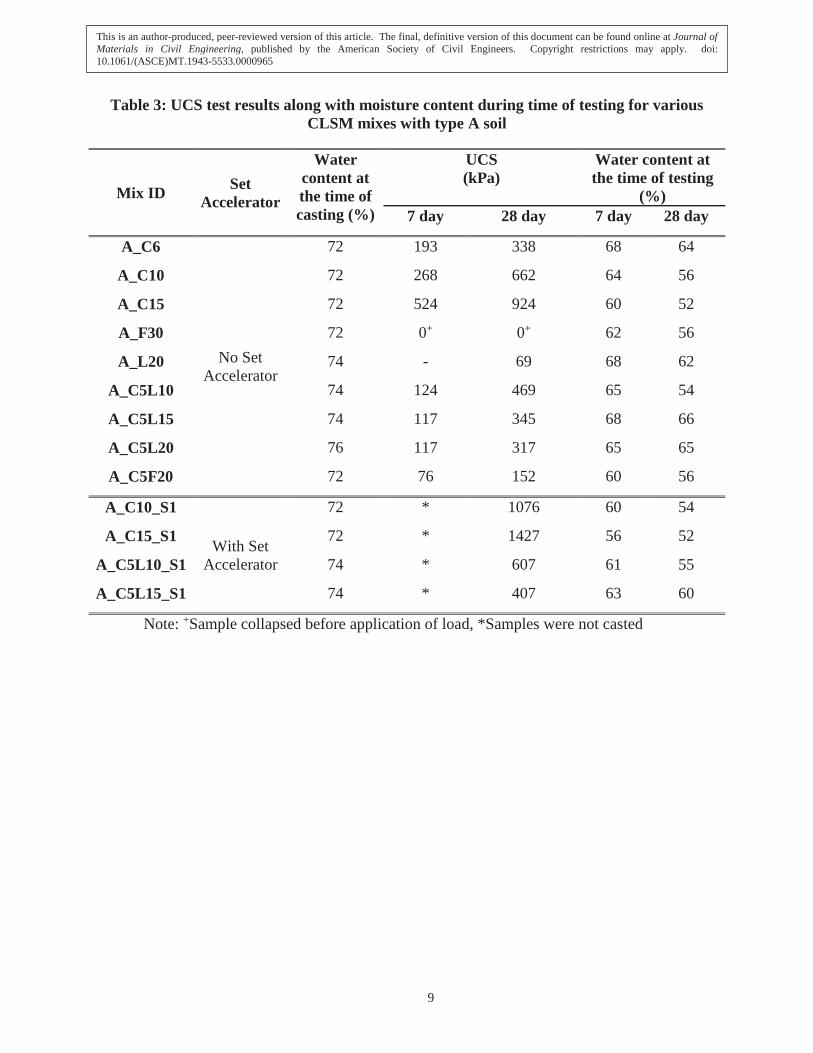
Table 3: UCS test results along with moisture content during time of testing for various CLSM mixes with type A soil
Mix ID Set Accelerator
Water content at the time of casting (%)
UCS (kPa)
Water content at the time of testing
(%)7 day 28 day 7 day 28 day
A_C6
No Set Accelerator
72 193 338 68 64
A_C10 72 268 662 64 56
A_C15 72 524 924 60 52
A_F30 72 0+ 0+ 62 56
A_L20 74 - 69 68 62
A_C5L10 74 124 469 65 54
A_C5L15 74 117 345 68 66
A_C5L20 76 117 317 65 65
A_C5F20 72 76 152 60 56
A_C10_S1
With Set Accelerator
72 * 1076 60 54
A_C15_S1 72 * 1427 56 52
A_C5L10_S1 74 * 607 61 55
A_C5L15_S1 74 * 407 63 60
Note: +Sample collapsed before application of load, *Samples were not casted
This is an author-produced, peer-reviewed version of this article. The final, definitive version of this document can be found online at Journal of Materials in Civil Engineering, published by the American Society of Civil Engineers. Copyright restrictions may apply. doi: 10.1061/(ASCE)MT.1943-5533.0000965
9
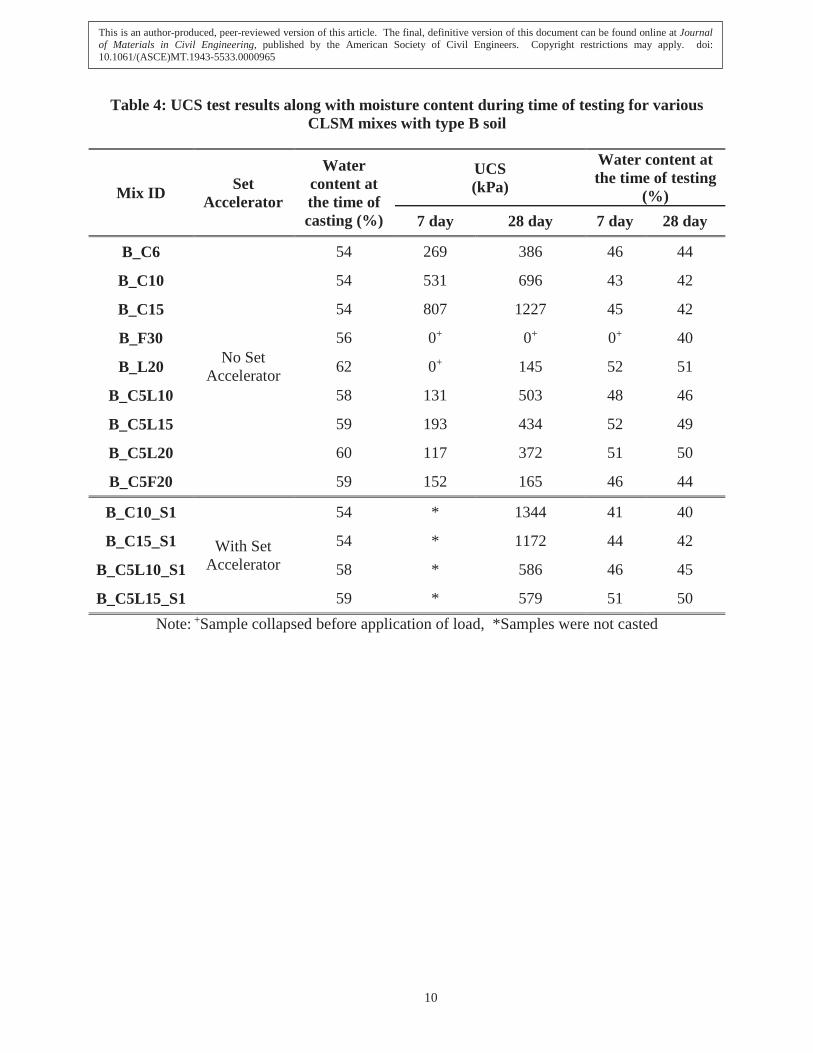
Table 4: UCS test results along with moisture content during time of testing for various CLSM mixes with type B soil
Mix ID Set Accelerator
Water content at the time of casting (%)
UCS(kPa)
Water content at the time of testing
(%)7 day 28 day 7 day 28 day
B_C6
No Set Accelerator
54 269 386 46 44
B_C10 54 531 696 43 42
B_C15 54 807 1227 45 42
B_F30 56 0+ 0+ 0+ 40
B_L20 62 0+ 145 52 51
B_C5L10 58 131 503 48 46
B_C5L15 59 193 434 52 49
B_C5L20 60 117 372 51 50
B_C5F20 59 152 165 46 44
B_C10_S1
With Set Accelerator
54 * 1344 41 40
B_C15_S1 54 * 1172 44 42
B_C5L10_S1 58 * 586 46 45
B_C5L15_S1 59 * 579 51 50Note: +Sample collapsed before application of load, *Samples were not casted
This is an author-produced, peer-reviewed version of this article. The final, definitive version of this document can be found online at Journal of Materials in Civil Engineering, published by the American Society of Civil Engineers. Copyright restrictions may apply. doi: 10.1061/(ASCE)MT.1943-5533.0000965
10
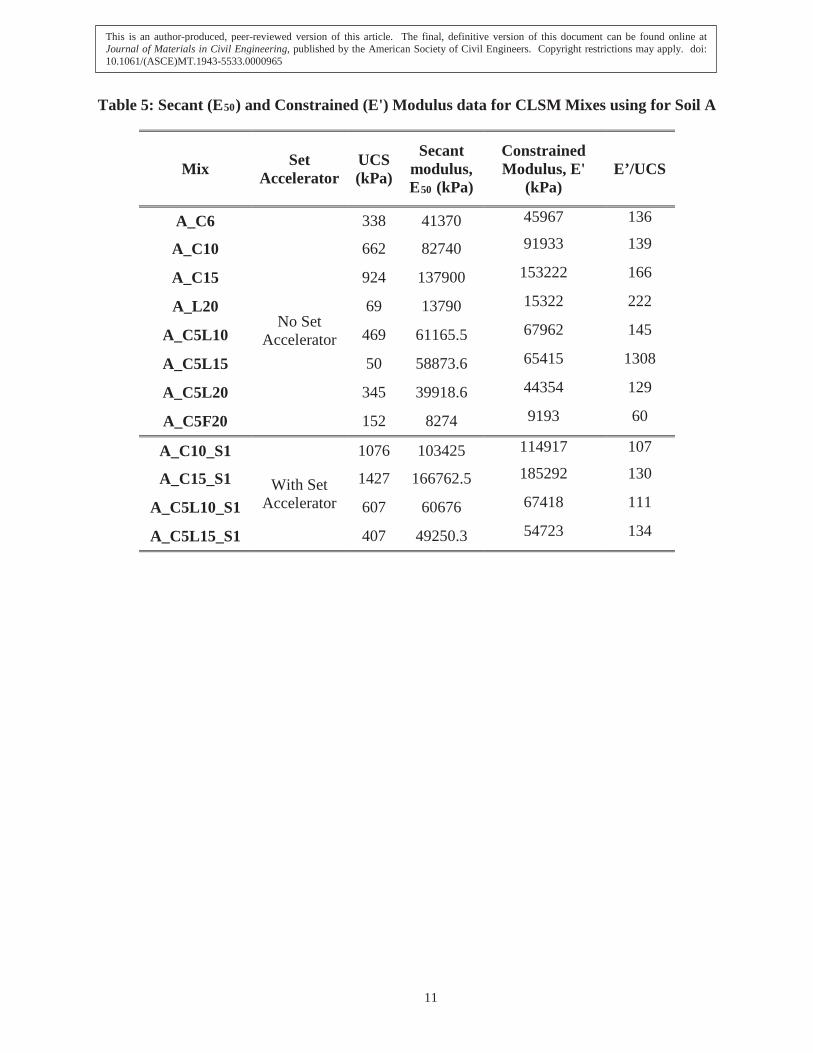
Table 5: Secant (E50) and Constrained (E') Modulus data for CLSM Mixes using for Soil A
Mix Set Accelerator
UCS (kPa)
Secant modulus, E50 (kPa)
Constrained Modulus, E'
(kPa)E’/UCS
A_C6
No Set Accelerator
338 41370 45967 136
A_C10 662 82740 91933 139
A_C15 924 137900 153222 166
A_L20 69 13790 15322 222
A_C5L10 469 61165.5 67962 145
A_C5L15 50 58873.6 65415 1308
A_C5L20 345 39918.6 44354 129
A_C5F20 152 8274 9193 60
A_C10_S1
With Set Accelerator
1076 103425 114917 107
A_C15_S1 1427 166762.5 185292 130
A_C5L10_S1 607 60676 67418 111
A_C5L15_S1 407 49250.3 54723 134
This is an author-produced, peer-reviewed version of this article. The final, definitive version of this document can be found online at Journal of Materials in Civil Engineering, published by the American Society of Civil Engineers. Copyright restrictions may apply. doi: 10.1061/(ASCE)MT.1943-5533.0000965
11
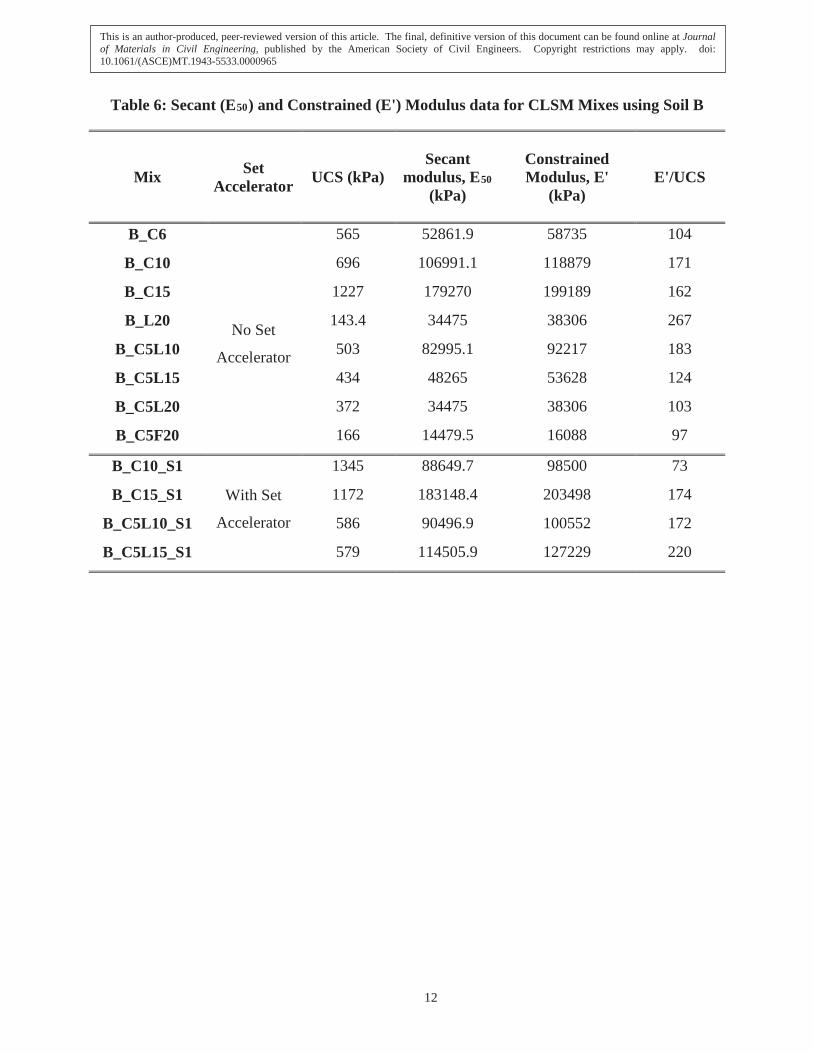
Table 6: Secant (E50) and Constrained (E') Modulus data for CLSM Mixes using Soil B
Mix Set Accelerator UCS (kPa)
Secant modulus, E50
(kPa)
Constrained Modulus, E'
(kPa)E'/UCS
B_C6
No Set
Accelerator
565 52861.9 58735 104
B_C10 696 106991.1 118879 171
B_C15 1227 179270 199189 162
B_L20 143.4 34475 38306 267
B_C5L10 503 82995.1 92217 183
B_C5L15 434 48265 53628 124
B_C5L20 372 34475 38306 103
B_C5F20 166 14479.5 16088 97
B_C10_S1
With Set
Accelerator
1345 88649.7 98500 73
B_C15_S1 1172 183148.4 203498 174
B_C5L10_S1 586 90496.9 100552 172
B_C5L15_S1 579 114505.9 127229 220
This is an author-produced, peer-reviewed version of this article. The final, definitive version of this document can be found online at Journal of Materials in Civil Engineering, published by the American Society of Civil Engineers. Copyright restrictions may apply. doi: 10.1061/(ASCE)MT.1943-5533.0000965
12
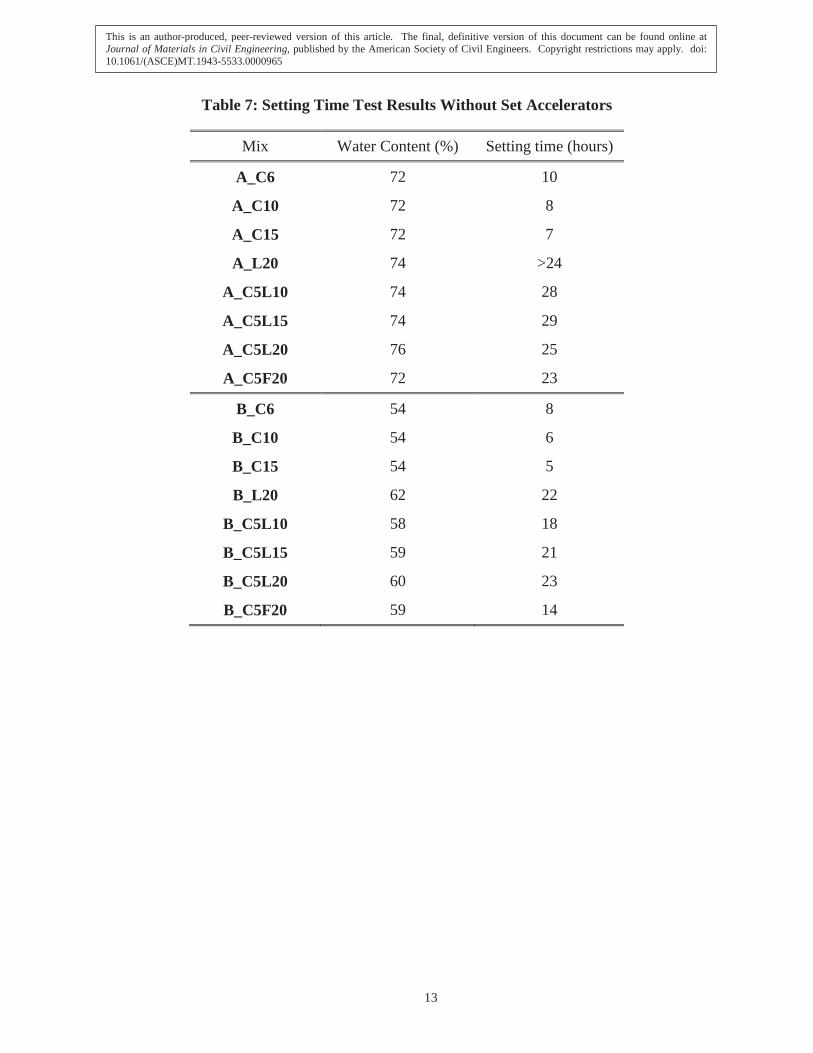
Table 7: Setting Time Test Results Without Set Accelerators
Mix Water Content (%) Setting time (hours)
A_C6 72 10
A_C10 72 8
A_C15 72 7
A_L20 74 >24
A_C5L10 74 28
A_C5L15 74 29
A_C5L20 76 25
A_C5F20 72 23
B_C6 54 8
B_C10 54 6
B_C15 54 5
B_L20 62 22
B_C5L10 58 18
B_C5L15 59 21
B_C5L20 60 23
B_C5F20 59 14
This is an author-produced, peer-reviewed version of this article. The final, definitive version of this document can be found online at Journal of Materials in Civil Engineering, published by the American Society of Civil Engineers. Copyright restrictions may apply. doi: 10.1061/(ASCE)MT.1943-5533.0000965
13
Table 8: Setting Time Test Results for Mixes with Set Accelerator S1
Mix Water Content (%) Setting time (hours)
A_C10_S1 72 5
A_C15_S1 72 4
A_C5L10_S1 74 19
A_C5L15_S1 74 21
B_C10_S1 54 4
B_C15_S1 54 4
B_C5L10_S1 58 16
B_C5L15_S1 59 18
Table 9: Excavatability of CLSM mixes
Material 28 day compressive strength (kPa)
Fresh Density (kN/m3) RE Excavatable
A_C10 662 14.9 0.9 YesA_C15 924 15.4 1.2 No
A_C5L10 469 15.2 0.8 YesA_C10_S1 1076 14.9 1.2 NoA_C15_S1 1427 15.4 1.5 No
A_C5L10_S1 607 15.2 0.9 YesB_C10 696 16.3 1.1 NoB_C15 1227 16.3 1.5 No
B_C5L10 503 16.3 0.9 YesB_C5L15 434 16.0 0.9 YesB_C10_S1 1345 16.3 1.5 NoB_C15_S1 1172 16.2 1.4 No
B_C5L10_S1 586 16.3 1.0 YesB_C5L15_S1 579 16.2 1.0 Yes
This is an author-produced, peer-reviewed version of this article. The final, definitive version of this document can be found online at Journal of Materials in Civil Engineering, published by the American Society of Civil Engineers. Copyright restrictions may apply. doi: 10.1061/(ASCE)MT.1943-5533.0000965
14
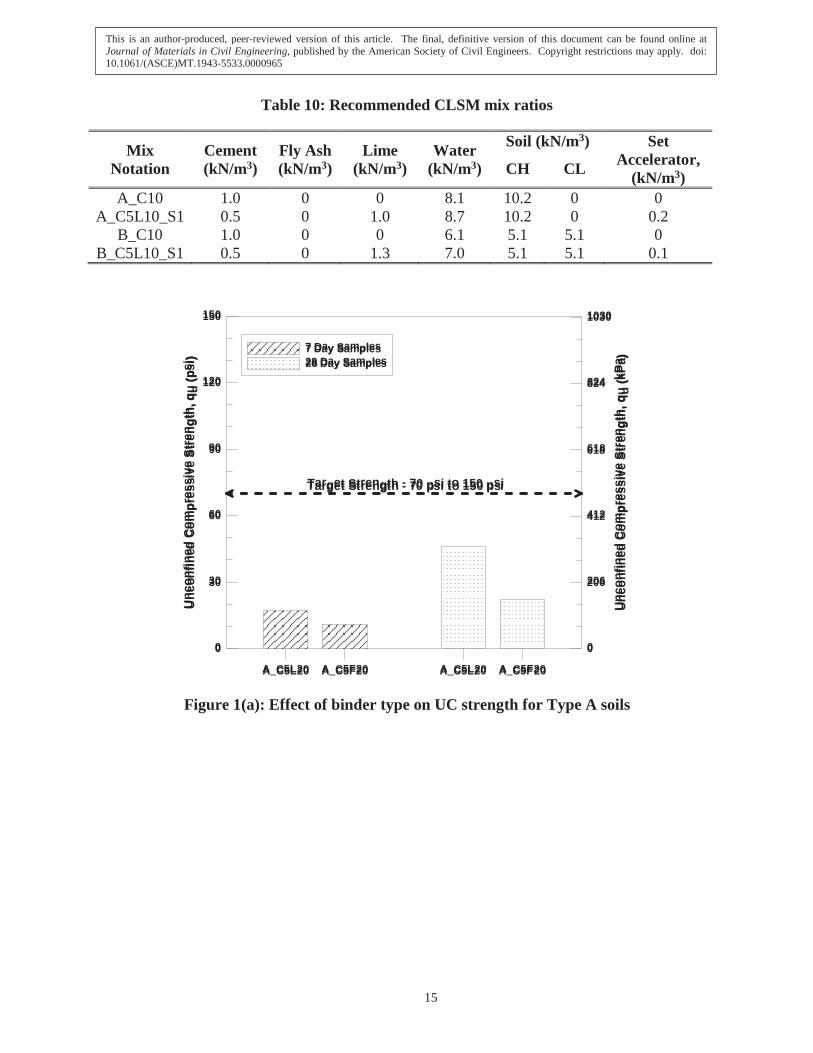
Table 10: Recommended CLSM mix ratios
Mix Notation
Cement (kN/m3)
Fly Ash (kN/m3)
Lime (kN/m3)
Water (kN/m3)
Soil (kN/m3) Set Accelerator,
(kN/m3)CH CL
A_C10 1.0 0 0 8.1 10.2 0 0A_C5L10_S1 0.5 0 1.0 8.7 10.2 0 0.2
B_C10 1.0 0 0 6.1 5.1 5.1 0B_C5L10_S1 0.5 0 1.3 7.0 5.1 5.1 0.1
AA__CC55LL2200 AA__CC55FF2200 AA__CC55LL2200 AA__CC55FF2200
00
3300
6600
9900
112200
115500
U Un nc c
o on nf fi in n
e ed dC C
o om mp pr r
e es ss si i
v ve eS St t
r re en ng g
t th h, ,q q
u u((p p
s si i))
77 DDaayy SSaammpplleess2288 DDaayy SSaammpplleess
00
220066
441122
661188
882244
11003300
U Un nc c
o on nf fi in n
e ed dC C
o om mp pr r
e es ss si i
v ve eS St t
r re en ng g
t th h, ,q q
u u((k k
P Pa a))
TTaarrggeett SSttrreennggtthh -- 7700 ppssii ttoo 115500 ppssii
Figure 1(a): Effect of binder type on UC strength for Type A soils
This is an author-produced, peer-reviewed version of this article. The final, definitive version of this document can be found online at Journal of Materials in Civil Engineering, published by the American Society of Civil Engineers. Copyright restrictions may apply. doi: 10.1061/(ASCE)MT.1943-5533.0000965
15
BB__CC55LL2200 BB__CC55FF2200 BB__CC55LL2200 BB__CC55FF2200
00
3300
6600
9900
112200
115500
U Un nc c
o on nf fi in n
e ed dC C
o om mp pr r
e es ss si i
v ve eS St t
r re en ng g
t th h, ,q q
u u((p p
s si i))
77 DDaayy SSaammpplleess2288 DDaayy SSaammpplleess
00
220066
441122
661188
882244
11003300
U Un nc c
o on nf fi in n
e ed dC C
o om mp pr r
e es ss si i
v ve eS St t
r re en ng g
t th h, ,q q
u u((k k
P Pa a))
TTaarrggeett SSttrreennggtthh -- 7700 ppssii ttoo 115500 ppssii
Figure 1(b): Effect of binder type on UC strength for Type B soils
AA__CC66 AA__CC1100 AA__CC1155 AA__CC66 AA__CC1100 AA__CC1155
00
2200
4400
6600
8800
110000
112200
114400
116600
118800
220000
U Un nc c
o on nf fi in n
e ed dC C
o om mp pr r
e es ss si i
v ve eS St t
r re en ng g
t th h, ,q q
u u((p p
s si i))
77 DDaayy SSaammpplleess2288 DDaayy SSaammpplleess
00
220066
441122
661188
882244
11003300
U Un nc c
o on nf fi in n
e ed dC C
o om mp pr r
e es ss si i
v ve eS St t
r re en ng g
t th h, ,q q
u u((k k
P Pa a))
Figure 2(a): Effect of binder dosage on UC strength for Type A soils
Target Strength(70 psi to 150 psi)
This is an author-produced, peer-reviewed version of this article. The final, definitive version of this document can be found online at Journal of Materials in Civil Engineering, published by the American Society of Civil Engineers. Copyright restrictions may apply. doi: 10.1061/(ASCE)MT.1943-5533.0000965
16
BB__CC66 BB__CC1100 BB__CC1155 BB__CC66 BB__CC1100 BB__CC1155
00
2200
4400
6600
8800
110000
112200
114400
116600
118800
220000
U Un nc c
o on nf fi in n
e ed dC C
o om mp pr r
e es ss si i
v ve eS St t
r re en ng g
t th h, ,q q
u u((p p
s si i))
77 DDaayy SSaammpplleess2288 DDaayy SSaammpplleess
00
113388
227766
441144
555522
669900
882288
996666
11110044
11224422
11338800
U Un nc c
o on nf fi in n
e ed dC C
o om mp pr r
e es ss si i
v ve eS St t
r re en ng g
t th h, ,q q
u u((k k
P Pa a))
Figure 2(b): Effect of binder dosage on UC strength for Type B soils
00 5500 110000 115500 220000 225500UUnnccoonnffiinneedd CCoommpprreessssiivvee SSttrreennggtthh ((ppssii))
00
55000000
1100000000
1155000000
2200000000
2255000000
3300000000
C Co on n
s st tr ra a
i in ne ed d
M Mo od d
u ul lu us s
, ,E E' ' ((
p ps si i ))
AA__CC1100
AA__CC1155
AA__LL2200
AA__CC55LL1155
AA__CC55LL2200
AA__CC55FF2200
AA__CC1100__SS11
AA__CC1155__SS11
AA__CC55LL1100__SS11
00
3344550000
6699000000
110033550000
113388000000
117722550000
220077000000
C Co on n
s st tr ra a
i in ne ed d
M Mo od d
u ul lu us s
, ,E E' ' ((
k kP Pa a ))
00 227755 555500 882255 11110000 11337755 11665500
UUnnccoonnffiinneedd CCoommpprreessssiivvee SSttrreennggtthh ((kkPPaa))
TTaarrggeett UUCC ssttrreennggtthh((7700 ttoo 115500 ppssii))
MMiinniimmuumm SSttiiffffnneessssTTaarrggeetteedd((33000000 ppssii))
AA__CC55LL1100
AA__CC55LL1155__SS11AA__CC66
Figure 3(a): Variation of CLSM stiffness with UC strength for all mixes with Type A soil
Target Strength(70 psi to 150 psi)
This is an author-produced, peer-reviewed version of this article. The final, definitive version of this document can be found online at Journal of Materials in Civil Engineering, published by the American Society of Civil Engineers. Copyright restrictions may apply. doi: 10.1061/(ASCE)MT.1943-5533.0000965
17
00 5500 110000 115500 220000 225500UUnnccoonnffiinneedd CCoommpprreessssiivvee SSttrreennggtthh ((ppssii))
00
55000000
1100000000
1155000000
2200000000
2255000000
3300000000
C Co on n
s st tr ra a
i in ne ed d
M Mo od d
u ul lu us s
, ,E E' ' ((
p ps si i ))
BB__CC66
BB__CC1100
BB__LL2200 BB__CC55LL2200
BB__CC55FF2200
BB__CC1100__SS11BB__CC55LL1100__SS11
BB__CC55LL1155__SS11
00
3344550000
6699000000
110033550000
113388000000
117722550000
220077000000
C Co on n
s st tr ra a
i in ne ed d
M Mo od d
u ul lu us s
, ,E E' ' ((
k kP Pa a ))
00 227755 555500 882255 11110000 11337755 11665500
UUnnccoonnffiinneedd CCoommpprreessssiivvee SSttrreennggtthh ((kkPPaa))
TTaarrggeett UUCC ssttrreennggtthh((7700 ttoo 115500 ppssii))
MMiinniimmuumm SSttiiffffnneessssTTaarrggeetteedd((33000000 ppssii))
BB__CC55LL1100
BB__CC55LL1155
BB__CC1155BB__CC1155__SS11
Figure 3(b): Variation of CLSM stiffness with UC strength for all mixes with Type B soil
00 44 88 1122 1166 2200CCeemmeenntt CCoonntteenntt iinn CCLLSSMM ((%%))
00
5500
110000
115500
220000
225500
E E' '/ /U U
C CS S
TTyyppee AA SSooiillEE''
UUCCSS== 66..1155**%%CCeemmeenntt ++ 8822..11 ((RR22 == 00..5588))
TTyyppee BB SSooiillEE''
UUCCSS== 33..3399**%%CCeemmeenntt ++ 111111..88 ((RR22 == 00..8877))
Figure 4: Effect of cement content on E’/UCS ratio for both Type A and Type B soils
This is an author-produced, peer-reviewed version of this article. The final, definitive version of this document can be found online at Journal of Materials in Civil Engineering, published by the American Society of Civil Engineers. Copyright restrictions may apply. doi: 10.1061/(ASCE)MT.1943-5533.0000965
18
88 1122 1166 2200 2244LLiimmee CCoonntteenntt iinn CCLLSSMM ((%%))
00
5500
110000
115500
220000
225500
E E' '/ /U U
C CS S
TTyyppee AA SSooiillEE''
UUCCSS== --11..6633**%%LLiimmee ++ 117799 ((RR22 == 00..6655))
TTyyppee BB SSooiillEE''
UUCCSS== --88..0033**%%CCeemmeenntt ++ 225577..22 ((RR22 == 00..9933))
Figure 5: Effect of lime content on E’/UCS ratio for both Type A and Type B soils
AA__CC1100 AA__CC1155 AA__CC55LL1100 AA__CC55LL1155
00
2200
4400
6600
8800
110000
112200
114400
116600
118800
220000
222200
224400
226600
U Un nc c
o on nf fi in n
e ed dC C
o om mp pr r
e es ss si i
v ve eS St t
r re en ng g
t th h, ,q q
u u((p p
s si i))
WWiitthhoouutt AAcccceelleerraattoorr ((SS00))WWiitthh AAcccceelleerraattoorr ((SS11))
00
113388
227766
441144
555522
669900
882288
996666
11110044
11224422
11338800
11551188
11665566
11779944
U Un nc c
o on nf fi in n
e ed dC C
o om mp pr r
e es ss si i
v ve eS St t
r re en ng g
t th h, ,q q
u u((k k
P Pa a))
Figure 6(a): Effect of set accelerator on UC strength of Type A soils
Target Strength(70 psi to 150 psi)
This is an author-produced, peer-reviewed version of this article. The final, definitive version of this document can be found online at Journal of Materials in Civil Engineering, published by the American Society of Civil Engineers. Copyright restrictions may apply. doi: 10.1061/(ASCE)MT.1943-5533.0000965
19
BB__CC1100 BB__CC1155 BB__CC55LL1100 BB__CC55LL1155
00
2200
4400
6600
8800
110000
112200
114400
116600
118800
220000
222200
224400
U Un nc c
o on nf fi in n
e ed dC C
o om mp pr r
e es ss si i
v ve eS St t
r re en ng g
t th h, ,q q
u u((p p
s si i))
WWiitthhoouutt AAcccceelleerraattoorr ((SS00))WWiitthh AAcccceelleerraattoorr ((SS11))
00
113388
227766
441144
555522
669900
882288
996666
11110044
11224422
11338800
11551188
11665566
U Un nc c
o on nf fi in n
e ed dC C
o om mp pr r
e es ss si i
v ve eS St t
r re en ng g
t th h, ,q q
u u((k k
P Pa a))
Figure 6(b): Effect of set accelerator on UC strength of Type B soils
Target Strength(70 psi to 150 psi)
This is an author-produced, peer-reviewed version of this article. The final, definitive version of this document can be found online at Journal of Materials in Civil Engineering, published by the American Society of Civil Engineers. Copyright restrictions may apply. doi: 10.1061/(ASCE)MT.1943-5533.0000965
20
Recommended