PM World Journal Strategy for Consistently Delivering Successful Vol. III, Issue II – February 2014 IT Projects in Indonesia
www.pmworldjournal.net Student Paper1 by Delano Irawadi
© 2014 Delano Irawadi www.pmworldlibrary.net Page 1 of 16
Strategy for Consistently Delivering Successful IT Projects in Indonesia1
By Delano Irawadi
Abstract
Project management involves the short-term goals of creating a service, program or product
that meets customer satisfaction. Successful project will create a service, program or product
that is considered asset that supports business line. The purposes of this paper is to clearly
explain SWOT analysis that is applied into project life cycle in order to create strategy needed
to overcome factors that influence project failures in Indonesia. This is done by using strategy
formulation framework in project life cycle phase. In the end, the result would provide the
analysis and what potential strategy could be taken into account for the identified issue.
Keywords: project life cycle, IT projects, SWOT analysis, strategy formulation framework,
project management, project failure factors.
1. Introduction
Based on Association for the Advancement of Cost Engineering (AACE) International Total
Cost Management (TCM) framework there are five stages in life cycle of strategic asset that is
ideation, creation, operation, modification and termination. Project is on creation stage in
asset life cycle. Product in information technology (IT) projects are considered good asset if:
The product delivered on schedule and meets user needs on that particular time period.
Because if the product is so late that by the time it is rolled out, the users either no
longer need it nor another product is found to fulfill the user needs.
The product meets user needs. In other words, users feel that the product will allow
them to do their work efficiently by using it. The product works as required because if
there are major bugs in the system, users do not trust the product functionality and
hence they will not use it.
The product that project produced is not considered overpriced so project should be on
budget.
A product delivered on time, within budget and with all features and functions as specified is
an asset created from a successful project, so it is important to have successful project.
1 Editor’s note: Student papers are authored by graduate or undergraduate students based on
coursework at accredited universities or training programs. This paper was prepared as a result of a
course delivered by Dr Paul Giammalvo of PT Mitratata Citragraha in Jakarta, Indonesia. The paper
was submitted to the Association for the Advancement of Cost Engineering International (AACEi) in
partial fulfillment of the Certified Cost Professional (CCP) requirements.
http://www.aacei.org/cert/whatCertOffers.shtml

PM World Journal Strategy for Consistently Delivering Successful Vol. III, Issue II – February 2014 IT Projects in Indonesia
www.pmworldjournal.net Student Paper1 by Delano Irawadi
© 2014 Delano Irawadi www.pmworldlibrary.net Page 2 of 16
Based on Standish CHAOS Manifesto 2011 project is classified by following criteria:
Successful if products are delivered on time and within budget, with all features and
functions worked as stated on project requirement.
Challenged if products are delivered but over budget, delivered late or lacking some
originally specified features and functions.
Failed if the project team fails to deliver a solution at all. For example project
cancelled before the product is complete or can be delivered.
Figure 1 – IT Projects Success Rate (Standish Group, 2011)
The study shows that IT projects using traditional waterfall development methodologies are
14% successful, 29% failure and the remaining 57% challenged, while IT projects using agile
development methodologies are 42% successful, 9% failed and the remaining 49%
challenged. Chart for the IT projects success rate is presented in Figure 1.
In 2010 Collaboration, Management and Control Solutions (CMCS) did survey in Middle
East about factors that contributed to project failure as shown in Figure 2.
PM World Journal Strategy for Consistently Delivering Successful Vol. III, Issue II – February 2014 IT Projects in Indonesia
www.pmworldjournal.net Student Paper1 by Delano Irawadi
© 2014 Delano Irawadi www.pmworldlibrary.net Page 3 of 16
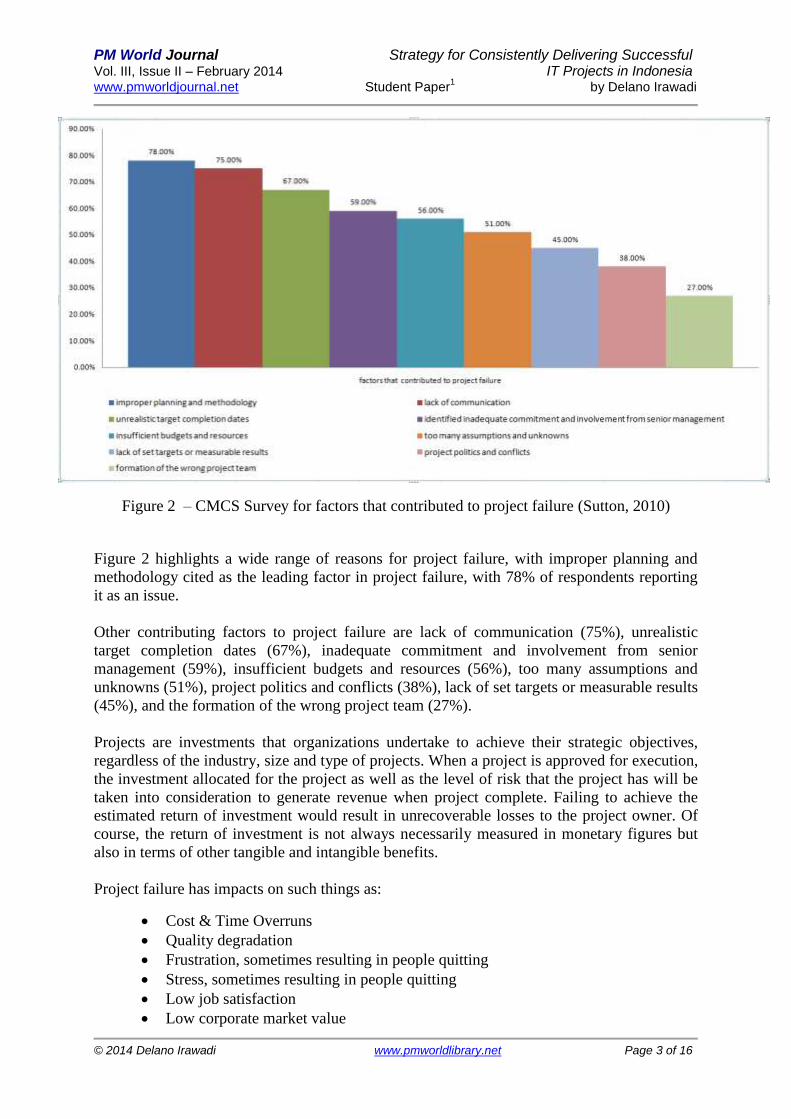
Figure 2 – CMCS Survey for factors that contributed to project failure (Sutton, 2010)
Figure 2 highlights a wide range of reasons for project failure, with improper planning and
methodology cited as the leading factor in project failure, with 78% of respondents reporting
it as an issue.
Other contributing factors to project failure are lack of communication (75%), unrealistic
target completion dates (67%), inadequate commitment and involvement from senior
management (59%), insufficient budgets and resources (56%), too many assumptions and
unknowns (51%), project politics and conflicts (38%), lack of set targets or measurable results
(45%), and the formation of the wrong project team (27%).
Projects are investments that organizations undertake to achieve their strategic objectives,
regardless of the industry, size and type of projects. When a project is approved for execution,
the investment allocated for the project as well as the level of risk that the project has will be
taken into consideration to generate revenue when project complete. Failing to achieve the
estimated return of investment would result in unrecoverable losses to the project owner. Of
course, the return of investment is not always necessarily measured in monetary figures but
also in terms of other tangible and intangible benefits.
Project failure has impacts on such things as:
Cost & Time Overruns
Quality degradation
Frustration, sometimes resulting in people quitting
Stress, sometimes resulting in people quitting
Low job satisfaction
Low corporate market value

PM World Journal Strategy for Consistently Delivering Successful Vol. III, Issue II – February 2014 IT Projects in Indonesia
www.pmworldjournal.net Student Paper1 by Delano Irawadi
© 2014 Delano Irawadi www.pmworldlibrary.net Page 4 of 16
Low public opinion
Negative media campaigns
The cumulative effects can be very costly to your company
Possible company closure
Based on the author’s experience in IT projects from 2007 to 2013, there are some major
factors that influence IT projects failure in Indonesia even for a company that implements
poor practices of project management. This paper will discuss strategies to overcome factors
which affect IT projects Indonesia. This paper will provide answer for the research question
below:
What strategies need to be taken for consistently delivering successful IT
projects in Indonesia.
2. Project Life Cycle
life cycles of project based on AACE TCM framework are ideation, planning, execution and
closure. In this research author will analyze and find strategy for each factors on each project
life cycle phase, shown in Figure 3.
Figure 3 – Project Life Cycle (AACE International, 2012)
3. Strategy Formulation Framework
Since strategy will determine design and direction deployment of resources to achieve project
goal. It is necessary to use methodology to choose an appropriate strategy objectively.
Strategy formulation network is implemented in two main stages.
1. The Input Stage: concise basic information as input for strategy selection.
2. The Matching Stage: generating feasible alternative strategy selection where internal
and external factors are being matched.

PM World Journal Strategy for Consistently Delivering Successful Vol. III, Issue II – February 2014 IT Projects in Indonesia
www.pmworldjournal.net Student Paper1 by Delano Irawadi
© 2014 Delano Irawadi www.pmworldlibrary.net Page 5 of 16
3.1 The Input Stage
Figure 4 – The Input Stage (David, 2009)
The input stage SWOT analysis shown in Figure 4 is used to provide concise information.
Opportunities and threats are used on External Factor Evaluation (EFE) Matrix, while
strengths and weaknesses are used on Internal Factor Evaluation (IFE). SWOT analysis
concept is used to build on strengths, resolve weaknesses, exploit opportunities and avoid
threats.
Figure 5 – SWOT analysis factors (source: author)

PM World Journal Strategy for Consistently Delivering Successful Vol. III, Issue II – February 2014 IT Projects in Indonesia
www.pmworldjournal.net Student Paper1 by Delano Irawadi
© 2014 Delano Irawadi www.pmworldlibrary.net Page 6 of 16
Figure 5 shows SWOT internal factors that consist of strengths and weaknesses. Strengths are
characteristics of project that give a beneficial advantage. Weaknesses are characteristics that
place project at a disadvantage. Internal factors are considered when those factors are covered
in activities on project life cycle phases.
Figure 5 also shows external factors that consist of opportunities and threats. Opportunities
are external aspects in the environment that support project performance. Threats are external
aspects in the environment that could damage the project. External factors are considered
when those factors are not covered in activities on project life cycle phases but they influence
project life cycle phases.
3.1.1 Internal Factor Evaluation (IFE) Matrix
As part of the input stage Internal Factor Evaluation (IFE) Matrix, IFE Matrix identifies and
evaluates key inner strengths and weaknesses from all phases of project life cycle as shown in
Table 1.
Table 1 – Internal Factor Evaluation (IFE) Matrix (source: author)
The Organizations tends to do well on three activities below:
Organization providing general format of Work Breakdown Schedule (WBS)
Organization developing scope management plan
PM World Journal Strategy for Consistently Delivering Successful Vol. III, Issue II – February 2014 IT Projects in Indonesia
www.pmworldjournal.net Student Paper1 by Delano Irawadi
© 2014 Delano Irawadi www.pmworldlibrary.net Page 7 of 16
Organization developing requirements analysis
These three activities in planning phase become major strengths in the IFE organizations.
Especially in developing a detailed and complete Work Breakdown Structure (WBS) where
the project scope of work is decomposed to a level that can identify extra, missing and/ or
vague work elements.
The Organizations tends to do badly on three activities below:
Define goals and objectives of project. Goals and objectives become unclear because
project sponsors lack the experience to describe what they really require and inability
to provide direct and honest feedback on the progress.
Involve user in project. Without user involvement nobody in the organization feels
committed to the project.
Do proper planning. IT managers are not given the opportunity to plan because time
pressure from senior management take over and most of the time the project is on its
way before it has been clearly defined. People see planning as a waste of time because
they believe that time is better spent doing something rather than planning.
These three activities result in those five major weaknesses in the IFE Matrix below:
Unclear goals and objectives (ideation phase)
Lack of executive support and user involvement (ideation phase)
Failure to plan (ideation phase)
Lack of proactive risk management (planning phase)
Objectives changing during the project (execution phase)
The highest score is 4.00 that show superior strengths and lowest weaknesses, 1.00 is the
lowest score for strengths and superior weaknesses. Mean is calculated from [(4.00 + 1.00) ÷
2] resulting 2.5. If total weighted score is above 2.5 it means internal strength is strong but if
below 2.5 internal strength is weak.
IFE Matrix total weighted score is 2.386 it indicates that internal organization is slightly not
strong enough to run the project to succeed.

PM World Journal Strategy for Consistently Delivering Successful Vol. III, Issue II – February 2014 IT Projects in Indonesia
www.pmworldjournal.net Student Paper1 by Delano Irawadi
© 2014 Delano Irawadi www.pmworldlibrary.net Page 8 of 16
3.1.2 External Factor Evaluation (EFE) Matrix
Next on input stage is the External Factor Evaluation that includes weighing a list of key
factors that are external outside project life cycle phase, shown in Table 2.
Table 2 – External Factor Evaluation (EFE) Matrix (source: author)
The Environment tends to support the project from these circumstances below:
Organizations do good practice in choosing several smaller project packages where
possible since the more clearly defined the project, the easier it becomes to realize
Organization has good habit by doing open communication and clear decision-making
channels to set up institutionalized and clearly defined lines of reporting to (internal)
customers, senior management and the project sponsor
Organizations do good practice in breaking down big tasks into several independent
project modules
These three circumstances result in those two major opportunities in the EFE Matrix below:
Breaking development and implementation into manageable steps (planning phase)
Executives and business units fast enough to respond to critical issues, risks, or project
activities (execution phase)
PM World Journal Strategy for Consistently Delivering Successful Vol. III, Issue II – February 2014 IT Projects in Indonesia
www.pmworldjournal.net Student Paper1 by Delano Irawadi
© 2014 Delano Irawadi www.pmworldlibrary.net Page 9 of 16
The Environment tends to against the project from these circumstances below:
IT projects are typically already overdue by the time they are initiated. This means that
companies have very little time to clearly define their new IT requirements
Lack of user involvement in defining requirements. Users have to know what it is they
want, and be able to specify it precisely
Involving too many stakeholders. From experience that involving many stakeholders
means they all try to influence the project's goals. Everyone involved has his or her
own agenda and his or her own objectives
Organizations also identified with not having a method to handle or recognize
changes.
These four circumstances result in those three major threats in the EFE Matrix below:
Poorly defined requirements, what the customer wants was not clearly documented
(ideation phase)
Project politics and conflicts among organizations involved (ideation phase)
Changes that were not initially planned are added to the project (execution phase)
Three major threats inform that These three major threats related
The highest score is 4.00 which that show superior opportunities and lowest threat, 1.00 is the
lowest score for opportunities and superior threats. Mean is calculated from [(4.00 + 1.00) ÷
2] resulting 2.5. If total weighted score is above 2.5 it means external opportunities are
favorable to project but if below 2.5 external opportunities are not favorable to project.
EFE Matrix total weighted score is 2.3125 it’s indicates that external opportunities are slightly
not favorable to support the project to succeed.
3.2 The Matching Stage
Figure 6 – The Matching Stage (David, 2009)

PM World Journal Strategy for Consistently Delivering Successful Vol. III, Issue II – February 2014 IT Projects in Indonesia
www.pmworldjournal.net Student Paper1 by Delano Irawadi
© 2014 Delano Irawadi www.pmworldlibrary.net Page 10 of 16
Matching Stage is process to generate feasible alternative strategy selection where internal
and external factors are being matched. The Matching Stage uses two methods TOWS Matrix
and IE Matrix, shown in Figure 6.
3.2.1 TOWS Matrix
TOWS is inversion of SWOT. TOWS Matrix method generates four types of strategies as
follows:
SO: strengths-opportunities strategies, build on strength by exploiting opportunities.
WO: weaknesses-opportunities strategies, resolve weaknesses by exploiting
opportunities.
WT: weaknesses-threats strategies, resolve weaknesses by avoiding threats.
ST: strengths-threats strategies, build on strengths by avoiding threats.

PM World Journal Strategy for Consistently Delivering Successful Vol. III, Issue II – February 2014 IT Projects in Indonesia
www.pmworldjournal.net Student Paper1 by Delano Irawadi
© 2014 Delano Irawadi www.pmworldlibrary.net Page 11 of 16
Table 3 – TOWS Matrix (source: author)
Table 3 shows that TOWS matrix generates 17 feasible alternative strategy selections,
summarized below:
Strengths-Opportunities (SO) Strategies
1. Have Return on Investment (ROI) case from the start and never ask the management
for money, unless it’s going to save or make them money. Management believes that
PM World Journal Strategy for Consistently Delivering Successful Vol. III, Issue II – February 2014 IT Projects in Indonesia
www.pmworldjournal.net Student Paper1 by Delano Irawadi
© 2014 Delano Irawadi www.pmworldlibrary.net Page 12 of 16
this is actually going to produce something tangible, and then management will be
fully committed to the project. This strategy is implemented on planning phase.
2. Develop good systems architecture. Break down big tasks into several independent
project modules. Good system architecture will break the system into components with
clearly defined interfaces via which information is passed to other components. Team
may consult with external consultant hired in the project as design experts to come up
with schema. This strategy is implemented on planning phase.
3. Get executive sponsorship for the project to have pre-commitment of resources to
the project, and ask them to be open if they have any reservations about the project.
This strategy is implemented on planning phase.
4. Provide document that contains resources and skill sets necessary to get the job
done. This strategy is implemented on planning phase.
5. Create a complete and detailed organization chart that integrated with the WBS
developed earlier will provide the project team with what is known as the
accountability matrix. This matrix details the parties involved in each element of the
project scope as well as the role they have in performing, approving, reviewing,
supporting and others in delivering this scope. This strategy is implemented on
planning phase.
Weaknesses-Opportunities (WO) Strategies
1. Do estimation of development costs on design phase from those project cost
estimator, that makes project manager will able to estimate the complete cost of the
system to a more accurate extent. This strategy is implemented on planning phase.
2. Develop prospects for project critical employees. Company or organization should
be able to motivate team members. It is important for colleagues to know that project
management will not turn out to be a dead end for their own career. This strategy is
implemented on planning phase.
3. Develop project plan and monitor project by referring to project plan, existing plan
get updated weekly with actual progress information, resources consumed and money
spent. This strategy is implemented on planning phase.
4. Create detailed project closeout report. This report will provide an assessment of the
project successes and failures, document lessons learned, confirming to which extent
project objectives were achieved and ensuring that the different project contractual
obligations had been terminated and transferred to the project owner in a complete
way. This strategy is implemented on closure phase.
Strengths-Threats (ST) Strategies
1. Apply well-known technologies. Unless the use of new technologies is absolutely
necessary, it is better to rely on proven solutions you know will work. This strategy is
implemented on ideation phase.
2. Have the customer agree to and sign off the business case document, requirement
documents, functional specifications, technical specifications and architecture
PM World Journal Strategy for Consistently Delivering Successful Vol. III, Issue II – February 2014 IT Projects in Indonesia
www.pmworldjournal.net Student Paper1 by Delano Irawadi
© 2014 Delano Irawadi www.pmworldlibrary.net Page 13 of 16
document. Those entire documents have to be made crystal-clear. This strategy is
implemented on planning phase.
3. Set up a communications plan, which clearly outlines all the interested parties of the
project and what information and how frequently such information is disseminated, the
methods of distributing the information and responsibilities of each person in the
project team for distributing the information. This strategy is implemented on planning
phase.
Weaknesses-Threats (WT) Strategies
1. Provide standardized projects performance metrics and reporting. Those metrics
provide the project stakeholders with objective status of the project budget, schedule
and quality performance and the impact it would have on the project completion date
and estimated cost at completion. The metrics will help the organization in setting
performance thresholds where alerts will be triggered when a performance metric is
over or under desired limits. This strategy is implemented on planning phase.
2. Set up a Change Management committee. Document the change management
process to be used and followed by the project team. Educate the project team to
recognize a change or deviation from the plan and follow the change management
processes. This strategy is implemented on planning phase.
3. Set up structured Project Board. Support from senior management via properly
structured Project Board, consist an Executive, Senior User, Senior Project Manager to
ensure executive management support and user involvement. This strategy is
implemented on planning phase.
4. Manage the project critical path or paths so the team members can become aware of
opportunities to accelerate and/or threats to project success. The critical path provides
an objective tool for assessing the impact of today’s decisions on future project results.
It also provides an objective tool for setting priorities for taking actions and allocating
scarce resources to projects. This strategy is implemented on execution phase.
5. Start a risk management log from day one. To identify risks throughout the project
continually revise risk mitigation and contingency plans. Implementing a formal risk
management process will ensure that risks are identified, assessed qualitatively and
quantitatively, response actions identified and provisions including contingency plans
and reserves are allocated for the project. This strategy is implemented on planning
phase.
3.2.2 The Internal – External (IE) Matrix
The IE Matrix based on two key dimensions:
The x-axis is IFE total weighted score result that is 2.386 ≈ 2.39
The y-axis is EFE total weighted score result that is 2.3125 ≈ 2.31

PM World Journal Strategy for Consistently Delivering Successful Vol. III, Issue II – February 2014 IT Projects in Indonesia
www.pmworldjournal.net Student Paper1 by Delano Irawadi
© 2014 Delano Irawadi www.pmworldlibrary.net Page 14 of 16
Figure 7 – The Internal External (IE) Matrix (source: author)
From figure 7 IE matrix for present condition in Indonesia suggest that IT projects to adopt
hold and maintain strategy. Hold and maintain strategy for project means that organizations
or company are still able to conducting project but still need to resolve failure factors
especially the major factor to escalate to grow and build strategy. On grow and build strategy
(I, II and IV) internal organizations or company are stronger and opportunities also supporting
project to succeed.
4. Conclusion
In conclusion this paper answer for research question,
• What strategies need to be taken for consistently delivering successful IT projects in
Indonesia?
Overall from 17 strategies in TOWS matrix, 14 strategies need to be implemented on planning
phase, one on ideation phase, one on execution phase and one on closure phase. It shows that
planning phase is very important where influence to project succeed is very high. From
planning phase it can be seen whether or not organizations or company doing good practices
of project management.

PM World Journal Strategy for Consistently Delivering Successful Vol. III, Issue II – February 2014 IT Projects in Indonesia
www.pmworldjournal.net Student Paper1 by Delano Irawadi
© 2014 Delano Irawadi www.pmworldlibrary.net Page 15 of 16
References
1. The Standish Group. (2011). CHAOS Manifesto 2011. Available from
http://standishgroup.com/newsroom/chaos_manifesto_2011.php
2. Sutton, Mark. (2010). Poor planning and methodology main cause of project failure.
Accessed February 2, 2013 from http://www.itp.net/580247-poor-planning-and-
methodology-main-cause-of-project-failure
3. AACE International.(2012).Total Cost Management Framework, 1st ed. West Virginia,
United States of America: AACE International.
4. David, Fred R. (2009).Strategic Management: Concepts and Cases, 12th. Francis Marion
University, United States of America: Prentice Hall.
5. Gulla, Joseph. (2011).Seven Reasons Why Information Technology Projects Fail. Orlando,
United States of America: IBM Corporation.
6. Quillen, Reinhold. (2011).Why Some Software Development Projects Fail and What You
Can Do About It. Victoria, Australia: Quillen Infrastructure Technologies.
7. Samman, Bassam. (2011).How to Suffocate a Contractor. Collaborate Journal of
Collaboration,Management and Control Solutions (CMCS), Issue 32, Pages1-4.
8. Samman, Bassam. (2010).Can Professional Project Management stop project fraud?. .
Collaborate Journal of Collaboration,Management and Control Solutions (CMCS), Issue
19, 1-4.
9. S. Humprey, Watts. (2005).Why Big Software Projects Fail: The 12 Key Questions.
Pittsburgh, United States of America: The Journal of Defense Software Engineering.
10. Office of Government Commerce. (2005).Common Causes of Project Failure. London,
United Kingdom: OGC Best Practice.
11. Department of Veterans Affairs. (2005).Project Management Guide. Washington, United
States of America: Department of Veterans Affairs Office of Information and Technology.

PM World Journal Strategy for Consistently Delivering Successful Vol. III, Issue II – February 2014 IT Projects in Indonesia
www.pmworldjournal.net Student Paper1 by Delano Irawadi
© 2014 Delano Irawadi www.pmworldlibrary.net Page 16 of 16
About the author
Delano Irawadi Jakarta, Indonesia
Delano Irawadi is a professional in fields of Integrated
Asset, Portfolio, Program and Project Management. He is currently Project Control for Network Projects and Implementation at SmartFren Telecom (Indonesia) and a student at Bandung Institute of Technology (ITB, Indonesia) pursuing his master’s degree for Master of Business Administration. Delano Irawadi has a Bachelor’s degree in Engineering and is a Certifed Cost Professional (CCP-AACEI). His past engagement was 6 years in telecomunications industries at Nokia Solutions Networks. He lives in Jakarta, Indonesia and can be reached at [email protected]
Recommended