
1 JRC-COIN © | Step 5: Weighting methods
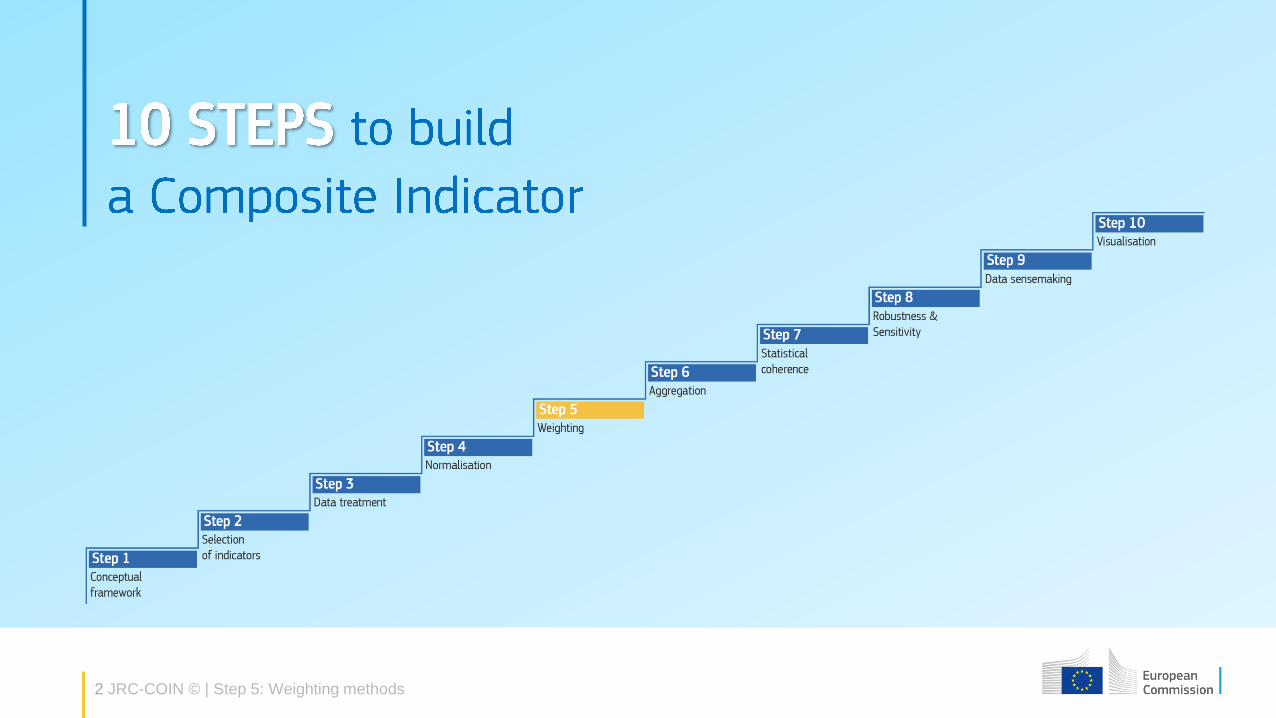
Step 5Weighting methods
Matija Kovacic
18th JRC Annual training on Composite Indicators and Scoreboards
2 JRC-COIN © | Step 5: Weighting methods

3 JRC-COIN © | Step 5: Weighting methods
Weighting in composite indicators
Meaning of weighting:
• Relative importance of indicators/pillars/sub-pillars (“explicit importance”)
• Trade-off between indicators/pillars/sub-pillars (“implicit importance”)*
Selecting a weighting scheme is not a simple task:
• There is no “one-size-fits-all” solution
• Weight may have a significant impact on final scores and ranks (the so-called “index
problem”)
• Stakeholders may have different opinions on choosing weighting scheme
A composite is your own product: theoretical framework + transparency

4 JRC-COIN © | Step 5: Weighting methods
Approaches to setting weights
Equal weights
Weighting based on statistical methods
o Principal component analysis/Factor analysis
o Data envelopment analysis
o Regression approach
Weights based on public/expert opinion
o Budget allocation and Analytic hierarchy process
o Conjoint analysis

5 JRC-COIN © | Step 5: Weighting methods
Approaches to setting weights: examples
Composite Indicator Weighting scheme
Human Development Index Equal weights
Multidimensional Poverty Index Equal weights Expert opinion
Quality of Life Index Equal weights
Better Life Index Equal weights
Social Progress Index Principal component analysis
Corruption Perception Index Equal weights
Technological Achievement Index Expert opinion
The Cultural and Creative Cities Monitor Expert opinion
Rule of Law Index Equal weights Expert opinion
Environmental Performance Index Expert opinion
Gender Equality Index Expert opinion
ICT 2015 Development Index Principal component analysis
6 JRC-COIN © | Step 5: Weighting methods
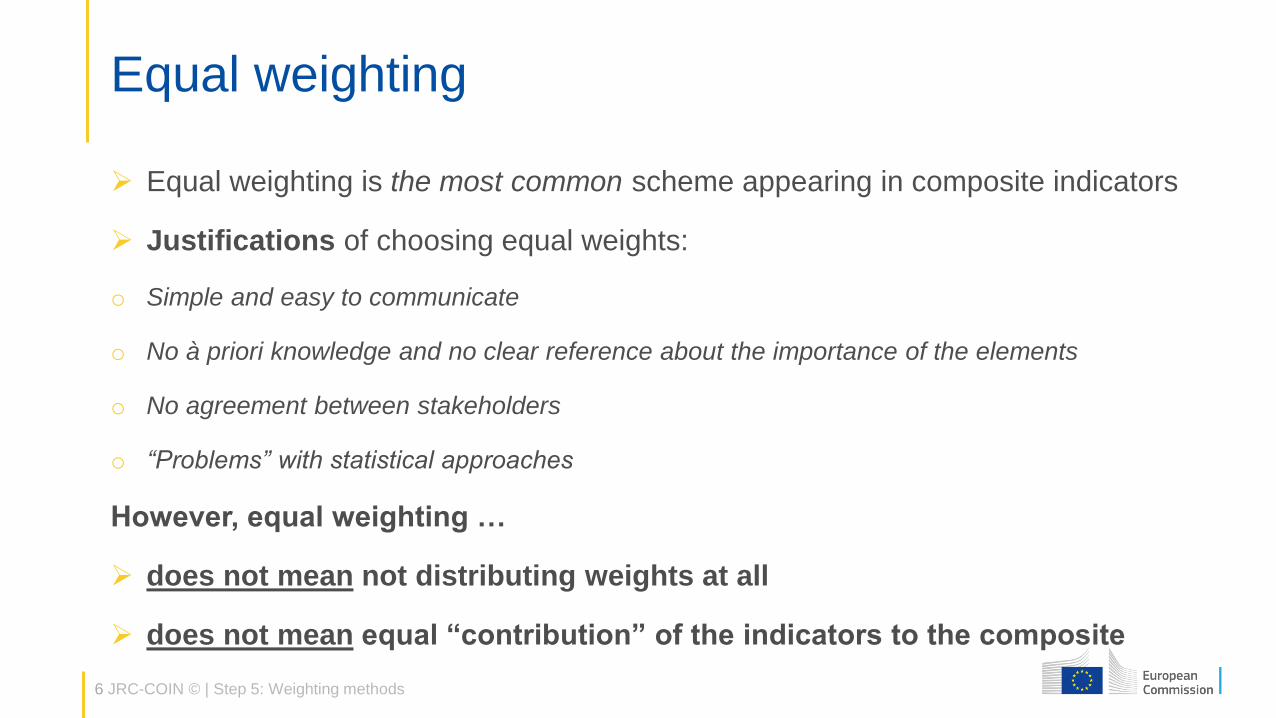
Equal weighting
Equal weighting is the most common scheme appearing in composite indicators
Justifications of choosing equal weights:
o Simple and easy to communicate
o No à priori knowledge and no clear reference about the importance of the elements
o No agreement between stakeholders
o “Problems” with statistical approaches
However, equal weighting …
does not mean not distributing weights at all
does not mean equal “contribution” of the indicators to the composite
7 JRC-COIN © | Step 5: Weighting methods
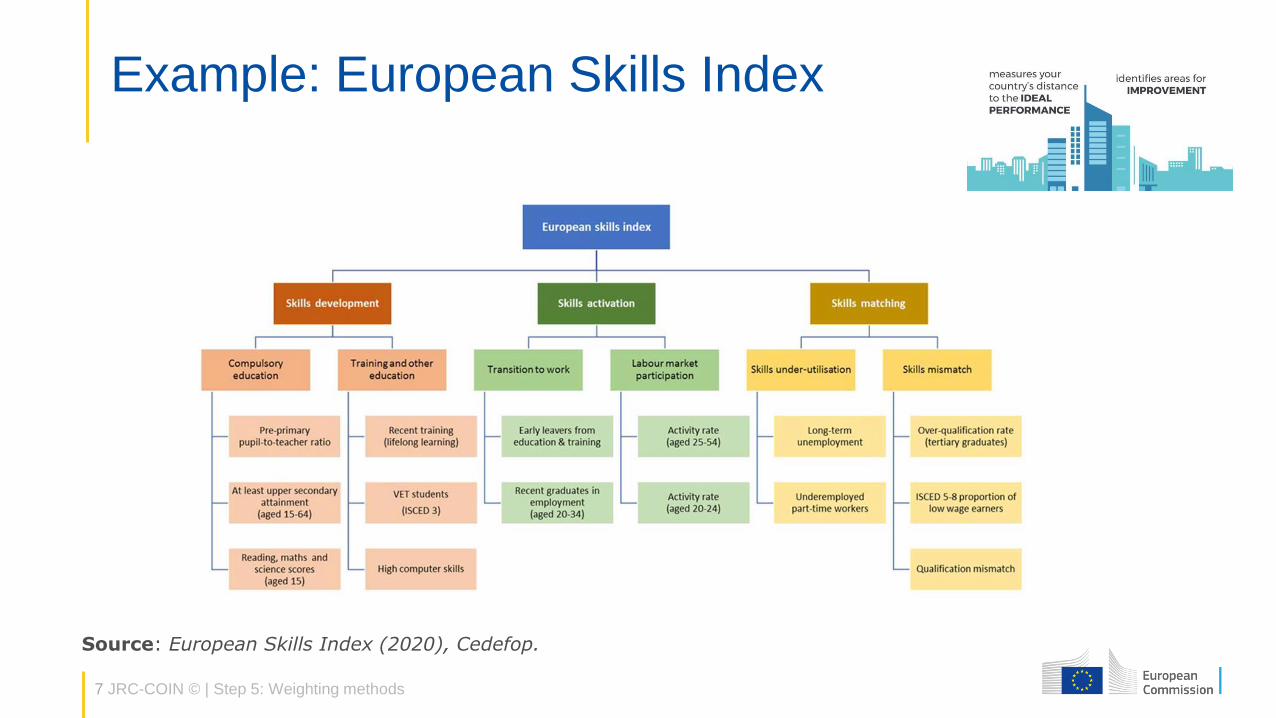
Example: European Skills Index
Source: European Skills Index (2020), Cedefop.
8 JRC-COIN © | Step 5: Weighting methods
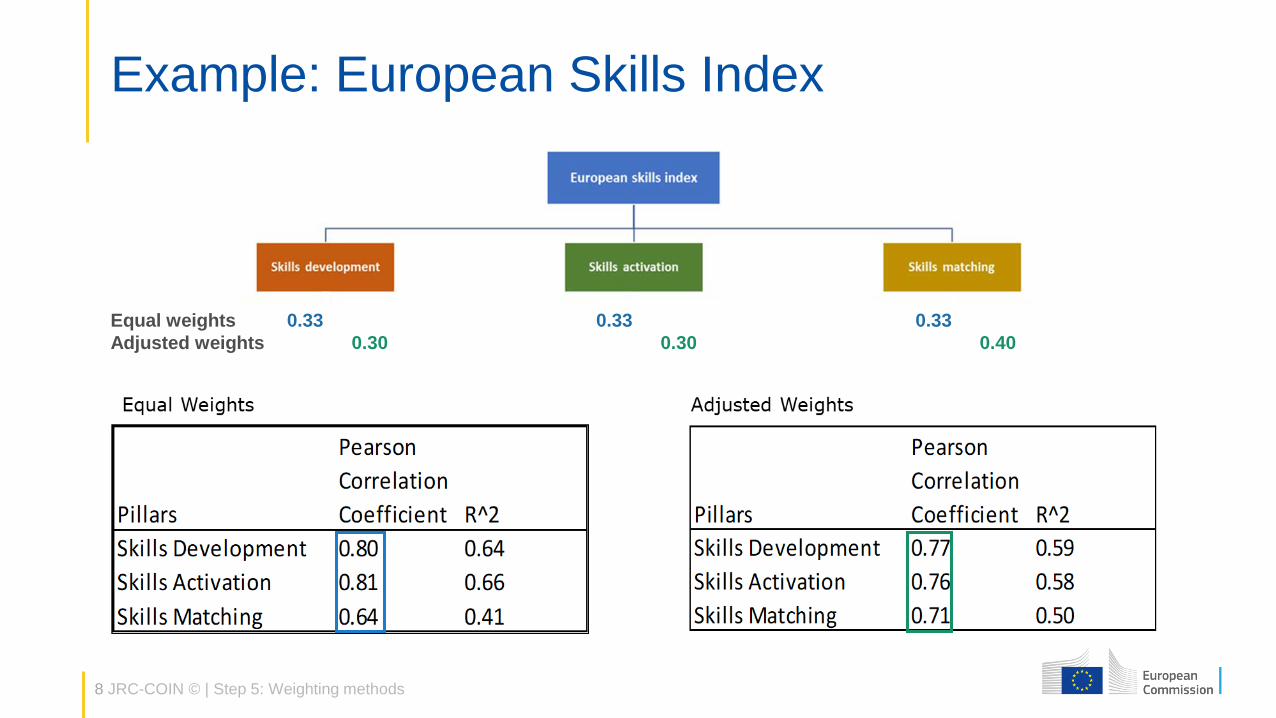
Example: European Skills Index
Equal weights 0.33 0.33 0.33
Adjusted weights 0.30 0.30 0.40

9 JRC-COIN © | Step 5: Weighting methods
Principal component analysis (PCA)
Objective: find a set of weights which, combined with the corresponding indicators,
explains most of the variance
These combinations (averages) are called principal components (PC):
o Each principal component is a new variable computed as a linear combination of the
original (standardized) variables
Choose the component (i.e., combination of coefficients) that explains most of the
observed variance
PC1 = c11X1 + c21X2 + … +cn1Xn
PC2 = c12X1 + c22X2 + … +cn2Xn
…

10 JRC-COIN © | Step 5: Weighting methods
How should we choose?
Several methods exist. The 3 most common are:
Kaiser–Guttman “Eigenvalues greater than one” criterion (Guttman,1954; Kaiser, 1960): select all components with eigenvalues greater than 1 (or 0.9)
Certain percentage of explained variance: for example >60, 70%, 80%,…
Cattell’s scree test (Cattell, 1966) “Above the elbow” approach
Objective: one Principal Component (one-dim solution) – single latent phenomenon
11 JRC-COIN © | Step 5: Weighting methods
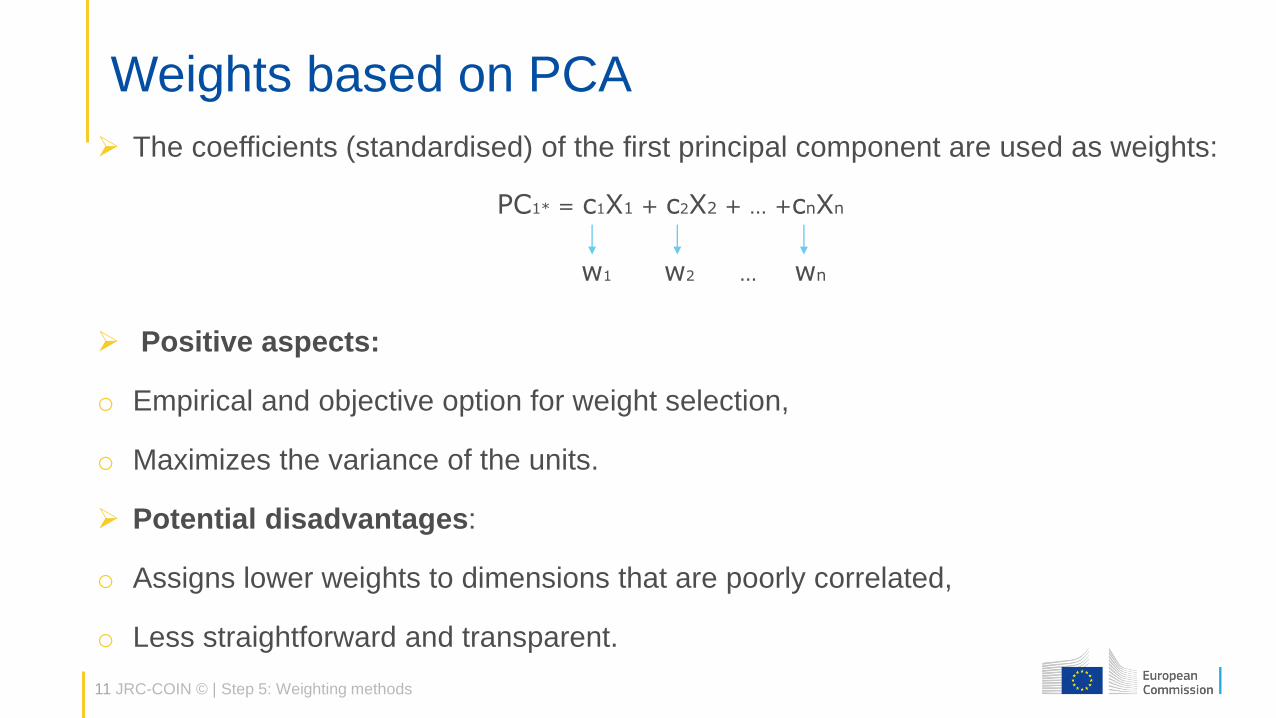
Weights based on PCA
The coefficients (standardised) of the first principal component are used as weights:
PC1* = c1X1 + c2X2 + … +cnXn
w1 w2 … wn
Positive aspects:
o Empirical and objective option for weight selection,
o Maximizes the variance of the units.
Potential disadvantages:
o Assigns lower weights to dimensions that are poorly correlated,
o Less straightforward and transparent.
12 JRC-COIN © | Step 5: Weighting methods
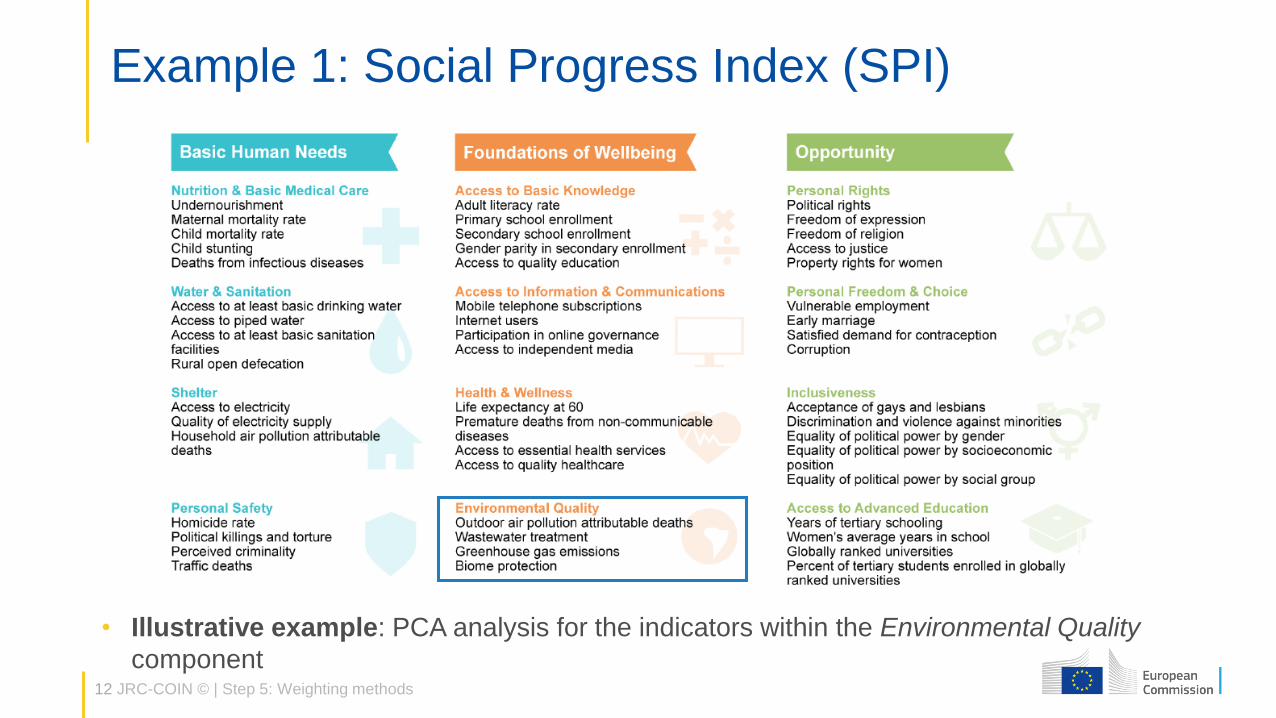
Example 1: Social Progress Index (SPI)
• Illustrative example: PCA analysis for the indicators within the Environmental Quality
component

13 JRC-COIN © | Step 5: Weighting methods
Example 1: Social Progress Index (SPI)
PC1 = 0.88 X1 + 0.83 X2 + 0.78 X3 + 0.47 X4
PC1norm = 0.30 X1 + 0.28 X2 + 0.26 X3 + 0.16 X4
Normalize to unity

14 JRC-COIN © | Step 5: Weighting methods
Example 1: Social Progress Index (SPI)
Average rank shift
4.49 positions
Comparing weighting schemes
Environmental Quality (EQ) Component
EQ
with
Eq
ua
l w
eig
hts
EQ with PCA weights
Average rank shift
0.51 positions
Comparing weighting schemes
SPI Index score
Conclusion: very similar ranking (in this case both may work well) – does not mean
they are equivalent
SPI with PCA weights
SP
Iw
ith
Eq
ua
l w
eig
hts

15 JRC-COIN © | Step 5: Weighting methods
Example 2: European Skills Index (SPI)
Component Eigenvalue VarianceCumulative
variance
PC1 1.75 58 58
PC2 0.88 29 88
PC3 0.37 12 100
Pillars PC1 PC2 PC3
Skills Development 0.88 -0.16 -0.44
Skills Activation 0.84 -0.36 0.41
Skills Matching 0.51 0.85 0.09
PC1norm
0.40
0.38
0.23
Total variance explained Pearson correlation coefficient
16 JRC-COIN © | Step 5: Weighting methods
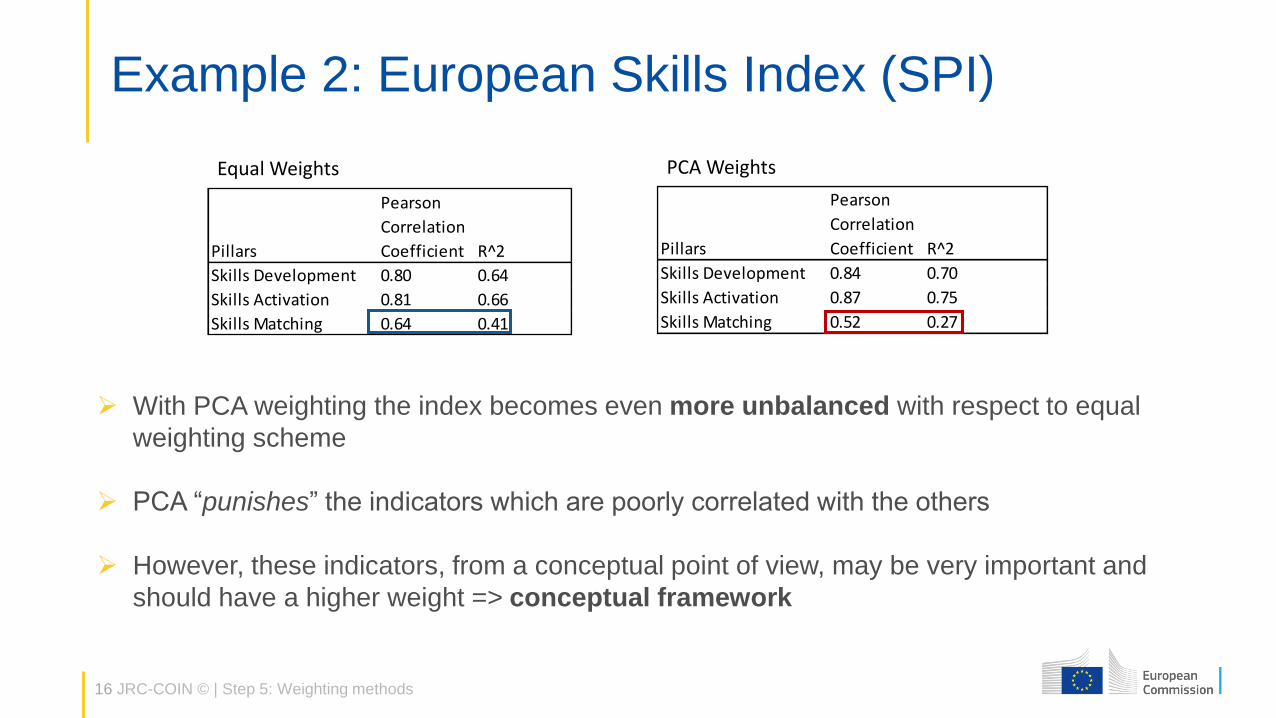
Example 2: European Skills Index (SPI)
Pillars
Pearson
Correlation
Coefficient R^2
Skills Development 0.80 0.64
Skills Activation 0.81 0.66
Skills Matching 0.64 0.41
Pillars
Pearson
Correlation
Coefficient R^2
Skills Development 0.84 0.70
Skills Activation 0.87 0.75
Skills Matching 0.52 0.27
Equal Weights PCA Weights
With PCA weighting the index becomes even more unbalanced with respect to equal
weighting scheme
PCA “punishes” the indicators which are poorly correlated with the others
However, these indicators, from a conceptual point of view, may be very important and
should have a higher weight => conceptual framework

17 JRC-COIN © | Step 5: Weighting methods
Expert opinion
There are two typical methods to elicit views from experts: budget allocation (BAP)
and analytic hierarchy process (AHP)
o In BAP a panel of experts is given N points to distribute to the indicators, or groups of
indicators (sub-pillars/pillars) - an average of the experts’ choices is used as a weight
o Critical issues: selection of experts (number and expertise) and the total number of
indicators to be evaluated:
- Experts should not be specialists for individual indicators, rather for the given sub-
index (larger “field” expertise)
- not more than 10 indicators – risk of “circular thinking”

18 JRC-COIN © | Step 5: Weighting methods
BAP - Example 1: Multidimensional poverty assessment tool (MPAT)
Selection of Experts:
o 42 experts from 10 countries
and 28 organizations (mainly
UN agencies and universities)
o selection based on expertise
on poverty assessment tools
in developing countries
Purpose: Eliciting weights to be assigned to the subcomponents of
each of the dimensions

19 JRC-COIN © | Step 5: Weighting methods
BAP - Example 1: MPAT
• Different distributions of weights
across sub-components
• Expert opinions may significantly
differ
• Example: Indian and Chinese
experts compared to the rest of
the world
Education
Gender and social
equality
Exposure
to shocks
Food and nutrition

20 JRC-COIN © | Step 5: Weighting methods
BAP - Diversity of expert judgements
• Convergence: Indian experts
have very similar views
compared to the experts
coming from the Rest of the
world
• But …

21 JRC-COIN © | Step 5: Weighting methods
BAP - Diversity of expert judgements
• Divergence: for 10
subcomponents Chinese
experts have very different
views
• Caution in averaging the
judgements from different
experts

22 JRC-COIN © | Step 5: Weighting methods
BAP - Example 2: The Cultural and Creative Cities Monitor

23 JRC-COIN © | Step 5: Weighting methods
BAP - Example 2: The Cultural and Creative Cities Monitor
Selection of experts: 17 Experts 5 from European Commission, 6 from Academia, 6 from
international organisations
o Experts divided in 3 groups - weights assigned to the three sub-indices by each group:
Sub-index Group 1 Group 2 Group 3 Average Weight
Cultural
vibrancy40 50 40 43.33 40
Creative
Economy35 30 40 35.00 40
Enabling
Environment25 20 20 21.7 20 Enabling Environment Weight
Human capital & education 40
Openness, tolerance, trust 40
Connections 15
Quality of governance 5
The experts agreed that that accessibility and governance
dimensions (within the Enabling Environment sub-index)
should have a minimum weight
24 JRC-COIN © | Step 5: Weighting methods
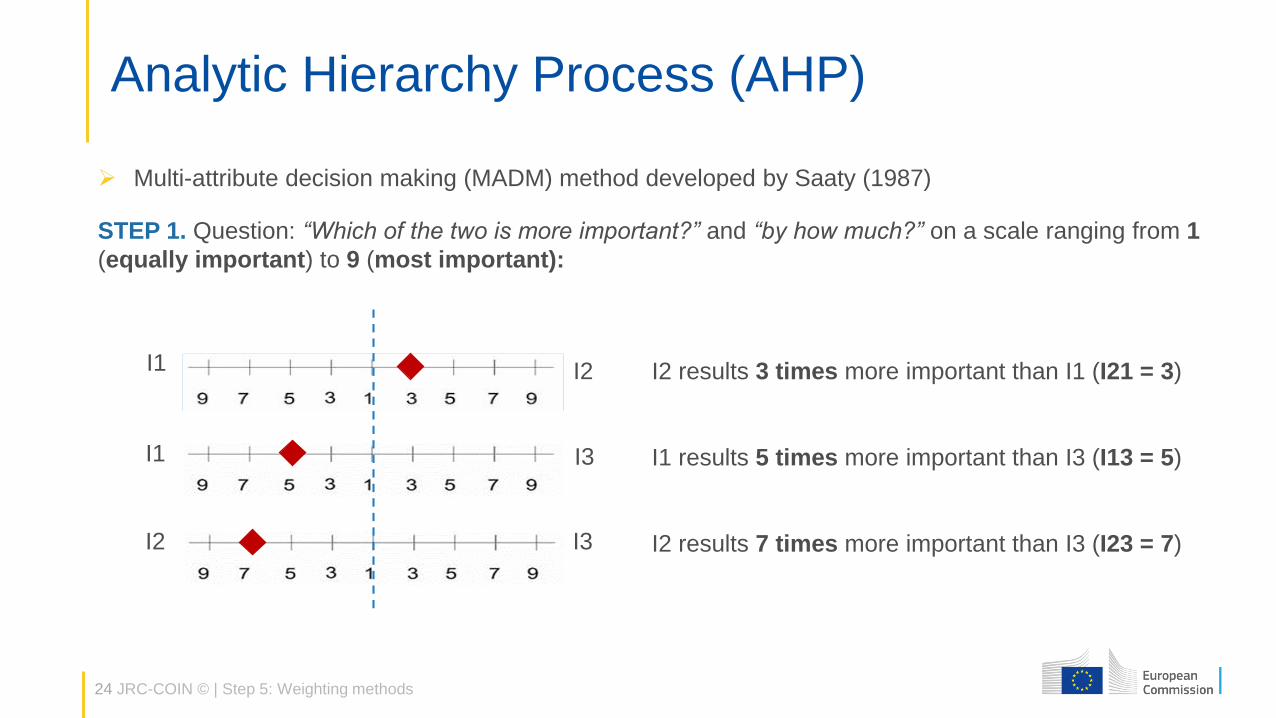
Analytic Hierarchy Process (AHP)
Multi-attribute decision making (MADM) method developed by Saaty (1987)
STEP 1. Question: “Which of the two is more important?” and “by how much?” on a scale ranging from 1
(equally important) to 9 (most important):
I1 I2
I1 I3
I2 I3
I2 results 3 times more important than I1 (I21 = 3)
I1 results 5 times more important than I3 (I13 = 5)
I2 results 7 times more important than I3 (I23 = 7)

25 JRC-COIN © | Step 5: Weighting methods
Analytic Hierarchy Process (AHP)
STEP 2. Set up a N x N matrix (M) with N being the number of indicators (in our case N = 3)
The relative importance assigned to each pair of indicators has to be transformed in weights
STEP 3. Calculation of weights
Normalized column method and geometric mean method (optimal for a limited number of indicators)
Eigenvector technique
M I1 I2 I3
I1 1 1/3 5
I2 3 1 7
I3 1/5 1/7 1
Elicited and
reciprocal relative
values (importance)

26 JRC-COIN © | Step 5: Weighting methods
Normalized columns method
A. sum each column B. normalized rel. weights C. row average
Geometric mean method
A. original elicited B. geometric mean (GM) C. normalized GM
M I1 I2 I3
I1 1 1/3 5
I2 3 1 7
I3 1/5 1/7 1
sum 21/5 31/21 13
M I1 I2 I3
I1 5/21 7/31 5/13
I2 15/21 21/31 7/13
I3 1/21 3/31 1/13
sum 1 1 1
Weights
I1 0.2828
I2 0.6434
I3 0.0738
M I1 I2 I3
I1 1 1/3 5
I2 3 1 7
I3 1/5 1/7 1
GM
I1 1.19
I2 2.76
I3 0.31
sum 4.25
Weights
I1 0.28
I2 0.6494
I3 0.0729

27 JRC-COIN © | Step 5: Weighting methods
Analytic Hierarchy Process (AHP)
Criticism of AHP
o Inconsistency forced by 1 to 9 scale (example: if I12 = 4 and I23 = 4, then I13 should be at least 16),
o When the number of indicators is very large, AHP exerts cognitive stress on decision makers,
o New alternatives can reverse the rank of existing alternatives.
Advantages of AHP
o Simplicity of pair-wise comparisons,
Compared to BAP, the AHP method is less prone to errors of judgement => there is a possibility to check
the consistency (in each set) of judgements and for each expert.

28 JRC-COIN © | Step 5: Weighting methods
Analytic Hierarchy Process (AHP)
STEP 4. Checking the consistency
Consistency ratio (CR)
o Some inconsistency tolerated: CR ≤ 0.1 (10%) even though 0.2 may work as well (does not affect the
weights drastically, Saaty, 1980),
o Code in R available.
Alternative: expert-based weights can be derived from conjoint analysis (CA)
o frequently used in marketing and consumer research,
o decompositional multivariate data analysis.

29 JRC-COIN © | Step 5: Weighting methods
Thank you
© European Union 2021
Unless otherwise noted the reuse of this presentation is authorised under the CC BY 4.0 license. For any use or reproduction of elements that are not owned by the
EU, permission may need to be sought directly from the respective right holders.
[email protected] | [email protected]
composite-indicators.jrc.ec.europa.eu
Recommended


