A C C E P T A N C E S A M P L I N G
Statistical ThinkingSession 2 of 410:15 to Noon
© 2014 ConteSolutions
Acceptance SamplingNotebook pages 31 to 40
S A M P L I N G C O N C E P T SB Y
J O H N A . C O N T E , P . E .
© 2014 ConteSoutions

The ASQ CQE BoK
IV Product and Process Control C. Acceptance Sampling
1. Sampling Concepts Define, describe, and apply the concepts of producer and
consumer risk and related terms, including operating characteristic (OC) curves, acceptable quality limit (AQL), lot tolerance percent defective (LTPD), average outgoing quality (AOQ), average outgoing quality limit (AOQL), etc. (Analyze)
© 2014 ConteSoutions
The ASQ CQE BoK
IV Product and Process Control C. Acceptance Sampling
2. Sampling standards and plans Interpret and apply ANSI/ASQ Z1.4 and Z1.9 standards
for attributes and variables sampling. Identify and distinguish between single, double, multiple, sequential, and continuous sampling methods.
Identify characteristics of Dodge-Romig sampling tables and when they should be used. (Analyze)
© 2014 ConteSoutions

Acceptance Sampling
Inspection of “Lots” of either incoming raw materials or outgoing product
Decision to accept or reject based on sample All sampling plans have two components The sample size (n) The maximum number of defectives allowed in the sample (c
or Ac) for acceptance of the lot
© 2014 ConteSoutions
Producer’s Risk
The risk of making an incorrect decision by rejecting a “good” lot
For sampling plans in Z1.4 that risk is set at about 5% for a given AQL
AQL is the Acceptable Quality Limit
© 2014 ConteSoutions
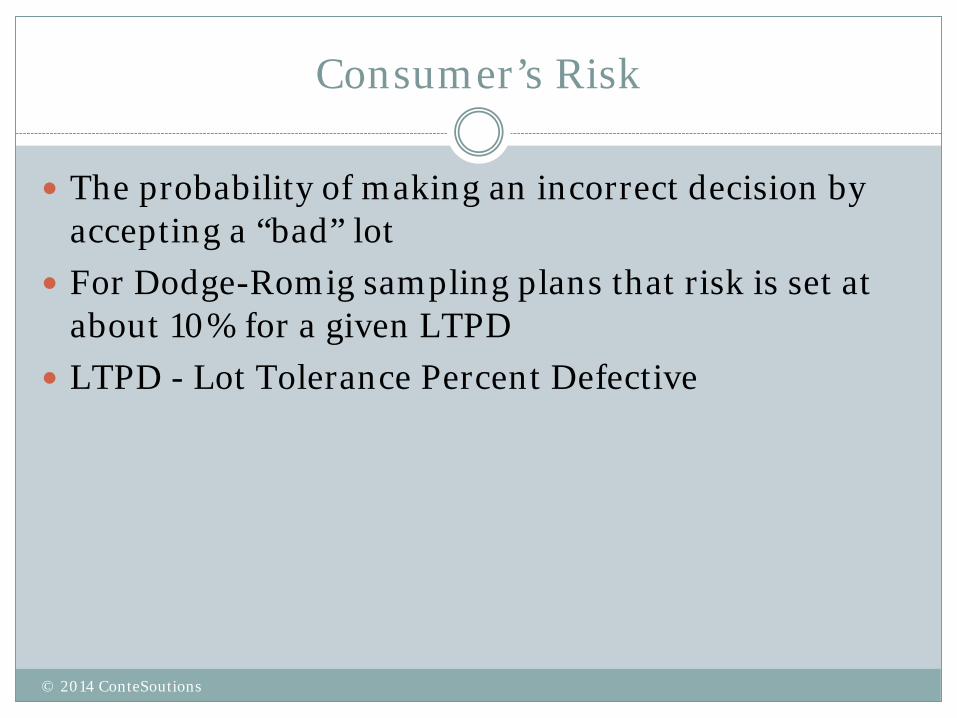
Consumer’s Risk
The probability of making an incorrect decision by accepting a “bad” lot
For Dodge-Romig sampling plans that risk is set at about 10% for a given LTPD
LTPD - Lot Tolerance Percent Defective
© 2014 ConteSoutions
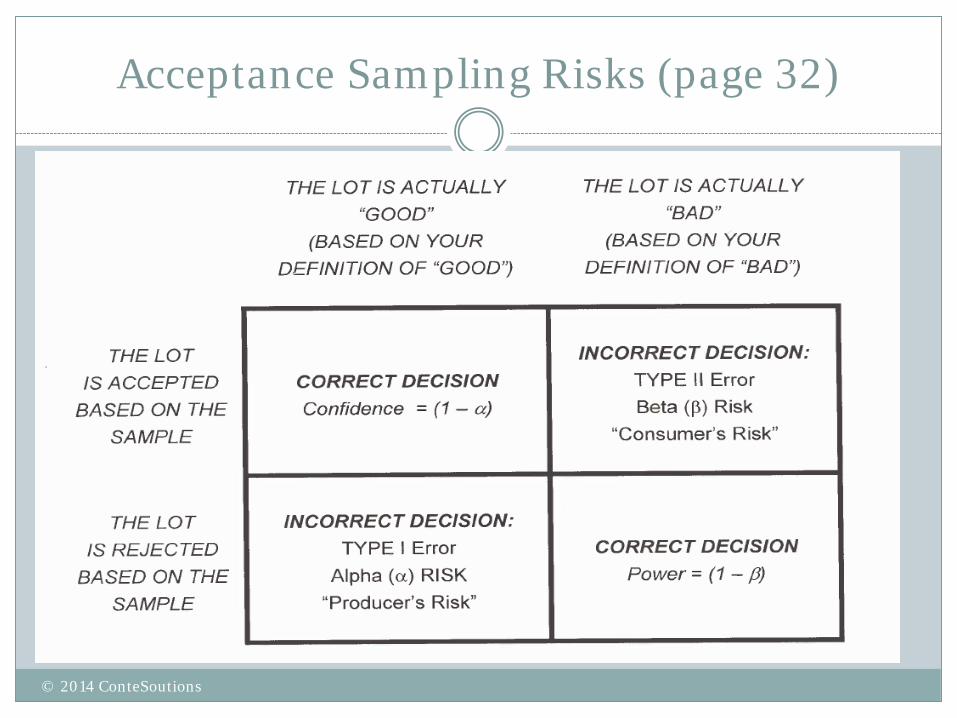
Acceptance Sampling Risks (page 32)
© 2014 ConteSoutions

Operating Characteristic Curve
First text given to me as a new engineer at Western Electric Company in 1966
“Sampling Inspection Tables” by Harold Dodge and Harry Romig
115 out of 200 pages devoted to OC curves
© 2014 ConteSoutions
© 2014 ConteSoutions
The Operating Characteristic Curve
Allows a sampling plan to be almost completely evaluated at a glace
Gives a pictorial view of the probabilities of accepting lots submitted a varying levels of percent non-conforming.
The OC Curve illustrate the risks of acceptance sampling
© 2014 ConteSoutions

The Operating Characteristic Curve
Curves are based either the Binomial or Poisson distribution
Poisson approximation to the binomial was often used as the binomial computations were quite complex before the age of electronic calculators
© 2014 ConteSoutions
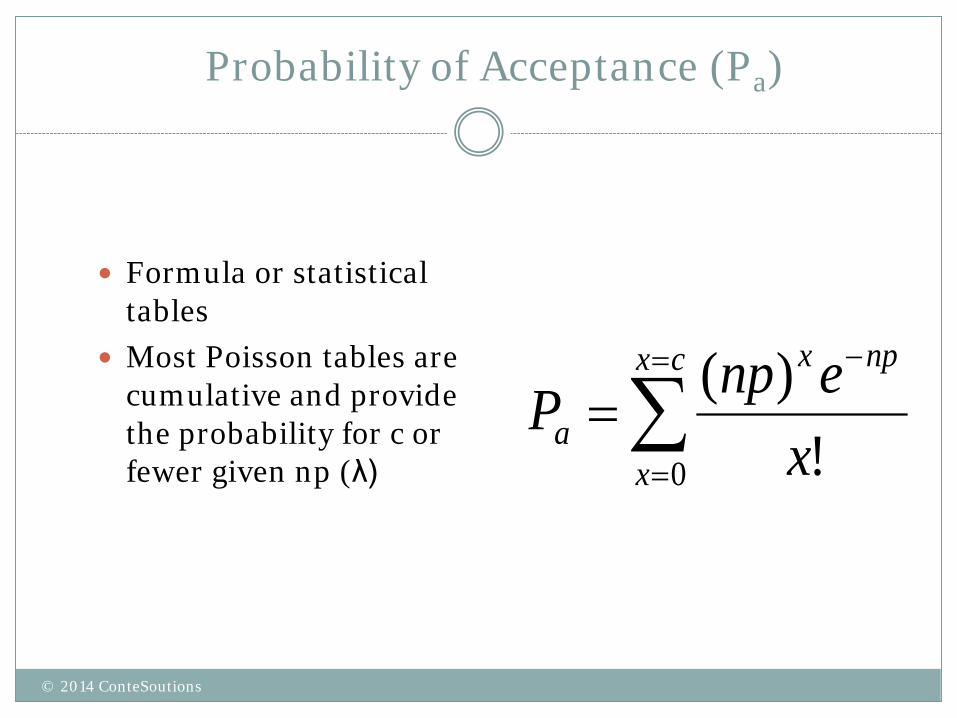
Probability of Acceptance (Pa)
Formula or statistical tables
Most Poisson tables are cumulative and provide the probability for c or fewer given np (λ)
∑=
=
−
=cx
x
npx
a xenpP
0 !)(
© 2014 ConteSoutions

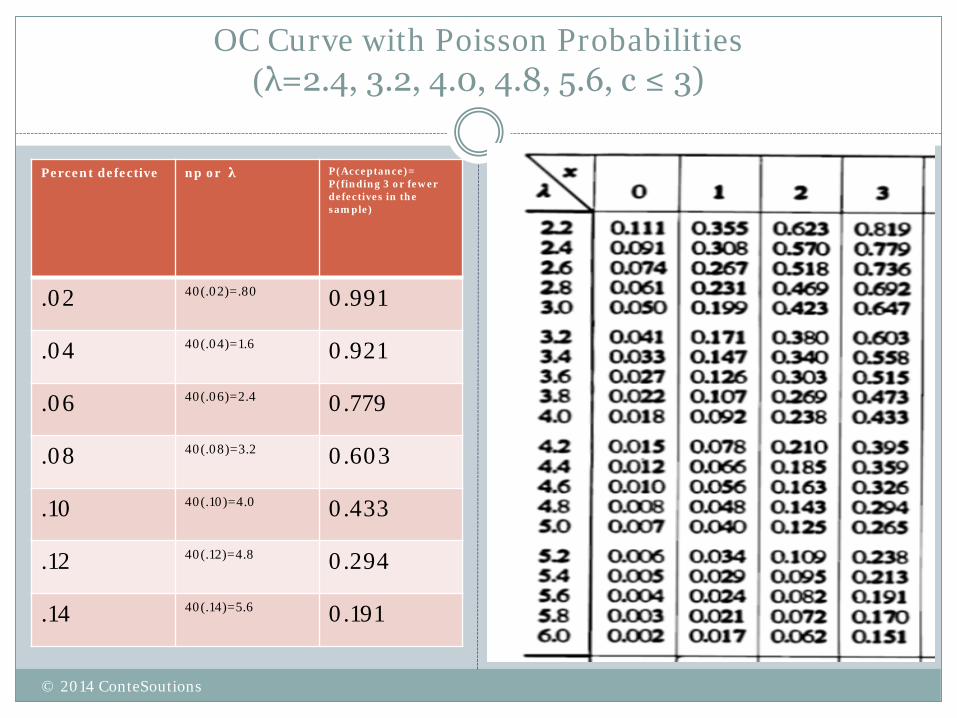
Percent defective
np or λ P(Acceptance)=P(finding 3 or fewer defectives in the sample)
.02 40(.02)=.80 0.991
.04 40(.04)=1.6 0.921
.06 40(.06)=2.4 0.779
.08 40(.08)=3.2 0.603
.10 40(.10)=4.0 0.433
.12 40(.12)=4.8 0.294
.14 40(.14)=5.6 0.191
OC Curve with Poisson Probabilities(λ=0.8, c ≤ 3)
© 2014 ConteSoutions
Percent defective np or λ P(Acceptance)=P(finding 3 or fewer defectives in the sample)
.02 40(.02)=.80 0.991
.04 40(.04)=1.6 0.921
.06 40(.06)=2.4 0.779
.08 40(.08)=3.2 0.603
.10 40(.10)=4.0 0.433
.12 40(.12)=4.8 0.294
.14 40(.14)=5.6 0.191
OC Curve with Poisson Probabilities(λ=2.4, 3.2, 4.0, 4.8, 5.6, c ≤ 3)
© 2014 ConteSoutions
181614121086420
1.0
0.8
0.6
0.4
0.2
0.0
Lot Percent Defective
Pro
ba
bili
ty o
f A
cce
pta
nce
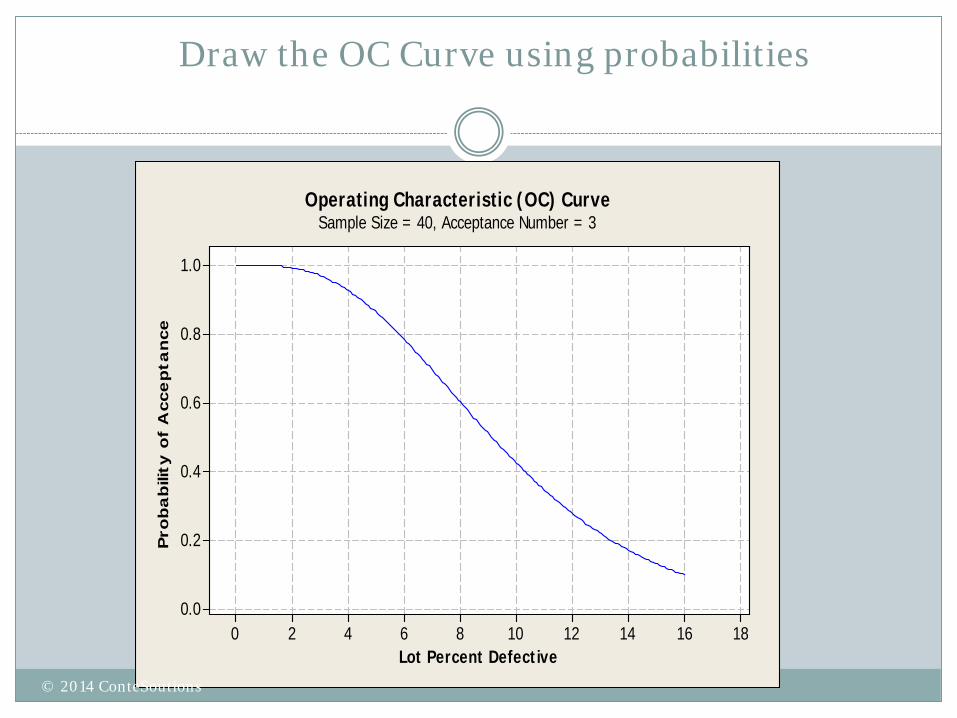
Operating Characteristic (OC) CurveSample Size = 40, Acceptance Number = 3
Draw the OC Curve using probabilities
© 2014 ConteSoutions
Acceptable Quality Level (AQL)
From Z1.4 – Acceptance Quality Limit (AQL) “4.2 Definition: The AQL is the quality level that is
the worst tolerable process average average whena continuing series of lots is submitted for acceptance sample.”
“Note: The use of the abbreviation AQL to mean Acceptable Quality level is no longer recommended.”
© 2014 ConteSoutions
Acceptable Quality Level
From Z1.4 - “Although individual lots with quality as bad as the AQL can be accepted with a fairly high probability, the designation of a n AQL does not suggest that this is necessary a desirable quality level. The AQL is a parameter of the sampling scheme …”
The probability of acceptance of a lot with a process average equal to the AQL is normally set at 0.95
© 2014 ConteSoutions

Minitab SoftwareCreate or Compare Sampling Plan
Stat Quality Tools
Acceptance Sampling by Attributes
Default Screen Create based on input of AQL, LTPD, and N Or Compare based on input of n, c, and N Measurement type percent defective Acceptable Quality Level (AQL) 0.05 Rejectable Quality Level (RQL or LTPD) 0.10
© 2014 ConteSoutions

1612840
1.0
0.8
0.6
0.4
0.2
0.0
Lot Percent Defective
Prob
abilit
y of
Acc
eptan
ce
1612840
4.8
3.6
2.4
1.2
0.0
Incoming Lot Percent Defective
AOQ
(Per
cent
Defe
ctive
)
1612840
90000
70000
50000
30000
10000
Lot Percent Defective
Aver
age T
otal
Insp
ectio
n
Operating Characteristic (OC) Curve Average Outgoing Quality (AOQ) Curve
Average Total Inspection (ATI) Curve
Sample Size = 40, Acceptance Number = 3
Minitab Example – CompareInput of n, c, and N
© 2014 ConteSoutions
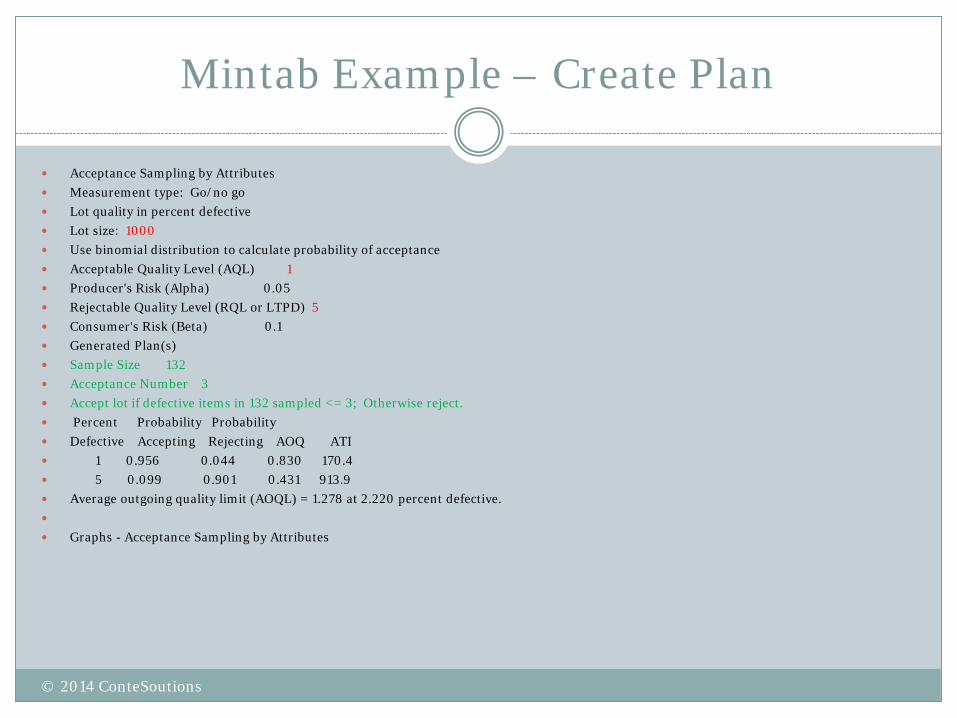
Mintab Example – Create Plan
Acceptance Sampling by Attributes Measurement type: Go/no go Lot quality in percent defective Lot size: 1000 Use binomial distribution to calculate probability of acceptance Acceptable Quality Level (AQL) 1 Producer's Risk (Alpha) 0.05 Rejectable Quality Level (RQL or LTPD) 5 Consumer's Risk (Beta) 0.1 Generated Plan(s) Sample Size 132 Acceptance Number 3 Accept lot if defective items in 132 sampled <= 3; Otherwise reject. Percent Probability Probability Defective Accepting Rejecting AOQ ATI 1 0.956 0.044 0.830 170.4 5 0.099 0.901 0.431 913.9 Average outgoing quality limit (AOQL) = 1.278 at 2.220 percent defective.
Graphs - Acceptance Sampling by Attributes
© 2014 ConteSoutions
10.07.55.02.50.0
1.0
0.8
0.6
0.4
0.2
0.0
Lot Percent Defective
Prob
abilit
y of
Acc
eptan
ce
10.07.55.02.50.0
1.2
0.9
0.6
0.3
0.0
Incoming Lot Percent Defective
AOQ
(Per
cent
Defe
ctive
)
10.07.55.02.50.0
1000
800
600
400
200
Lot Percent Defective
Aver
age T
otal
Insp
ectio
n
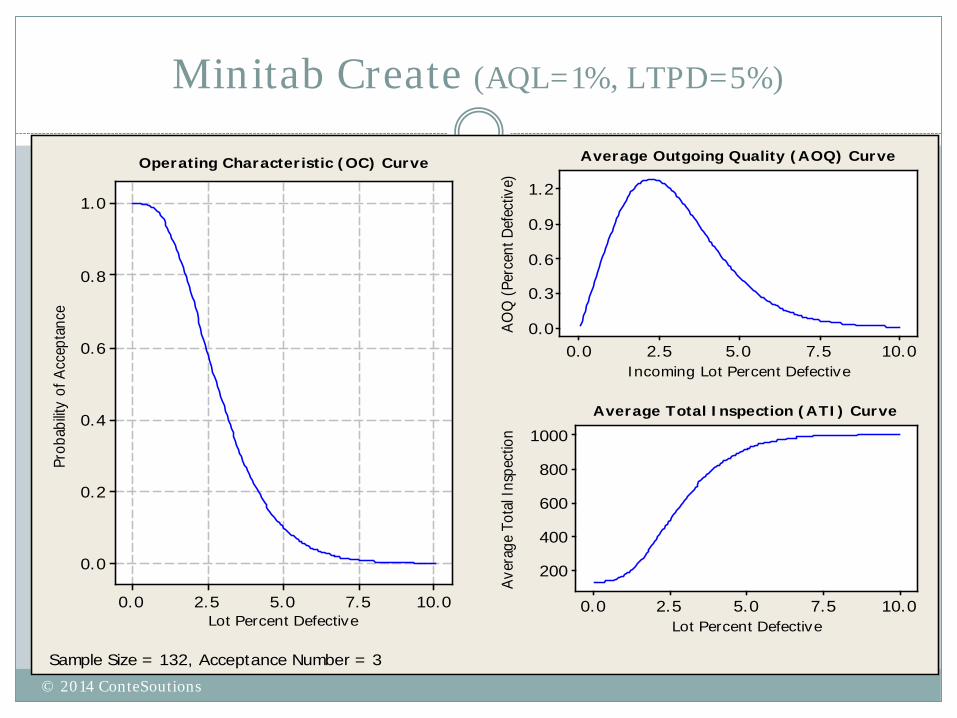
Operating Characteristic (OC) Curve Average Outgoing Quality (AOQ) Curve
Average Total Inspection (ATI) Curve
Sample Size = 132, Acceptance Number = 3
Minitab Create (AQL=1%, LTPD=5%)
© 2014 ConteSoutions

AOQ and AOQL
Average Outgoing Quality (AOQ) AOQ dependent on the Incoming Quality Average Outgoing Quality Limit AOQL highest value of AOQ
© 2014 ConteSoutions
AOQ - Average Outgoing Quality
The expected average quality of all products, including all accepted lots, plus all rejected lots that have been sorted 10% and have had all defective units replaced
Will always be less than the submitted quality AOQ = Pa * p ( 1 –n/N ) AOQL is the maximum value of AAOQ
© 2014 ConteSoutions
Recommended