State of Palestine
Palestinian Central Bureau of Statistics
Labour Force Survey
(January-March, 2018) Round
(Q1/2018)
Press Report on the
Labour Force Survey Results
2018/05/08
PCBS: labour Force Survey, Q1- 2018
PAGE NUMBERS OF ENGLISH TEXT ARE PRINTED IN SQUARE BRACKETS.
TABLES ARE PRINTED IN THE ARABIC ORDER (FROM RIGHT TO LEFT).
Notes: The numbers included in Report are estimates based on the results of the
Population, Housing and Establishment Census, 2017.
May, 2018
All Rights Reserved.
Citation:
Palestinian Central Bureau of Statistics, 2018. Labour Force Survey: (January-
March, 2018) Round, (Q1/2018). Press Report on the Labour Force Survey Results.
Ramallah - Palestine.
All correspondence should be directed to:
Palestinian Central Bureau of Statistics
P.O.Box 1647, Ramallah, Palestine.
Tel: (972/970) 2 298 2700
Fax: (972/970) 2 298 2710
Toll free: 1800300300
E-Mail :[email protected]
Web-Site: http://www.pcbs.gov.ps
This document is prepared in accordance with the standard
procedures stated in the Code of Practice for Palestine Official
Statistics 2006

PCBS: labour Force Survey, Q1- 2018
Table of contents
Page Subject
[5] Main Results
]7[ Concepts and Definitions
9 Tables

PCBS: labour Force Survey, Q1- 2018
]5[
Main Results
The labour force participation rate of
individuals aged 15 years and above was
45.4%
The number of individuals participating in
the labour force in Palestine was 1,304,244 in
the 1st quarter 2412; 224,944 in the West
Bank and 519,344 in Gaza Strip.
The labour force participation rate in the
West Bank was 00.9% and 06.2% in Gaza
Strip, the gap in the participation rate
between males and females in Palestine still
very big where it reached 74.3% for males
compared with 19.9% for females.
03.2% the unemployment rate among
labour force participants
Using ILO standards, the number of
unemployed was 040,800 in the 1st quarter
2018; distributed as 255,000 in Gaza Strip
and 149,800 in the West Bank.
The unemployment rate in Gaza Strip was
49.1% compared with 18.3% in the West
Bank in the 1st quarter 2018, And the
unemployment rate for males in Palestine
was 25.0% compared with 48.9% for
females.
The highest unemployment rate in the
1st quarter 2018 was 49.6% among youth
aged 20-24 years. For years of schooling, the
highest unemployment rate among females
with 13 years of schooling and more was
52.2%.
The number of the employment in the
local market decreased between the 4th
quarter 2017 and 1st
quarter 2018
The number of employed in the local market
decreased from 845,600 in the 0th
quarter
2017 to 811,500 in the 1st quarter 2018. The
number of employed individuals in the West
Bank decreased by 18,800 employed, also
the number of employed individuals in Gaza
Strip decreased by 15,300 employed in the
same period.
The services sector was the biggest employer
in the local market with 35.2% in the West
Bank and 55.7% in Gaza Strip.
The public sector employed 22.4% of those
in employment; 38.0% in Gaza Strip and
16.2% in the West Bank.
The average daily wage for wage employees
in the West Bank was 106.4 NIS compared
with 62.1 NIS in Gaza Strip in the 1st quarter
2018 .
The average weekly hours worked by wage
employees in the West Bank was 44.2 hour
in the 1st quarter 2018 and 44.1 hour in the
0th
quarter 2017. The average number of days
worked per month was 22.7 and 23.2 day in
the 1st quarter 2018 and 0
th quarter 2017.
The average number of hours worked per
week in Gaza Strip was 36.3 and 37.4 hour
per week in the 1st quarter 2018 and 0
th
quarter 2017, and the average number of
days worked per month was 22.1 and 22.9
working day in 1st quarter 2018 and 0
th
quarter 2017 respectively.
Number of employed in Israel and Israeli
settlements was 121,000 in the 1st
quarter
2018
The number of employed individuals
employed in Israel and Israeli settlements
was 121,000 in the 1st quarter 2018 compared
with 112,100 in the 0th
quarter 2017. Of
these; 64,300 had a permit, 42,400 worked
without any permit and 14,300 employed
individuals have an Israeli identity card or
foreign passport.
The number of employees in the Israeli
settlements decreased to 17,600 in the 1st
quarter 2018 from 21,000 in the 4th
quarter
2017.
65.0% of employed in Israel and the Israeli
settlements worked in the construction
sector.

PCBS: labour Force Survey, Q1- 2018
]6[
The average daily wage for the wage
employees in Israel and the Israeli
settlements reached 242.5 NIS in the 1st
quarter 2018 compared with 232.0 NIS in the
4th
quarter 2017.
The average number of hours worked per
week in Israel and the Israeli settlements
reached 42.4 in the 1st quarter 2018
compared with 41.8 in the 4th
quarter 2017.
The average number of days worked per
month reached 20.1 working day in the 1st
quarter 2018 compared with 19.6 in the 4th
quarter 2017.
Employment Status in the 1st quarter 2018
70.7% of employed individuals are wage
employees; 67.6% in the West Bank and
78.8% in Gaza Strip.
18.7% of employed individuals are self-
employed; 20.0% in the West Bank and
15.3% in Gaza Strip.
3.9% of employed individuals are unpaid
family members; 4.3% in the West Bank and
2.7% in Gaza Strip.
6.7% of employed individuals are employers;
8.1% in the West Bank and 3.2% in Gaza
Strip.
Percentage Distribution of Employed
Individuals by Employment Status, Q1-2018
Working benefits for wage employees in
the private sector 27.1% of wage employees are hired by
contract (8.6% of them with limited period
and 18.5% with unlimited period), compared
with 51.4% hired without any contract, and
21.5% of wage employees are hired by
verbal agreement.
24.5% of wage employees contribute to a
pension fund, 24.0% have annual paid leave
and 41.1% of wage employees women have
paid maternity leave.
19.2% of employed individuals in Palestine
are affiliated to a workers vocational union;
13.8% in the West Bank and 33.0% in Gaza
Strip.
35.8% of wage employees in the private
sector received less than the minimum wage
(1,450 NIS) in Palestine.
In the West Bank 15.5% of wage employees
in the private sector received less than
minimum monthly wage, about 36,300 wage
employees with average monthly wage 1,074
NIS.
In Gaza Strip the percentage of wage
employees in the private sector who received
less than the minimum monthly wage was
80.1% about 86,300 wage employees with
average monthly wage 693 NIS.
Child Labour 2.7% of children aged 10-17 years in Palestine
are employed; 3.7% in the West Bank and
1.2% in Gaza Strip.
All correspondence should be directed to:
Palestinian Central Bureau of Statistics
P.O.Box 1647, Ramallah, Palestine.
Tel: (972/970) 2 298 2700
Fax: (972/970) 2 298 2710
Toll free: 1800300300
E-Mail :[email protected]
Web-Site: http://www.pcbs.gov.ps
6.7 18.7
70.7
3.9
Employer Self employed
Wage employee Unpaid family member

PCBS: labour Force Survey, Q1- 2018
]7[
Concepts and Definitions
Population of Working Age:
All persons aged 15 years and above. Reference Week: The week ending on Friday preceding the interviewer’s visit to the household. Labour Force:
All persons aged 15 years and above who are either employed or unemployed.
Employed: Persons aged 15 years and over who were at work at least one hour during the reference
period, or who were not at work during the reference period, but held a job or owned business
from which they were temporarily absent (because of illness, vacation, temporarily stoppage,
or any other reason) he\ she was employed, unpaid family member or other. The employed
person is normally classified in one of two categories according to the number of weekly
work hours, i.e. 1-14 work hours and 15 work hours and above. Also the absence due to sick
leave, vacation, temporarily stoppage, or any other reason. Employed persons are classified
according to employment status as follows:
1.Employer 2.Self-employed 3. Paid- employed (wage employee)
4.Unpaid family member
Time related underemployment: All persons who were employed during a short reference
period and the total actual hours worked in all jobs were less than 35 hours and they wanted
to work additional hours, who were available to work additional hours if they given an
opportunity for additional work.
Unemployed (According to the ILO Standards):
Unemployed persons are those individuals aged 15 years and above who did not work at all
during the reference period, who were not absent from a job, were available for work and
actively seeking a job during the Last four weeks by one of the following methods news
paper, registered at employment office, ask friends or relatives or any other method.
Persons Outside Labour Force:
The population not economically active comprises all persons 15 years and above, who were
neither employed nor unemployed accordingly to the definitions over. Because they don’t
have any desire to work or because of the availability of another source of income.
Unpaid trainee: The person who performed any unpaid work to produce goods and services
for others, in order to acquire experience or skills in the workplace in order to be able to find
jobs, transportation or allowance or meals or gifts that offered to trainee are not considered as
wage
Own-use production: The person who performed any activity to produce goods or provide
services for own final consumption or for his/ her family consumption, including producing or
processing for storage agricultural, fishing, hunting and gathering products, and
manufacturing household goods ( clothing, food, and furniture) .
PCBS: labour Force Survey, Q1- 2018
]8[
Volunteer work: The person in volunteer work are who performed any unpaid activity, non
compulsory activity to produce goods or provide services for others, it includes work done
through, or for, self help, mutual aid or community based groups of which volunteer is a
member, which transportation allowance or meals or gifts that offered to volunteer are not
considered as wage, and unpaid work required as part of education or training programmers
are excluded from volunteer work

:PCBS 8102 الأولمسح القوى العاملة، الربع PCBS: labour Force Survey, Q1- 2018
9
،(ILOمعايير )العلاقة بقوة العمل و المنطقة والجنس حسب فلسطين منسنة فأكثر 51التوزيع النسبي للأفراد : 1جدول 8152، آذار -كانون ثاني
Table 1: Percentage Distribution of Individuals Aged 15 Years and Above from Palestine by Region, Sex and Labour Force Status, (ILO Standards), January- March, 2018
Region and Sex
Labour Force Status العلاقة بقوة العمل
والجنس نطقةالم جموعملا
Total
ج القوى العاملةخار Outside Labour Force
ل القوى العاملةداخIn Labour Force
سبةالن(%)
ددالعNumber
سبةالن(%)
ددالعNumber
سبةلنا(%)
ددالعNumber
West Bank فة الغربية ضلا Males 100 928,600 0.82 260,100 0082 668,500 ذكور Females 100 897,900 ..82 745,500 0082 152,400 اناث Total 100 1,826,500 ..55 1,005,600 ..54 820,900 المجموع Gaza Strip ةز ع غاطق Males 100 565,400 .08. 182,900 7080 382,500 ذكور Females 100 558,200 0787 421,400 0.87 136,800 اناث Total 100 1,123,600 ..55 604,300 ..54 519,300 المجموع Palestine فلسطين Males 100 1,494,000 0.80 443,000 028. 1,051,000 ذكور Females 100 1,456,100 .280 1,166,900 0.8. 289,200 اناث Total 100 2,950,100 ..5. 1,609,900 ..5. 1,340,200 المجموع
،(ILOمعايير )مركبات القوى العاملة المنطقة والجنس و حسب فلسطين منسنة فأكثر 51التوزيع النسبي للقوى العاملة : 2جدول
8152، آذار -كانون ثانيTable 2: Percentage Distribution of Labour Force Participants Aged 15 Years and Above from
Palestine by Region, Sex and Labour Force Components, (ILO Standards), January- March, 2018
Region and Sex
Labour Force Components مركبات القوى العاملة
نطقة والجنسالم جموعملا
Total
البطالةUnemployment
متصلة بالوقت ناقصةمالة ع
Time Related Underemployment
تامةمالة عFull Employment
سبةالن(%)
ددالعNumber
سبةالن(%)
ددالعNumber
سبةالن(%)
ددالعNumber
سبةالن(%)
ددالعNumber
West Bank فة الغربية ضلا Males 100 668,500 078. 106,100 087 10,200 .087 552,200 ذكور Females 100 152,400 0.80 43,700 28. 1,400 028. 107,300 اناث Total 100 820,900 555. 149,800 55. 11,600 5.5. 659,500 المجموع Gaza Strip ةز ع غاطق Males 100 382,500 .080 157,200 082 7,800 778. 217,500 ذكور Females 100 136,800 0087 97,800 080 1,400 008. 37,600 اناث Total 100 519,300 .455 255,000 555 9,200 .455 255,100 المجموع Palestine فلسطين Males 100 1,051,000 0782 263,300 080 18,000 0.8. 769,700 ذكور Females 100 289,200 ..8. 141,500 082 2,800 7280 144,900 اناث Total 100 1,340,200 ..54 404,800 55. 20,800 .554 914,600 المجموع

:PCBS 8102 الأولمسح القوى العاملة، الربع PCBS: labour Force Survey, Q1- 2018
01
نسبة المشاركة في القوى العاملة ومعدل البطالة بين المشاركين في القوى العاملة للخريجين الذين يحملون مؤهل علمي دبلوم : 3جدول 2018، آذار -ن ثانيكانو ،(ILOمعايير )متوسط فأعلى في فلسطين حسب التخصص
Table .: Labour Force Participation Rate and Unemployment Rate for Graduates who hold Associate Diploma Certificate and Above in Palestine by Specialization (ILO Standards),
January- March, 2018
Specialization معدل البطالة
كة في نسبة المشار التخصص القوى العاملة
Unemployment Rate
Participation Rate
Teacher Training and Education Science 45.2 70.4 علوم تربوية وا عداد معلمين
Humanities 38.6 65.7 علوم إنسانية Social and Behavioral Science 39.2 75.9 العلوم الاجتماعية والسلوكية
Journalism and Information 48.2 76.0 الصحافة والإعلام
Business and Administration 35.8 80.4 الأعمال التجارية والإدارية Law 14.5 66.8 القانون
Life Sciences 37.6 73.9 العلوم الطبيعية
Mathematics and Statistics 33.6 85.6 الرياضيات والإحصاء
Computer Science 31.0 76.8 علم الحاسوب
Engineering and Engineering Occupations 29.1 81.5 الهندسة والمهن الهندسية
Architectural and Construction 16.6 86.9 العلوم المعمارية والبناء
Health 23.9 77.5 الصحة
Personal Services 11.7 79.9 الخدمات الشخصية
Other Specialization 34.8 68.5 باقي التخصصات
Total 34.8 75.2 المجموع

:PCBS 8102 الأولمسح القوى العاملة، الربع PCBS: labour Force Survey, Q1- 2018
00
،(ILOايير مع)العمرية والجنس الفئةحسب فلسطينسنة فأكثر في 51نسبة المشاركة في القوى العاملة للأفراد : 4جدول 8152، آذار -كانون ثاني
Table 4: Labour Force Participation Rate of Individuals Aged 15 Years and Above in Palestine by Age Group and Sex (ILO Standards), January- March, 2018
Age Group Sex الفئة العمرية الجنس
Total جموعملا
Females ثإنا
Males رذكو
)(
15-19 16.2 0.7 30.9 07-0.
20-24 48.7 23.2 72.9 02-0.
25-29 62.2 35.2 88.1 07-0.
30-34 61.3 29.5 92.9 .2-..
35-39 61.8 29.7 93.8 .7-..
40-44 58.5 26.4 89.8 .2-..
45-49 55.8 22.9 87.4 .7-..
50+ 30.0 8.4 51.8 72+
Total 45.4 19.9 70.3 المجموع
،(ILOايير مع)حسب الفئات العمرية والمنطقة فلسطينسنة فأكثر في 51العاملة للأفراد نسبة المشاركة في القوى : 5جدول 8152، آذار -كانون ثاني
Table 5: Labour Force Participation Rate of Individuals Aged 15 Years and Above in Palestine by Age Group and Region (ILO Standards), January- March, 2018
Age Group
Region المنطقة فلسطين الفئات العمرية
Palestine
ع غزةقطاGaza Strip
فة الغربيةالضWest Bank
15-19 16.2 13.6 17.9 07-0.
20-24 48.7 52.8 45.9 02-0.
25-29 62.2 65.9 59.7 07-0.
30-34 61.3 66.1 58.1 .2-..
35-39 61.8 63.8 60.5 .7-..
40-44 58.5 57.0 59.3 .2-..
45-49 55.8 53.9 56.8 .7-..
50+ 30.0 26.0 32.0 72+
Total 45.4 46.2 44.9 المجموع
،(ILOايير مع)حسب سنوات الدراسة والجنس فلسطينسنة فأكثر في 51نسبة المشاركة في القوى العاملة للأفراد : 6جدول 8152، آذار -كانون ثاني
Table 6: Labour Force Participation Rate of Individuals Aged 15 Years and Above in Palestine by Years of Schooling and Sex (ILO Standards), January- March, 2018
Years of Schooling Sex ت الدراسةسنوا الجنس
Malesر ذكو Femalesث إنا Total جموع ملا
0 7.0 2.9 18.3 2
1-6 38.4 8.1 64.1 0- 7
7-9 41.2 7.8 66.7 0- .
10-12 42.0 8.8 74.2 02-00
13+ 58.6 45.6 72.9 0.+
Total 45.4 19.9 70.3 المجموع

:PCBS 8102 الأولمسح القوى العاملة، الربع PCBS: labour Force Survey, Q1- 2018
08
،(ILOايير مع)راسة والمنطقة حسب سنوات الد فلسطينسنة فأكثر في 51نسبة المشاركة في القوى العاملة للأفراد : 7جدول 8152، آذار -كانون ثاني
Table 7: Labour Force Participation Rate of Individuals Aged 15 Years and Above in Palestine by Years of Schooling and Region (ILO Standards), January- March, 2018
Years of Schooling
Region المنطقة فلسطين ت الدراسةاسنو
Palestine
ع غزةقطاGaza Strip
فة الغربيةالضWest Bank
0 7.0 7.0 7.0 2
1-6 38.4 45.7 34.9 0-7
7-9 41.2 38.2 43.0 0-.
10-12 42.0 38.7 44.0 02-00
13+ 58.6 63.0 55.4 0.+
Total 45.4 46.2 44.9 المجموع
حسب المنطقة فلسطينسنة فأكثر في 51لعاملة ومعدل البطالة من المشاركين في القوى العاملة للأفراد نسبة المشاركة في القوى ا: 8جدول
8152، آذار -كانون ثاني، (ILOايير مع) وحالة اللجوء والجنسTable 8: Labour Force Participation Rate and Unemployment Rate of Individuals Aged 15
Years and Above in Palestine by Region, Refugee Status and Sex (ILO Standards), January- March, 2018
Region and Refugee Status
معدل البطالة والجنسUnemployment Rate and Sex
نسبة المشاركة والجنسParticipation Rate and Sex حالة اللجوء و المنطقة
جموعملاTotal
ثإناFemales
رذكو Males
جموعملاTotal
ثإناFemales
رذكو Males
West Bank فة الغربيةضلا Refugee 17.9 22.9 16.6 46.2 19.5 71.5 لاجئ Non-Refugee 18.4 31.1 15.6 44.5 16.1 72.2 غير لاجئ Total 18.3 28.7 15.9 44.9 17.0 72.0 المجموع Gaza Strip ةز ع غاطق Refugee 51.3 70.9 43.4 46.8 26.8 66.8 لاجئ Non-Refugee 44.8 73.0 36.9 45.1 20.1 69.2 غير لاجئ Total 49.1 71.5 41.1 46.2 24.5 67.7 المجموع Palestine فلسطين Refugee 38.5 56.0 32.4 46.6 24.0 68.7 لاجئ Non-Refugee 24.3 42.0 20.2 44.6 17.0 71.5 جئغير لا Total 30.2 48.9 25.0 45.4 19.9 70.3 المجموع

:PCBS 8102 الأولمسح القوى العاملة، الربع PCBS: labour Force Survey, Q1- 2018
01
المنطقة حسب فلسطينسنة فأكثر في 51المشاركين في القوى العاملة للأفراد بيننسبة المشاركة في القوى العاملة ومعدل البطالة : 9جدول 8152، آذار -كانون ثاني، (ILOايير مع) الحالة الزواجية والجنسو
Table 9: Labour Force Participation Rate of Individuals Aged 15 Years and Above and Unemployment Rate among Participated Individuals in Palestine by Region, Marital Status
and Sex (ILO Standards), January- March, 2018
Region and Marital Status
والجنس معدل البطالة Unemployment Rate and Sex
والجنس نسبة المشاركةParticipation Rate and Sex الحالة الزواجية و المنطقة
جموعملاTotal
ثإناFemales
رذكو Males
جموعملاTotal
ثإناFemales
رذكو Males West Bank ة فة الغربيضلا
Never Married 28.3 40.5 25.2 42.2 18.9 61.0 م يتزوج أبدا ل Currently Married 11.8 21.4 10.0 49.4 16.3 82.5 تزوج حاليا م Other 6.2 5.2 8.2 14.8 12.0 30.6 خرى أ Total 18.3 28.7 15.9 44.9 17.0 72.0 لمجموعا Gaza Strip ةز ع غاطق Never Married 66.0 76.7 62.0 40.7 24.2 54.4 م يتزوج أبدا ل Currently Married 39.4 68.5 29.8 51.9 25.8 78.2 تزوج حاليا م Other 64.6 69.1 54.5 18.6 14.9 43.3 خرى أ Total 49.1 71.5 41.1 46.2 24.5 67.7 لمجموعا Palestine فلسطين Never Married 41.8 56.1 37.6 41.7 20.9 58.6 م يتزوج أبدا ل Currently Married 23.0 45.3 17.5 50.4 20.0 80.8 تزوج حاليا م Other 30.4 31.9 27.3 16.2 13.1 34.8 خرى أ Total 30.2 48.9 25.0 45.4 19.9 70.3 لمجموعا
حسب المنطقة ونوع فلسطينسنة فأكثر في 51نسبة المشاركة في القوى العاملة ومعدل البطالة بين المشاركين في القوى العاملة : 10جدول
8152، آذار -كانون ثاني، (ILOايير مع)التجمع والجنس Table 10: Labour Force Participation Rate of Individuals Aged 15 Years and Above and
Unemployment Rate among Participated Individuals in Palestine by Region, Type of Locality and Sex (ILO Standards), January- March, 2018
Region and Type of locality
معدل البطالة والجنسUnemployment Rate and Sex
نسبة المشاركة والجنسParticipation Rate and Sex نوع التجمع و المنطقة
جموعملاTotal
ثإناFemales
رذكو Males
جموعملاTotal
ثإناFemales
رذكو Males West Bank فة الغربية ضلا
Urban 17.6 27.1 15.4 45.5 17.4 72.5 حضر Rural 19.0 32.5 16.0 44.0 16.3 70.8 ريف Camps 23.4 32.5 21.6 43.2 14.5 70.8 مخيمات Total 18.3 28.7 15.9 44.9 17.0 72.0 لمجموعا Gaza Strip ةز ع غاطق Urban 48.6 71.4 40.5 46.5 24.7 67.9 حضر Rural 56.9 87.9 50.4 41.7 15.0 66.9 ريف Camps 50.4 69.7 42.8 45.4 25.1 66.4 مخيمات Total 49.1 71.5 41.1 46.2 24.5 67.7 لمجموعا Palestine فلسطين Urban 31.0 50.0 25.7 45.9 20.6 70.6 حضر Rural 21.4 35.9 18.2 43.8 16.2 70.5 ريف Camps 41.0 60.8 34.6 44.6 21.4 68.0 مخيمات Total 30.2 48.9 25.0 45.4 19.9 70.3 لمجموعا

:PCBS 8102 الأولمسح القوى العاملة، الربع PCBS: labour Force Survey, Q1- 2018
01
،(ILOايير مع) حسب العلاقة بقوة العمل والمنطقة والجنس فلسطينسنة في ( 82-51)التوزيع النسبي للشباب : 55جدول 8152، آذار -كانون ثاني
Table 11: Percentage Distribution of Youth Aged (15-29) Years in Palestine by Labour Force Status, Region and Sex (ILO Standards), January- March, 2018
Labour Force Status
Region and Sex المنطقة والجنس
لالعلاقة بقوة العم فلسطين
Palestine
ةز ع غاطقGaza Strip
فة الغربيةضلاWest Bank
جموعملاTotal
ثإناFemales
رذكو Males
جموعملاTotal
ثإناFemales
رذكو Males
جموعملاTotal
ثإناFemales
رذكو Males
In Labour Force 41.1 18.8 62.5 42.9 24.0 61.2 40.0 15.2 63.4 العاملةداخل القوى
Outside Labour Force 58.9 81.2 37.5 57.1 76.0 38.8 60.0 84.8 36.6 خارج القوى العاملة
Total 100 100 100 100 100 100 100 100 100 المجموع
Full Employment 54.1 30.9 60.7 32.8 13.1 40.3 69.7 50.2 74.0 العمالة التامة Time Related Underemployment
2.0 1.5 2.2 2.4 1.9 2.6 1.7 1.1 1.9 مالة ناقصةع
متصلة بالوقتUnemployment 43.9 67.6 37.1 64.8 85.0 57.1 28.6 48.7 24.1 البطالة
Total 5.. 5.. 5.. 5.. 5.. 5.. 5.. 100 5.. المجموع
، (ILOايير مع)حسب الفئات العمرية والجنس فلسطينسنة فأكثر في 51 المشاركين في القوى العاملة للأفراد بينمعدل البطالة : 58جدول 8152، آذار -كانون ثاني
Table 12: Unemployment Rate of Participants in the Labour Force Aged 15 Years and Above in Palestine by Age Groups and Sex (ILO Standards), January- March, 2018
Age Groups Sex الجنس
ئات العمريةالف Males رذكو Females ثإنا Total جموع ملا
15-19 43.5 32.0 43.8 07-0.
20-24 49.6 73.3 42.4 02-0.
25-29 38.8 64.1 29.1 07-0.
30-34 29.1 57.4 20.2 .2-..
35-39 19.1 32.3 14.9 .7-..
40-44 16.2 23.7 14.1 .2-..
45-49 17.0 21.7 15.9 .7-..
50+ 13.6 12.1 13.8 72+
Total 30.2 48.9 25.0 المجموع

:PCBS 8102 الأولمسح القوى العاملة، الربع PCBS: labour Force Survey, Q1- 2018
01
، (ILOايير مع)حسب الفئات العمرية والمنطقة فلسطينسنة فأكثر في 51بين المشاركين في القوى العاملة للأفراد معدل البطالة : 53جدول 8152، آذار -كانون ثاني
Table 13: Unemployment Rate of Participants in the Labour Force Aged 15 Years and Above in Palestine by Age Groups and Region (ILO Standards), January- March, 2018
Age Groups
Region المنطقة فلسطين الفئات العمرية
Palestine ع غزةقطا
Gaza Strip فة الغربيةالض
West Bank
15-19 43.5 69.6 30.4 07-0.
20-24 49.6 69.5 33.8 02-0.
25-29 38.8 59.3 23.4 07-0.
30-34 29.1 44.3 17.9 .2-..
35-39 19.1 30.9 11.5 .7-..
40-44 16.2 33.8 7.2 .2-..
45-49 17.0 33.8 8.9 .7-..
50+ 13.6 26.5 8.1 72+
Total 30.2 49.1 18.3 المجموع
، (ILOايير مع)سنة فأكثر في فلسطين حسب سنوات الدراسة والجنس 51معدل البطالة بين المشاركين في القوى العاملة للأفراد : 54جدول
8152، آذار -كانون ثانيTable 14: Unemployment Rate of Participants in the Labour Force Aged 15 Years and Above in
Palestine by Years of Schooling and Sex (ILO Standards), January- March, 2018
Years of Schooling Sex الجنس
ت الدراسةسنوا Total جموع ملا
Males رذكو Females ثإنا
0 26.3 19.1 29.6 2
1-6 31.7 24.4 32.5 0-7
7-9 28.4 41.5 27.2 0-.
10-12 27.7 44.3 25.7 02-00
13+ 33.1 52.2 20.0 0.+
Total 30.2 48.9 25.0 المجموع

:PCBS 8102 الأولمسح القوى العاملة، الربع PCBS: labour Force Survey, Q1- 2018
01
، (ILOايير مع)سنة فأكثر في فلسطين حسب سنوات الدراسة والمنطقة 51معدل البطالة بين المشاركين في القوى العاملة للأفراد : 51جدول 8152، آذار -كانون ثاني
Table 15: Unemployment Rate of Participants in the Labour Force Aged 15 Years and Above in Palestine by Years of Schooling and Region (ILO Standards), January- March, 2018
Years of Schooling
Region المنطقة فلسطين ت الدراسةسنوا
Palestine
قطاع غزةGaza Strip
فة الغربيةالضWest Bank
0 26.3 54.7 10.4 2
1-6 31.7 45.2 23.4 0-7
7-9 28.4 52.8 16.3 0-.
10-12 27.7 49.0 16.1 02-00
13+ 33.1 48.5 20.6 0.+
Total 30.2 49.1 18.3 المجموع
،(ILOر اييمع)حسب المنطقة والجنس معدل فترة التعطل بالأشهر للأفراد العاطلين عن العمل في فلسطين: 16جدول 8152، آذار -كانون ثاني
Table 16: The Average of Unemployment Duration in Months in Palestine by Region and Sex (ILO Standards), January- March, 2018
Region
Sex الجنس جموعملا المنطقة
Total
ثإناFemales
رذكو Males
West Bank 4.7 8.9 3.0 فة الغربيةضلا Gaza Strip 19.8 25.7 16.2 ةز ع غاطق Palestine 14.2 20.5 10.9 فلسطين
لفرد منذ بدء استعداده للعمل او تركه افترة تعطل هي فترة التعطليقصد ب: ملاحظة .للعمل الأخير
Note: Unemployed period means the period of being
Unemployed since the individual was a vailable for work or leaving last work
،(ILOايير مع)سنة فأكثر من فلسطين حسب المنطقة ومكان العمل 51التوزيع النسبي للعاملين : 17جدول 8152، آذار -كانون ثاني
Table 17: Percentage Distribution of Employed Individuals Aged 15 Years and Above from Palestine by Region and Place of Work (ILO Standards), January- March, 2018
المنطقة
Place of work مكان العمل
Region نفس المنطقة Same Region
منطقة أخرى Other Region
المستعمراتإسرائيل و Israel and
Settlements المجموعTotal
West Bank ..5 0.80 .8. 0.87 الضفة الغربية
Gaza Strip ..5 - 0080 .08. قطاع غزة
Palestine ..5 ...1 5..1 6.54 فلسطين
.in tables means observations are too small (-) 8تعني عدم وجود عدد كافي من المشاهدات في الخلية (-)

:PCBS 8102 الأولمسح القوى العاملة، الربع PCBS: labour Force Survey, Q1- 2018
01
، (ILOايير مع)سنة فأكثر من فلسطين حسب النشاط الاقتصادي ومكان العمل 51ملين التوزيع النسبي للعا: 18جدول 8152، آذار -كانون ثاني
Table 18: Percentage Distribution of Employed Individuals Aged 15 Years and Above from Palestine by Economic Activity and Place of Work (ILO Standards), January- March, 2018
شاط الاقتصادينلا
Place of work مكان العمل
Economic Activity فة الغربيةضلا West Bank
ع غزةقطاGaza Strip
ائيل اسر المستعمراتو
Israel and Settlements
جموعملاTotal
Agriculture, Fishing and Forestry 6.5 7.4 6.8 6.2 الزراعة والصيد والحراجة وصيد الأسماك
Mining, Quarrying and Manufacturing 12.6 11.4 5.3 16.3 عدين والمحاجر والصناعة التحويليةتلا
Construction 16.7 65.0 4.1 12.1 ناء والتشييدبلا
Commerce, Restaurants and Hotels 21.4 12.0 20.0 24.1 جارة والمطاعم والفنادقتلا
لاتصالاتالنقل والتخزين وا 6.1 8.1 2.7 6.2 Transportation, Storage and Communication
Services and Other Branches 36.6 1.5 55.7 35.2 دمات والفروع الأخرى خلا
Total ..5 ..5 ..5 ..5 جموعملا
8152، آذار -كانون ثاني ،(ILOايير مع)سنة فأكثر من فلسطين حسب مكان العمل والمنطقة 51أعداد العاملين : 19جدول Table 19: Number of Employed Individuals Aged 15 Years and Above from Palestine by Place
of Work and Region (ILO Standards), January- March, 2018
*مكان العمل
Region المنطقةPlace of work* فة الغربيةالض
West Bank
قطاع غزةGaza Strip
فلسطينPalestine
فة الغربيةضلا 547,900 100 548,000 West Bank
ع غزةقطا -263,500 263,500 Gaza Strip
ائيلاسر 103,400 -103,400 Israel
Settlements 17,600- 17,600 المستعمرات
Total 932,500 263,600 668,900 جموعملا
.Workers abroad are excluded :(*) .لا تشمل العاملين في الخارج(: *)
.in tables means observations are too small (-) 8تعني عدم وجود عدد كافي من المشاهدات في الخلية (-)

:PCBS 8102 الأولمسح القوى العاملة، الربع PCBS: labour Force Survey, Q1- 2018
02
، (ILOايير مع)سنة فأكثر من فلسطين حسب النشاط الاقتصادي والجنس والمنطقة 51التوزيع النسبي للعاملين : 20جدول 8152آذار، -كانون ثاني
Table 20: Percentage Distribution of Employed Individuals Aged 15 Years and Above from Palestine by Economic Activity, Sex and Region (ILO Standards), January- March, 2018
النشاط الاقتصادي والجنس
Region المنطقةEconomic Activity and Sex فة الغربيةالض*
West Bank*
قطاع غزةGaza Strip
فلسطينPalestine
Males ذكور
Agriculture, Fishing and Forestry 6.6 7.1 6.4 الزراعة والصيد والحراجة وصيد الأسماك
عدين والمحاجر والصناعة التحويليةتلا 16.0 5.6 13.1 Mining, Quarrying and Manufacturing
ناء والتشييدبلا 25.7 4.9 19.8 Construction
جارة والمطاعم والفنادقتلا 23.9 22.7 23.6 Commerce, Restaurants and Hotels
Transportation, Storage and Communication 6.9 9.0 6.0 النقل والتخزين والاتصالات
دمات والفروع الأخرى خلا 22.0 50.7 30.0 Services and Other Branches
جموعملا 5.. 5.. 5.. Total
Females إناث
Agriculture, Fishing and Forestry 5.9 4.6 6.4 الزراعة والصيد والحراجة وصيد الأسماك
عدين والمحاجر والصناعة التحويليةتلا 12.4 3.7 10.1 Mining, Quarrying and Manufacturing
ناء والتشييدبلا 0.5 - 0.3 Construction
جارة والمطاعم والفنادقتلا 11.6 4.8 9.8 Commerce, Restaurants and Hotels
Transportation, Storage and Communication 2.8 2.8 2.9 النقل والتخزين والاتصالات
دمات والفروع الأخرى خلا 66.2 84.1 71.1 Services and Other Branches
جموعملا 5.. 5.. 5.. Total
Both Sexes كلا الجنسين
Agriculture, Fishing and Forestry 6.5 6.8 6.4 الزراعة والصيد والحراجة وصيد الأسماك
عدين والمحاجر والصناعة التحويليةتلا 15.4 5.3 12.6 Mining, Quarrying and Manufacturing
ناء والتشييدبلا 21.6 4.1 16.7 Construction
جارة والمطاعم والفنادقتلا 21.9 20.0 21.4 Commerce, Restaurants and Hotels
Transportation, Storage and Communication 6.2 8.1 5.5 النقل والتخزين والاتصالات
دمات والفروع الأخرى خلا 29.2 55.7 36.6 Services and Other Branches
جموعملا 5.. 5.. 5.. Total
المستعمراتل العاملين في اسرائيل و يشم*: *: Includes workers in Israel and Settlements
.in tables means observations are too small (-) 8تعني عدم وجود عدد كافي من المشاهدات في الخلية (-)
:PCBS 8102 الأولمسح القوى العاملة، الربع PCBS: labour Force Survey, Q1- 2018
09
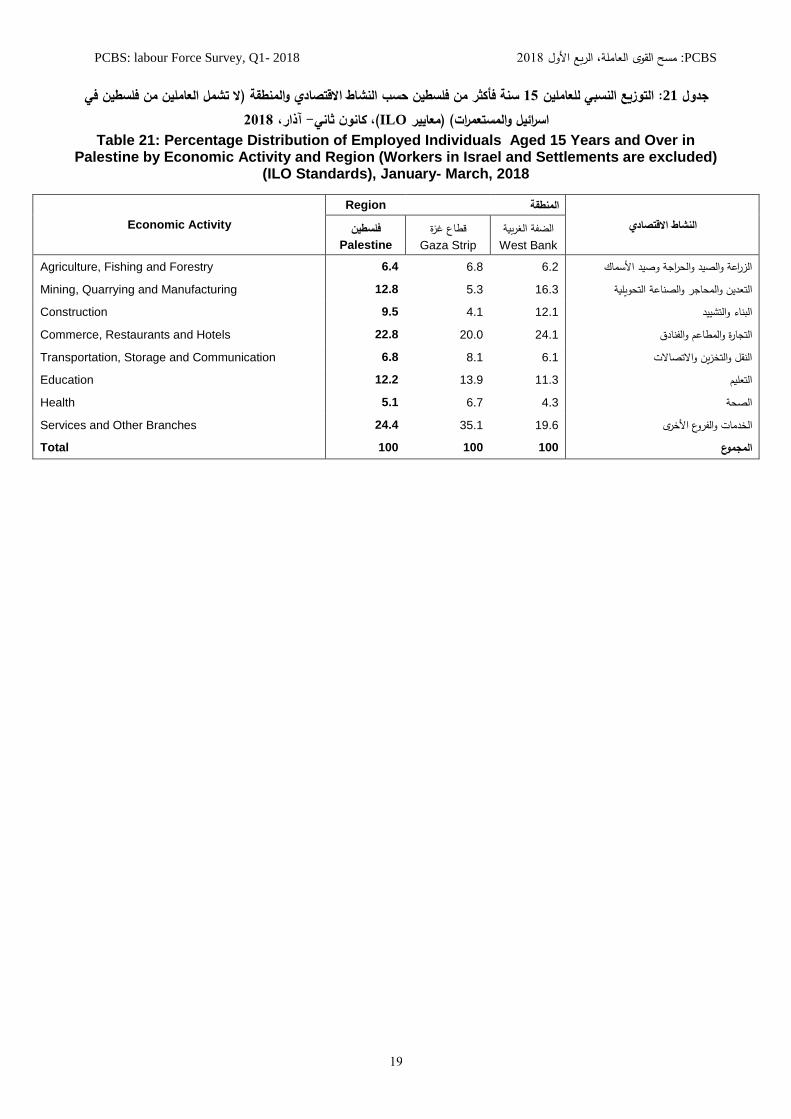
لا تشمل العاملين من فلسطين في )المنطقة و اط الاقتصادي النش سنة فأكثر من فلسطين حسب 51التوزيع النسبي للعاملين : 21جدول 8152آذار، -كانون ثاني، (ILOايير مع) (المستعمراتاسرائيل و
Table 21: Percentage Distribution of Employed Individuals Aged 15 Years and Over in Palestine by Economic Activity and Region (Workers in Israel and Settlements are excluded)
(ILO Standards), January- March, 2018
النشاط الاقتصادي
Region المنطقةEconomic Activity فة الغربيةالض
West Bank
قطاع غزةGaza Strip
فلسطينPalestine
Agriculture, Fishing and Forestry 6.4 6.8 6.2 الزراعة والصيد والحراجة وصيد الأسماك
عدين والمحاجر والصناعة التحويليةتلا 16.3 5.3 12.8 Mining, Quarrying and Manufacturing
ناء والتشييدبلا 12.1 4.1 9.5 Construction
جارة والمطاعم والفنادقتلا 24.1 20.0 22.8 Commerce, Restaurants and Hotels
Transportation, Storage and Communication 6.8 8.1 6.1 النقل والتخزين والاتصالات
Education 12.2 13.9 11.3 التعليم
Health 5.1 6.7 4.3 الصحة
Services and Other Branches 24.4 35.1 19.6 الأخرى والفروع الخدمات
جموعملا 100 100 100 Total

:PCBS 8102 الأولمسح القوى العاملة، الربع PCBS: labour Force Survey, Q1- 2018
81
، (ILOايير مع)من فلسطين حسب المنطقة والنشاط الاقتصادي والحالة العملية سنة فأكثر 51التوزيع النسبي للعاملين : 22جدول 8152آذار، -كانون ثاني
Table 22: Percentage Distribution of Employed Individuals Aged 15 Years and Above from Palestine by Region, Economic Activity and Employment Status (ILO Standards), January- March, 2018
النشاط الاقتصاديو المنطقة
Employment Status الحالة العملية
Region and Economic Activity
اب عملبر أ Employer
لون معيلحسابهم الخاصSelf
Employed
خدمون بأجرتسمWage
Employees
اء أسرة ضعأ بدون أجرUnpaid Family
Members
لمجموعاTotal
West Bank فة الغربيةالض
Agriculture, Fishing and Forestry 6.4 31.2 3.9 11.2 2.9 الزراعة والصيد والحراجة وصيد الأسماك
Mining, Quarrying and Manufacturing 15.4 11.8 15.2 15.4 19.7 عدين والمحاجر والصناعة التحويليةتلا
Construction 21.6 8.5 24.3 10.1 35.3 ناء والتشييدبلا
Commerce, Restaurants and Hotels 21.9 44.3 15.9 34.1 30.0 جارة والمطاعم والفنادقتلا
Transportation, Storage and Communication 5.5 1.4 3.2 15.9 1.3 النقل والتخزين والاتصالات
Services and Other Branches 29.2 2.8 37.5 13.3 10.8 دمات والفروع الأخرى خلا
Total ..5 ..5 ..5 ..5 ..5 جموعملا
Gaza Strip ع غزةقطا
Agriculture, Fishing and Forestry 6.8 27.1 5.1 10.6 11.3 الزراعة والصيد والحراجة وصيد الأسماك
Mining, Quarrying and Manufacturing 5.3 8.0 4.4 8.5 11.8 عدين والمحاجر والصناعة التحويليةتلا
Construction 4.1 8.0 3.7 3.8 13.0 ناء والتشييدبلا
Commerce, Restaurants and Hotels 20.0 50.9 14.5 38.6 41.3 جارة والمطاعم والفنادقتلا
Transportation, Storage and Communication 8.1 4.5 7.0 14.7 7.3 النقل والتخزين والاتصالات
Services and Other Branches 55.7 1.5 65.3 23.8 15.3 ع الأخرى دمات والفرو خلا
Total ..5 ..5 ..5 ..5 ..5 جموعملا
Palestine فلسطين
Agriculture, Fishing and Forestry 6.5 30.3 4.3 11.1 4.0 الزراعة والصيد والحراجة وصيد الأسماك
Mining, Quarrying and Manufacturing 12.6 11.0 11.8 13.8 18.7 عدين والمحاجر والصناعة التحويليةتلا
Construction 16.7 8.4 17.8 8.6 32.3 ناء والتشييدبلا
Commerce, Restaurants and Hotels 21.4 45.7 15.5 35.1 31.5 جارة والمطاعم والفنادقتلا
Transportation, Storage and Communication 6.2 2.1 4.4 15.6 2.1 النقل والتخزين والاتصالات
Services and Other Branches 36.6 2.5 46.2 15.8 11.4 دمات والفروع الأخرى خلا
Total ..5 ..5 ..5 ..5 ..5 جموعملا
.ني عدم وجود عدد كاف من المشاهدات في هذه الفئةعت(: -) -)

:PCBS 8102 الأولمسح القوى العاملة، الربع PCBS: labour Force Survey, Q1- 2018
80
لسطين حسب النشاط الاقتصادي وعدد ساعات العمل الأسبوعية سنة فأكثر من ف 51التوزيع النسبي للعاملين : 23جدول 8152آذار، -كانون ثاني، (ILOايير مع)
Table 23: Percentage Distribution of Employed Individuals from Palestine by Economic Activity and Weekly Work Hours (ILO Standards), January- March, 2018
الاقتصادي النشاط
اعات العمل الأسبوعيةس
Weekly Work Hours Economic Activity
لمجموعا +7. ..-07 .0-0Total
Agriculture, Fishing and Forestry 7.0 4.9 10.9 33.3 الزراعة والصيد والحراجة وصيد الأسماك
Mining, Quarrying and Manufacturing 13.3 14.2 8.8 13.7 التعدين والمحاجر والصناعة التحويلية
Construction 17.7 18.2 17.4 10.1 البناء والتشييد
Commerce, Restaurants and Hotels 22.8 25.4 11.4 14.2 التجارة والمطاعم والفنادق
Transportation, Storage and Communication 6.6 6.7 4.5 10.9 النقل والتخزين والاتصالات
لفروع الأخرى الخدمات وا 17.8 47.0 30.6 32.6 Services and Other Branches
Total ..5 ..5 ..5 ..5 لمجموعالا تشمل العاملين الغائبين عن أعمالهم: ملاحظة Note: Does not include absent workers
8152آذار، -كانون ثاني ،(ILOايير مع)سنة فأكثر من فلسطين حسب المهنة والمنطقة 51التوزيع النسبي للعاملين : 24جدول Table 24: Percentage Distribution of Employed Individuals Aged 15 Years and Above from Palestine
by Occupation and Region (ILO Standards), January- March, 2018
Occupation
Region المنطقة فلسطين المهنة
Palestine
غزةقطاع Gaza Strip
فة الغربيةالضWest Bank
Legislators, Senior Officials & Managers 3.8 2.5 4.3 المشرعون وموظفو الإدارة العليا Professionals, Technicians, Associates and Clerks 28.3 38.9 24.1 الفنيون والمتخصصون والمساعدون والكتبة Service, Shop & Market Workers 18.7 22.5 17.2 عمال الخدمات والباعة في الأسواق
Skilled Agricultural & Fishery Workers 3.0 2.3 3.3 العمال المهرة في الزراعة والصيد Craft and Related Trade Workers 19.0 9.8 22.6 العاملون في الحرف وما إليها من المهن Plant & Machine Operators & Assemblers 9.4 8.3 9.8 مشغلو الآلات ومجمعوها Elementary Occupations 17.8 15.7 18.7 المهن الأولية Total 5.. 5.. 5.. جموعملا

:PCBS 8102 الأولمسح القوى العاملة، الربع PCBS: labour Force Survey, Q1- 2018
88
،(ILOايير مع)سنة فأكثر من فلسطين حسب المنطقة والمهنة والمؤهل العلمي 51التوزيع النسبي للعاملين : 25جدول 8152آذار، -كانون ثاني
Table 25: Percentage Distribution of Employed Individuals Aged 15 Years and Above from Palestine by Region, Occupation and Educational Qualification (ILO Standards), January- March, 2018
Region and Occupation
Educational Qualification المؤهل العلمي
المهنةو المنطقة بكالوريوس المجموع
إعدادي فأقل ثانوي دبلوم متوسط فأعلى
Total Bachelor
and above
Associate diploma
Secondary certificate
Preparatory & less
West Bank فة الغربيةالض Legislators, Senior Officials & Managers
المشرعون وموظفو الإدارة العليا 26.5 16.2 8.0 49.3 100
Professionals, Technicians, Associates and Clerks
100 63.0 12.8 11.2 13.0 الفنيون والمتخصصون والمساعدون
والكتبةService, Shop & Market Workers 100 8.4 5.9 23.2 62.5 عمال الخدمات والباعة في الأسواق
Skilled Agricultural & Fishery Workers 100 5.5 4.8 12.0 77.7 العمال المهرة في الزراعة والصيد Craft and Related Trade Workers 100 3.3 4.4 17.1 75.2 العاملون في الحرف وما إليها من المهن Plant & Machine Operators & Assemblers
مشغلو الآلات ومجمعوها 77.3 17.7 2.3 2.7 100Elementary Occupations 100 3.4 2.4 15.6 78.6 المهن الأولية Total 100 20.6 6.3 16.3 56.8 جموعملا Gaza Strip قطاع غزة Legislators, Senior Officials & Managers
المشرعون وموظفو الإدارة العليا 11.4 8.9 10.1 69.6 100
Professionals, Technicians, Associates and Clerks
100 59.4 15.3 12.4 12.9 الفنيون والمتخصصون والمساعدون
والكتبةService, Shop & Market Workers 100 15.0 7.3 23.7 54.0 عمال الخدمات والباعة في الأسواق
Skilled Agricultural & Fishery Workers 100 2.7 3.4 16.1 77.8 العمال المهرة في الزراعة والصيد Craft and Related Trade Workers 100 3.1 3.0 14.8 79.1 العاملون في الحرف وما إليها من المهن Plant & Machine Operators & Assemblers
مشغلو الآلات ومجمعوها 62.9 26.1 5.5 5.5 100Elementary Occupations 100 5.2 5.8 16.5 72.5 المهن الأولية Total 100 29.9 9.6 17.0 43.5 جموعملا Palestine فلسطين Legislators, Senior Officials & Managers
المشرعون وموظفو الإدارة العليا 23.7 14.8 8.4 53.1 100Professionals, Technicians, Associates and Clerks
100 61.6 13.8 11.7 12.9 الفنيون والمتخصصون والمساعدون
والكتبةService, Shop & Market Workers 100 10.6 6.4 23.4 59.6 عمال الخدمات والباعة في الأسواق
Skilled Agricultural & Fishery Workers 100 4.9 4.5 12.9 77.7 العمال المهرة في الزراعة والصيد Craft and Related Trade Workers 100 3.3 4.2 16.7 75.8 نالعاملون في الحرف وما إليها من المه Plant & Machine Operators & Assemblers
امشغلو الآلات ومجمعوه 73.7 19.8 3.1 3.4 100 Elementary Occupations 100 3.8 3.3 15.8 77.1 المهن الأولية Total 100 23.2 7.2 16.5 53.1 جموعملا
:PCBS 8102 الأولمسح القوى العاملة، الربع PCBS: labour Force Survey, Q1- 2018
81
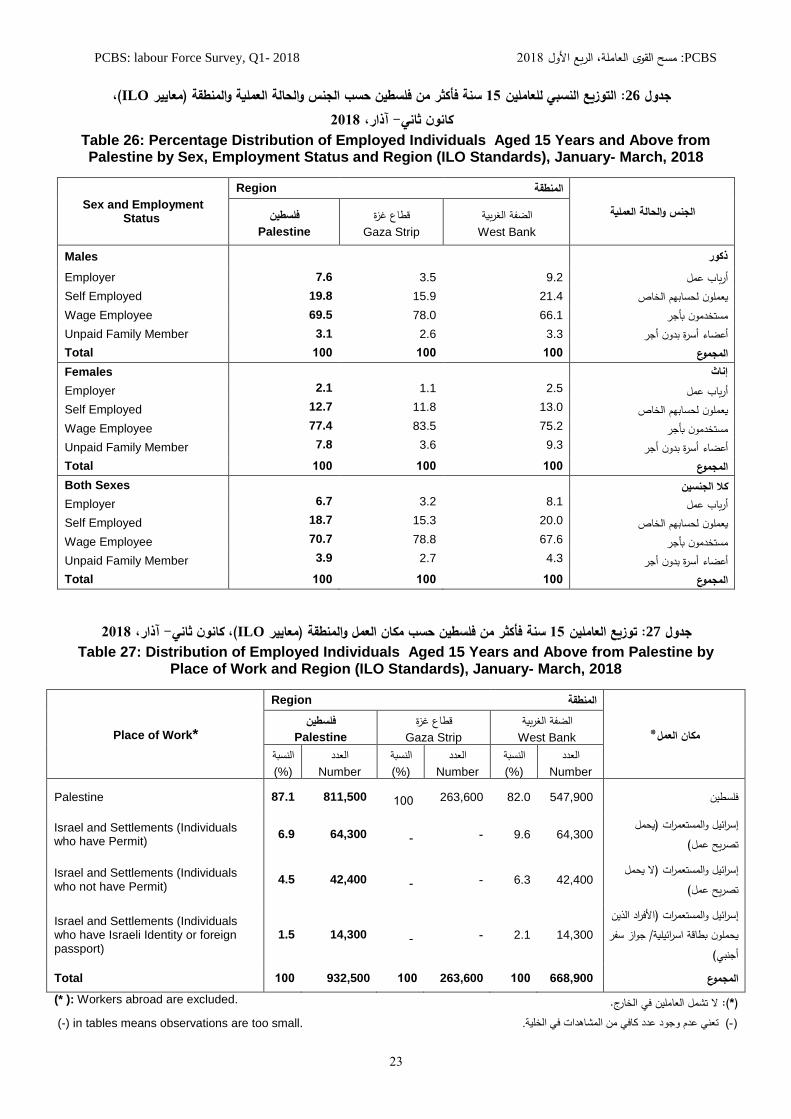
، (ILOايير مع)الحالة العملية والمنطقة سنة فأكثر من فلسطين حسب الجنس و 51التوزيع النسبي للعاملين : 26جدول 8152آذار، -كانون ثاني
Table 26: Percentage Distribution of Employed Individuals Aged 15 Years and Above from Palestine by Sex, Employment Status and Region (ILO Standards), January- March, 2018
Sex and Employment Status
Region المنطقة فلسطين الحالة العمليةو الجنس
Palestine
ع غزةقطاGaza Strip
فة الغربيةالضWest Bank
Males ذكور Employer 7.6 3.5 9.2 اب عملبر أ Self Employed 19.8 15.9 21.4 لون لحسابهم الخاصمعي
Wage Employee 69.5 78.0 66.1 خدمون بأجرتسم Unpaid Family Member 3.1 2.6 3.3 اء أسرة بدون أجرضعأ Total 5.. 5.. 5.. جموعملا Females إناث
Employer 2.1 1.1 2.5 اب عملبر أ Self Employed 12.7 11.8 13.0 لون لحسابهم الخاصمعي Wage Employee 77.4 83.5 75.2 خدمون بأجرتسم Unpaid Family Member 7.8 3.6 9.3 اء أسرة بدون أجرضعأ Total 5.. 5.. 5.. جموعملا Both Sexes كلا الجنسين Employer 6.7 3.2 8.1 اب عملبر أ
Self Employed 18.7 15.3 20.0 لون لحسابهم الخاصمعي Wage Employee 70.7 78.8 67.6 خدمون بأجرتسم Unpaid Family Member 3.9 2.7 4.3 اء أسرة بدون أجرضعأ Total 5.. 5.. 5.. جموعملا
8152آذار، -كانون ثاني، (ILOايير مع) ةسنة فأكثر من فلسطين حسب مكان العمل والمنطق 51توزيع العاملين : 27جدول Table 27: Distribution of Employed Individuals Aged 15 Years and Above from Palestine by
Place of Work and Region (ILO Standards), January- March, 2018
Place of Work*
Region المنطقة
*ن العملمكا فلسطين
Palestine
ع غزةقطاGaza Strip
فة الغربيةالضWest Bank
سبةالن(%)
ددالعNumber
سبةالن(%)
ددالعNumber
سبةالن(%)
ددالعNumber
Palestine 87.1 811,500 022 263,600 82.0 547,900 فلسطين
Israel and Settlements (Individuals who have Permit)
6.9 64,300 - - 9.6 64,300 يحمل ) المستعمراتائيل و ر سإ
(تصريح عمل
Israel and Settlements (Individuals who not have Permit)
4.5 42,400 - - 6.3 42,400 مل لا يح) المستعمراتائيل و ر سإ
(تصريح عمل
Israel and Settlements (Individuals who have Israeli Identity or foreign passport)
1.5 14,300 - - 2.1 14,300
الأفراد الذين ) المستعمراتو ائيلر سإجواز سفر / يحملون بطاقة اسرائيلية
(أجنبيTotal 5.. 932,500 5.. 263,600 5.. 668,900 جموعملا
.Workers abroad are excluded :( *) .لا تشمل العاملين في الخارج(: *)
.in tables means observations are too small (-) 8تعني عدم وجود عدد كافي من المشاهدات في الخلية (-)

:PCBS 8102 الأولمسح القوى العاملة، الربع PCBS: labour Force Survey, Q1- 2018
81
،(ILO اييرمع) سنة فأكثر من فلسطين حسب المنطقة والقطاع 51التوزيع النسبي للعاملين : 28جدول 8152آذار، -كانون ثاني
Table 28: Percentage Distribution of Employed Individuals Aged 15 Years and Above from Palestine by Region and Sector (ILO Standards), January- March, 2018
Region
Sector القطاع
المنطقةجموعملا
Total
المستعمراتائيل واسرIsrael and
Settlements
قطاعات أخرىOther
Sectors
قطاع خاصPrivate Sector
قطاع عامPublic Sector
West Bank 5.. 18.1 1.4 64.3 16.2 الضفة الغربية
Gaza Strip 5.. - 5.9 56.1 38.0 قطاع غزة
Palestine 5.. 5.5. 456 .554 445. فلسطين
.means observations are too small (-) 8من المشاهدات في الخليةتعني عدم وجود عدد كافي (-)
ب سح سنة فأكثر 51 ية ومعدل أيام العمل الشهرية ومعدل الأجرة اليومية بالشيقل للمستخدمين بأجرعو بمعدل ساعات العمل الأس: 29جدول
8152آذار، -كانون ثاني، (ILOايير مع)مكان العمل Table 29: Average Weekly Work Hours, Monthly Work Days and Daily Wage in NIS for Wage
Employees Aged 15 Years and Above by Place of Work (ILO Standards), January- March, 2018
Indicator
Place of work ن العملاكم جموعملا ؤشرملا
Total
المستعمراتائيل و اسر Israel and
Settlements
ع غزةقطاGaza Strip
فة الغربيةضلاWest Bank
Average Weekly Work Hours 41.7 42.4 36.3 44.2 ل ساعات العمل الأسبوعيةدعم Average Monthly Work Days* 22.1 20.1 22.1 22.7 ل أيام العمل الشهريةدعم* Median Daily Net Wage in NIS 100.0 250.0 40.5 100.0 سيط اليومي بالشيقلجر الو لأا Average Daily Net Wage in NIS 119.8 242.5 62.1 106.4 ل الأجرة اليومية بالشيقلدعم *: Includes usual or paid work days *: تشمل أيام العمل الإعتيادية أو الفعلية.
،(ILOايير مع)ة والقطاع معدل الأجر اليومي بالشيقل للمستخدمين بأجر من فلسطين حسب المنطق: 30جدول
8152آذار، -كانون ثاني
Table 30: Average Daily Wage in NIS for Wage Employees from Palestine by Region and Sector (ILO Standards), January- March, 2018
Region
Sector القطاع
جموعملا المنطقة Total
المستعمراتائيل و اسر Israel and
Settlements
قطاعات أخرى Other Sector
قطاع خاصPrivate Sector
*قطاع عامPublic Sector*
West Bank 141.0 242.5 141.0 98.7 120.8 فة الغربية ضلا Gaza Strip 62.1 - 108.1 34.5 94.2 ةز ع غاطق Palestine 119.8 242.5 120.5 80.1 111.1 فلسطين
Palestinian govermental sector :* طينيالقطاع الحكومي الفلس: * .means observations are too small (-) 8تعني عدم وجود عدد كافي من المشاهدات في الخلية (-)

:PCBS 8102 الأولمسح القوى العاملة، الربع PCBS: labour Force Survey, Q1- 2018
81
،(ILOايير مع)معدل الأجر اليومي بالشيقل للمستخدمين بأجر في فلسطين حسب المنطقة والجنس : 31جدول
8152آذار، -كانون ثاني
Table 31: Average Daily Wage in NIS for Wage Employees in Palestine by Region and Sex (ILO Standards), January- March, 2018
Region
Sex الجنس جموعملا المنطقة
Total
ثإناFemales
رذكو Males
)(
West Bank 106.5 92.1 110.5 فة الغربية ضلا Gaza Strip 62.1 76.8 59.3 ةز ع غاطق Palestine 91.8 88.1 92.8 فلسطين
Note: Workers in Israel and Settlements are excluded المستعمراتلا تشمل العاملين من فلسطين في اسرائيل و : ملاحظة
،(ILOايير مع)مين بأجر من فلسطين حسب النشاط الاقتصادي ومكان العمل معدل الأجر اليومي بالشيقل للمستخد: 32جدول 8152آذار، -كانون ثاني
Table 32: Average Daily Wage in NIS for Wage Employees from Palestine by Economic Activity and Place of Work (ILO Standards), January- March, 2018
Economic Activity
Place of work مكان العمل
جموعملا شاط الاقتصادينلاTotal
ائيل اسر المستعمراتو
Israel and Settlements
ع غزةقطاGaza Strip
فة الغربيةضلاWest Bank
Agriculture, Fishing and Forestry 80.6 143.4 22.0 82.4 الزراعة والصيد والحراجة وصيد الأسماك Mining, Quarrying and Manufacturing 100.6 199.4 29.3 84.8 عدين والمحاجر والصناعة التحويليةتلا Construction 200.3 272.7 37.9 113.6 ناء والتشييدبلا Commerce, Restaurants and Hotels 86.6 209.5 30.1 87.0 جارة والمطاعم والفنادقتلا Transportation, Storage & Communication 108.0 - 34.7 154.6 النقل والتخزين والاتصالات Services and Other Branches 106.2 - 86.3 117.4 دمات والفروع الأخرى خلا Total 119.8 242.5 62.1 106.4 جموعملا
.means observations are too small (-) 8تعني عدم وجود عدد كافي من المشاهدات في الخلية(-)

:PCBS 8102 الأولمسح القوى العاملة، الربع PCBS: labour Force Survey, Q1- 2018
81
،(ILOايير مع)معدل الأجر الشهري بالشيقل للمستخدمين بأجر من فلسطين حسب سنوات الخدمة والمؤهل العلمي : 33جدول 8152آذار، -كانون ثاني
Table 33: Average Monthly Wage in NIS for Wage Employees from Palestine by Length of Services in Years and Educational Qualification (ILO Standards),
January- March, 2018
Length of Services in Years
Educational Qualification المؤهل العلمي
المجموع سنوات الخدمةTotal
دبلوم فأعلى
Diploma and Above
ثانوي فأقلSecondary & Less
0-3 2,369 2,308 2,483 2-.
4-9 3,243 3,350 2,956 .-.
10+ 3,563 3,667 3,286 02+
Total 3,049 3,124 2,874 جموعملا
شيكل 55411الذين يتقاضون أجراً شهرياً أقل من *معدل الأجر الشهري بالشيقل وعدد المستخدمين بأجر في القطاع الخاص: 34جدول 8152آذار، -كانون ثانيفي فلسطين حسب المنطقة، ( الحد الأدنى للأجر)
Table 34: Average Monthly Wage in NIS and Number of Wage Employees in the Private Sector* Who Receive Less Than 1,450 NIS (Minimum Wage) in Palestine by Region,
January- March, 2018
المنطقة معدل الأجر الشهري
Average Monthly Wage NIS
عدد المستخدمين بأجرNumber of Wage
Employees Region
West Bank 36,300 1,074 الضفة الغربية
Gaza Strip 86,300 693 قطاع غزة
Palestine 122,600 808 فلسطين
والخارج المستعمراتلا يشمل العاملين في اسرائيل و : * Workers in Israel and Settlements and Abroad are excluded*:

:PCBS 8102 الأولمسح القوى العاملة، الربع PCBS: labour Force Survey, Q1- 2018
81
التوزيع النسبي للمستخدمين بأجر في القطاع الخاص في فلسطين حسب بعض المؤشرات الخاصة بامتيازات العمل والمنطقة : 35جدول 8152آذار، -كانون ثاني
Table 35: Percentage Distribution for Wage Employees in Private Sector in Palestine by Some Indicators of Work Advantages and Region, January- March, 2018
Indicator
Region المنطقة فلسطين المؤشر
Palestine
ع غزةقطاGaza Strip
فة الغربيةالضWest Bank
Distribution of Wage Employees by Nature of Work:
: توزيع المستخدمين بأجر حسب طبيعة الدوام
Permanently / Full Time 96.3 89.1 99.6 وقت كامل منتظم Part Time 0.3 0.7 0.1 عمل جزئي Temporarily / Seasonal / Casual 3.4 10.2 0.3 موسمي/ عرضي/ عمل مؤقت Total 100 100 100 وعملمجا Distribution of Wage Employees by Contract Availability:
:ود عملتوزيع المستخدمين بأجر حسب توفر عق
With Written Contract/ Limited Period 8.6 7.9 9.0 يوجد عقد عمل مكتوب لمدة محدودة With Written Contract/ Unlimited Period 18.5 16.5 19.4 يوجد عقد عمل مكتوب لمدة غير محدودة Verbal Agreement 21.5 1.8 30.6 يعمل بموجب اتفاق شفوي Without Work Contract 51.4 73.8 41.0 يعمل بدون عقد عمل Total 100 100 100 المجموع Wage Employees by Advantages Provided by Employers:
المستخدمون بأجر حسب بعض الإمتيازات التي
:يقدمها صاحب العملPercentage of Individuals who Contribute to the Pension Fund
نسبة الذين يحصلون على مساهمة في تمويل .008 .008 .4.5 مكافأة نهاية الخدمة/ التقاعد
Percentage of Individuals who Received Annual Paid Vacations
نسبة الذين يحصلون على اجازات سنوية مدفوعة 0780 0.80 .4.5
Percentage of Individuals who Received Sick Paid Vacations
نسبة الذين يحصلون على اجازات مرضية مدفوعة .078 0.87 4.54
Percentage of Women who Received Maternity Paid Leave from Employed Women
.555 ..80 .080 نسبة اللواتي يحصلن على اجازات أمومة مدفوعة
الأجر من النساء العاملات

:PCBS 8102 الأولمسح القوى العاملة، الربع PCBS: labour Force Survey, Q1- 2018
82
الانتماء للنقابات العمالية والمنطقة،و الجنس سنة فأكثر من فلسطين حسب 51التوزيع النسبي للعاملين : 36جدول 8152آذار، -كانون ثاني
Table 36: Percentage Distribution of Employed Individuals Aged 15 Years and Above from Palestine by Sex, Affiliation to Workers Vocational Union and Region,
January- March, 2018
Sex & Affiliation to Workers Union
Region المنطقة فلسطين الانتساب للنقابات العمالية و الجنس
Palestine
ع غزةقطاGaza Strip
فة الغربيةالضWest Bank
Males ذكور Affiliated to Workers\ Vocational Union 5654 .08. 008. المهنية/ ت العماليةمنتسب للنقابا Not Affiliated to Workers\ Vocational Union 5455 7.80 .080 المهنية/ غير منتسب للنقابات العمالية Total 5.. 5.. 5.. وعملمجا Females اناث Affiliated to Workers\ Vocational Union 4.54 ..87 008. المهنية/ منتسب للنقابات العمالية Not Affiliated to Workers\ Vocational Union 6.55 7287 0.87 المهنية/ غير منتسب للنقابات العمالية Total 5.. 5.. 5.. وعملمجا Both Sexes كلا الجنسين Affiliated to Workers\ Vocational Union 5454 ..82 0.8. المهنية/ منتسب للنقابات العمالية Not Affiliated to Workers\ Vocational Union 5.55 7082 .780 المهنية/ غير منتسب للنقابات العمالية Total 5.. 5.. 5.. وعملمجا
،(ILOمعايير )سنة في فلسطين حسب العلاقة بقوة العمل والمنطقة 51-51التوزيع النسبي للأطفال : 37جدول
8152آذار، -كانون ثاني Table 37: Percentage Distribution of Children Aged 10-17 Years in Palestine by Labour Force
Status and Region (ILO Definition), January- March, 2018
Labour Force Status
Region المنطقة فلسطين العلاقة بقوة العمل
Palestine
ع غزةقطاGaza Strip
فة الغربيةالضWest Bank
Employed 456 080 .80 يعمل Not Working 554 08. 080 لا يعمل Outside Labour Force 4.55 .08. .780 خارج القوى العاملة Total 5.. 5.. 5.. وعملمجا

:PCBS 8102 الأولمسح القوى العاملة، الربع PCBS: labour Force Survey, Q1- 2018
89
منطقة لواسبب البقاء خارج القوى العاملة و الجنس فلسطين حسب فيسنة فأكثر 51التوزيع النسبي للأفراد خارج القوى العاملة : 38جدول 8152آذار، -كانون ثاني، (ILOايير مع)
Table 38: Percentage Distribution of Individuals Aged 15 Years and Above who Outside Labour Force in Palestine by Sex, Reason and Region (ILO Standards),
January- March, 2018
Sex and Reason
Region ةالمنطق البقاء خارج القوى ببسو الجنس
فلسطين العاملة Palestine
ع غزةقطاGaza Strip
فة الغربيةالضWest Bank
Males ذكور Old/ illness ..56 ..8. .78. المرض/ السن ربك Housekeeping - - - نشغال بأعمال المنزللاا Studying or Training .554 708. 7080 دريبالت/ راسةدلا Others 5455 028. 0.8. اب أخرى بسأ Total 5.. 5.. 5.. وعملمجا Females اناث Old/ illness .54 028. 782 المرض/ السن ربك Housekeeping .55. 7.87 708. نشغال بأعمال المنزللاا Studying or Training 4.5. 0080 0787 التدريب/ راسةدلا Others .5. 087 080 ب أخرى ابسأ Total 5.. 5.. 5.. وعملمجا Both Sexes كلا الجنسين Old/ illness 5.55 0.8. 008. المرض/ السن ربك Housekeeping ..5. .087 .780 نشغال بأعمال المنزللاا Studying or Training ..54 ..8. .080 التدريب/ راسةدلا Others 65. .8. .8. اب أخرى بسأ Total 100 5.. 5.. وعملمجا
.in tables means observations are too small (-) 8تعني عدم وجود عدد كافي من المشاهدات في الخلية(-)
سنة فأكثر المشاركين في الأنشطة غير المدفوعة الأجر من فلسطين حسب نوع النشاط والمنطقة، 51نسبة الأفراد : 39جدول 8152آذار، -كانون ثاني
Table 39:Percentage of Individuals Aged 15 Years and above who Participated in Unpaid Activities from Palestine by Type of Unpaid Activity and Region, January- March, 2018
Type of Unpaid Activity
Region المنطقة
فلسطين نوع النشاط غير المدفوع الأجرPalestine
ع غزةقطاGaza Strip
فة الغربيةالضWest Bank
Unpaid Trainee Work .5. 280 280 متدرب غير مدفوع الأجر
Volunteer Work .5. 082 28. العمل التطوعي Own- Use Production Work 55. 08. 28. الانتاج للاستهلاك الذاتي Own- Use Providers of Service for Household 445. ..8. ..80 عمل خدماتي غير مدفوع الأجر لدى الأسرة

:PCBS 8102 الأولمسح القوى العاملة، الربع PCBS: labour Force Survey, Q1- 2018
11
سنة فأكثر المشاركين في انشطة غير المدفوعة الأجر من فلسطين حسب نوع النشاط وعدد الساعات 51التوزيع النسبي للأفراد : 40جدول 8152آذار، -كانون ثانيالاعتيادية الاسبوعية التي قضاها في النشاط والمنطقة،
Table 40:Percentage Distribution of Individuals Aged 15 Years and above who Participated in Unpaid Activities from Palestine by Type of Unpaid Activity, Number of Weakly Usual
Hours Spent in the Activity and Region, January- March, 2018
Type of Unpaid Activity and Number of Hours
Region نوع النشاط غير المدفوع الأجر وعدد المنطقة فلسطين الساعات
Palestine
ع غزةقطاGaza Strip
فة الغربيةالضWest Bank
Unpaid Trainee Work متدرب غير مدفوع الأجر 1-14 9.2 5.9 17.2 0-0. 15-24 12.9 6.3 28.5 07-0. 25-34 12.2 9.1 19.4 07-.. 35+ 65.7 78.7 34.9 .7+ Total 5.. 5.. 5.. المجموع Volunteer Work العمل التطوعي 1-14 57.6 51.5 72.0 0-0. 15-24 12.4 15.1 5.9 07-0. 25-34 10.2 10.8 9.0 07-.. 35+ 19.8 22.6 13.1 .7+ Total 5.. 5.. 5.. المجموع Own- Use Production Work الانتاج للاستهلاك الذاتي 1-14 91.3 96.3 81.7 0-0. 15-24 6.3 3.1 12.3 07-0. 25-34 1.7 0.6 3.9 07-.. 35+ .56 - 2.1 .7+ Total 5.. 5.. 5.. المجموع Own- Use Providers of Service for Household
عمل خدماتي غير مدفوع الأجر لدى الاسرة 1-14 59.2 63.8 56.3 0-0. 15-24 19.2 23.6 16.4 07-0. 25-34 11.4 7.5 13.9 07-.. 35+ 10.2 5.1 13.4 .7+ Total 5.. 5.. 5.. المجموع
.in tables means observations are too small (-) 8تعني عدم وجود عدد كافي من المشاهدات في الخلية (-)
8152آذار، -كانون ثانير في فلسطين حسب المنطقة، نسبة الاناث التي تترأس الاس: 41جدول Table 41: Percentage of Females Headed Households in Palestine by Region, January- March,
2018
المنطقة
نسبة الاناث التى تترأس الاسر
Percentage of Females Headed Households
Region
West Bank .008 فة الغربيةالض
Gaza Strip 87. ع غزةقطا
Palestine .555 فلسطين

PCBS: labour Force Survey, Q1- 2018 نPCBS : 2018مسح القوى العاملة، الربع الأول
88دورة 87دورة 86دورة 85دورة 84دورة
Q1-2017Q2-2017Q3-2017Q4-2017Q1-2018
45.645.246.343.945.4Labour Force Participation Rateنسبة القوى العاملة المشاركة
72.870.870.475.269.8Employment Rateنسبة العمالة
27.229.229.624.830.2Unemployment Rateنسبة البطالة
Percentrage of employment by Economic Activityنسبة العاملين حسب النشاط الاقتصادي
6.87.06.36.76.5Agriculture, Fishing and Forestryالزراعة والصيد والحراجة وصيد الأسماك
13.413.112.813.012.6Mining, Quarrying and Manufacturingالتعدين والمحاجر والصناعة التحويلية
16.916.418.117.216.7Constructionالبناء والتشييد
35.735.133.535.636.6Services and Other Branchesالخدمات والفروع الاخرى
Percentrage of employment by Occupationنسبة العاملين حسب المهنة
18.719.119.118.919.0Craft and Related Tradeالحرف وما إليها من المهن
19.618.819.018.217.8Elementary Occupationالمهن الأولية
13.813.112.712.213.0Employed in Israel & Settlementsنسبة العاملين في إسرائيل المستعمرات
Percentrage of employment by Employment Statusنسبة العاملين حسب الحالة العملية
6.16.26.77.06.7Employersأرباب عمل
18.319.018.818.218.7Self - Employedالعاملين لحسابهم الخاص
71.370.569.770.170.7Wage Employeesالمستخدمين بأجر
4.34.34.94.73.9Unpaid Family Membersأعضاء الأسرة بدون أجر
Average Weekly Work Hours*42.041.442.441.841.6*معدل ساعات العمل الأسبوعية
*22.222.923.123.122.5Average Monthly Work Days*معدل أيام العمل الشهرية
Median Daily Net Wage in NIS*76.976.976.980.084.6*الأجر الوسيط اليومي بالشيكل
Average Daily Net Wage in NIS*86.588.585.288.691.8*معدل الأجرة اليومية بالشيكل
:Note:ملاحظة
Workers in Israel and Settlements are excluded :*لا يشمل العاملين من فلسطين في إسرائيل والمستعمرات *:
Q :تعني الربع من السنة، فمثلًا :Q1-2017 2017 تعني الربع الأول من عام Q: Quarter, Example: Q1-2017 means: First Quarter of 2017
(ILOمعايير ) 2018-2017 التغيرات الأساسية التي طرأت على القوى العاملة في فلسطين خلال الفترة
Basic Changes in the Labour Force Indicators in Palestine During 2017- 2018 (ILO Standards)
Indicatorالمؤشر
الدورة
31

PCBS: labour Force Survey, Q1- 2018 نPCBS : 2018مسح القوى العاملة، الربع الأول
88دورة 87دورة 86دورة 85دورة 84دورة
Q1-2017Q2-2017Q3-2017Q4-2017Q1-2018
45.645.846.243.844.9Labour Force Participation Rateنسبة القوى العاملة المشاركة
81.379.781.186.481.7Employment Rateنسبة العمالة
18.720.318.913.618.3Unemployment Rateنسبة البطالة
Percentrage of employment by Economic Activityنسبة العاملين حسب النشاط الاقتصادي
7.87.86.76.96.4Agriculture, Fishing and Forestryالزراعة والصيد والحراجة وصيد الأسماك
16.415.915.715.915.4Mining, Quarrying and Manufacturingالتعدين والمحاجر والصناعة التحويلية
21.320.823.022.321.6Constructionالبناء والتشييد
27.827.326.228.129.2Services and Other Branchesالخدمات والفروع الاخرى
Percentrage of employment by Occupationنسبة العاملين حسب المهنة
22.322.922.822.722.6Craft and Related Tradeالحرف وما إليها من المهن
20.419.820.119.018.7Elementary Occupationالمهن الأولية
19.918.617.917.218.1Employed in Israel & Settlementsنسبة العاملين في إسرائيل المستعمرات
Percentrage of employment by Employment Statusنسبة العاملين حسب الحالة العملية
7.47.47.98.58.1Employersأرباب عمل
20.221.220.020.120.0Self - Employedالعاملين لحسابهم الخاص
67.566.566.666.167.6Wage Employeesالمستخدمين بأجر
4.94.95.45.34.3Unpaid Family Membersأعضاء الأسرة بدون أجر
Average Weekly Work Hours*44.443.844.444.144.2*معدل ساعات العمل الأسبوعية
*22.423.023.123.222.7Average Monthly Work Days*معدل أيام العمل الشهرية
Median Daily Net Wage in NIS*92.396.296.296.2100.0*الأجر الوسيط اليومي بالشيكل
Average Daily Net Wage in NIS*101.9104.198.9102.3106.4*معدل الأجرة اليومية بالشيكل
:Note:ملاحظة
Workers in Israel and Settlements are excluded :*لا يشمل العاملين من فلسطين في إسرائيل والمستعمرات *:
Q :تعني الربع من السنة، فمثلًا :Q1-2017 2017 تعني الربع الأول من عام Q: Quarter, Example: Q1-2017 means: First Quarter of 2017
(ILOمعايير ) 2018- 2017 التغيرات الأساسية التي طرأت على القوى العاملة في الضفة الغربية خلال الفترة
Basic Changes in the Labour Force Indicators in the West Bank During 2017- 2018 (ILO Standards)
Indicatorالمؤشر
الدورة
32

PCBS: labour Force Survey, Q1- 2018 نPCBS : 2018مسح القوى العاملة، الربع الأول
88دورة 87دورة 86دورة 85دورة 84دورة Q1-2017Q2-2017Q3-2017Q4-2017Q1-2018
45.744.346.544.046.2Labour Force Participation Rateنسبة القوى العاملة المشاركة
58.855.853.157.050.9Employment Rateنسبة العمالة
41.244.246.943.049.1Unemployment Rateنسبة البطالة
Percentrage of employment by Economic Activityنسبة العاملين حسب النشاط الاقتصادي
4.75.15.56.26.8Agriculture, Fishing and Forestryالزراعة والصيد والحراجة وصيد الأسماك
6.46.55.75.95.3Mining, Quarrying and Manufacturingالتعدين والمحاجر والصناعة التحويلية
6.95.75.94.84.1Constructionالبناء والتشييد
53.353.751.654.055.7Services and Other Branchesالخدمات والفروع الاخرى
Percentrage of employment by Occupationنسبة العاملين حسب المهنة
10.410.010.09.59.8Craft and Related Tradeالحرف وما إليها من المهن
18.416.116.616.315.7Elementary Occupationالمهن الأولية
Employed in Israel & Settlements-----نسبة العاملين في إسرائيل المستعمرات
Percentrage of employment by Employment Statusنسبة العاملين حسب الحالة العملية
3.23.33.73.43.2Employersأرباب عمل
14.113.515.613.515.3Self - Employedالعاملين لحسابهم الخاص
79.880.277.180.078.8Wage Employeesالمستخدمين بأجر
2.92.93.53.02.7Unpaid Family Membersأعضاء الأسرة بدون أجر
Average Weekly Work Hours*37.837.138.337.436.3*معدل ساعات العمل الأسبوعية
*21.922.823.022.922.1Average Monthly Work Days*معدل أيام العمل الشهرية
Median Daily Net Wage in NIS*40.040.038.540.040.5*الأجر الوسيط اليومي بالشيكل
Average Daily Net Wage in NIS*58.759.956.862.162.1*معدل الأجرة اليومية بالشيكل
:Note:ملاحظة
*: Workers in Israel and Settlements are excluded
Q :تعني الربع من السنة، فمثلًا :Q1-2017 2017 تعني الربع الأول من عام Q: Quarter, Example: Q1-2017 means: First Quarter of 2017
.in tables means observations are too small (-).تعني عدم وجود عدد كافي من المشاهدات في الخلية (-)
لا يشمل العاملين من فلسطين في إسرائيل والمستعمرات *:
(ILOمعايير ) 2018- 2017 التغيرات الأساسية التي طرأت على القوى العاملة في قطاع غزة خلال الفترة
Basic Changes in the Labour Force Indicators in Gaza Strip During 2017- 2018 (ILO Standards)
Indicatorالمؤشر
الدورة
33
Recommended