Stakeholder engagement workshop on strengthening the capacities for observation and risk assessment in
the context of loss and damage associated with climate change
Linking climate extremes and impacts via cataloguing of hazardous events
James DourisMulti-Hazard Early Warning Services Division WMO
Bonn, 29-30 October 2019
Weather • Climate • Water2
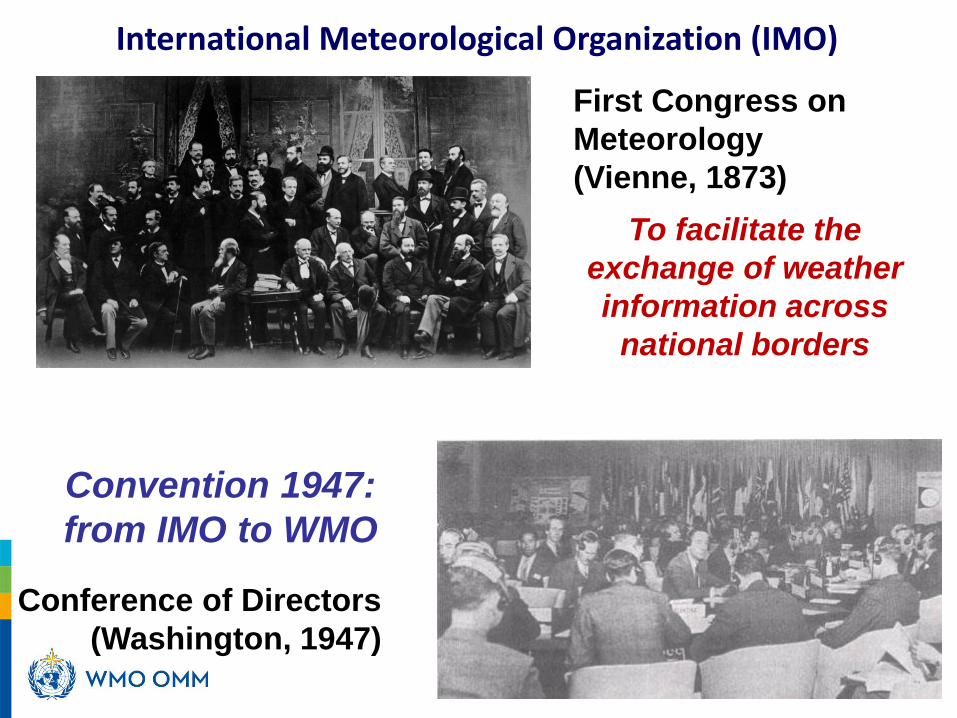
First Congress on
Meteorology
(Vienne, 1873)
Conference of Directors
(Washington, 1947)
Convention 1947:
from IMO to WMO
To facilitate the
exchange of weather
information across
national borders
International Meteorological Organization (IMO)

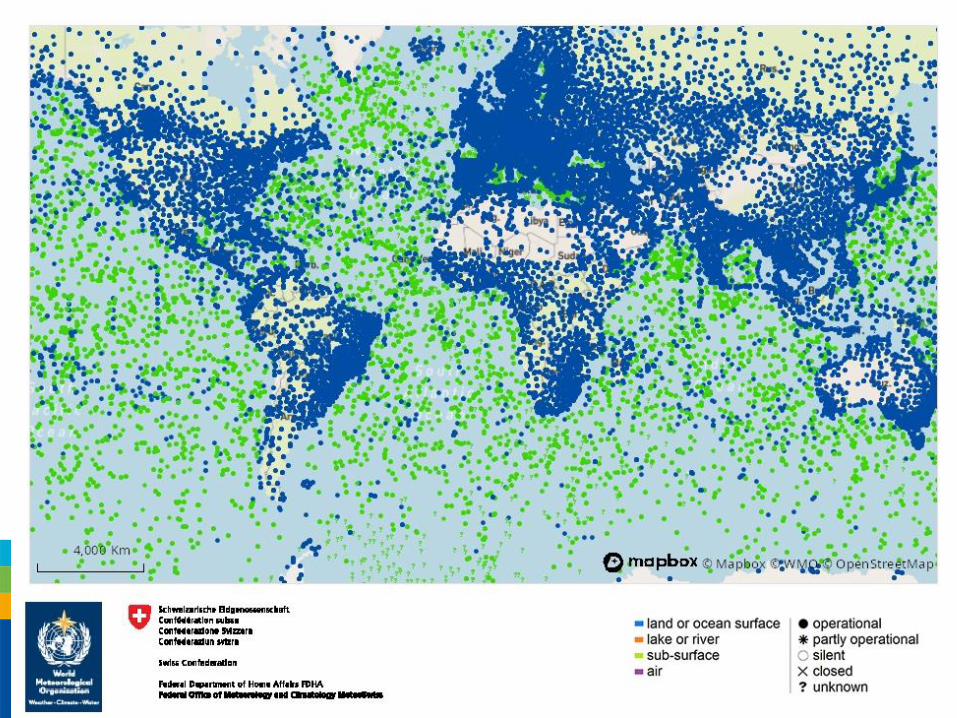
Continuously monitor weather, climate and water with systematic real time data collection and dissemination
4
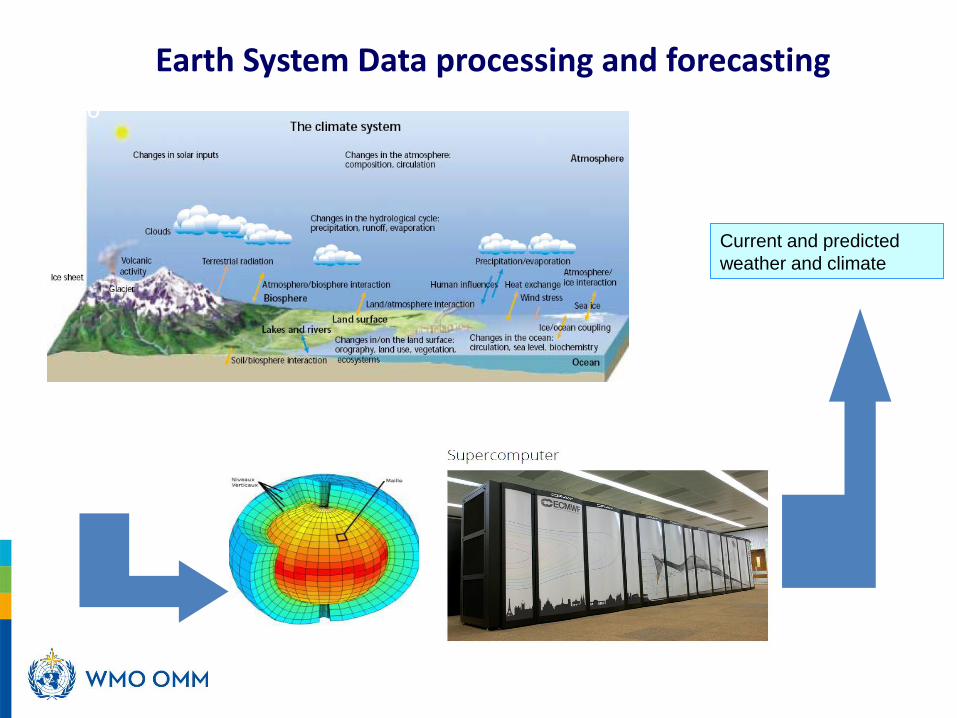
Earth System Data processing and forecasting
WMO
Current and predicted
weather and climate
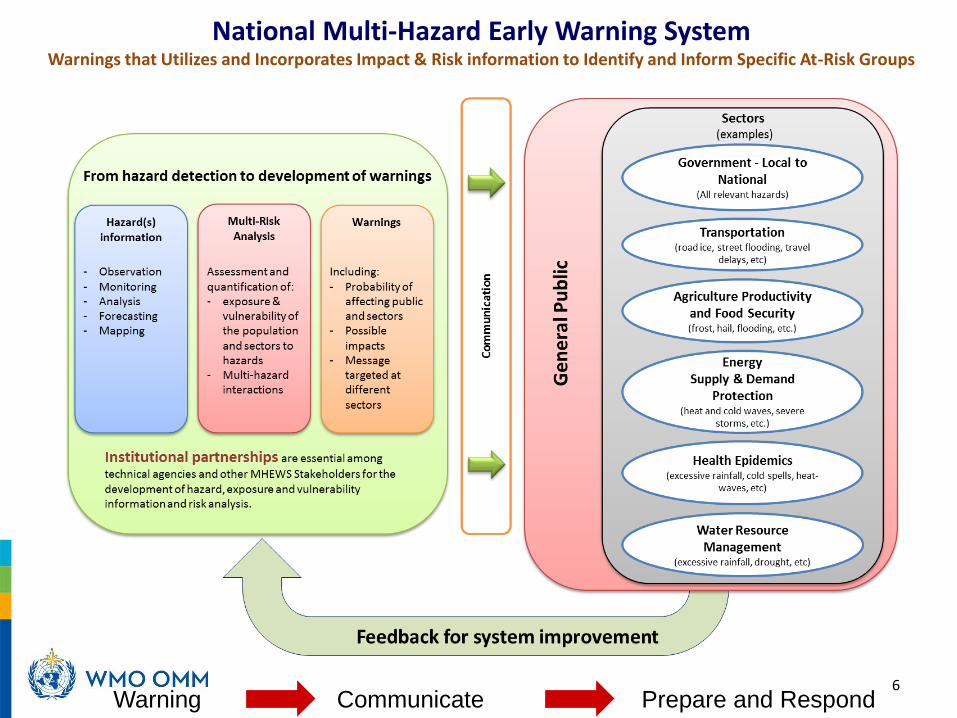
National Multi-Hazard Early Warning SystemWarnings that Utilizes and Incorporates Impact & Risk information to Identify and Inform Specific At-Risk Groups
Warning Communicate Prepare and Respond6

WMO Cataloguing of Hazardous Events” (WMO-CHE)
Cataloging of weather, climate, water and space weather events as a
standardized operational process
7

Recording Event /impact
Issue In many cases the attribution and context of a recorded loss is not accurately associated to the causal hazard.
Example:
Typhoon Haiyan
November 2013, Philippines and Vietnam
8

Weather • Climate • Water9
Characteristics
-Max wind: 230 Km / h
-Costal surges: up to 5 metres
Initial reported loss and damage-More than 6352 deaths with 1071 still
missing
- 14 millions people affected
- 850 million USD damage
How are loss and damages attributed to
the each causal hazard in a systematic
and authoritative way? (Wind, storm
surge, rain, flooding, disease outbreak,
loss of power… etc)?
How do we ensure loss and damage is
recorded for the lifespan of the hazard
(e.g. impacts from all countries
Philippines, Vietnam, SIDS)
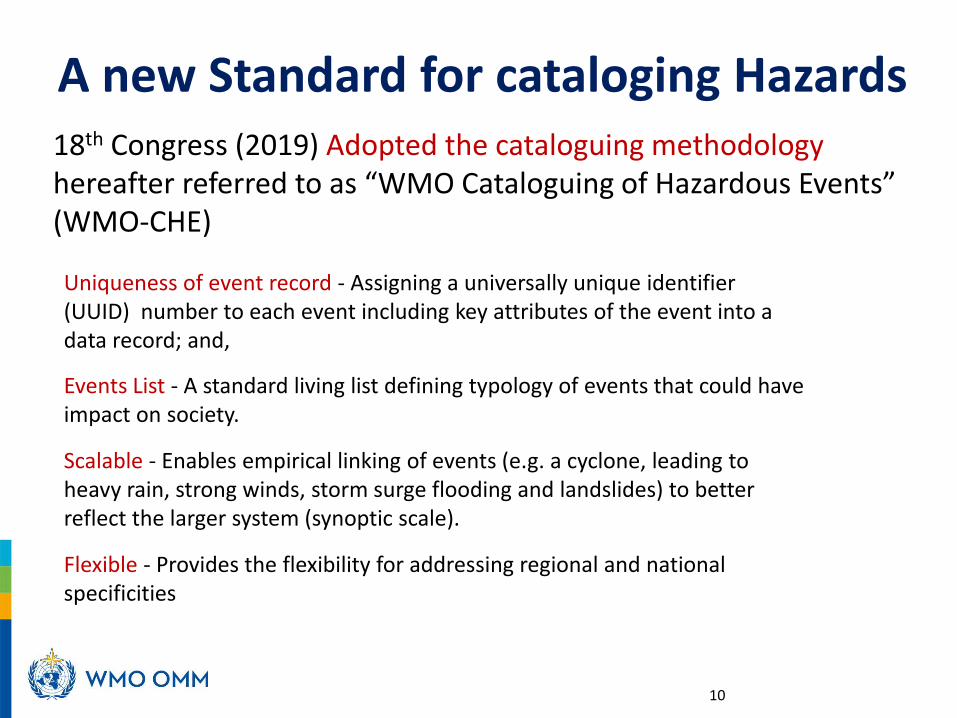
A new Standard for cataloging Hazards 18th Congress (2019) Adopted the cataloguing methodologyhereafter referred to as “WMO Cataloguing of Hazardous Events” (WMO-CHE)
10
Uniqueness of event record - Assigning a universally unique identifier (UUID) number to each event including key attributes of the event into a data record; and,
Events List - A standard living list defining typology of events that could have impact on society.
Scalable - Enables empirical linking of events (e.g. a cyclone, leading to heavy rain, strong winds, storm surge flooding and landslides) to better reflect the larger system (synoptic scale).
Flexible - Provides the flexibility for addressing regional and national specificities

Principles of the cataloging methodology
a. Simple and feasible considering the costs, resource and time to implement
b. Preserve the right of each country to state how they choose to record and warn for hazards
c. Do not categorize hazards or events into groups (e.g. , meteorological, hydrological, climate)
d. Do not quantify and qualify hazard definition or express its severity (e.g. extreme, heavy, high)
e. Align to the Common Alert Protocol (CAP) for warnings to avoid duplication, confusion and misinterpretation
11
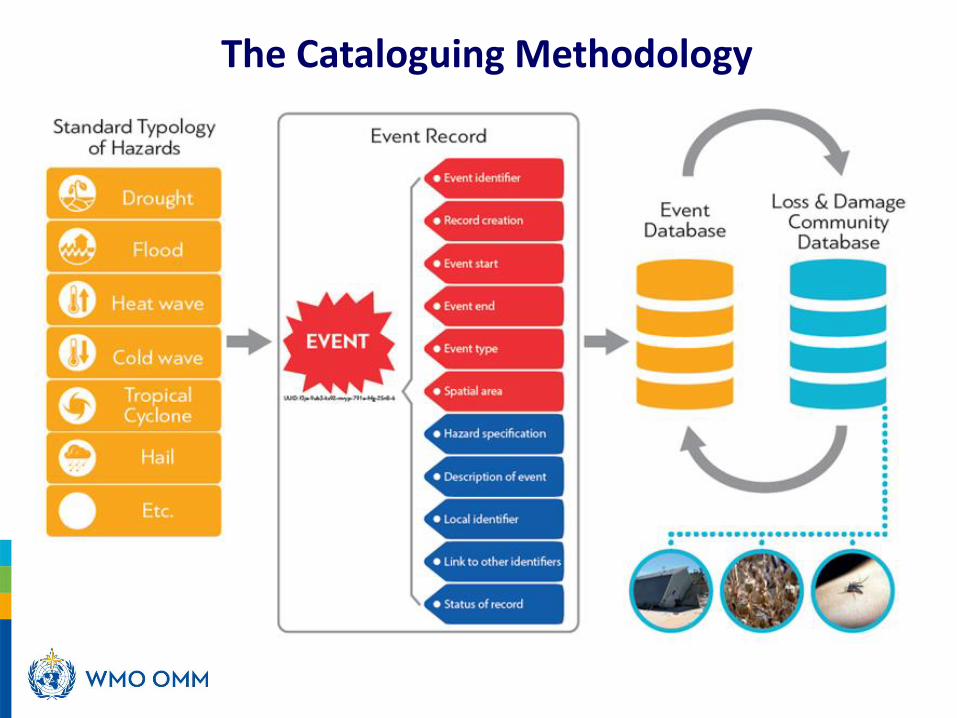
The Cataloguing Methodology
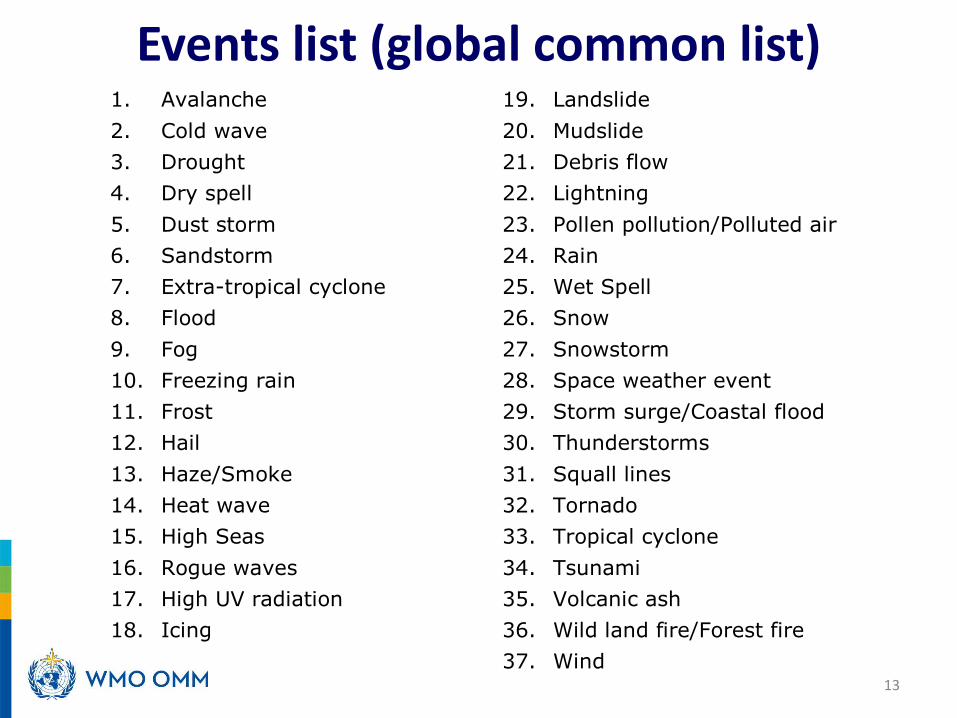
Events list (global common list)1. Avalanche
2. Cold wave
3. Drought
4. Dry spell
5. Dust storm
6. Sandstorm
7. Extra-tropical cyclone
8. Flood
9. Fog
10. Freezing rain
11. Frost
12. Hail
13. Haze/Smoke
14. Heat wave
15. High Seas
16. Rogue waves
17. High UV radiation
18. Icing
19. Landslide
20. Mudslide
21. Debris flow
22. Lightning
23. Pollen pollution/Polluted air
24. Rain
25. Wet Spell
26. Snow
27. Snowstorm
28. Space weather event
29. Storm surge/Coastal flood
30. Thunderstorms
31. Squall lines
32. Tornado
33. Tropical cyclone
34. Tsunami
35. Volcanic ash
36. Wild land fire/Forest fire
37. Wind
13

Cascading Event RecordsEvent UUID: random string of 32 characters
National
(e.g. Germany)
Regional(e.g. Europe)
Storm (Lothar)
Heavy rain
Flooding
3b3a30ec-03f3-445d-8f86-76cb5447e9ee
114bd279-dde4-48c9-b20d-db1c967bfa4c
f3df3f02-7574-4ffe-beea-021af820bc47
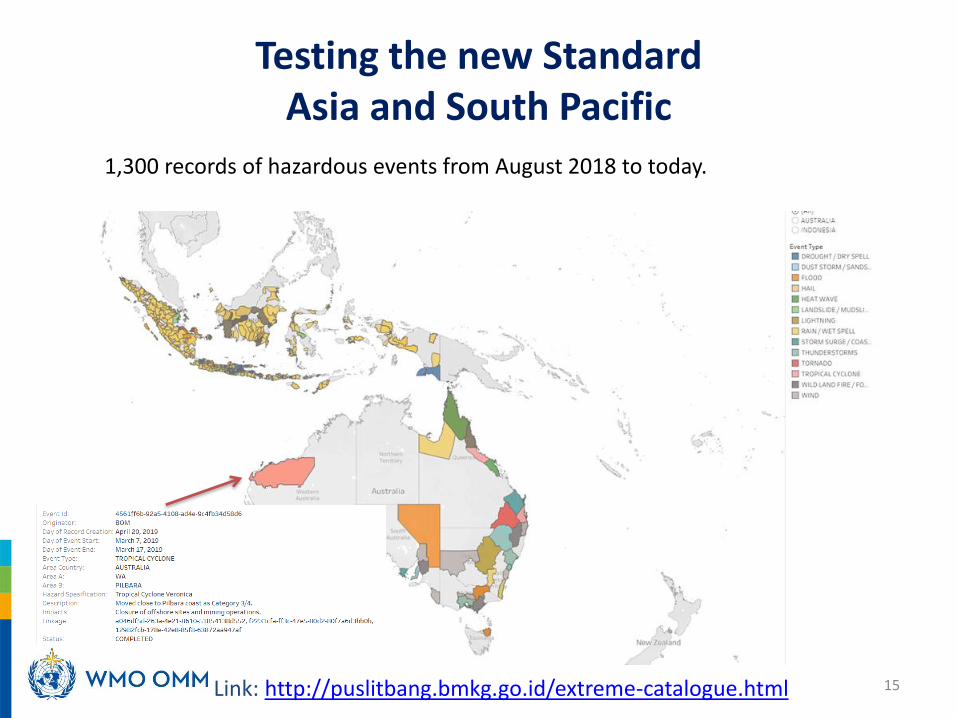
Testing the new StandardAsia and South Pacific
1,300 records of hazardous events from August 2018 to today.
Link: http://puslitbang.bmkg.go.id/extreme-catalogue.html 15
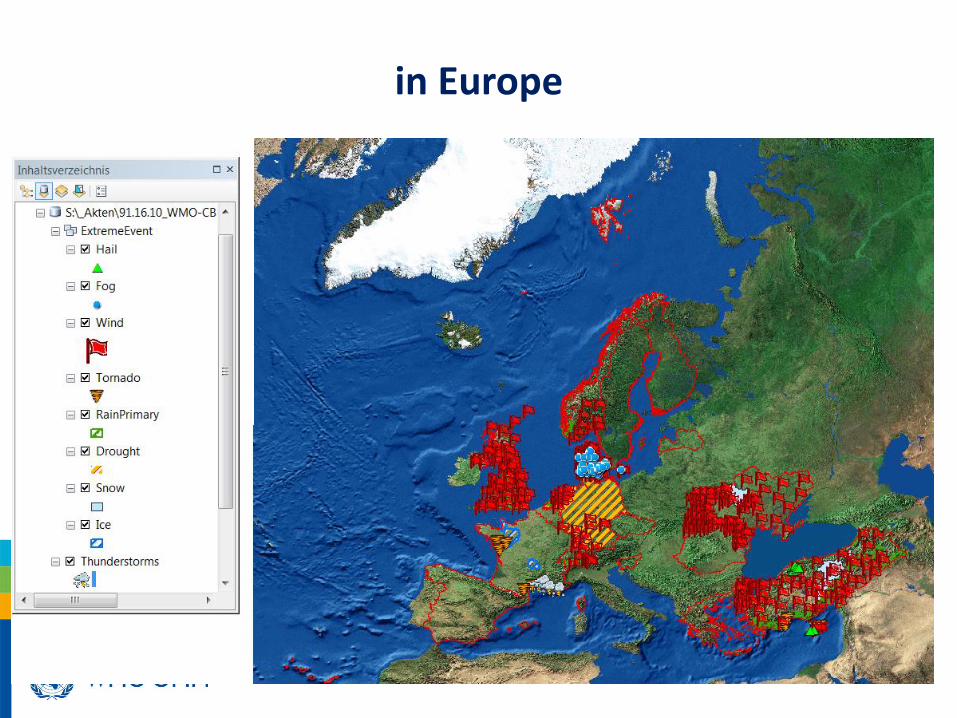
in Europe

Layering of Information Enables New Possibilities for Analysis and Application
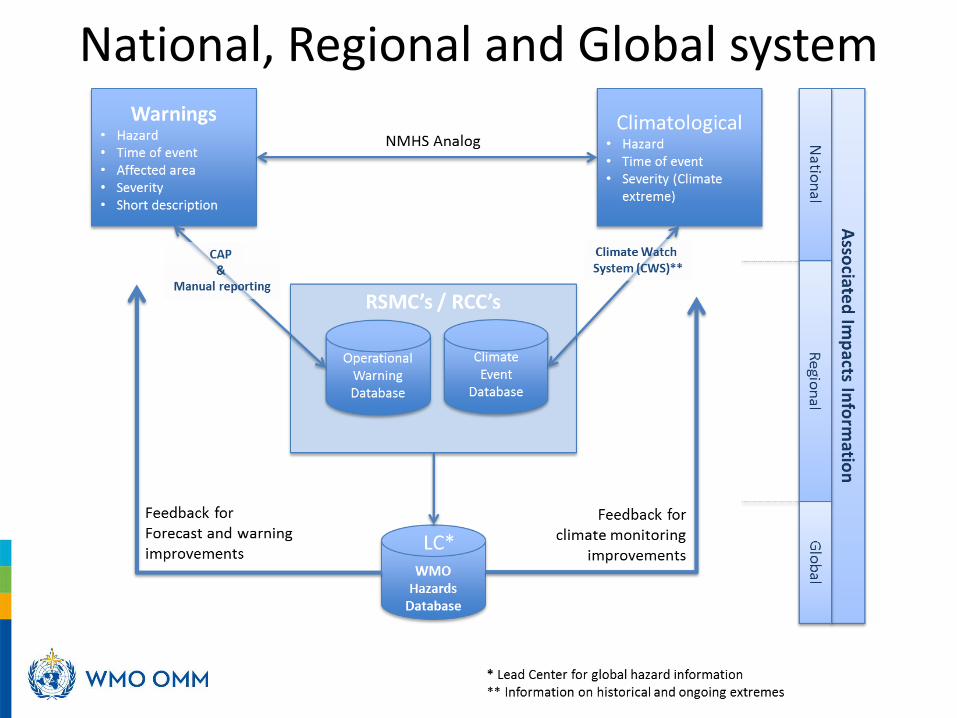
National, Regional and Global system
NMHS use cases for disaster loss data
What quality and disaggregated loss and damage data and information would improve:
• Forecast and warning products: Impact based forecasting and inclusion of potential impacts by empirical methodologies during the forecast production process
• Forecast verification processes
• Understanding of the impacts of hazards and especially for slow onset, cascading and complex hazard impacts
19

Example of applications
• Tracking global policy indicators ( Sendai, Paris Agreement, UN-SDG and a contribution to the Warsaw Implementation Mechanism for Loss and Damage)
• Risk management (public and private sector)– Risk identification (hazard component, empirical methodology of
understanding hazards, how hazards interact with other hazards and their combined impacts)
– Risk reduction (e.g. empirical methodology to quantify past events as input to developing building standards, land use planning, strengthening MHEWS and disaster planning )
– Risk transfer (insurance, risk facilities, cat bonds)
• Research– Tracking event trends in event frequency, severity and distribution– On causal contributions of hazards, exposure and vulnerability to
losses
20

21
Next Steps…• Development of an implementation plan and related guidance
products for countries and regions (in 2020)➢ Leveraging experiences in countries and regions that have
started implementation➢ Strengthening the data partnership between the national
loss and damage stakeholders (i.e. disaster risk management authority) and the NMHSs
➢ Developing national / regional process for recording, post processing and quality control.
• Further implementation in the South West Pacific and Europe and other regions including South America, Africa, North America… (2020 – 2024)
• Integrating cataloging workflow into the WMO regulatory documents (i.e. manual on GDPFS) and observer and forecaster core competencies.
• Establishing regular review and update process of the WMO Event List
Thank you
22
Additional Slides
23
Recommended