8/17/2019 Spwla 2011 Cement Wireline Logs in Deepwater Environment
http://slidepdf.com/reader/full/spwla-2011-cement-wireline-logs-in-deepwater-environment 1/15
SPWLA 52 nd Annual Logging Symposium, May 14-18, 2011
1
Case Studies in Evaluation of Cement with Wireline Logs in a Deep WaterEnvironment
Hayden, R., Schlumberger; Russell., C., ENI US Operating Co. Inc.; Vereide, A.; Babasick, P.;Shaposhnikov, P.; May, D., Schlumberger
Society of Petrophysicists and Well Log Analysts
Copyright 2011, held jointly by the Society of Petrophysicists and Well LogAnalysts (SPWLA) and the submitting authors
This paper was prepared for presentation at the SPWLA 52nd Annual LoggingSymposium held in Colorado Springs, Co, USA, May 14-18, 2011.
ABSTRACT
The evaluation of cement placement and zonal isolationin deep water environments is increasingly challenging.Traditional wireline evaluation methods rely oncontrasting attenuation rates of sonic or ultrasonicwaves to discriminate between cement and fluid behind
pipe. In today‟s deepwater environment, heavysynthetic based drilling fluids can have properties thatrender the evaluation of the typical lightweight cementsextremely difficult. In addition, cement evaluation logsare often run within 48 hours of pumping the cementwhich results in lower acoustic impedance at the time
of logging. This further reduces the contrast in acousticimpedance between the cement and heavy synthetic
based muds that are used in this environment. As aresult, traditional cement evaluation logs can beambiguous and difficult to interpret which has led toindustry suspicion regarding the application of thesemeasurements. A recently developed ultrasonicmeasurement called flexural attenuation combined withtraditional measurements addresses these uncertainties,and results in more accurate cement evaluation underthese difficult conditions.
This paper focuses on the practical application andinterpretation of this recently developed measurementand will detail case studies from Gulf of Mexicooffshore wells comparing results from traditionalCBL/VDL and ultrasonic measurements, with methodsthat include the utilization of flexural attenuation. The
physics of measurement and limitations of eachmeasurement are reviewed and a workflow is presentedto integrate all of the data to provide quantitativecement evaluation. Examples are used to illustrate the
reduction in uncertainty that can be achieved using thisworkflow and the combination of these measurementsleading to a more definitive determination of zonalisolation.
INTRODUCTION
After the first question “Where is the cement and howgood is it?” the second most common ques tion that isasked of the log analyst who does cement evaluation is,“How sure are you?” . That little „How sure are you? ‟
part offers more than enough subject matter for another paper but here we‟ll discuss some of the uncertaintiesin cement evaluation and the application of newtechnology and interpretation techniques to reducethose uncertainties.
The evaluation of cement quality with acousticmeasurements dates back to the late 1950‟s when thefirst CBL, (cement bond log), technology wasintroduced. Early tools utilized a single transmitter andtwo receivers spaced at 3ft. and 5ft., a spacingconvention which continues even today for standardCBL tools. An article in the first SPWLA Log Analyst -Vol. 1 No. 1 published in 1960 described this „new‟technology and included the following quote, “N owwhen your calculated oil zone comes in water, you can
prove it is a channel job”. The article even stated thatthe price of the new log would be 6 cents per foot.
It was a stretch to say that these early amplitude basedCBL tools could prove there was (or was not) achannel, but at least techniques were developed to
provide qualitative interpretation of channeling.Unfortunately, the list of uncertainties inherent withthese techniques is long and the basic lack of azimuthalsensitivity limited their effectiveness. Still, thetechnology offered a big improvement in cementevaluation capability compared to earlier techniques
8/17/2019 Spwla 2011 Cement Wireline Logs in Deepwater Environment
http://slidepdf.com/reader/full/spwla-2011-cement-wireline-logs-in-deepwater-environment 2/15
8/17/2019 Spwla 2011 Cement Wireline Logs in Deepwater Environment
http://slidepdf.com/reader/full/spwla-2011-cement-wireline-logs-in-deepwater-environment 3/15
SPWLA 52 nd Annual Logging Symposium, May 14-18, 2011
3
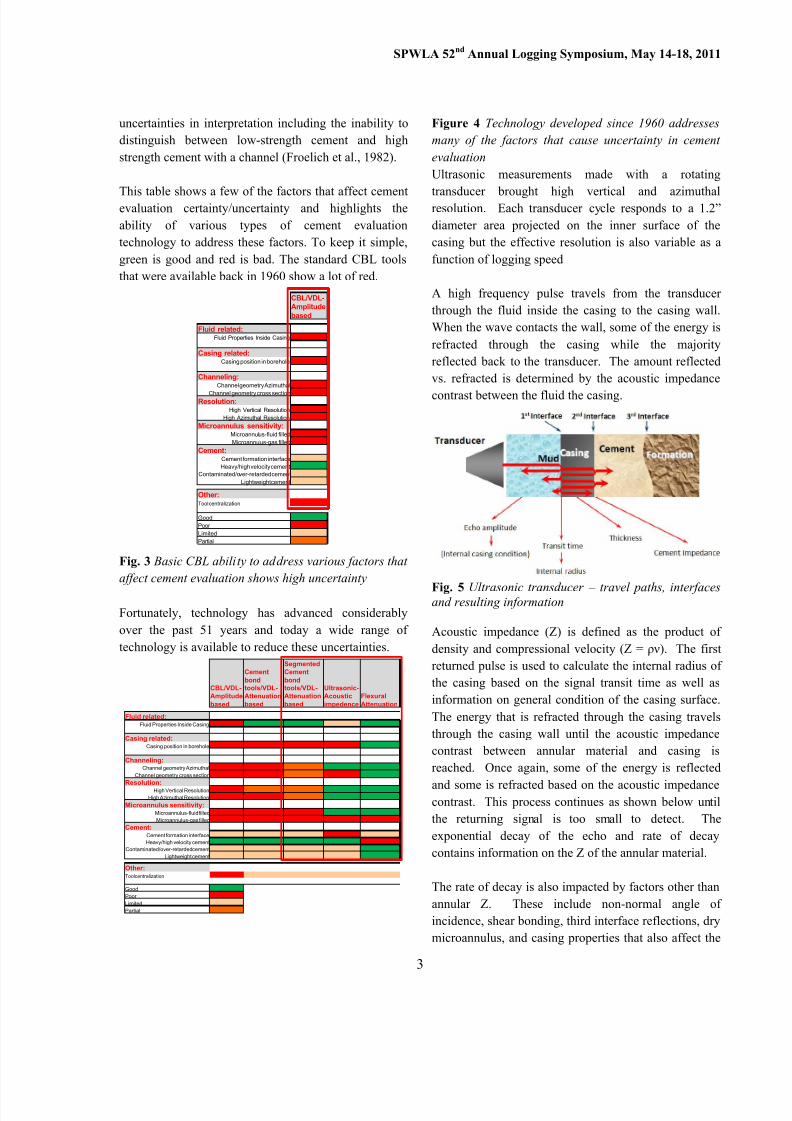
uncertainties in interpretation including the inability todistinguish between low-strength cement and highstrength cement with a channel (Froelich et al., 1982).
This table shows a few of the factors that affect cementevaluation certainty/uncertainty and highlights theability of various types of cement evaluationtechnology to address these factors. To keep it simple,green is good and red is bad. The standard CBL toolsthat were available back in 1960 show a lot of red.
Fig. 3 Basic CBL abili ty to address various factors thataffect cement evaluation shows high uncertainty
Fortunately, technology has advanced considerablyover the past 51 years and today a wide range oftechnology is available to reduce these uncertainties.
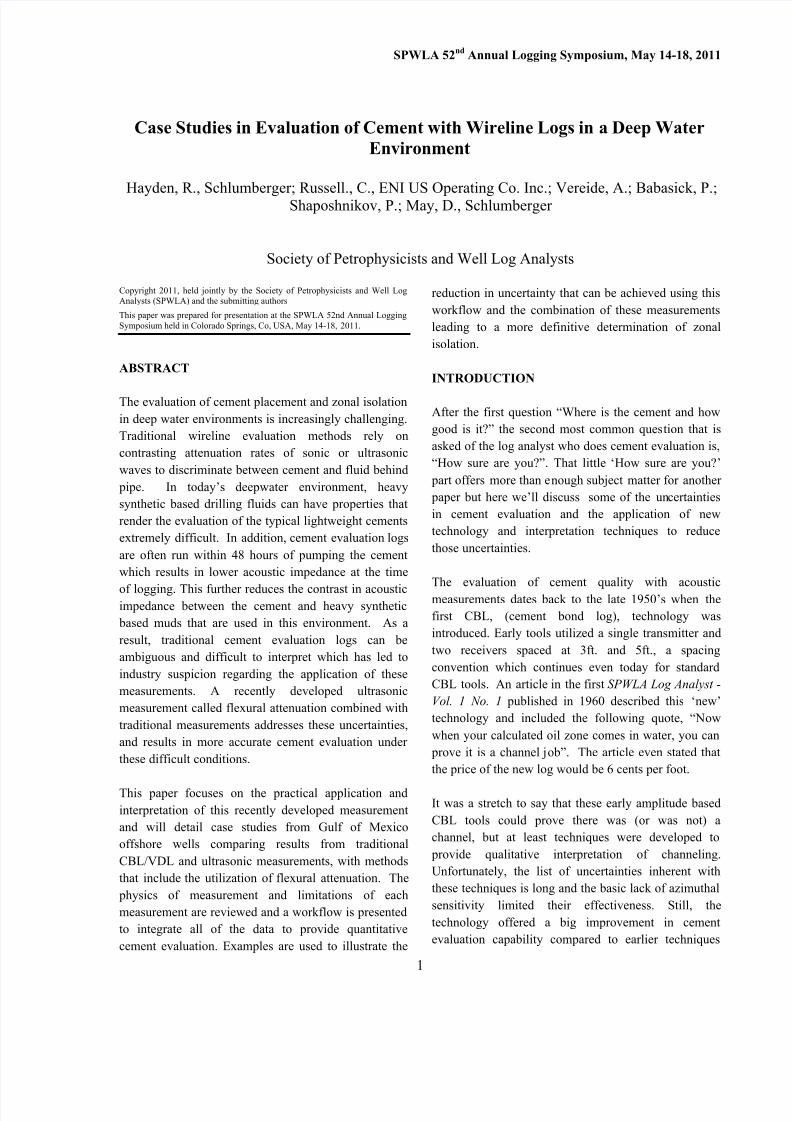
Figure 4 Technology developed since 1960 addressesmany of the factors that cause uncertainty in cementevaluationUltrasonic measurements made with a rotating
transducer brought high vertical and azimuthalresolution. Each transducer cycle responds to a 1.2”diameter area projected on the inner surface of thecasing but the effective resolution is also variable as afunction of logging speed
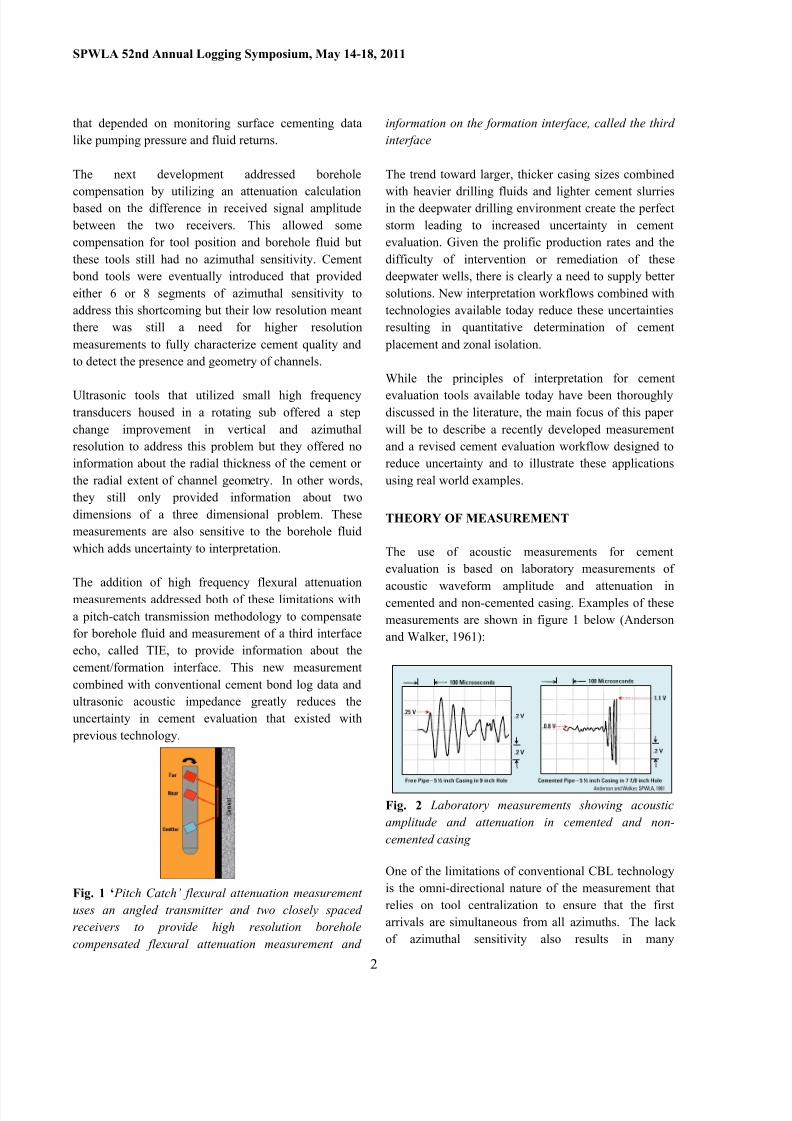
A high frequency pulse travels from the transducerthrough the fluid inside the casing to the casing wall.When the wave contacts the wall, some of the energy isrefracted through the casing while the majorityreflected back to the transducer. The amount reflectedvs. refracted is determined by the acoustic impedance
contrast between the fluid the casing.
Fig. 5 Ultrasonic transducer – travel paths, interfacesand resulting information
Acoustic impedance (Z) is defined as the product ofdensity and compressional velocity (Z = ρν). The firstreturned pulse is used to calculate the internal radius ofthe casing based on the signal transit time as well asinformation on general condition of the casing surface.The energy that is refracted through the casing travelsthrough the casing wall until the acoustic impedancecontrast between annular material and casing isreached. Once again, some of the energy is reflected
and some is refracted based on the acoustic impedancecontrast. This process continues as shown below untilthe returning signal is too small to detect. Theexponential decay of the echo and rate of decaycontains information on the Z of the annular material.
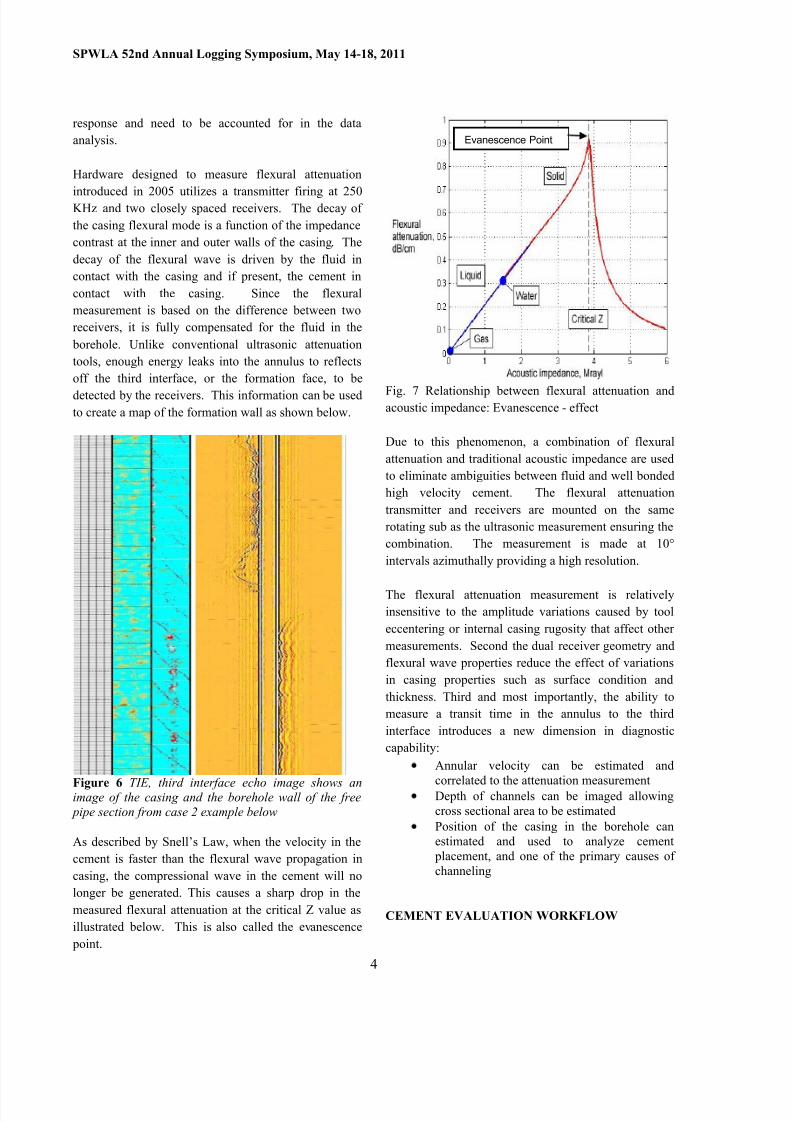
The rate of decay is also impacted by factors other thanannular Z. These include non-normal angle ofincidence, shear bonding, third interface reflections, drymicroannulus, and casing properties that also affect the
CBL/VDL-Amplitudebased
Fluid related:Fluid Properties Inside Casing
Casing related:Casing position in borehole
Channeling:Channel geometry Azimuthal
Channel geometry cross sectionResolution:
High Vertical ResolutionHigh Azimuthal Resolution
Microannulus sensitivity:Microannulus-fluid filledMicroannulus-gas filled
Cement:Cement formation interfaceHeavy/high velocity cement
Contaminated/over-retarded cementLightweight cement
Other:Tool centralization
GoodPoor LimitedPartial
CBL/VDL-Amplitudebased
Cementbondtools/VDL-Attenuationbased
SegmentedCementbondtools/VDL-Attenuationbased
Ultrasonic-Acousticimpedence
FlexuralAttenuation
Fluid related:Fluid Properties Inside Casing
Casing related:Casing position in borehole
Channeling:Channel geometry Azimuthal
Channel geometry cross section
Resolution:High Vertical ResolutionHigh Azimuthal Resolution
Microannulus sensitivity:Microannulus-fluid filledMicroannulus-gas filled
Cement:Cement formation interfaceHeavy/high velocity cement
Contaminated/over-retarded cementLightweight cement
Other:Tool centralization
GoodPoor LimitedPartial
8/17/2019 Spwla 2011 Cement Wireline Logs in Deepwater Environment
http://slidepdf.com/reader/full/spwla-2011-cement-wireline-logs-in-deepwater-environment 4/15
8/17/2019 Spwla 2011 Cement Wireline Logs in Deepwater Environment
http://slidepdf.com/reader/full/spwla-2011-cement-wireline-logs-in-deepwater-environment 5/15
8/17/2019 Spwla 2011 Cement Wireline Logs in Deepwater Environment
http://slidepdf.com/reader/full/spwla-2011-cement-wireline-logs-in-deepwater-environment 6/15
SPWLA 52nd Annual Logging Symposium, May 14-18, 2011
6
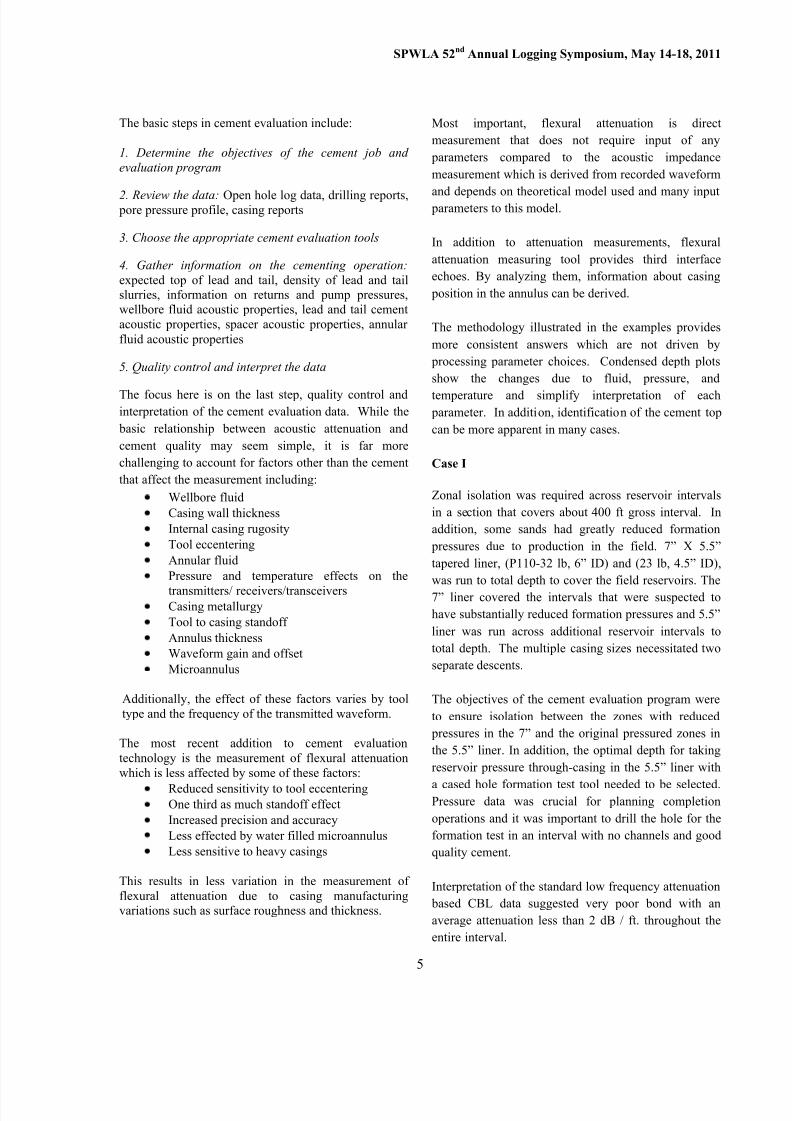
Fig. 8 Attenuation based CBL field shows very littlecontrast and less than 2 db/ft attenuation over theentire interval, bond index calculates less than 15%
A close look at the attenuation and bond indexhighlights the problem; there is no contrast on theconventional CBL log. Where is the cement? Do wehave zonal isolation? Much less, what is the certainty ofany cement evaluation? Without additional data we arelimited to guessing.
An experienced log analyst might identify the top ofcement correctly using this expanded plot of CBLattenuation, but the interpretation still leaves several
possible choices and there are anomalies in the data thatare impossible to explain in the absence of additionaldata. Even if we assume that there is good cementsomewhere in the interval, and that would be a very bigassumption, it is impossible to tell if there is good zonal
isolation for the formation test or subsequentcompletion operations.
Fig. 9 Plot of the CBL attenuation shows more than one possible top of cement as well as other anomalies thatcan ’ t be explained without additional data
The VDL showed casing arrivals and collar chevronsthroughout the section suggesting poor cement quality.It was difficult to identify the top of cement on the rawlogs, but a best estimate was approximately 110‟ belowthe top of the cross over where there was a shift in theVDL and a vague appearance of formation arrivals.
Fig. 10 Attenuation based CBL field log does not read free pipe, but interpretation is impossible due to lowcontrast in between free and cemented pipe
Confidence in the top of cement interpretationimproved slightly when it was supported by the
Case I
XX1 Sand
XX3 Sand
XX2 Sand
XX4 SandC
CBL Attenuation < 2 db/ft
DATN-0DATN-20
CBL Attenuation / Bond index
C
Free pipe Attenuation ?
Top of Cement??
XX1 Sand
XX3 Sand
XX2 Sand
XX4 Sand
XX1 Sand
XX3 Sand
XX2 Sand
XX4 SandC
8/17/2019 Spwla 2011 Cement Wireline Logs in Deepwater Environment
http://slidepdf.com/reader/full/spwla-2011-cement-wireline-logs-in-deepwater-environment 7/15
SPWLA 52 nd Annual Logging Symposium, May 14-18, 2011
7
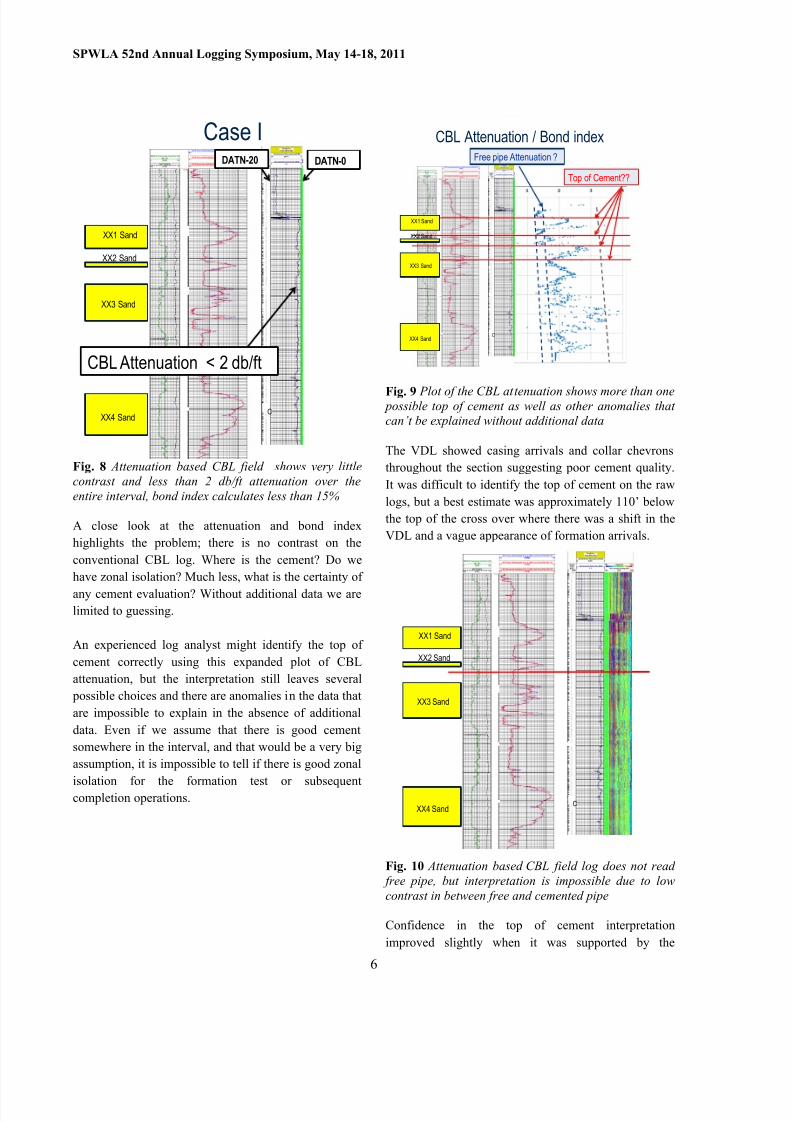
acoustic impedance map that showed a small increase atthe same depth.
Fig.11 The ultrasonic acoustic impedance image on the field log shows some indication of cement, butconfidence remains low due to very low contrast from
free pipe to cemented pipe
Closer scrutiny using a condensed plot of the minimumultrasonic impedance shows some indication of the topof cement, but once again, the wide variation in free
pipe acoustic impedance combined with low contrastfrom the cemented section makes evaluation of cementquality and zonal isolation highly uncertain.
Fig. 12 A plot of the minimum acoustic impedance with projected free pipe attenuation range through thecemented section shows a wide variation of attenuationin free pipe and little contrast between free pipe andcemented pipe
When the minimum acoustic impedance falls into thefree pipe range below the cement top, it should indicatechanneling or poor cement but unfortunately as iscommon in the deepwater environment, lightweightcement combined with heavy wall pipe and heavy
borehole fluid reduce the contrast between free pipe andcemented pipe. This results in an overlap of the free
pipe range and the cemented pipe range. Variations in pipe thickness and irregularities on the inner surfacefrom the manufacturing processes add noise to themeasurement and the width of the free pipe attenuationrange increases to make it impossible to differentiate
between free and cemented pipe.
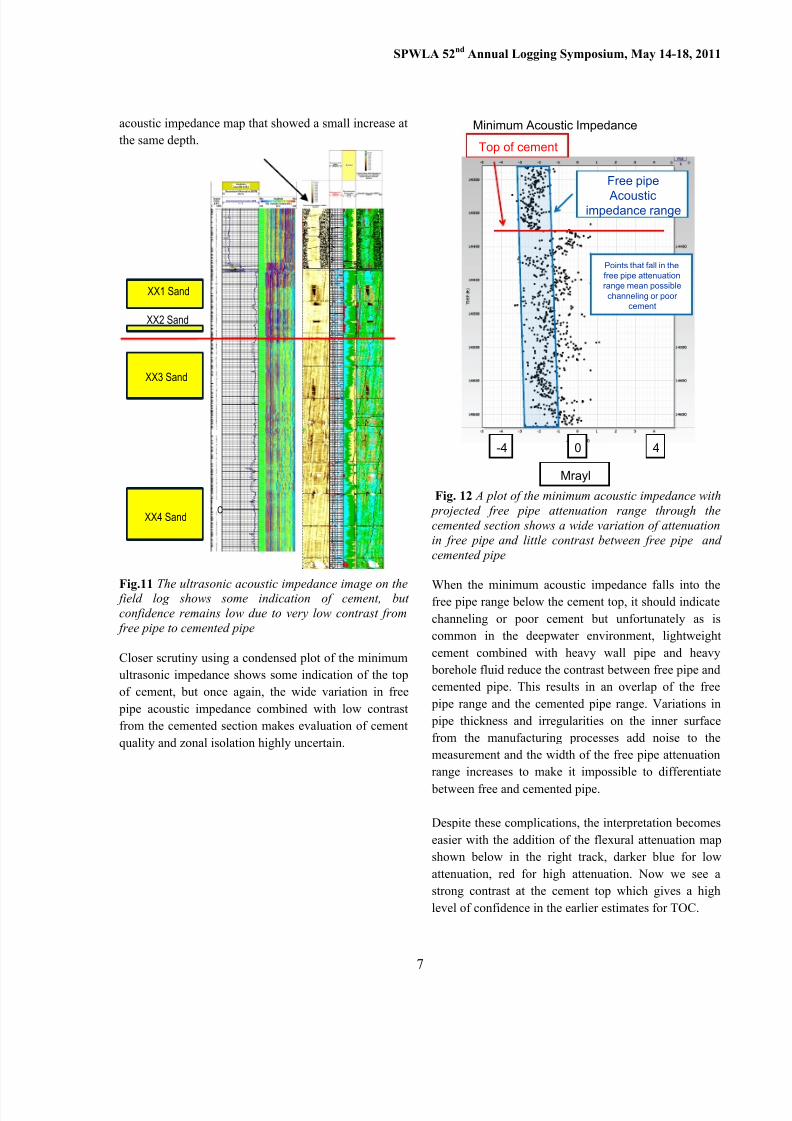
Despite these complications, the interpretation becomeseasier with the addition of the flexural attenuation mapshown below in the right track, darker blue for lowattenuation, red for high attenuation. Now we see astrong contrast at the cement top which gives a highlevel of confidence in the earlier estimates for TOC.
XX1 Sand
XX3 Sand
XX2 Sand
XX4 SandC
Minimum Acoustic Impedance
Free pipe
Acousticimpedance range
Top of cement
Points that fall in thefree pipe attenuationrange mean possible
channeling or poorcement
Mrayl
40-4
8/17/2019 Spwla 2011 Cement Wireline Logs in Deepwater Environment
http://slidepdf.com/reader/full/spwla-2011-cement-wireline-logs-in-deepwater-environment 8/15
SPWLA 52nd Annual Logging Symposium, May 14-18, 2011
8
Fig. 13 The flexural attenuation map in the right track shows a strong contrast the at the top of cementhighlighted by the red line
An expanded plot of minimum flexural attenuationshown below adds another indicator for the top ofcement, but now the range of values in free pipe isnarrow with very low noise levels. The projection of thefree pipe range through the interval shows a very strongcontrast compared to the cemented section which leadsto a high level of certainty in the interpretation ofcement quality and zonal isolation.
Fig. 14 Plot of minimum acoustic impedance with theaddition of minimum flexural attenuation showing therange of values in free pipe projected to the bottom ofthe interval
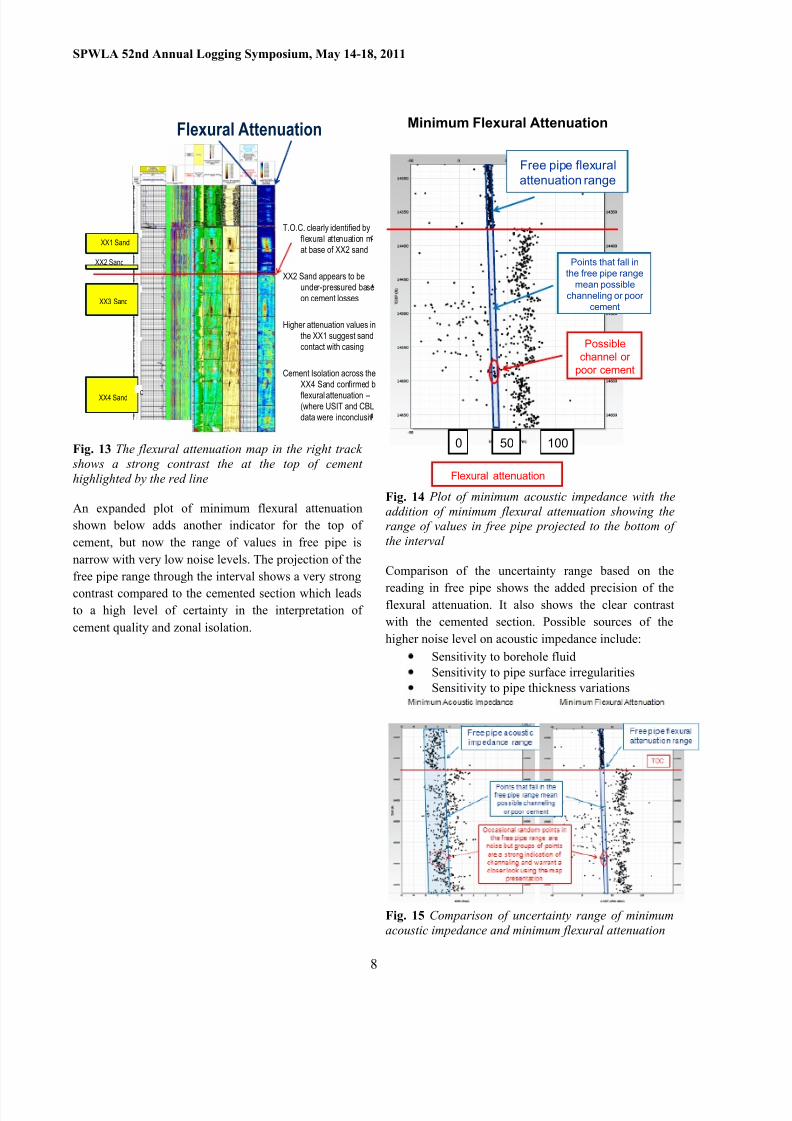
Comparison of the uncertainty range based on the
reading in free pipe shows the added precision of theflexural attenuation. It also shows the clear contrastwith the cemented section. Possible sources of thehigher noise level on acoustic impedance include:
Sensitivity to borehole fluidSensitivity to pipe surface irregularitiesSensitivity to pipe thickness variations
Fig. 15 Comparison of uncertainty range of minimumacoustic impedance and minimum flexural attenuation
Flexural Attenuation
T.O.C. clearly identified byflexural attenuation mat base of XX2 sand
XX2 Sand appears to beunder-pressured baseon cement losses
Higher attenuation values inthe XX1 suggest sandcontact with casing
Cement Isolation across theXX4 Sand confirmed bflexural attenuation –(where USIT and CBLdata were inconclusiv
XX1 Sand
XX3 Sand
XX2 Sand
XX4 Sand C
Minimum Flexural Attenuation
Free pipe flexuralattenuation range
Points that fall inthe free pipe range
mean possiblechanneling or poor
cement
Possiblechannel or
poor cement
Flexural attenuation
1000 50
8/17/2019 Spwla 2011 Cement Wireline Logs in Deepwater Environment
http://slidepdf.com/reader/full/spwla-2011-cement-wireline-logs-in-deepwater-environment 9/15
SPWLA 52 nd Annual Logging Symposium, May 14-18, 2011
9
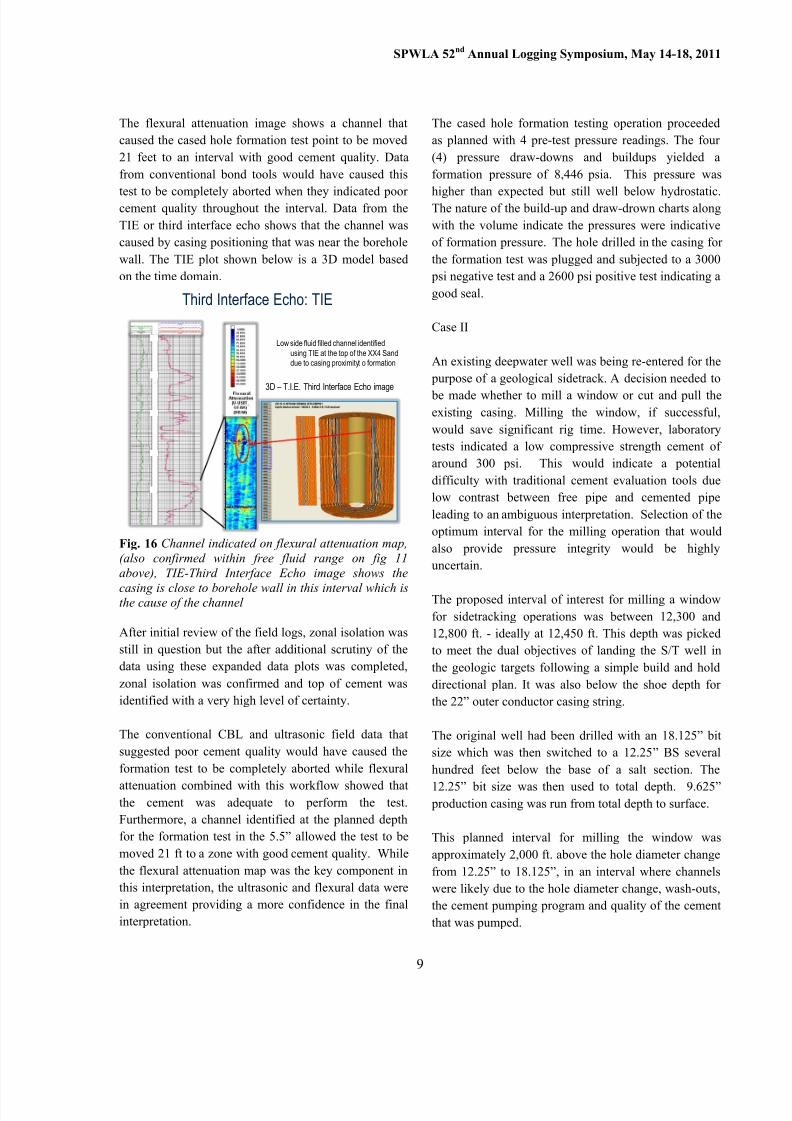
The flexural attenuation image shows a channel thatcaused the cased hole formation test point to be moved21 feet to an interval with good cement quality. Datafrom conventional bond tools would have caused this
test to be completely aborted when they indicated poorcement quality throughout the interval. Data from theTIE or third interface echo shows that the channel wascaused by casing positioning that was near the boreholewall. The TIE plot shown below is a 3D model basedon the time domain.
Fig. 16 Channel indicated on flexural attenuation map,(also confirmed within free fluid range on fig 11above), TIE-Third Interface Echo image shows the
casing is close to borehole wall in this interval which isthe cause of the channel
After initial review of the field logs, zonal isolation wasstill in question but the after additional scrutiny of thedata using these expanded data plots was completed,zonal isolation was confirmed and top of cement wasidentified with a very high level of certainty.
The conventional CBL and ultrasonic field data thatsuggested poor cement quality would have caused theformation test to be completely aborted while flexural
attenuation combined with this workflow showed thatthe cement was adequate to perform the test.Furthermore, a channel identified at the planned depthfor the formation test in the 5.5” allowed the test to bemoved 21 ft to a zone with good cement quality. Whilethe flexural attenuation map was the key component inthis interpretation, the ultrasonic and flexural data werein agreement providing a more confidence in the finalinterpretation.
The cased hole formation testing operation proceededas planned with 4 pre-test pressure readings. The four(4) pressure draw-downs and buildups yielded aformation pressure of 8,446 psia. This pressure was
higher than expected but still well below hydrostatic.The nature of the build-up and draw-drown charts alongwith the volume indicate the pressures were indicativeof formation pressure. The hole drilled in the casing forthe formation test was plugged and subjected to a 3000
psi negative test and a 2600 psi positive test indicating agood seal.
Case II
An existing deepwater well was being re-entered for the purpose of a geological sidetrack. A decision needed to
be made whether to mill a window or cut and pull theexisting casing. Milling the window, if successful,would save significant rig time. However, laboratorytests indicated a low compressive strength cement ofaround 300 psi. This would indicate a potentialdifficulty with traditional cement evaluation tools duelow contrast between free pipe and cemented pipeleading to an ambiguous interpretation. Selection of theoptimum interval for the milling operation that wouldalso provide pressure integrity would be highlyuncertain.
The proposed interval of interest for milling a windowfor sidetracking operations was between 12,300 and12,800 ft. - ideally at 12,450 ft. This depth was pickedto meet the dual objectives of landing the S/T well inthe geologic targets following a simple build and holddirectional plan. It was also below the shoe depth forthe 22” outer conductor casing string.
The original well had been drilled with an 18.125” bitsize which was then switched to a 12.25 ” BS severalhundred feet below the base of a salt section. The
12.25” bit size was then used to total depth. 9. 625” production casing was run from total depth to surface.
This planned interval for milling the window wasapproximately 2,000 ft. above the hole diameter changefrom 12.25” to 18.125”, in an interval where channelswere likely due to the hole diameter change, wash-outs,the cement pumping program and quality of the cementthat was pumped.
Third Interface Echo: TIE
Low side fluid filled channel identifiedusing TIE at the top of the XX4 Sanddue to casing proximityt o formation
3D –T.I.E. Third Interface Echo image
8/17/2019 Spwla 2011 Cement Wireline Logs in Deepwater Environment
http://slidepdf.com/reader/full/spwla-2011-cement-wireline-logs-in-deepwater-environment 10/15
SPWLA 52nd Annual Logging Symposium, May 14-18, 2011
10
An 8 1/2" clean out/ drill out assembly was run in thewell and a cement plug that had been previously placedin the well was drilled out. After the cement plug wasdrilled, the borehole fluid was displaced with 11.2 ppg
synthetic base mud.
One possible danger with the planned milling operationwas, if the window was milled and there was no cementin the 9.625” casing annulus, the 8.5” sidetrack bitcould follow in the annular space and not drill theformation, causing a well operations problem thatwould have to be mitigated.
Cement evaluation logs including attenuation basedCBL, ultrasonic impedance and flexural attenuationwere run evaluate the cement quality for the purposes
of determining the ideal place for window milling.
The top of any cement was n oted below the 22” shoe,with the top of any significant cement that could
possibly provide isolation approximately 750 ft abovethe intended window milling depth.
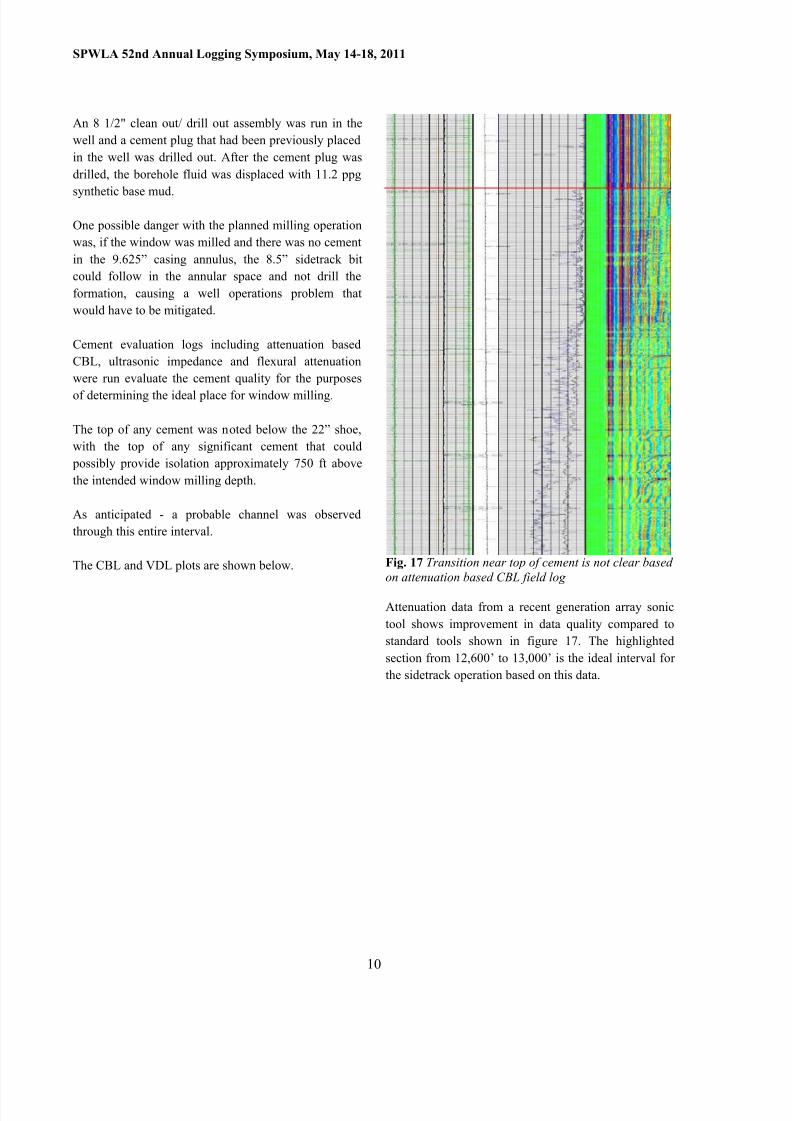
As anticipated - a probable channel was observedthrough this entire interval.
The CBL and VDL plots are shown below. Fig. 17 Transition near top of cement is not clear basedon attenuation based CBL field log
Attenuation data from a recent generation array sonictool shows improvement in data quality compared tostandard tools shown in figure 17. The highlightedsection from 12,600 ‟ to 13,000 ‟ is the ideal interva l forthe sidetrack operation based on this data.
8/17/2019 Spwla 2011 Cement Wireline Logs in Deepwater Environment
http://slidepdf.com/reader/full/spwla-2011-cement-wireline-logs-in-deepwater-environment 11/15
SPWLA 52 nd Annual Logging Symposium, May 14-18, 2011
11
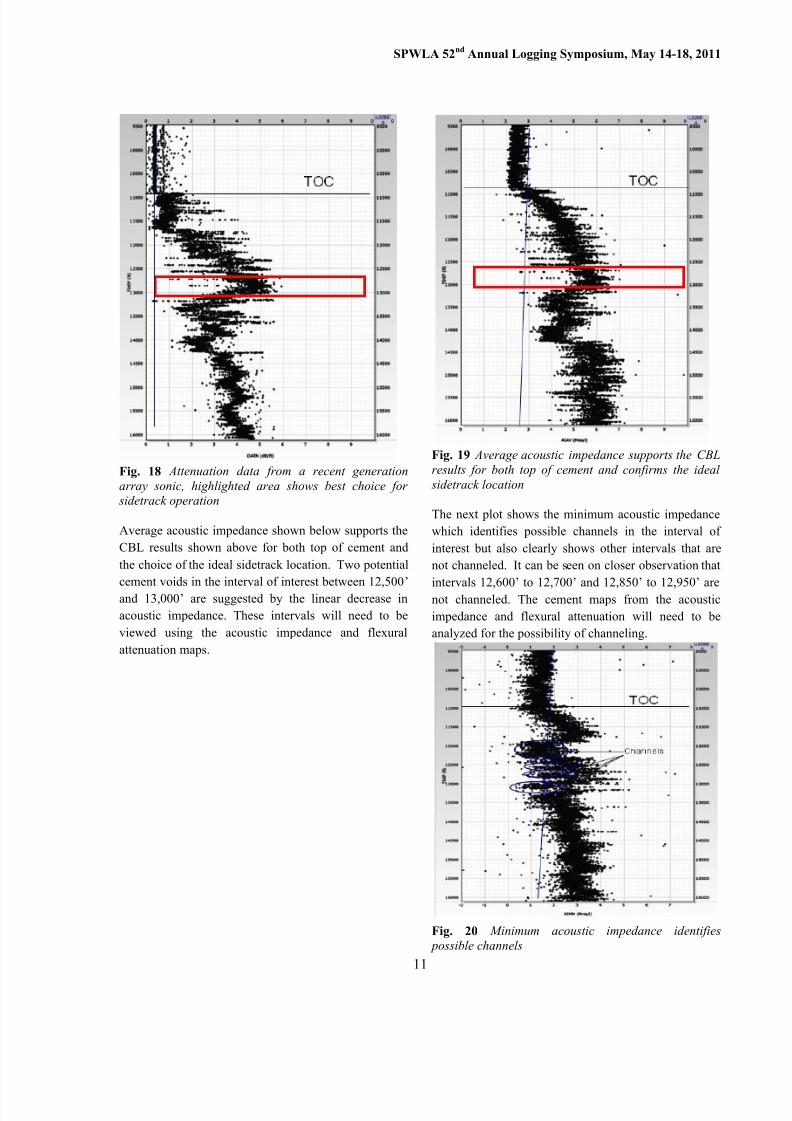
Fig. 18 Attenuation data from a recent generationarray sonic, highlighted area shows best choice for
sidetrack operation
Average acoustic impedance shown below supports theCBL results shown above for both top of cement andthe choice of the ideal sidetrack location. Two potentialcement voids in the interval of interest between 12,500 ‟ and 13,000 ‟ are suggested by the linear decrease inacoustic impedance. These intervals will need to beviewed using the acoustic impedance and flexuralattenuation maps.
Fig. 19 Average acoustic impedance supports the CBLresults for both top of cement and confirms the ideal
sidetrack location
The next plot shows the minimum acoustic impedancewhich identifies possible channels in the interval ofinterest but also clearly shows other intervals that arenot channeled. It can be seen on closer observation thatintervals 12,600‟ to 12,700‟ and 12,850‟ to 12,950‟ arenot channeled. The cement maps from the acousticimpedance and flexural attenuation will need to beanalyzed for the possibility of channeling.
Fig. 20 Minimum acoustic impedance identifies possible channels
8/17/2019 Spwla 2011 Cement Wireline Logs in Deepwater Environment
http://slidepdf.com/reader/full/spwla-2011-cement-wireline-logs-in-deepwater-environment 12/15
SPWLA 52nd Annual Logging Symposium, May 14-18, 2011
12
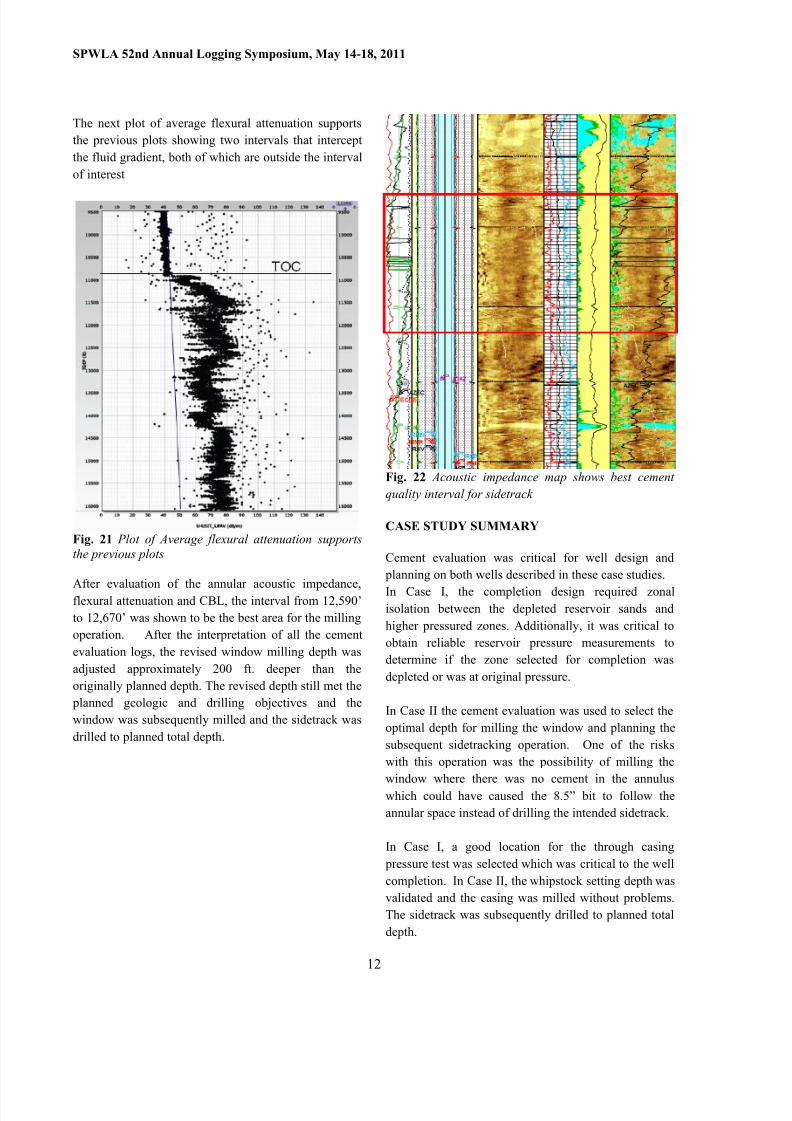
The next plot of average flexural attenuation supportsthe previous plots showing two intervals that interceptthe fluid gradient, both of which are outside the intervalof interest
Fig. 21 Plot of Average flexural attenuation supportsthe previous plots
After evaluation of the annular acoustic impedance,flexural attenuation and CBL , the interval from 12,590‟to 12,670‟ was shown to be the best area for the millingoperation. After the interpretation of all the cementevaluation logs, the revised window milling depth wasadjusted approximately 200 ft. deeper than theoriginally planned depth. The revised depth still met the
planned geologic and drilling objectives and thewindow was subsequently milled and the sidetrack wasdrilled to planned total depth.
Fig. 22 Acoustic impedance map shows best cementquality interval for sidetrack
CASE STUDY SUMMARY
Cement evaluation was critical for well design and planning on both wells described in these case studies.
In Case I, the completion design required zonalisolation between the depleted reservoir sands andhigher pressured zones. Additionally, it was critical toobtain reliable reservoir pressure measurements todetermine if the zone selected for completion wasdepleted or was at original pressure.
In Case II the cement evaluation was used to select theoptimal depth for milling the window and planning thesubsequent sidetracking operation. One of the riskswith this operation was the possibility of milling thewindow where there was no cement in the annuluswhich could have caused the 8.5” bit to follow theannular space instead of drilling the intended sidetrack.
In Case I, a good location for the through casing pressure test was selected which was critical to the wellcompletion. In Case II, the whipstock setting depth wasvalidated and the casing was milled without problems.The sidetrack was subsequently drilled to planned totaldepth.
8/17/2019 Spwla 2011 Cement Wireline Logs in Deepwater Environment
http://slidepdf.com/reader/full/spwla-2011-cement-wireline-logs-in-deepwater-environment 13/15
SPWLA 52 nd Annual Logging Symposium, May 14-18, 2011
13
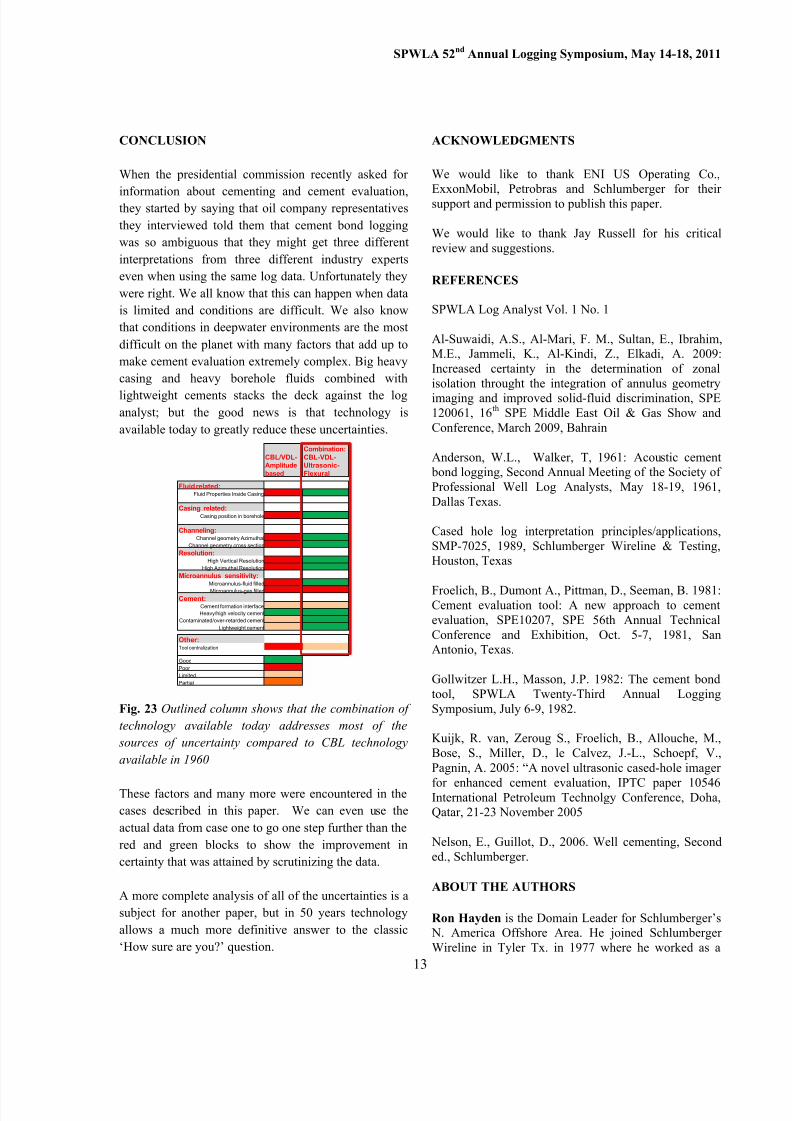
CONCLUSION
When the presidential commission recently asked for
information about cementing and cement evaluation,they started by saying that oil company representativesthey interviewed told them that cement bond loggingwas so ambiguous that they might get three differentinterpretations from three different industry expertseven when using the same log data. Unfortunately theywere right. We all know that this can happen when datais limited and conditions are difficult. We also knowthat conditions in deepwater environments are the mostdifficult on the planet with many factors that add up tomake cement evaluation extremely complex. Big heavycasing and heavy borehole fluids combined with
lightweight cements stacks the deck against the loganalyst; but the good news is that technology isavailable today to greatly reduce these uncertainties.
Fig. 23 Outlined column shows that the combination oftechnology available today addresses most of the
sources of uncertainty compared to CBL technologyavailable in 1960
These factors and many more were encountered in thecases described in this paper. We can even use theactual data from case one to go one step further than thered and green blocks to show the improvement incertainty that was attained by scrutinizing the data.
A more complete analysis of all of the uncertainties is asubject for another paper, but in 50 years technologyallows a much more definitive answer to the classic„How sure are you?‟ question .
ACKNOWLEDGMENTS
We would like to thank ENI US Operating Co.,ExxonMobil, Petrobras and Schlumberger for theirsupport and permission to publish this paper.
We would like to thank Jay Russell for his criticalreview and suggestions.
REFERENCES
SPWLA Log Analyst Vol. 1 No. 1
Al-Suwaidi, A.S., Al-Mari, F. M., Sultan, E., Ibrahim,M.E., Jammeli, K., Al-Kindi, Z., Elkadi, A. 2009:Increased certainty in the determination of zonalisolation throught the integration of annulus geometryimaging and improved solid-fluid discrimination, SPE120061, 16 th SPE Middle East Oil & Gas Show andConference, March 2009, Bahrain
Anderson, W.L., Walker, T, 1961: Acoustic cement bond logging, Second Annual Meeting of the Society ofProfessional Well Log Analysts, May 18-19, 1961,Dallas Texas.
Cased hole log interpretation principles/applications,SMP-7025, 1989, Schlumberger Wireline & Testing,Houston, Texas
Froelich, B., Dumont A., Pittman, D., Seeman, B. 1981:Cement evaluation tool: A new approach to cementevaluation, SPE10207, SPE 56th Annual TechnicalConference and Exhibition, Oct. 5-7, 1981, SanAntonio, Texas.
Gollwitzer L.H., Masson, J.P. 1982: The cement bondtool, SPWLA Twenty-Third Annual LoggingSymposium, July 6-9, 1982.
Kuijk, R. van, Zeroug S., Froelich, B., Allouche, M.,Bose, S., Miller, D., le Calvez, J.-L., Schoepf, V.,Pagnin, A. 2005 : “A novel ultrasonic cased-hole imager
for enhanced cement evaluation, IPTC paper 10546International Petroleum Technolgy Conference, Doha,Qatar, 21-23 November 2005
Nelson, E., Guillot, D., 2006. Well cementing, Seconded., Schlumberger.
ABOUT THE AUTHORS
Ron Hayden is the Domain Leader for Schlumberger‟s N. America Offshore Area. He joined SchlumbergerWireline in Tyler Tx. in 1977 where he worked as a
CBL/VDL-Amplitudebased
Combination:CBL-VDL-Ultrasonic-Flexural
Fluid related:Fluid Properties Inside Casing
Casing related:Casing position in borehole
Channeling:Channel geometry Azimuthal
Channel geometry cross section
Resolution:High Vertical Resolution
High Azimuthal Resolution
Microannulus sensitivity:Microannulus-fluid filledMicroannulus-gas filled
Cement:Cement formation interfaceHeavy/high velocity cement
Contaminated/over-retarded cementLightweight cement
Other:Tool centralization
GoodPoor LimitedPartial
8/17/2019 Spwla 2011 Cement Wireline Logs in Deepwater Environment
http://slidepdf.com/reader/full/spwla-2011-cement-wireline-logs-in-deepwater-environment 14/15

8/17/2019 Spwla 2011 Cement Wireline Logs in Deepwater Environment
http://slidepdf.com/reader/full/spwla-2011-cement-wireline-logs-in-deepwater-environment 15/15
SPWLA 52 nd Annual Logging Symposium, May 14-18, 2011
15
Reflection Coefficient of outer casing to annularmaterial: R2 = (Z3-Z2) / (Z3+Z2)
Recommended