
SPIB Technical Committee
April 24, 2018
Update on Southern Pine
Design Values

History
• Original IGT Published: 1991
• Monitoring: 1994-2010
• Destructive Testing: 2011
– #2 2x4
– MOE, MOR, UTS
• Significant decreases observed
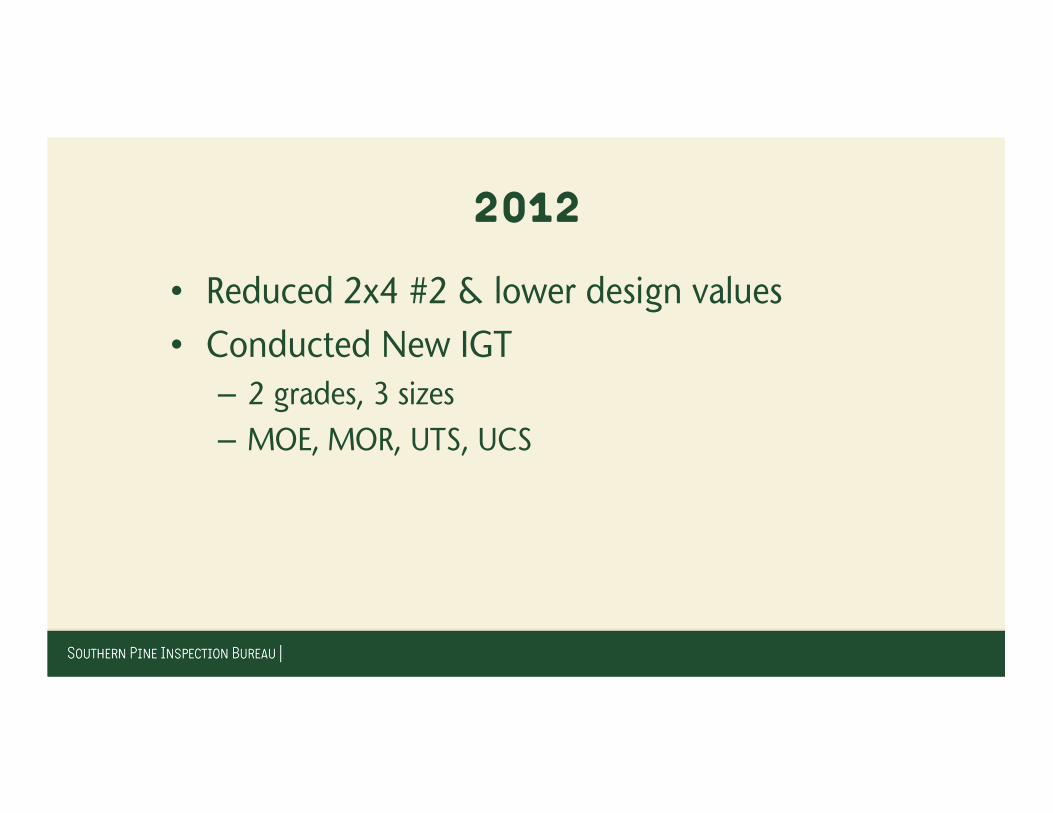
2012
• Reduced 2x4 #2 & lower design values
• Conducted New IGT
– 2 grades, 3 sizes
– MOE, MOR, UTS, UCS
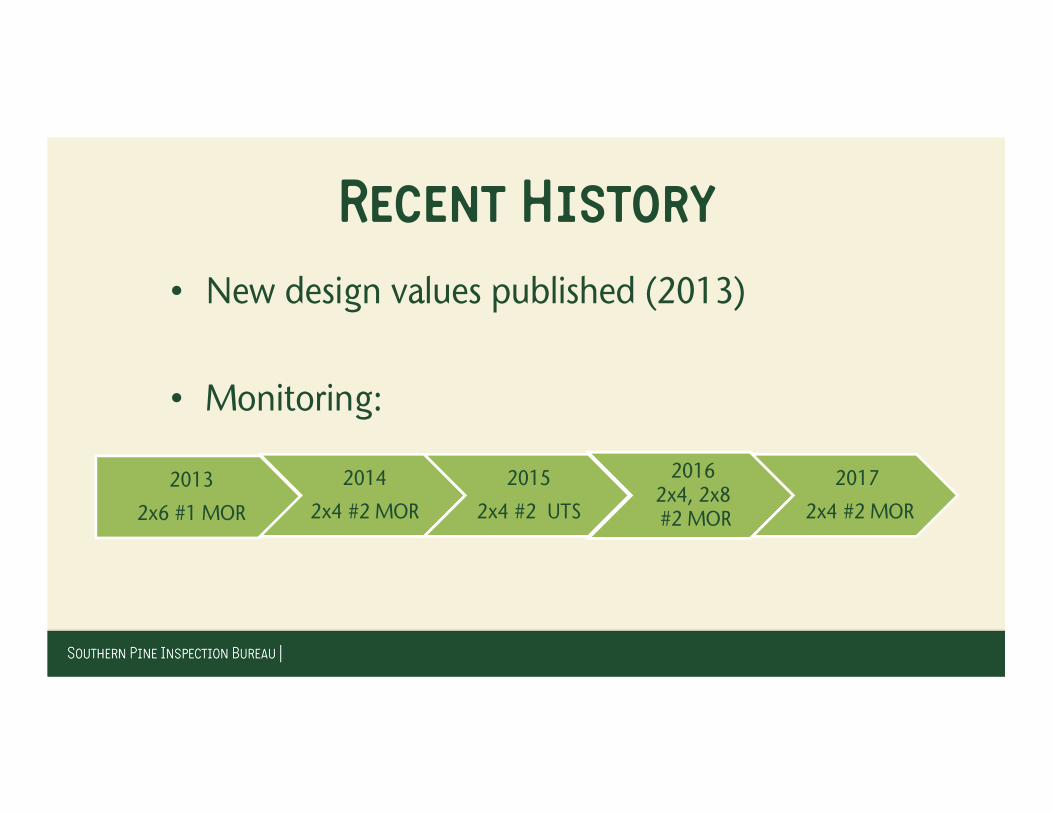
Recent History
• New design values published (2013)
• Monitoring:
2013
2x6 #1 MOR
2014
2x4 #2 MOR
2015
2x4 #2 UTS
2016 2x4, 2x8#2 MOR
2017
2x4 #2 MOR

InGrade Testing Standards
• Two main standards written during original IGT process to document procedures as they evolved.
• Extensive collaboration from FPL, FPInnovations (previously Forintek), industry technical experts, and North American grading agencies

InGrade Testing Standards
• ASTM D4761- testing procedures for a mill environment
• ASTM D1990 – data adjustments, modelling procedures, design value development

Sampling
• Mills assigned to one of 16 homogeneous Southern Pine growing regions
• Includes SPIB and TP mills
• Randomly select mills in proportion to regional production
• Target sample size: 360 pieces per “cell”
• Test 10-12 pieces from each selected mill

Southern Pine Regions

Nonparametric Statistics
• We do not assume a “normal” (or any other) statistical distribution.
• Use “order statistics” to estimate values of interest.
• Permits analysis without actually breaking every piece.

5th Percentile
• Rank order all data from lowest to highest.
• (5% * sample size) is approximately the order statistic of the 5th percentile “point estimate”.
• Example: 100 pieces broken in bending. Use the 5th weakest piece to estimate the 5th
percentile.

Tolerance Limits
• ASTM D1990 uses the 75% confidence tolerance limit on the 5th percentile.
• Uses data from a piece weaker than actual 5th
percentile “point estimate”.
• Provides increased confidence that true 5th
percentile is equal to or greater than our estimate.
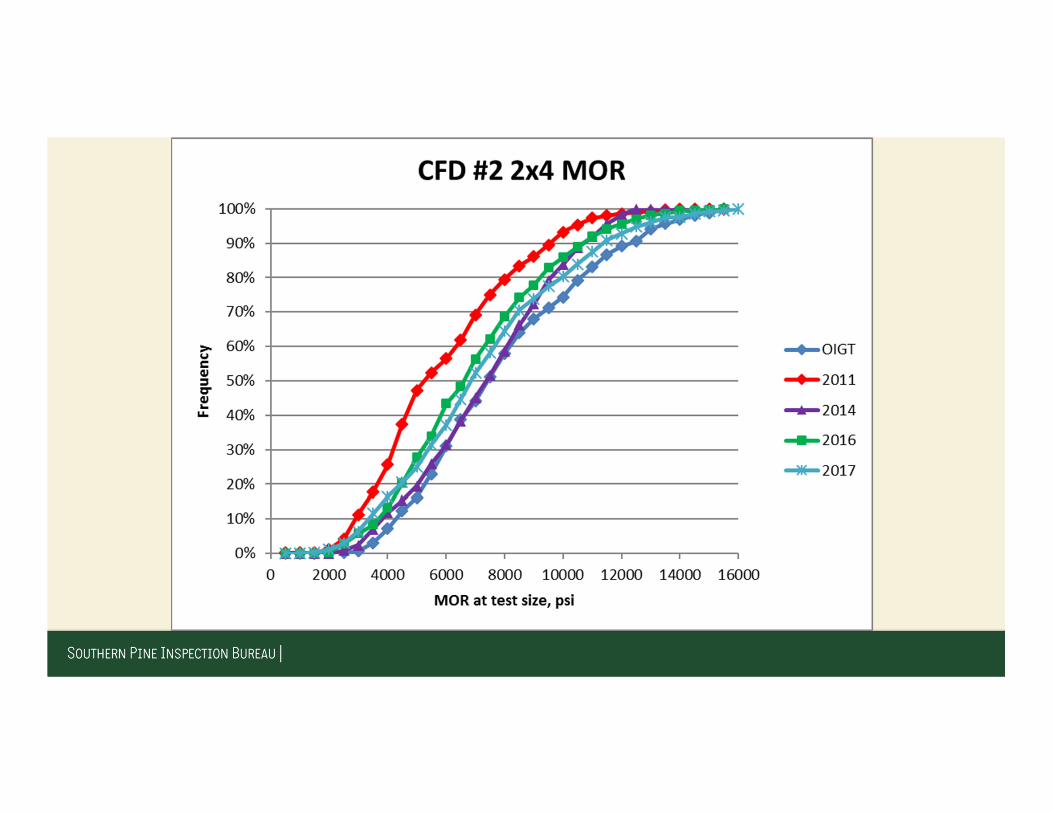
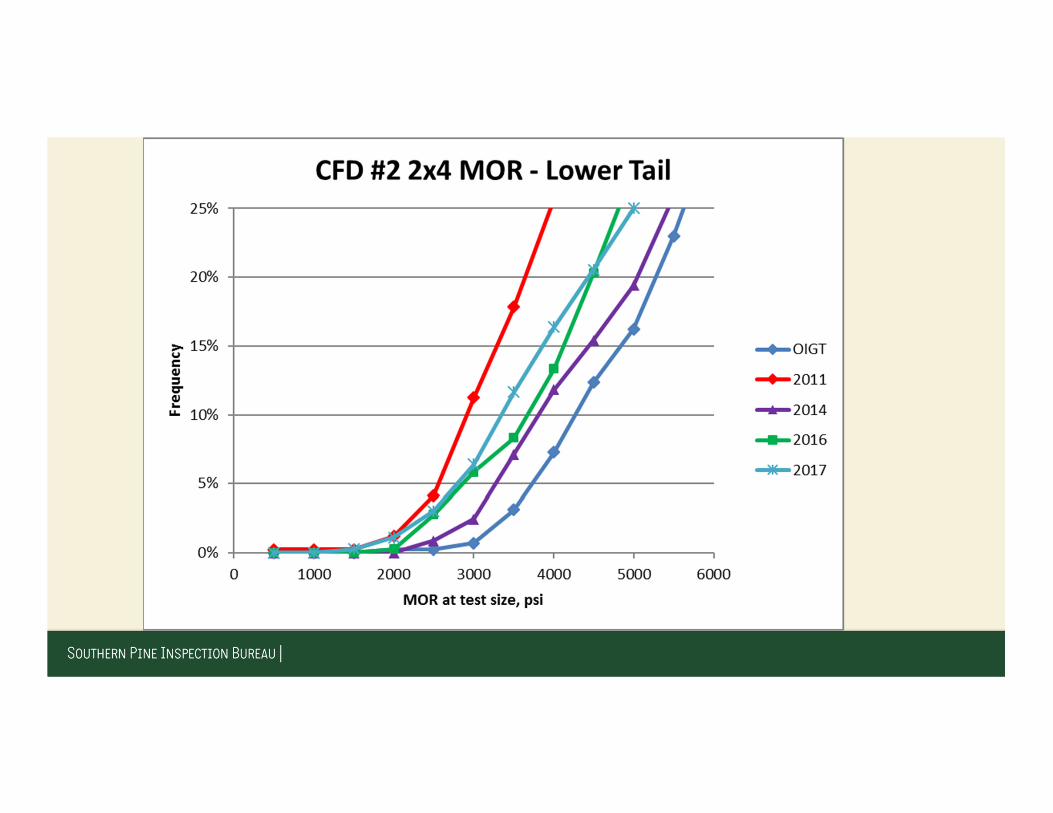
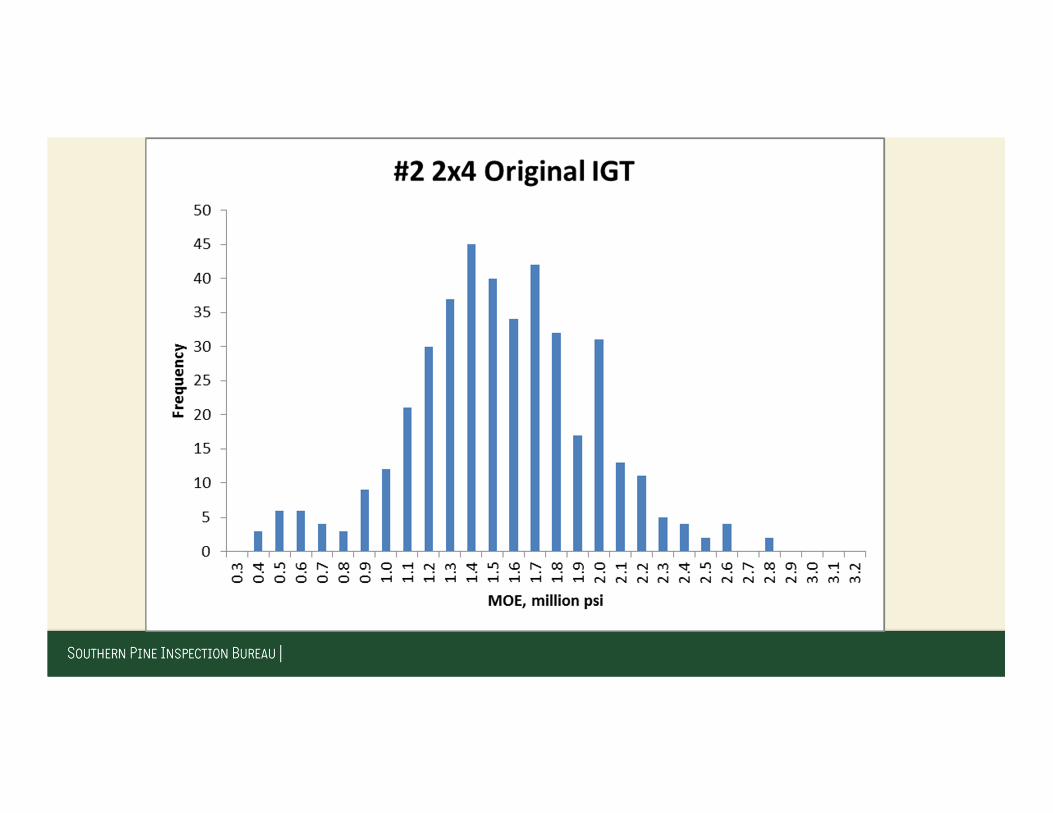
2x4 Results
MOR Results
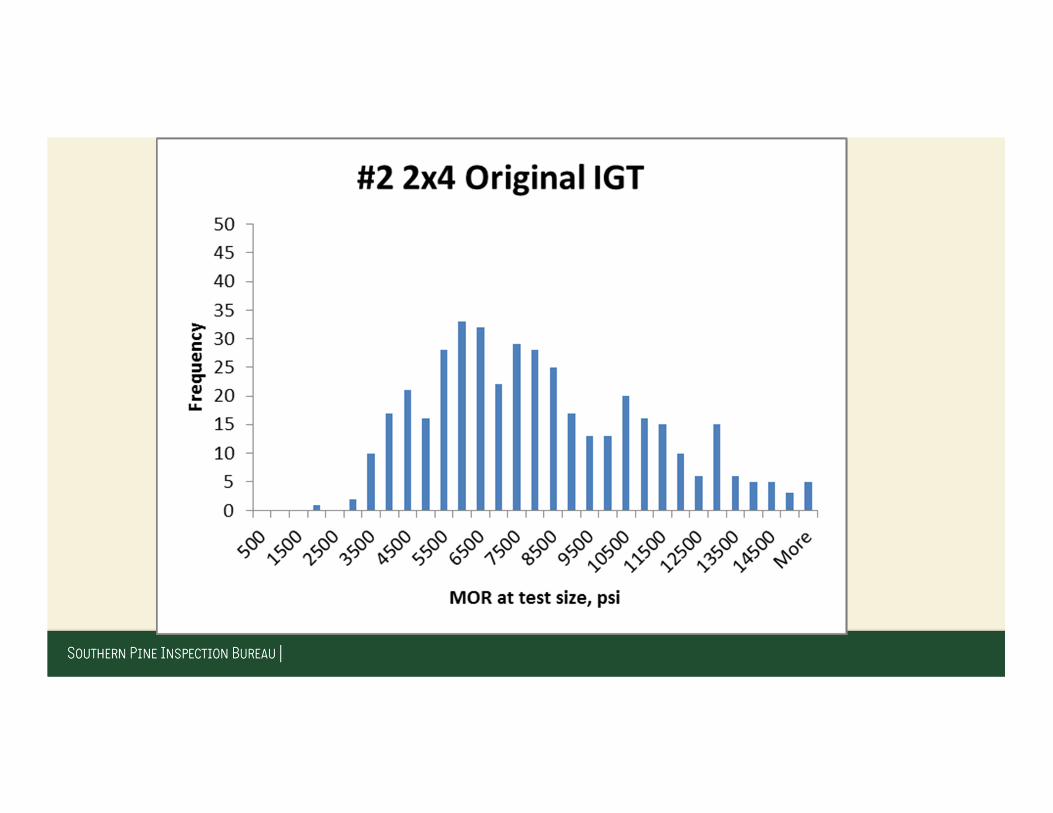


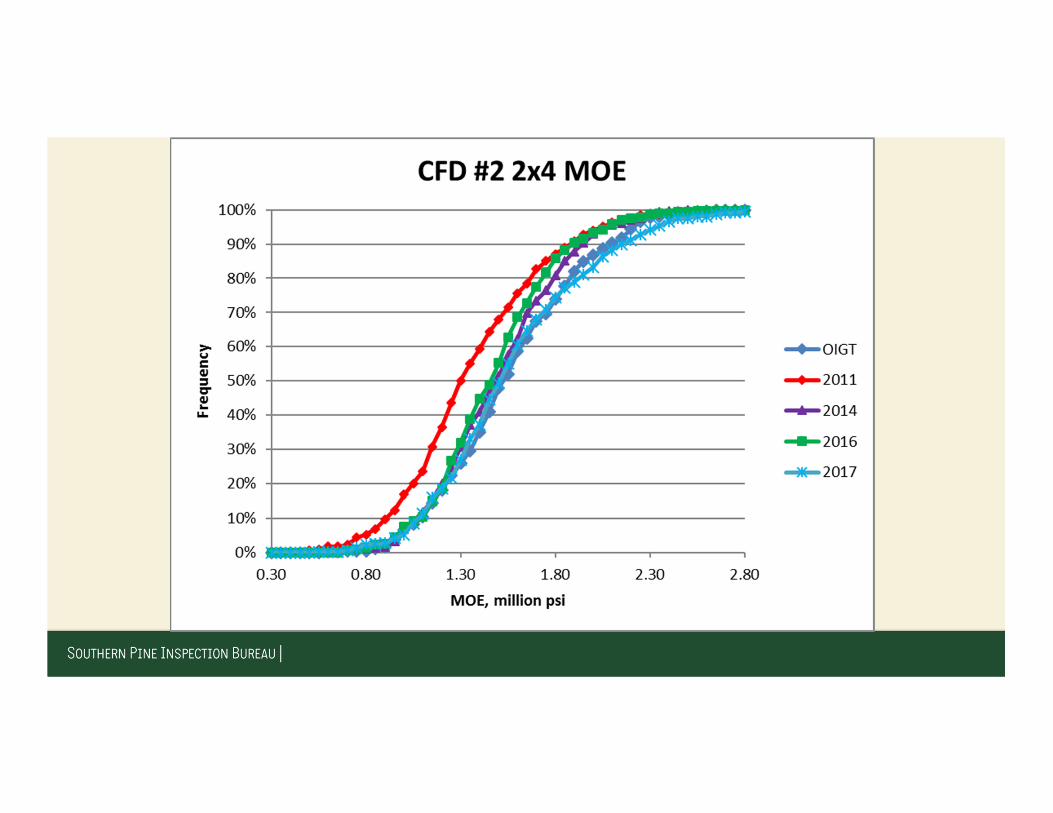
MOE Results


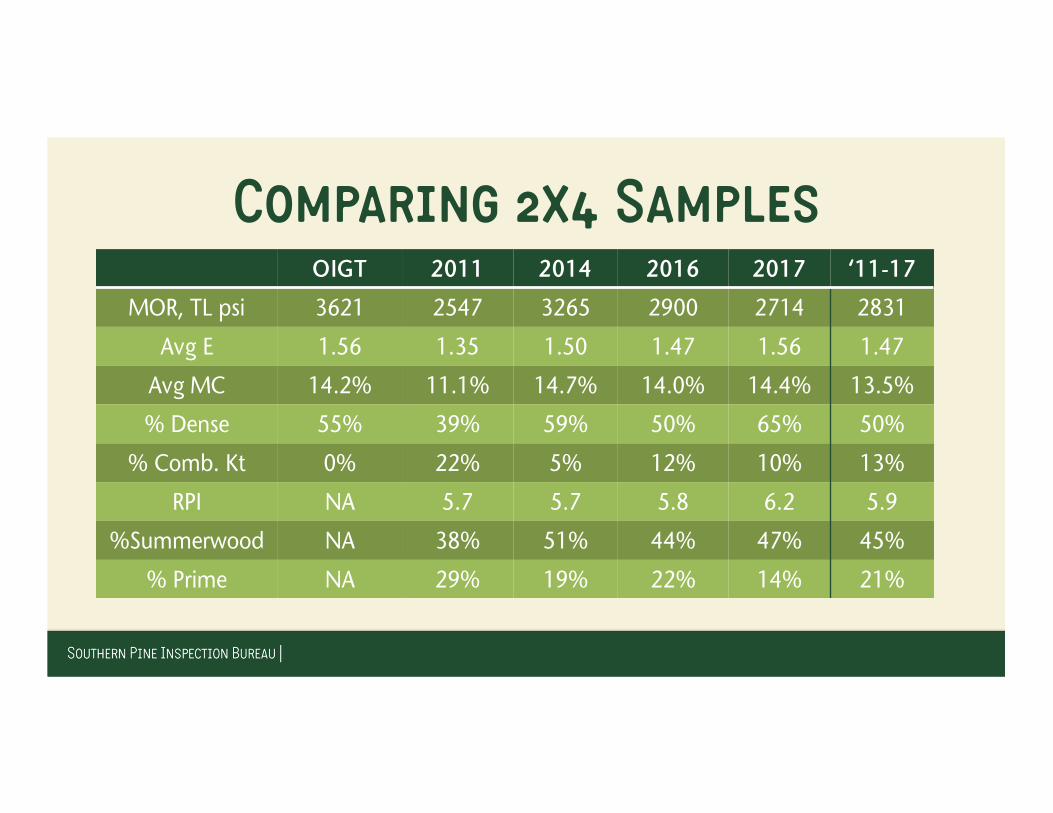
Comparing 2x4 SamplesOIGT 2011 2014 2016 2017 ‘11-17
MOR, TL psi 3621 2547 3265 2900 2714 2831
Avg E 1.56 1.35 1.50 1.47 1.56 1.47
Avg MC 14.2% 11.1% 14.7% 14.0% 14.4% 13.5%
% Dense 55% 39% 59% 50% 65% 50%
% Comb. Kt 0% 22% 5% 12% 10% 13%
RPI NA 5.7 5.7 5.8 6.2 5.9
%Summerwood NA 38% 51% 44% 47% 45%
% Prime NA 29% 19% 22% 14% 21%

Observations• 2017 MOR TL is less than that observed in 2016 and 2014, but greater than 2011
• 2017 MOE is equivalent to that observed in the original In-Grade Testing
• 2017 values meet or exceed published design values
Observations
• Noteworthy variability between samples.
• Inconsistent relationship between MOR TL and Average MOE between samples.
• Present design values still represent lower end of what could be included in the grade.

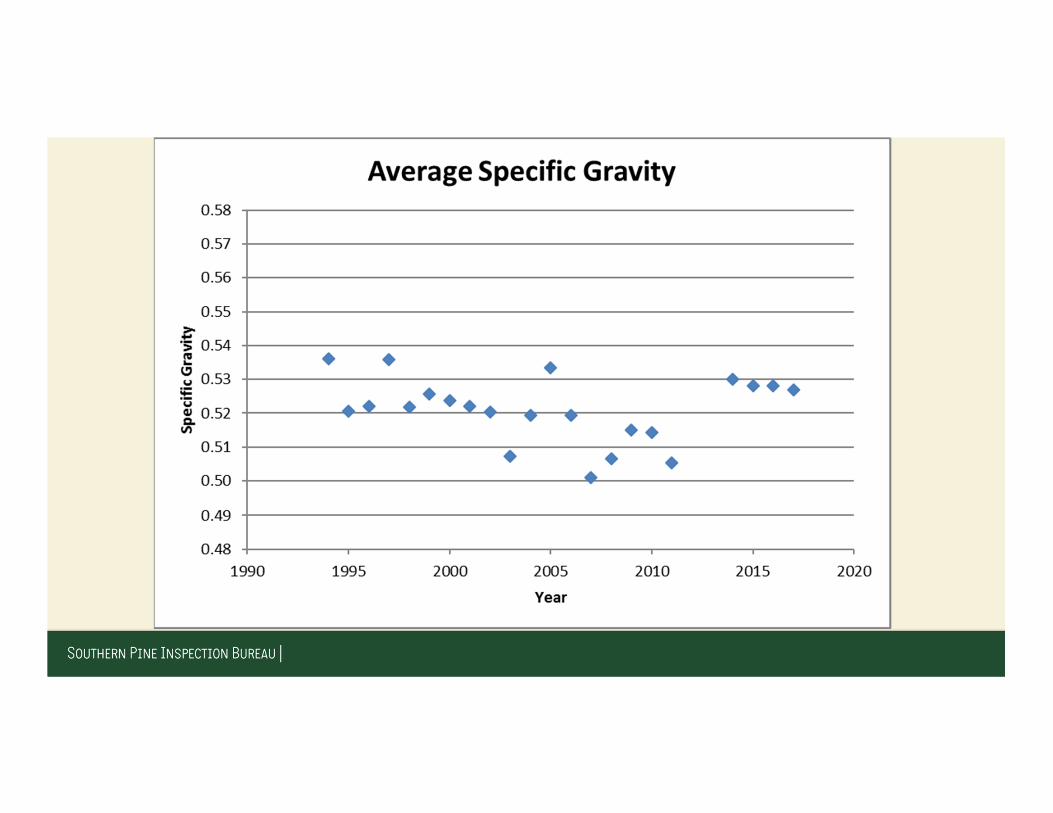
Historical RMP Data

Historical RMP Data
• Since 1994, a non-destructive monitoring program had been conducted by SPIB
• From 1994-2010, a portable E-Computer was used at mill sites to collect data
• Flatwise, transverse vibration E is not as correlated to third-point Edge E as we would like
Historical RMP Data
• #2 2x4
• Data was useful to detect trends over time
• Continue collecting E-Computer data in recent/future monitoring samples


Observations
• Recent monitoring samples are consistent
• Specific Gravity determined on full-size lumber pieces (not approved in ASTM D2395)
• SG not a 1:1 relation with published SG

Future Testing
• Monitoring procedures added to ASTM D1990
• Requirement: Test most commonly produced size/grade every 5 years
• SPIB: Test #2 2x4 every approximately 18 months, test a wider width every 3rd year.
• Vary between bending and tension tests.
• 18 month cycle – sample different seasons

Year “Season” Size Grade Property Meeting
2011 2x4 #2 E, MOR, UTS
2012 fall 2x4, 2x8, 2x10 SS, #2 E, MOR, UTS, UCS
2013 summer 2x6 #1 E, MOR
2014 winter 2x4 #2 E, MOR
2015 winter 2x4 #2 E, UTS Jun ‘16
2016 late fall 2x4,2x8 #2 E, MOR Jun ‘17
2017 spring 2x4 #2 E, MOR Apr ‘18
2019 fall 2x4, 2x8 #2 E, UTS, MOR Jun ‘20
2021 spring 2x4 #2 E, MOR Apr ‘22
2023 fall 2x4, 2x8 #2 E, UTS, MOR Jun ‘24
Thank
You
Recommended