Species Richness
Chapter 10
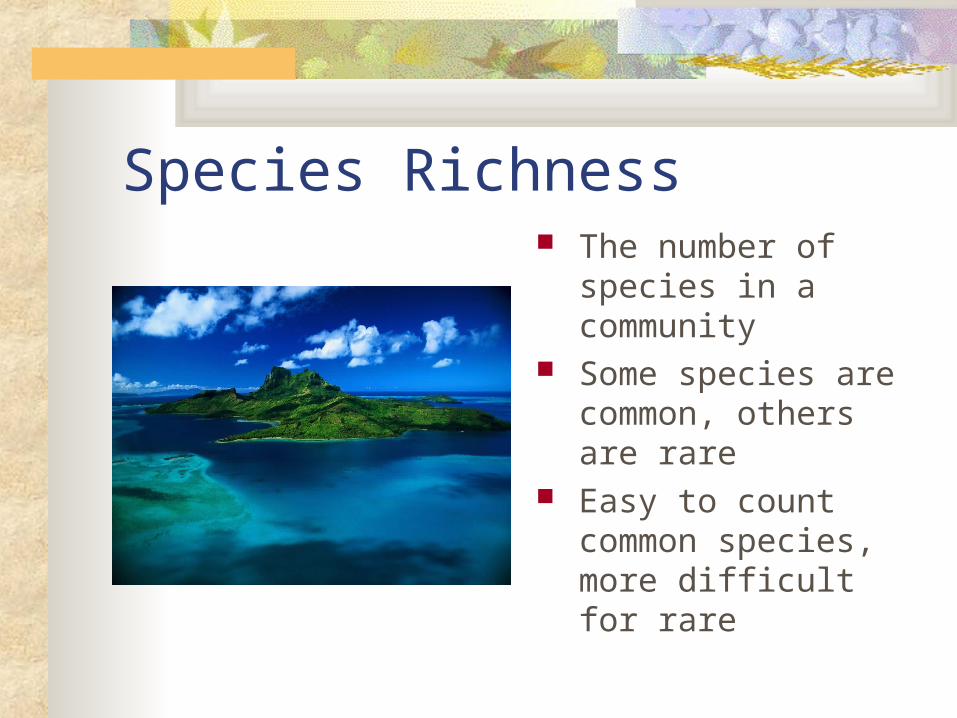
Species Richness The number of
species in a community
Some species are common, others are rare
Easy to count common species, more difficult for rare
Species Richness Richness provides
one aspect of community, but ignores another important factor: abundance
Diversity considers both richness and abundance
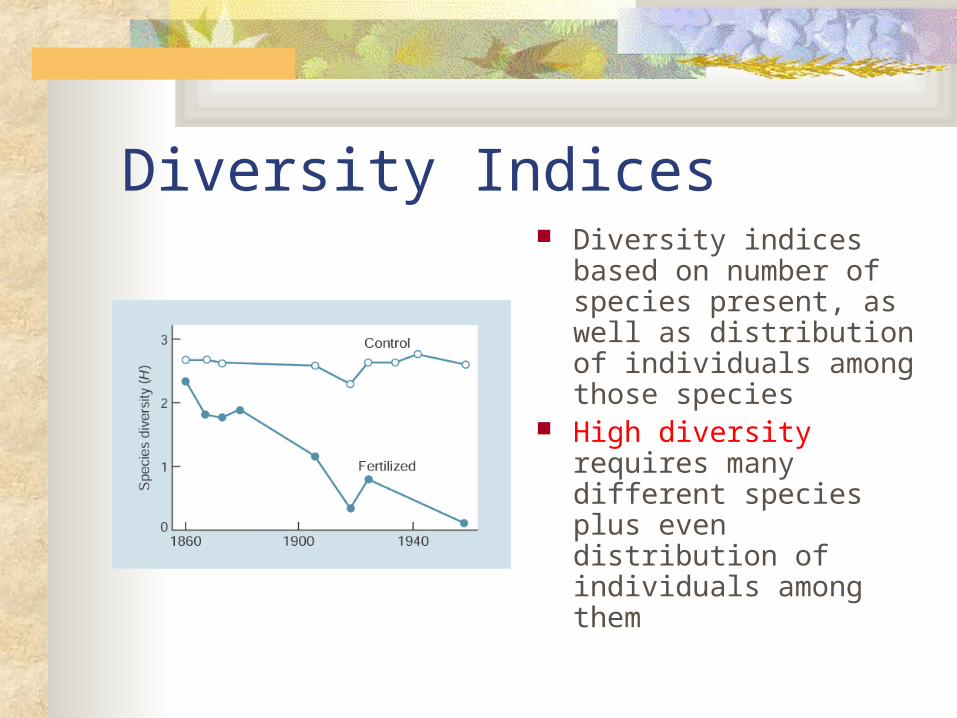
Diversity Indices Diversity indices based
on number of species present, as well as distribution of individuals among those species
High diversity requires many different species plus even distribution of individuals among them
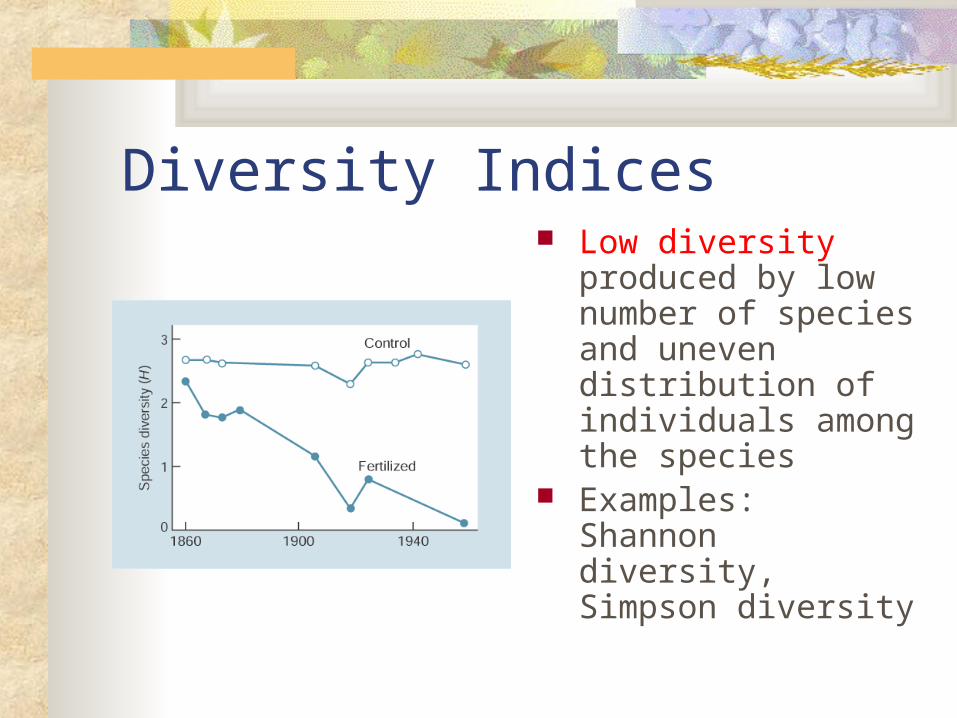
Diversity Indices Low diversity
produced by low number of species and uneven distribution of individuals among the species
Examples: Shannon diversity, Simpson diversity
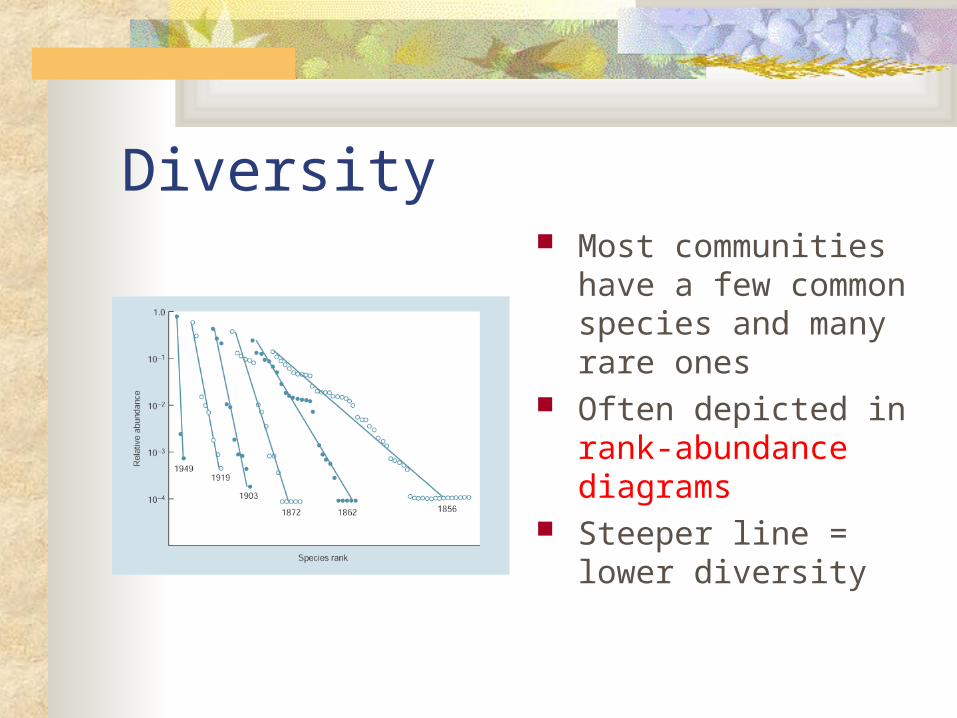
Diversity Most communities
have a few common species and many rare ones
Often depicted in rank-abundance diagrams
Steeper line = lower diversity

Species Richness Models Greater range of
resources
More specialization
More overlap among species
Resource range more fully exploited
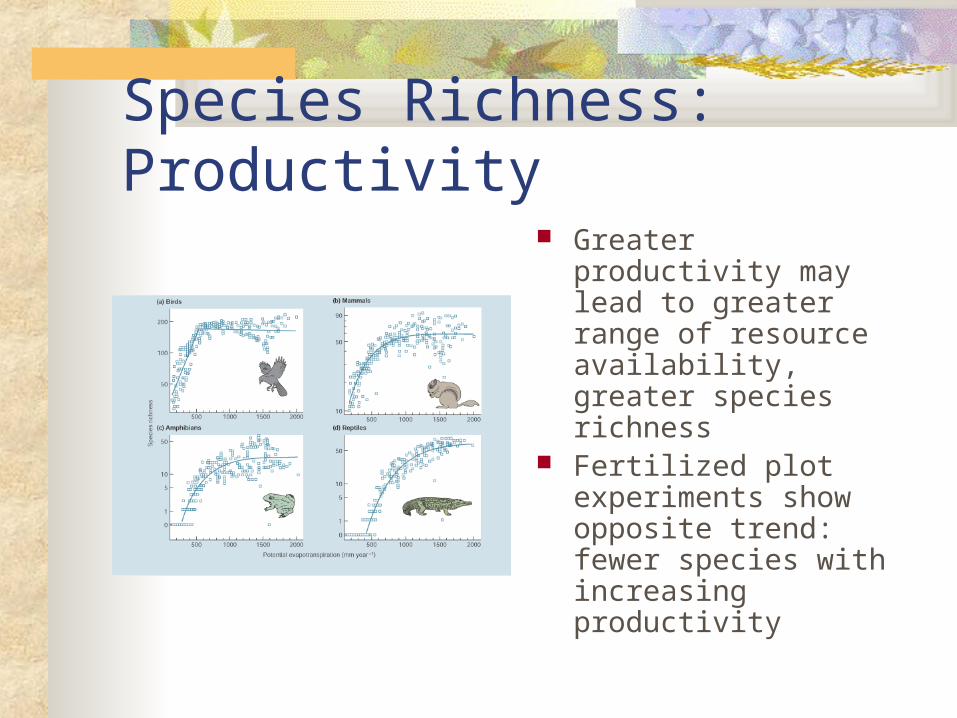
Species Richness: Productivity Greater productivity
may lead to greater range of resource availability, greater species richness
Fertilized plot experiments show opposite trend: fewer species with increasing productivity
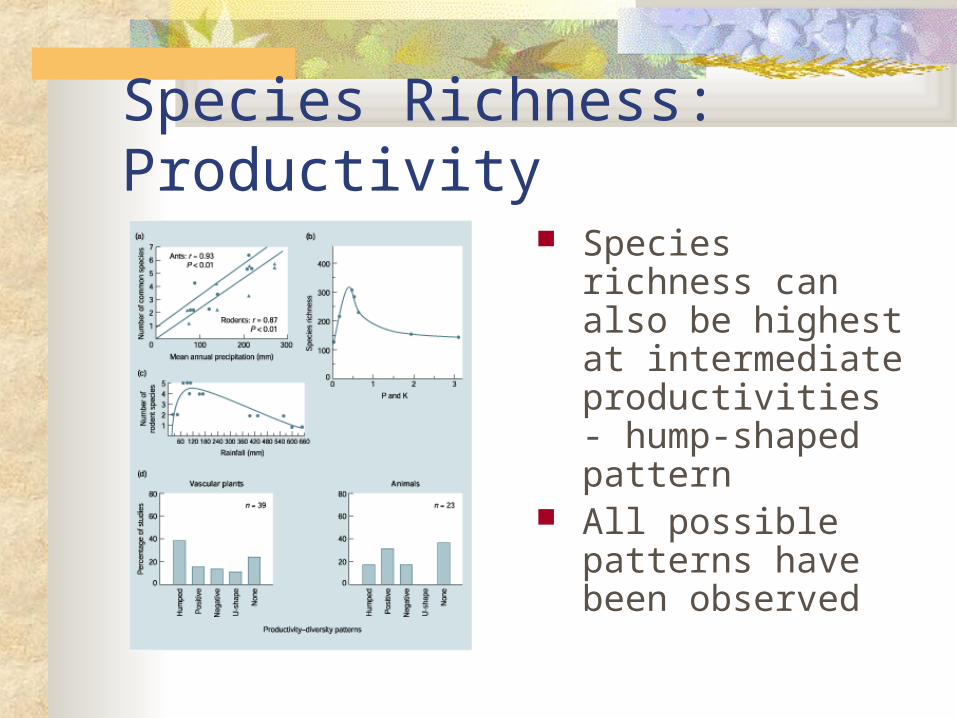
Species Richness: Productivity Species richness can
also be highest at intermediate productivities - hump-shaped pattern
All possible patterns have been observed
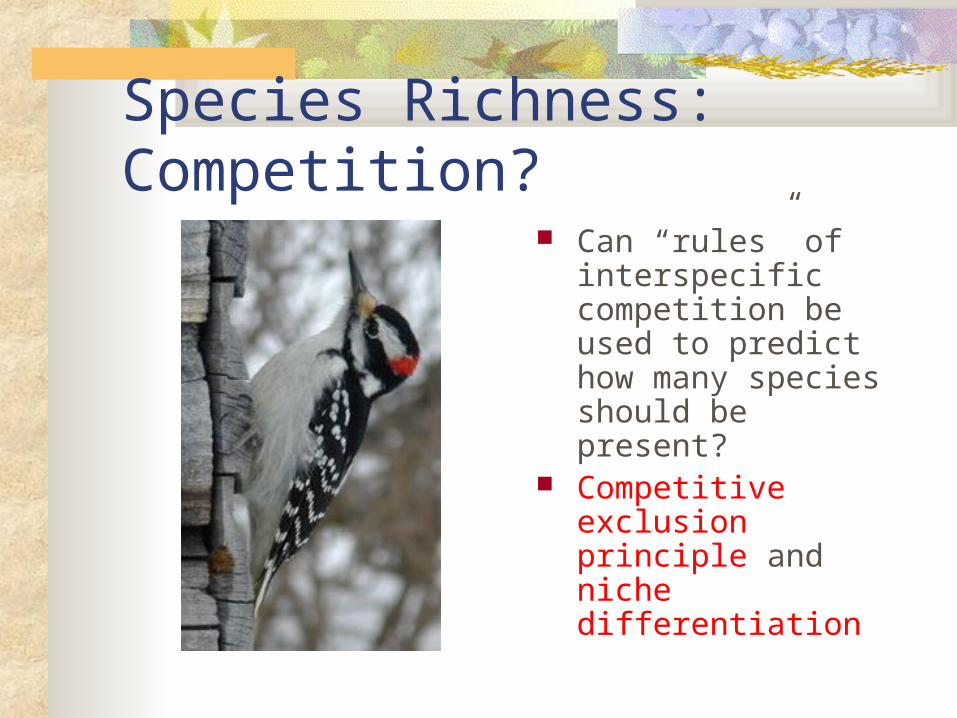
Species Richness: Competition? Can “rules” of
interspecific competition be used to predict how many species should be present?
Competitive exclusion principle and niche differentiation
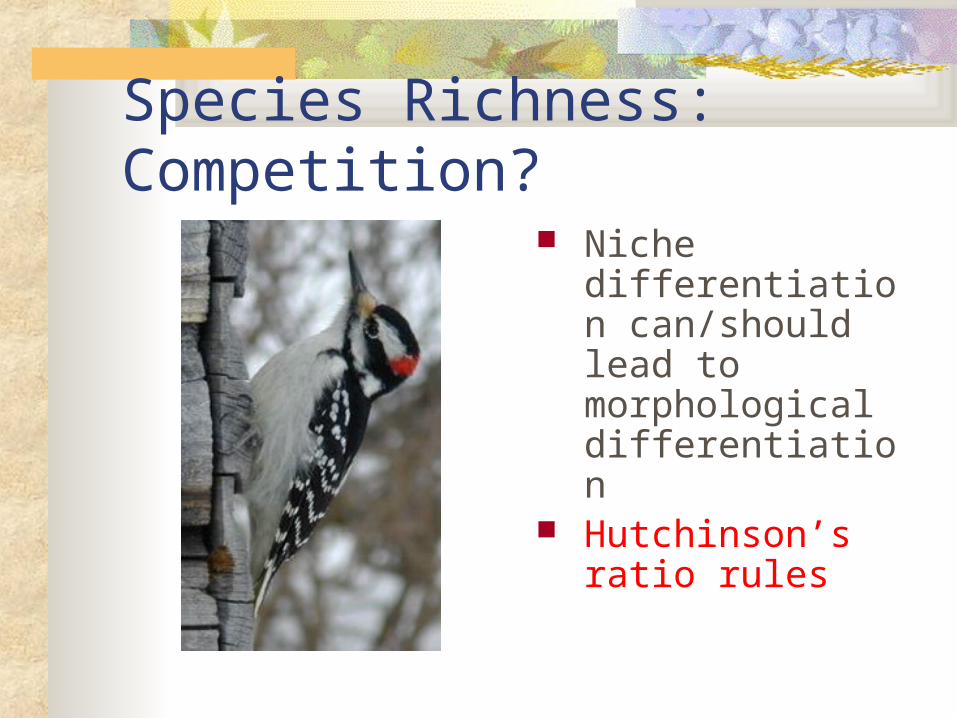
Species Richness: Competition? Niche differentiation
can/should lead to morphological differentiation
Hutchinson’s ratio rules
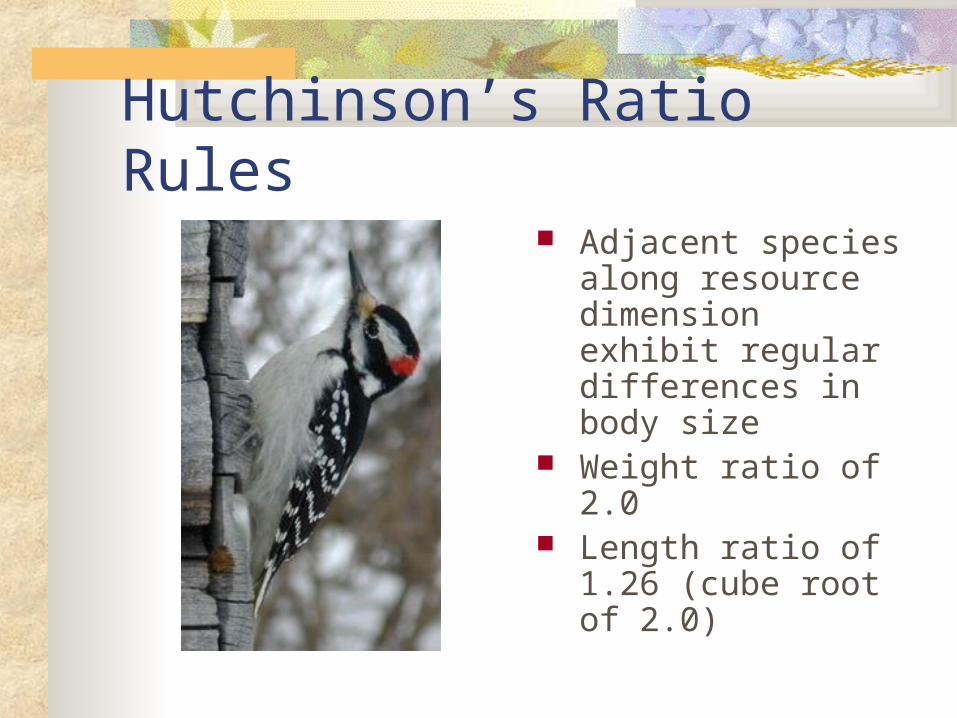
Hutchinson’s Ratio Rules Adjacent species
along resource dimension exhibit regular differences in body size
Weight ratio of 2.0 Length ratio of 1.26
(cube root of 2.0)

Regional WoodpeckersNuthatch4-5” (4.56)
Downy woodpecker5.75” (----)
Hairy woodpecker7.5” (7.24)
Y.-b. sapsucker7.75” (7.24)
Red-headed woodpecker7.5” (7.24)
Red-bellied woodpecker8.5” (9.13)
Flicker10.5-11” (11.5)
Pileated woodpecker15” (14.49)
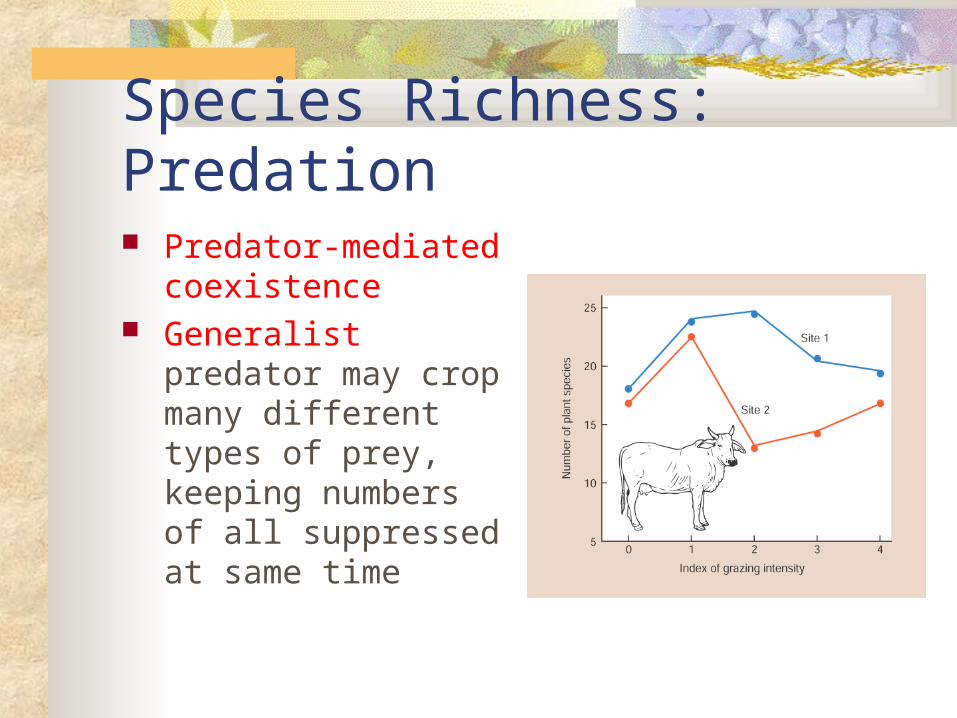
Species Richness: Predation Predator-mediated
coexistence Generalist predator
may crop many different types of prey, keeping numbers of all suppressed at same time
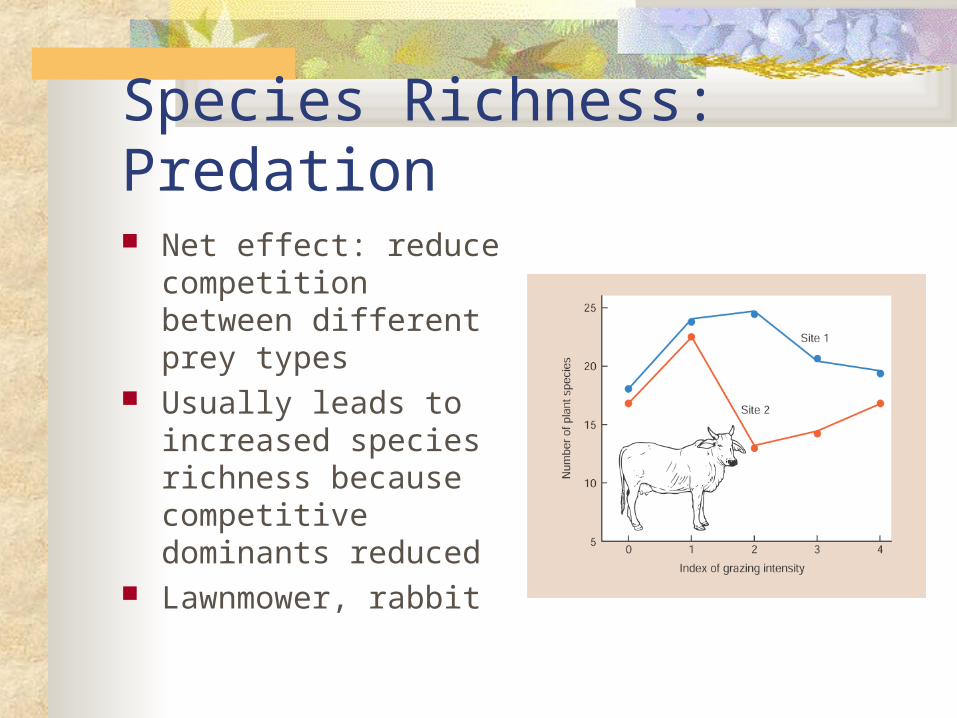
Species Richness: Predation Net effect: reduce
competition between different prey types
Usually leads to increased species richness because competitive dominants reduced
Lawnmower, rabbit
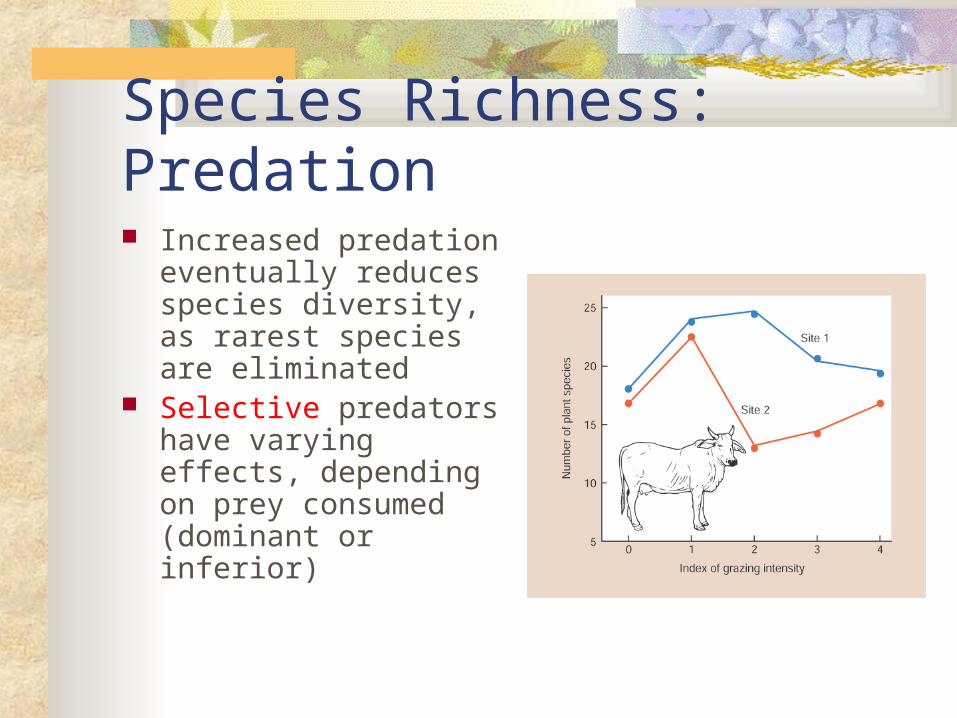
Species Richness: Predation Increased predation
eventually reduces species diversity, as rarest species are eliminated
Selective predators have varying effects, depending on prey consumed (dominant or inferior)
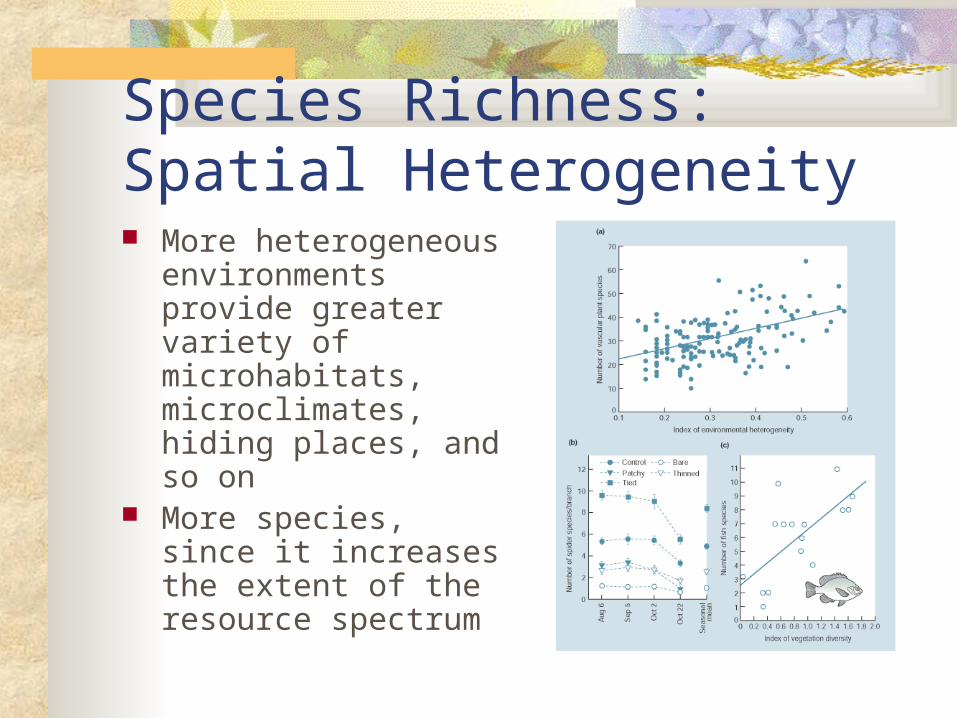
Species Richness: Spatial Heterogeneity More heterogeneous
environments provide greater variety of microhabitats, microclimates, hiding places, and so on
More species, since it increases the extent of the resource spectrum
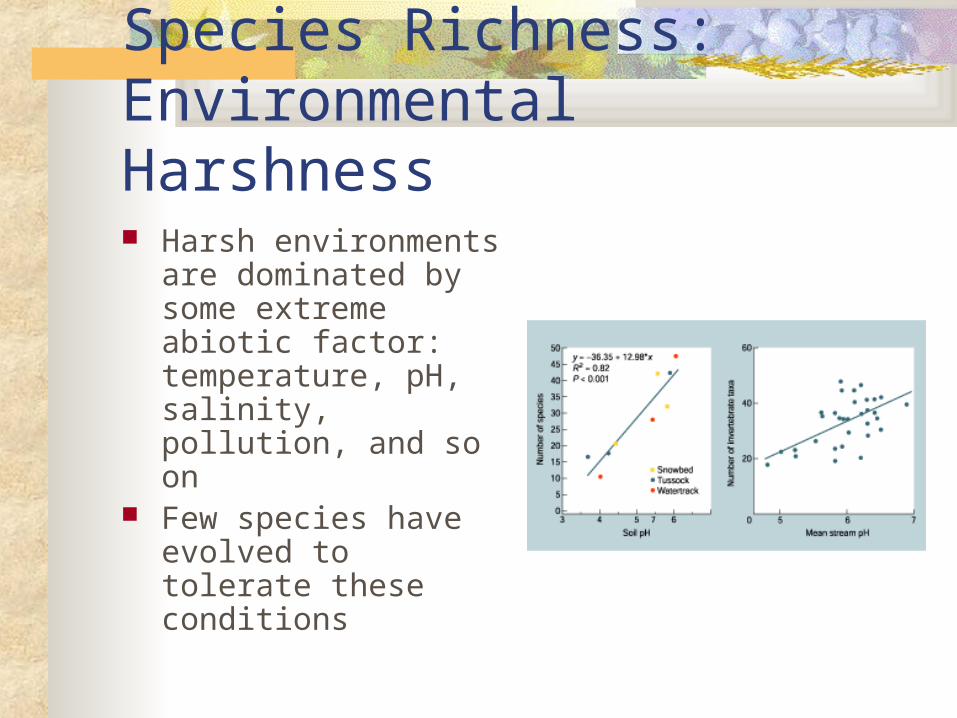
Species Richness: Environmental Harshness Harsh environments
are dominated by some extreme abiotic factor: temperature, pH, salinity, pollution, and so on
Few species have evolved to tolerate these conditions
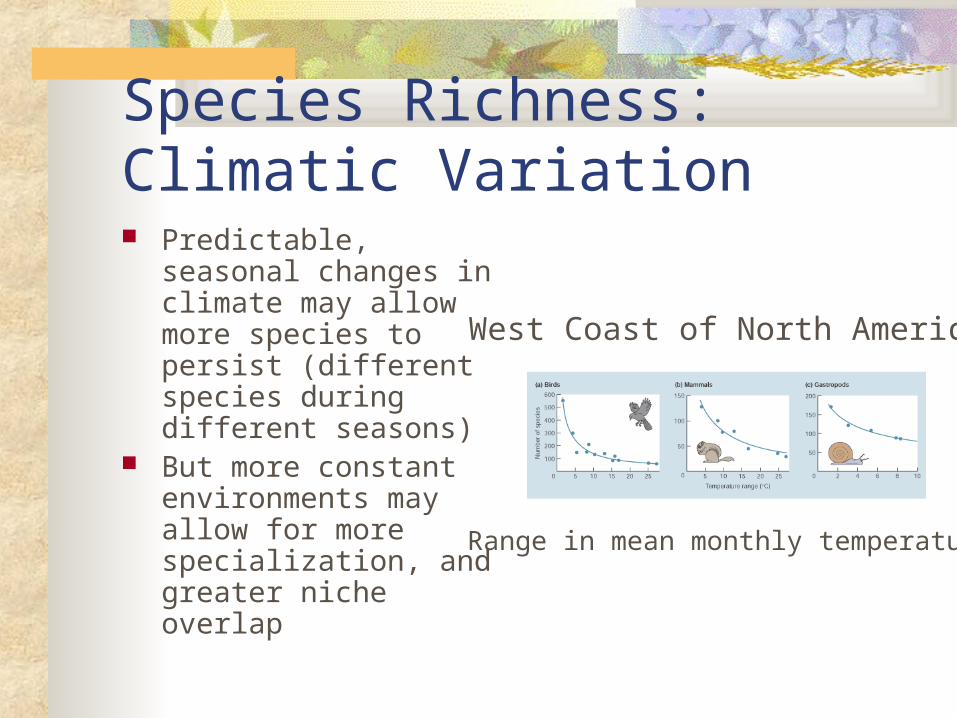
Species Richness: Climatic Variation Predictable, seasonal
changes in climate may allow more species to persist (different species during different seasons)
But more constant environments may allow for more specialization, and greater niche overlap
Range in mean monthly temperature
West Coast of North America
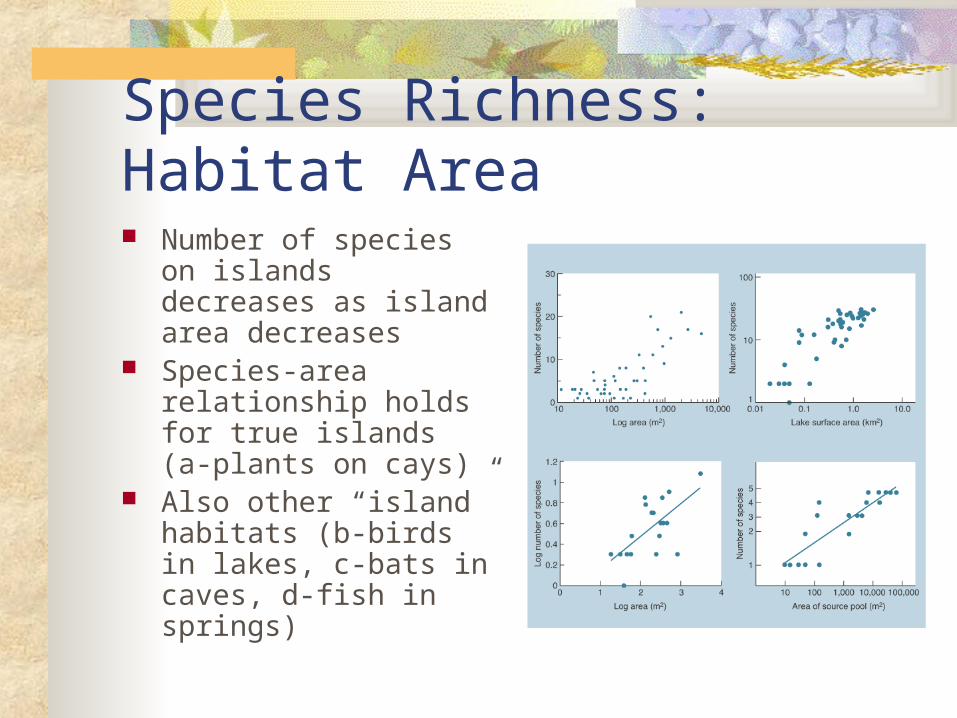
Species Richness: Habitat Area Number of species on
islands decreases as island area decreases
Species-area relationship holds for true islands (a-plants on cays)
Also other “island” habitats (b-birds in lakes, c-bats in caves, d-fish in springs)
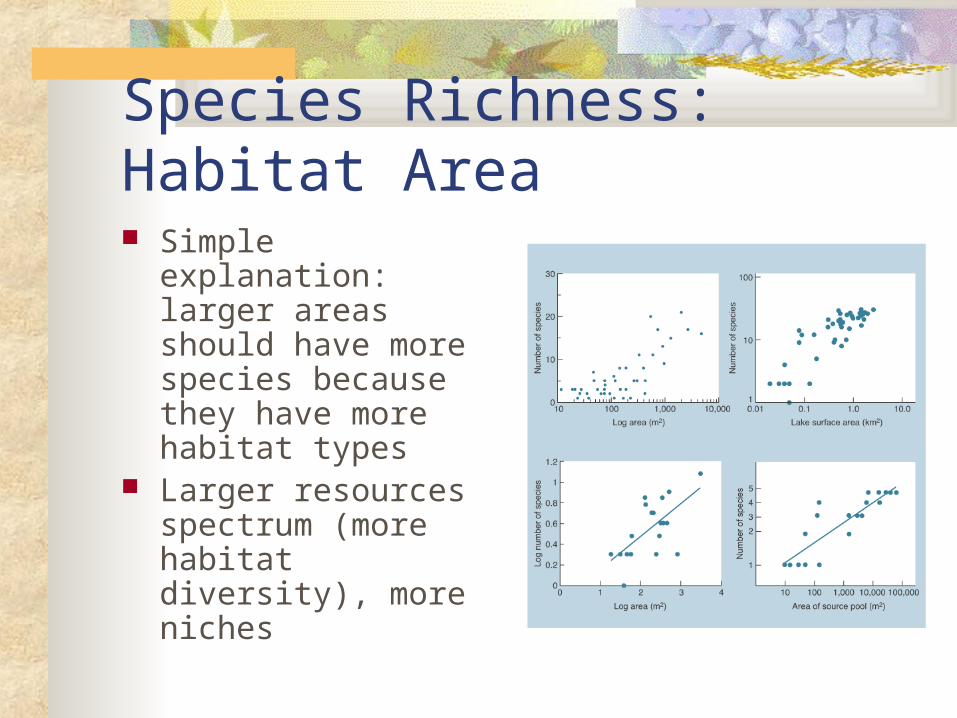
Species Richness: Habitat Area Simple explanation:
larger areas should have more species because they have more habitat types
Larger resources spectrum (more habitat diversity), more niches
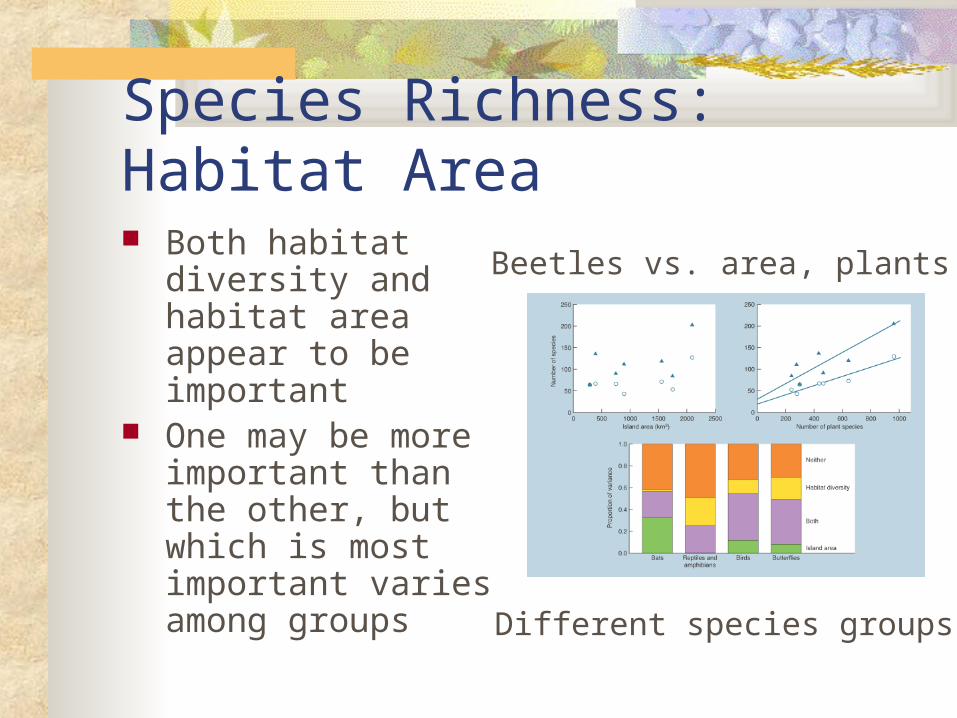
Species Richness: Habitat Area Both habitat diversity
and habitat area appear to be important
One may be more important than the other, but which is most important varies among groups
Beetles vs. area, plants
Different species groups
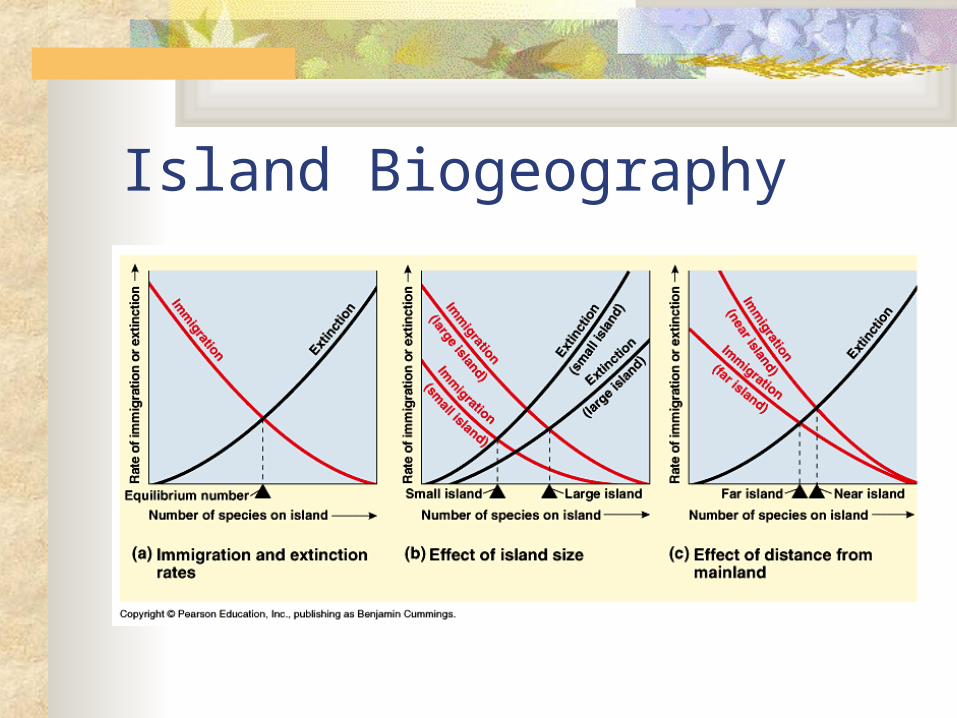
Island Biogeography Equilibrium theory of island biogeography
by MacArthur & Wilson (1967) Island size and isolation both play
important roles in determining number of species present on “islands”
Number of species is a balance between immigration and extinction, which vary with island size and isolation
Island Biogeography: Predictions Number of species should eventually
become constant through time Continual turnover of species, extinction
vs. immigration Large islands should support more species
than small islands Species number should decline with
remoteness (isolation) of an island
Island Biogeography
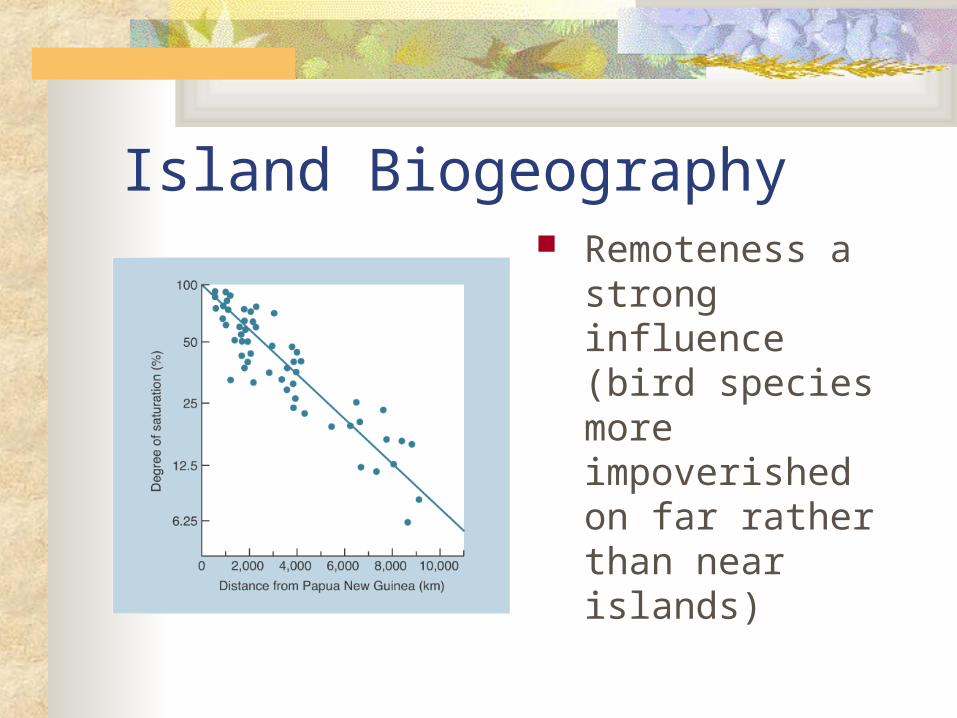
Island Biogeography Remoteness a strong
influence (bird species more impoverished on far rather than near islands)
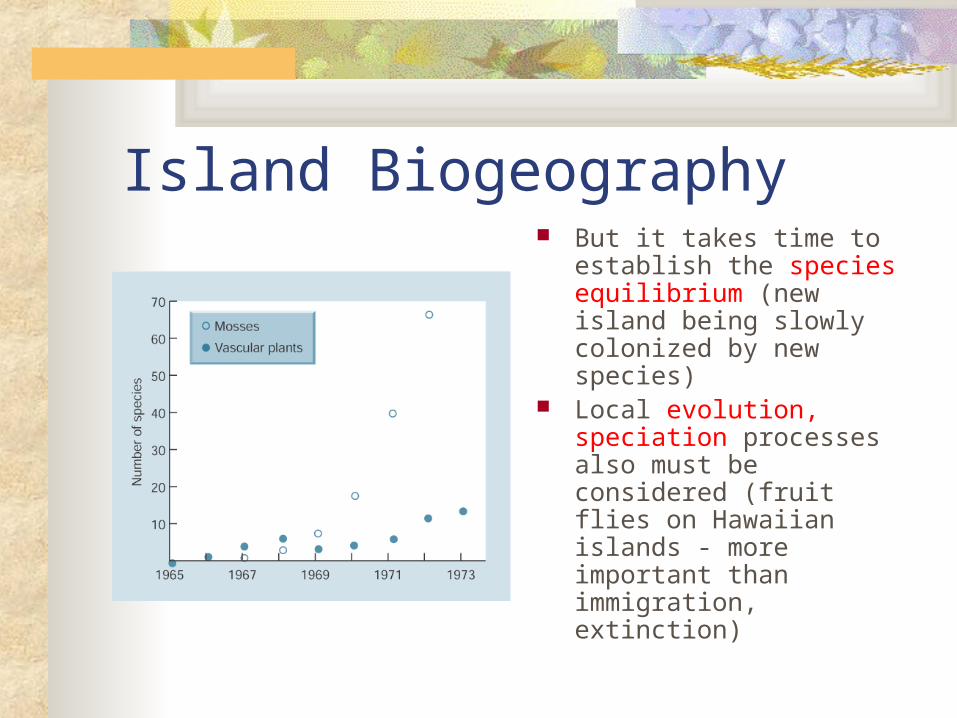
Island Biogeography But it takes time to
establish the species equilibrium (new island being slowly colonized by new species)
Local evolution, speciation processes also must be considered (fruit flies on Hawaiian islands - more important than immigration, extinction)

Species Richness: Latitude Increase in species
richness from poles to tropics (marine bivalves, butterflies, lizards, trees)
Pattern same in terrestrial, marine, freshwater habitats
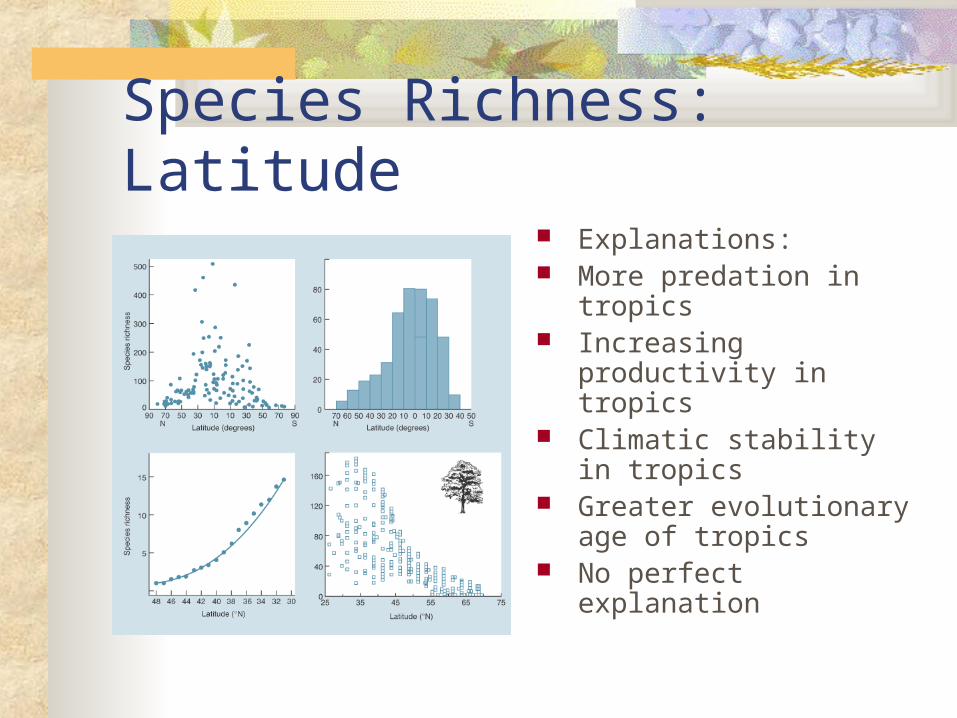
Species Richness: Latitude Explanations: More predation in tropics Increasing productivity in
tropics Climatic stability in
tropics Greater evolutionary age
of tropics No perfect explanation
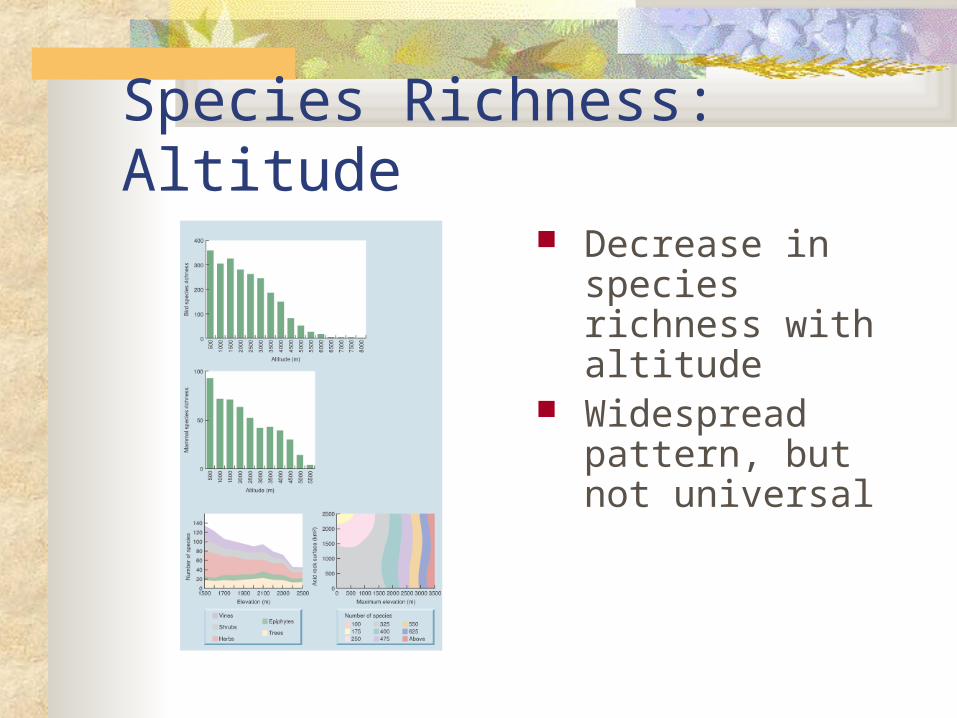
Species Richness: Altitude Decrease in species
richness with altitude Widespread pattern,
but not universal
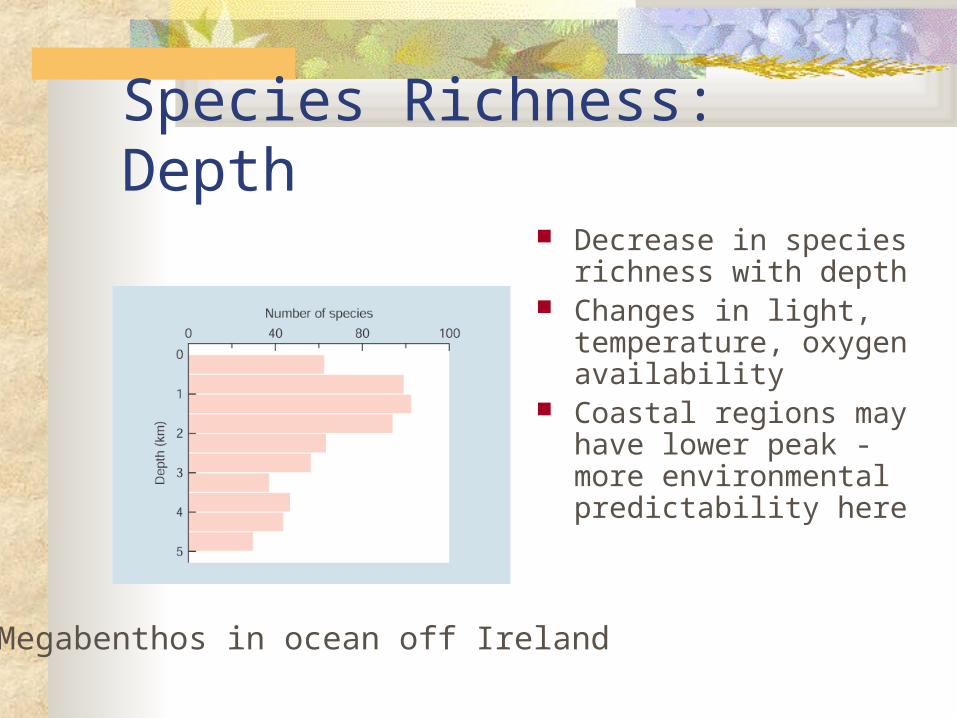
Species Richness: Depth Decrease in species
richness with depth Changes in light,
temperature, oxygen availability
Coastal regions may have lower peak - more environmental predictability here
Megabenthos in ocean off Ireland

Species Richness: Fossils Cambrian increase
(predator-mediated coexistence)
Permian decline (loss of habitats during Pangea
Competitive displacement among plant types
marine inverts land plants insects
amphibians reptiles mammals
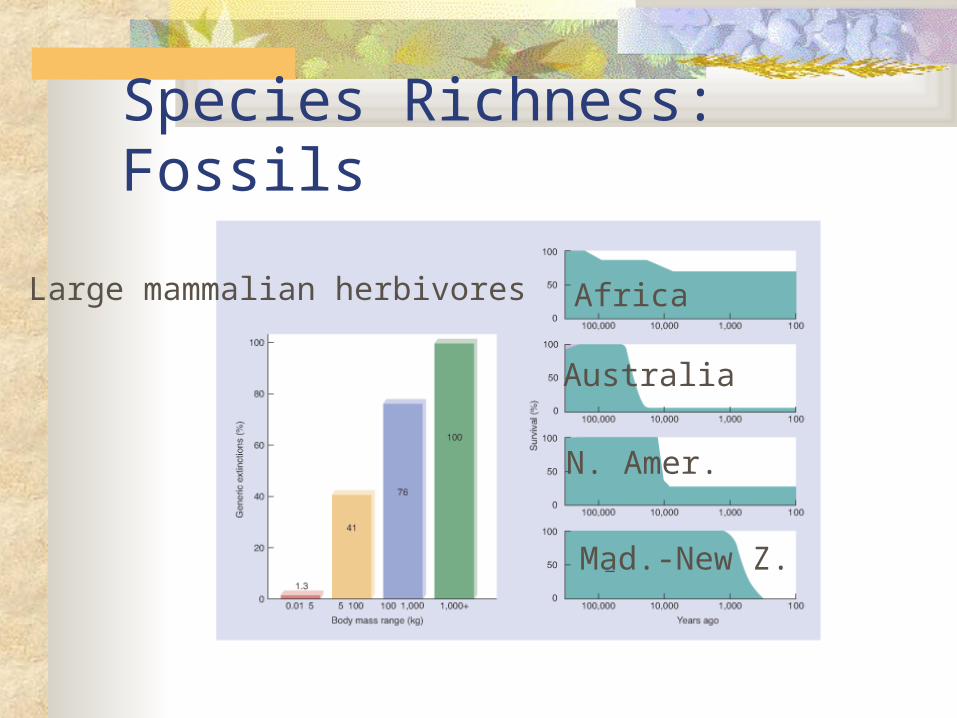
Species Richness: Fossils
Africa
Australia
N. Amer.
Mad.-New Z.
Large mammalian herbivores
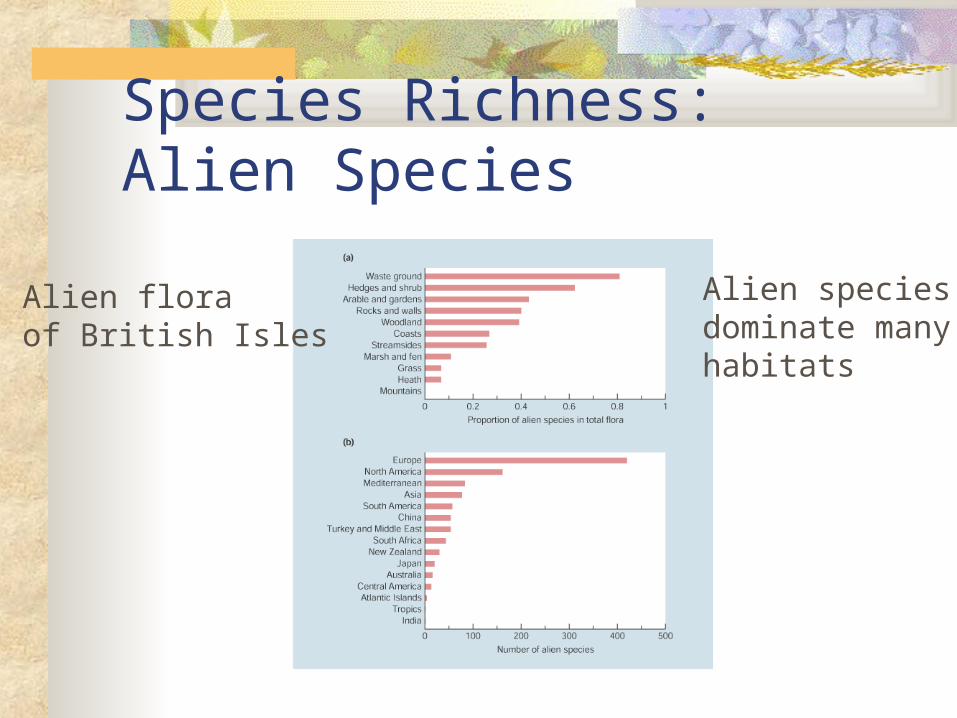
Species Richness: Alien Species
Alien floraof British Isles
Alien speciesdominate manyhabitats
Recommended