A data set from the Spartanburg Humane Society was provided with the hope that the use of GIS couldshow patterns and hotspots of dog and cat pickup locations. With a better understanding of where themajority of the animals come from, the Humane Society can better distribute their man power andresources to help as many homeless animals as possible.
According to Beck (1973) the main reasons for stray and abandoned animals is negligence causing petreleases or escapes, and also breeding. Therefore, finding and targeting areas where there are manystrays (potentially as a result of a release, escape, or breeding) is imperative to educating the peoplethere on the importance of overall pet care and spaying or neutering their pets. Other reasons for animalpickups by the Humane Society are listed in the data set and include anything from “moving” to“destructive”. In this study I identified statistically significant hotspots of cat and dog surrenders andstrays. The hotspot method was deemed an appropriate process through personal discretion and literatureon cluster analysis with crime data. Using spatial relationships, hotspots can show where there issignificantly higher animal location concentrations. Papers on crime data by Grubesic & Murray (2001)
along with Ratcliffe & McCullagh (1999) discussed different methods for calculating these spatial
relationships while taking into account the surrounding urban factors. Since population density is likely tobe a contributing factor to the number of animals present in an area, population density was factored intothe analysis or normalized to identify hotspots based on factors other than population. Hotspots were alsocalculated without normalizing for population in order to give the Spartanburg Humane Society a goodidea about where most of their animals are coming from despite the number of people there. This willassist in determining the best areas for resource distribution.
From the resultant maps, a drastic difference between the normalized andnon-normalized maps can be observed. The areas with the highest standardscores cluster around the Humane Society location. This is more than likelyattributed to the higher population density in the area and also theconvenience of distance. Based off of the hotspot calculations for all theanimal points (not normalized) the areas with a z-score between 1.7 and 6are the areas with the least chance of random clusters. On the maps thatare normalized for population, areas south and east of the Humane Societyshow the highest significant clustering. This might be a good area for theHumane Society to search for other reasons for why there may be a largequantity of animal pickups there.
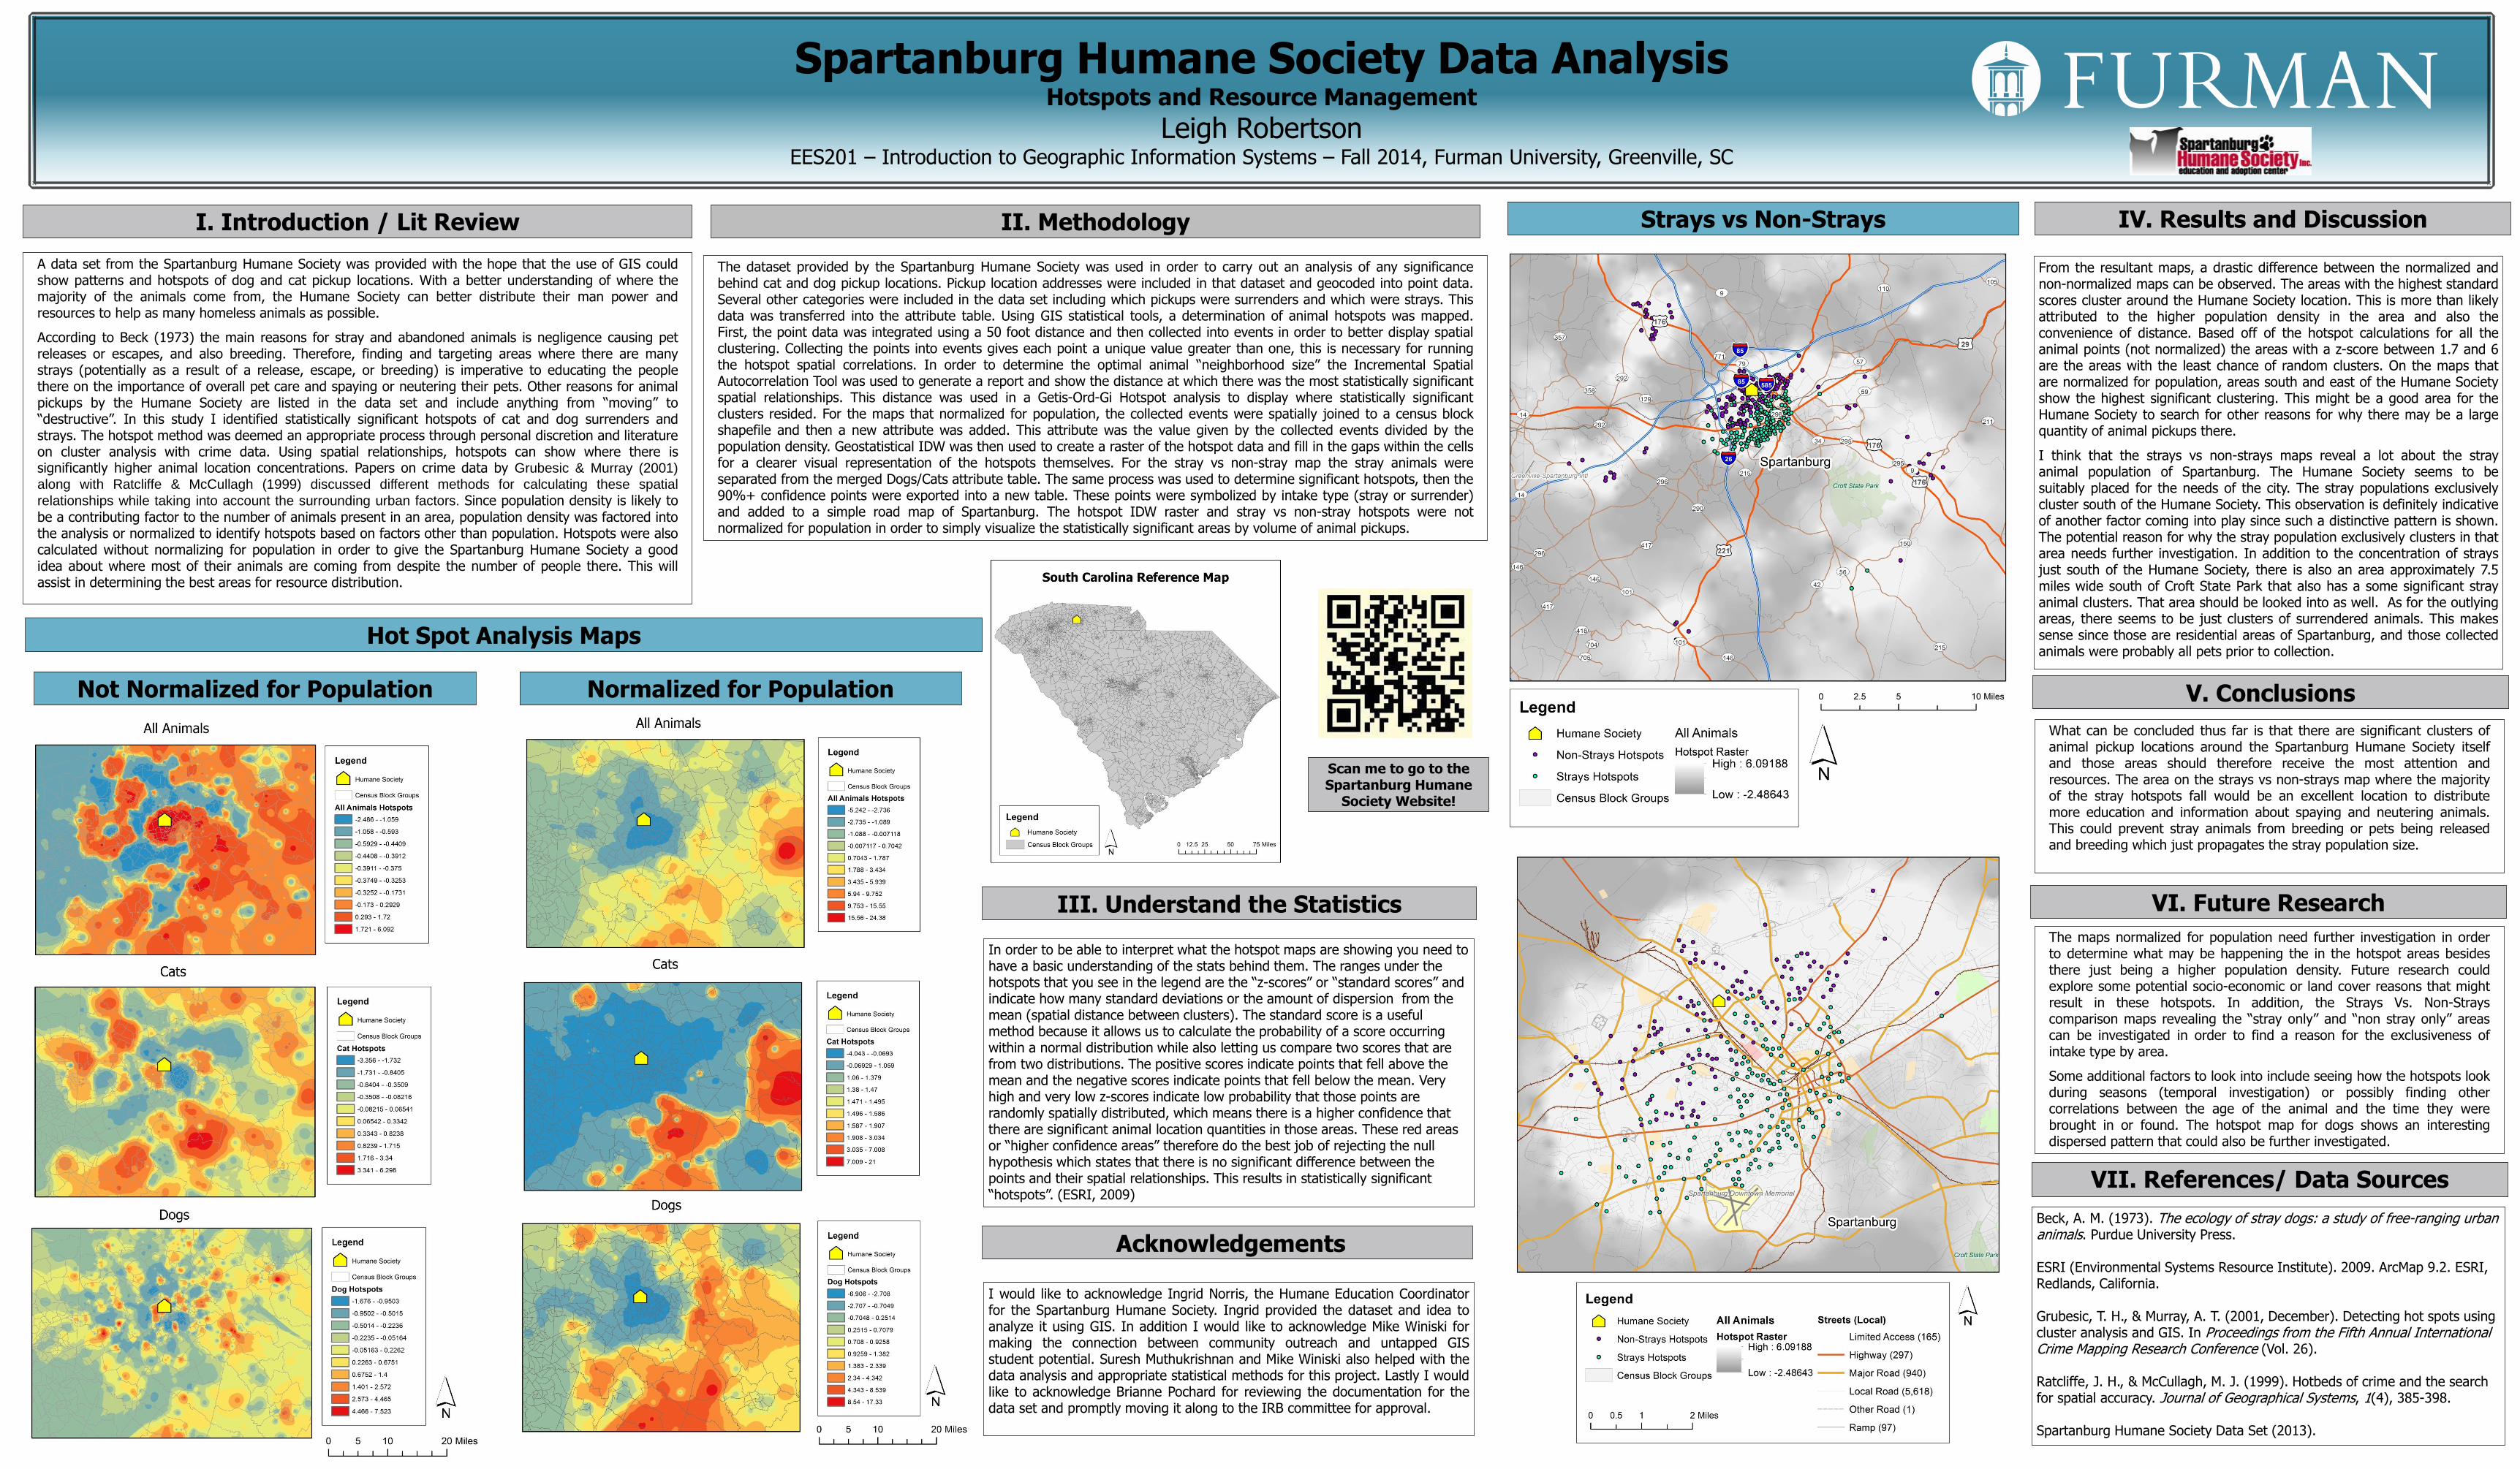
I think that the strays vs non-strays maps reveal a lot about the strayanimal population of Spartanburg. The Humane Society seems to besuitably placed for the needs of the city. The stray populations exclusivelycluster south of the Humane Society. This observation is definitely indicativeof another factor coming into play since such a distinctive pattern is shown.The potential reason for why the stray population exclusively clusters in thatarea needs further investigation. In addition to the concentration of straysjust south of the Humane Society, there is also an area approximately 7.5miles wide south of Croft State Park that also has a some significant strayanimal clusters. That area should be looked into as well. As for the outlyingareas, there seems to be just clusters of surrendered animals. This makessense since those are residential areas of Spartanburg, and those collectedanimals were probably all pets prior to collection.
Spartanburg Humane Society Data AnalysisHotspots and Resource Management
Leigh RobertsonEES201 – Introduction to Geographic Information Systems – Fall 2014, Furman University, Greenville, SC
IV. Results and DiscussionI. Introduction / Lit Review II. Methodology
Acknowledgements
VI. Future Research
VII. References/ Data Sources
V. Conclusions
The dataset provided by the Spartanburg Humane Society was used in order to carry out an analysis of any significancebehind cat and dog pickup locations. Pickup location addresses were included in that dataset and geocoded into point data.Several other categories were included in the data set including which pickups were surrenders and which were strays. Thisdata was transferred into the attribute table. Using GIS statistical tools, a determination of animal hotspots was mapped.First, the point data was integrated using a 50 foot distance and then collected into events in order to better display spatialclustering. Collecting the points into events gives each point a unique value greater than one, this is necessary for runningthe hotspot spatial correlations. In order to determine the optimal animal “neighborhood size” the Incremental SpatialAutocorrelation Tool was used to generate a report and show the distance at which there was the most statistically significantspatial relationships. This distance was used in a Getis-Ord-Gi Hotspot analysis to display where statistically significantclusters resided. For the maps that normalized for population, the collected events were spatially joined to a census blockshapefile and then a new attribute was added. This attribute was the value given by the collected events divided by thepopulation density. Geostatistical IDW was then used to create a raster of the hotspot data and fill in the gaps within the cellsfor a clearer visual representation of the hotspots themselves. For the stray vs non-stray map the stray animals wereseparated from the merged Dogs/Cats attribute table. The same process was used to determine significant hotspots, then the90%+ confidence points were exported into a new table. These points were symbolized by intake type (stray or surrender)and added to a simple road map of Spartanburg. The hotspot IDW raster and stray vs non-stray hotspots were notnormalized for population in order to simply visualize the statistically significant areas by volume of animal pickups.
The maps normalized for population need further investigation in orderto determine what may be happening the in the hotspot areas besidesthere just being a higher population density. Future research couldexplore some potential socio-economic or land cover reasons that mightresult in these hotspots. In addition, the Strays Vs. Non-Strayscomparison maps revealing the “stray only” and “non stray only” areascan be investigated in order to find a reason for the exclusiveness ofintake type by area.
Some additional factors to look into include seeing how the hotspots lookduring seasons (temporal investigation) or possibly finding othercorrelations between the age of the animal and the time they werebrought in or found. The hotspot map for dogs shows an interestingdispersed pattern that could also be further investigated.
What can be concluded thus far is that there are significant clusters ofanimal pickup locations around the Spartanburg Humane Society itselfand those areas should therefore receive the most attention andresources. The area on the strays vs non-strays map where the majorityof the stray hotspots fall would be an excellent location to distributemore education and information about spaying and neutering animals.This could prevent stray animals from breeding or pets being releasedand breeding which just propagates the stray population size.
I would like to acknowledge Ingrid Norris, the Humane Education Coordinatorfor the Spartanburg Humane Society. Ingrid provided the dataset and idea toanalyze it using GIS. In addition I would like to acknowledge Mike Winiski formaking the connection between community outreach and untapped GISstudent potential. Suresh Muthukrishnan and Mike Winiski also helped with thedata analysis and appropriate statistical methods for this project. Lastly I wouldlike to acknowledge Brianne Pochard for reviewing the documentation for thedata set and promptly moving it along to the IRB committee for approval.
In order to be able to interpret what the hotspot maps are showing you need to have a basic understanding of the stats behind them. The ranges under the hotspots that you see in the legend are the “z-scores” or “standard scores” and indicate how many standard deviations or the amount of dispersion from the mean (spatial distance between clusters). The standard score is a useful method because it allows us to calculate the probability of a score occurring within a normal distribution while also letting us compare two scores that are from two distributions. The positive scores indicate points that fell above the mean and the negative scores indicate points that fell below the mean. Very high and very low z-scores indicate low probability that those points are randomly spatially distributed, which means there is a higher confidence that there are significant animal location quantities in those areas. These red areas or “higher confidence areas” therefore do the best job of rejecting the null hypothesis which states that there is no significant difference between the points and their spatial relationships. This results in statistically significant “hotspots”. (ESRI, 2009)
Hot Spot Analysis Maps
Strays vs Non-Strays
Normalized for PopulationNot Normalized for Population
Scan me to go to the Spartanburg Humane
Society Website!
III. Understand the Statistics
Beck, A. M. (1973). The ecology of stray dogs: a study of free-ranging urban animals. Purdue University Press.
ESRI (Environmental Systems Resource Institute). 2009. ArcMap 9.2. ESRI, Redlands, California.
Grubesic, T. H., & Murray, A. T. (2001, December). Detecting hot spots using cluster analysis and GIS. In Proceedings from the Fifth Annual International Crime Mapping Research Conference (Vol. 26).
Ratcliffe, J. H., & McCullagh, M. J. (1999). Hotbeds of crime and the search for spatial accuracy. Journal of Geographical Systems, 1(4), 385-398.
Spartanburg Humane Society Data Set (2013).
Recommended