POVERTY AND RURAL LIVELIHOODS IN SELECTED SITES
IN UGANDA, MALAWI AND TANZANIA
Soniia David
Occasional Publications Series, No. 41
May 2003

Correct citation:
S. David, 2003. Poverty and rural livelihoods in selected sites in Uganda, Malawi and Tanzania. Occasional
Publications Series, No. 41, CIAT, Kampala, Uganda.

i
TABLE OF CONTENTS
Preface ………………………………………………………………………………......................... iii
Acknowledgements……………………………………………………................................…....… v
Acronyms………………………………………………………………………….............................. vi
1. Introduction……………………………………………………………………............................... 1
Organisation of the report……………………………………………………….......................................2
Methodology………………………………………………………………..............................................3
Site description…………………………………………………………....................................................4
2. Rubaya sub-county, Kabale District, Uganda…………………………….......................…………. 6
Demographic profile of surveyed households…………………………...................................….......……. 6
Household resources, poverty and vulnerability…………………………....................................……….7
Farmers’ investment aspirations…………..........……………………………….................................9
Agricultural production………........…………………………………………….....................................…9
Crops……………….....…………………………………………………………...............................9
Livestock…………………......……………………………………………...................................11
Input use and seed sources……..........…………………………................................……………11
Marketing of agricultural produce……...........…………………………………………...................12
Land use and management………..……………………………………………….................................….13
Tree planting……………………………………………………………………..............................…….14
Food security…………………………………………………………………...........................…..…….15
Development activities……………………………………………………......................................…….16
Conflict, collective action and social capital………………………………….............................……….16
Marital conflict and decision-making…………………………………........................................……….18
3. Linthipe EPA, Dedza District, Malawi………………………………............................…..……….20
Demographic profile of surveyed households………………………….......................................……….20
Household resources, poverty and vulnerability…………………………................................………....20
Farmers’ investment aspirations…………………....……………………................................………….22
Agricultural production………………………………………………..................................…...……….23
Crops…………………………………………………………………………..........................……...….23
Livestock…………………………………………………………………...................................……….25
Input use and seed sources…………………………………………………................................……….26
Marketing of agricultural produce…………………………………….................................…………….26
Land use and management……………………………………………………................................…….27
Tree planting………………………………………………………..........................………....………….28
Food security……………………………………………………………………..............................……28
Development activities……………………………………………………......................................…….30
Conflict, collective action and social capital…………………………..........................………...……….30
Marital conflict and decision-making…………………………………........................................……….32

ii
4. Soni Ward, Lushoto District, Tanzania ……………………………………….................…….33
Demographic profile of surveyed households …………………………….................................…….33
Household resources, poverty and vulnerability ………………………….......................……….33
Farmers’ investment aspirations ………………………………………………..........................…..35
Agricultural production …………………………………………………….........................…….36
Crops ……………………………………………………………………....................…….36
Livestock ……………………………………………………………………….............................….37
Input use and seed sources ………………………………………………………...........................….37
Marketing of crop and livestock produce ………………………………………...............................…..38
Land management …………………………………….………………………….......................…..39
Food security …………………………………………………………………...........................39
Development activities ………………………………………………………….......................................40
Conflict, collective action and social capital ……………………………………….......................…..40
Marital conflict and decision-making ………………………………………….........................42
5. Across site comparison and recommendations …………………………..........................………..44
Agricultural production and livelihood activities ……………………………….........................…44
Asset ownership ………………………………………………………………...................................….46
Vulnerability ……………………………………………………………………......................……..47
Appendices ……………………………………………………………………......................……..49
References……………………………………………………………………...............................……..61

iii
PREFACE
While increasing food supply is often a necessary condition for improving food security, increases in food
supply and rural incomes do not guarantee improved rural livelihoods and food security at the household
level. The alleviation of poverty requires that the research community go beyond contributions to improving
food supply from new agricultural technologies to working with the development community in better
understanding both the underlying causes of poverty and in identifying- and confirming-effective ways to
catalyze an “upward spiral” managed by rural households and communities.
CIAT and its partners, in Africa as elsewhere in the World, have a long record in developing and adapting
farmer participatory approaches while devising agricultural technologies that can be used by development
partners in addressing equity and gender concerns. The work reported here was carried out within a
collaborative project that extends that research approach to an emphasis on integrated community
development - building on gains in bean productivity but going beyond productivity issues.
This baseline survey of pilot sites in three countries of Eastern and Southern Africa is, for our research/
development partnership, an essential step in measuring the effectiveness of going “Beyond Agricultural
Productivity to Poverty Alleviation” (BAPPA) through a process that we hope will enable rural innovation
to flourish. By publishing this survey, we hope that others can also make use of the information, and we
look forward to exchanging experiences. We also summarise some interesting cross-site comparisons of
potential indictors of household and community well-being.
This Occasional Papers series includes research reports and network discussion papers, and is
complemented by two associated series: Workshop Proceedings and Reprints. These publications serve to
disseminate research information from activities in which CIAT and its partners are involved in Africa,
including the work of two sub-regional networks of national bean programs: the Eastern and Central Africa
Bean Research Network (ECABREN) and the Southern Africa Bean Research Network (SABRN) for southern
Africa.
Financial support for this series comes from: the Canadian International Development Agency (CIDA); the
Swiss Agency for Development and Cooperation (SDC); the United States Agency for International
Development (USAID); and the African Development Bank through the Southern Africa Development
Conference (SADC).
Further information on CIAT in Africa is available from:
The Africa Coordinator, CIAT, P.O. Box 6247, Kampala, Uganda.
The Coordinator, Eastern and Central Africa Bean Research Network, Selian Agricultural Research
Institute, P.O. Box 2704, Arusha, Tanzania.
The Coordinator, Southern Africa Bean Research Network, Chitedze Research Station, P.O. Box
158, Lilongwe 3, Malawi.
The Director, Tropical Soil Biology and Fertility (TSBF) Institute of CIAT, c/o ICRAF, P.O. Box
30677, Nairobi, Kenya.


v
ACKNOWLEDGEMENTS
Many individuals and institutions contributed to this study. I am most indebted to Eunice Kyomugisha, who
led and supervised the surveys in Uganda and Tanzania, and to Noel Sangole, who led and supervised the
survey in Malawi. The hard work of all enumerators who took part in the surveys is gratefully
acknowledged.
I am grateful to all BAPPA collaborators and institutions, Africare in Uganda, Concern Universal-Malawi
and Traditional Irrigation and Environmental Development Organization (TIP) in Tanzania. Without the
assistance of Charles Musoke, Michael Besigye, James Bariyanga (Africare, Kabale), Jacob Mapemba
(Concern Universal, Dedza) and Samuel ole Saiguran (TIP), this study would not have been completed.
Colletah Chitsike, Susan Kaaria, Pascal Sanginga, Roger Kirkby and Rupert Best of CIAT provided
valuable comments on earlier drafts.
Support to the BAPPA Project, and for the research reported here, was provided by the Canadian
International Development Agency (CIDA) and the Swiss Agency for Development and Cooperation (SDC).
The opinions expressed herein are those of the author and do not necessarily reflect the views of
contributing donor organizations.

vi
ACRONYMS
AEW - Adult Equivalent Workers
AHI - African Highlands Initiative
ARDC - Agricultural Research Development Centre
BAPPA - Beyond Agricultural Productivity to Poverty Alleviation
CGIAR - Consultative Group for International Agricultural Research
CIAT - International Centre for Tropical Agriculture
CIDA - Canadian International Development Agency
CU - Concern Universal
ECABREN- Eastern and Central Africa Bean Research Network
EPA - Extension Planning Area [Malawi]
NARO - National Agricultural Research Organisation [Uganda]
NGO - Non-Government Organisation
PRAs - Participatory Rural Appraisals
SABRN - Southern Africa Bean Research Network
SDC - Swiss Agency for Development and Cooperation
TIP - Traditional Irrigation and Environmental Development Organization
TSBF - Tropical Soil Biology and Fertility
USAID - United States Agency for International Development

1
1. INTRODUCTION
In 2001, the International Centre for Tropical Agriculture (CIAT) embarked on a new project entitled
“Beyond Agricultural Productivity to Poverty Alleviation” (BAPPA). CIAT, one of the Future Harvest
Centres of the CGIAR (Consultative Group on International Agricultural Research), has worked in Eastern
and Southern Africa since the early 1980s in partnership with national research and development partners.
CIAT’s mission is to reduce hunger and poverty in the tropics through collaborative research that improves
agricultural productivity and natural resource management. Until recently, CIAT’s focus in Africa has been
on improving the productivity of the common bean, an important food and cash crop for millions of
small-scale African farmers. Key achievements of CIAT through numerous institutional partnerships to date
include:
• Demonstrable impacts of new bean varieties at the household and community levels (e.g. David, 2000,
Odendo et al., 2003). In Uganda, for example, a productive and tasty new bean is greatly appreciated by
women farmers and enabled them to increase their storage in the dry season and to spend less or no time
in searching for wild vegetables;
• By 2000, at least US$ 150 million of economic benefits in just five countries;
• Innovative and low-cost approaches to promoting crop, soil and pest management techniques for
sustaining farmers’ natural resource base, including the use of rural schools, clinics, traditional drama,
radio, posters and farmer group visits across countries;
• Better understanding of the preferences of user groups, including the specific needs of female farmers;
• The development and promotion of community-based participatory research, now reaching pilot
communities in at least six countries;
• Approaches developed for sustainable seed supply.
To achieve the broader goal of poverty alleviation, CIAT and its partners need to go beyond improving food
supply to address the underlying causes of poverty. The BAPPA project represents a greater emphasis in
CIAT’s work on integrated community development, building on gains in bean productivity, but going
beyond productivity issues.
While increasing food supply is often a necessary condition for improving food security, increases in food
supply and rural incomes do not guarantee improved rural livelihoods and food security at the household
level. Farmers’ financial benefits from agriculture are often reduced by their limited opportunities for
adding value to their agricultural produce, poor marketing information and low bargaining power with
middlemen. Unless resolved at the household level, factors such as chronic disease, lack of clean drinking
water, gender bias, poor knowledge of nutrition and socio-cultural practices, may undermine the adequate
utilization of available food.
The BAPPA project aims to address the bottlenecks that hinder farmers from benefiting fully from research
generated agricultural technologies and, in so doing, to learn lessons that would be more widely applicable.
Recognizing that none of this is new territory to many NGOs, the project’s strategy to achieve this objective
involves forming strong, holistic, interdisciplinary partnerships with development organizations. The project
aims to produce outputs in five areas:
1. Catalyze improved organizational capacity in pilot communities
2. Support farmers’ experimentation and application of technical skills
3. Develop an approach to strengthen community capacity to invest their potentially higher income in
alleviating poverty
4. Assist farming communities to protect their environmental resources

2
5. Support women’s empowerment and leadership at the community level
The BAPPA project works in 3 pilot sites in Eastern and Southern Africa: Kabale District in south-western
Uganda, Dedza District in central Malawi and Lushoto District in northern Tanzania. These sites were
selected on the basis of two main criteria: impact achieved from bean technologies and presence of a willing
NGO collaborator. In Kabale, the project started operating in May 2001in two villages in Rubaya
Sub-county, in collaboration with Africare, a U.S. based NGO. Concern Universal (CU), a U.K based NGO,
implemented the project in two villages in Linthipe EPA for one year starting in July 2001; although CU
withdrew in 2002 the activities have continued. In Lushoto District of Tanzania, the project operates in one
village in Soni Ward and is implemented by the Traditional Irrigation and Environmental Development
Organization (TIP), a local NGO; activities were initiated in January 2002.
To monitor the impact of the project and assess change, a baseline study was carried out during the first year.
This report presents the results of that study. The study was loosely based on the sustainable livelihoods
framework (Carney, 1998) which focuses on a comprehensive view of the livelihood circumstances of the
poor, including ownership of assets, livelihood activities, factors contributing to their vulnerability and the
relationship between relevant factors at micro, intermediate and macro levels.
Organisation of the report
This report is divided into 4 sections. After the sections on methodology and site descriptions, results from
the three sites are presented separately. The final section provides a cross-site comparative analysis.
The paper explores the following dimensions of rural livelihoods in relation to the 5 project outputs
(indicated in parentheses):
• Household resources (output 3)
• Poverty and vulnerability (outputs 3 and 5)
• Social capital, participation and conflict (outputs 1 and 2)
• Agricultural production and food security (output 3)
• Land use and management (output 4)
• Gender relations (output 5)
Social capital is commonly defined as “features of social organization, such as networks, norms and social
trust that facilitate coordination and cooperation for mutual benefit” (Putnam, 1995). Three connected types
of social capital can be identified:
• Bonding social capital - strong ties between people in similar circumstances.
• Bridging social capital - weaker ties between people from different ethnic, geographical and
occupational backgrounds but who have similar economic status and political influence which helps
them to access additional resources and networks.
• Linking social capital - ties between the poor and people in positions of influence in formal institutions
(e.g. banks, schools, housing authorities, rural service providers).

Areas of conflict and decision-making patterns
among married couples and differences in
perceptions by husbands and wives, school
attendance by boys and girls, differences in
livelihood assets and strategies of men and women
(see above indicators)
Table 1.1: Indicators used to measure livelihood variables related to the project’s main outputs.
Variable Indicators Comments
Livelihood
assets
Sex and age of head of household, household
size, educational and literacy level of the
head of household and partner, number of
school age children out of school, household
labour, dependency ratio, annual agricultural
income, sources and importance of non-farm
income, ownership of livestock
Successful asset accumulation “often
involves trading-up assets in sequence” e.g.
chickens to goats to cattle to land (Ellis et
al., 2002); no information was collected on
overall household income
Social capital
and conflict
Group membership, technology/knowledge
diffusion pathways, participation in NGO
activities, participation in collective action,
social divisions and conflict, changes in the level
of theft in the past 10 years
The existence of indigenous groups and
technology and information diffusion
pathways are indicators of the bonds of
social trust and social networks; participation
in NGO activities is a measure of linking
social capital
Poverty and
vulnerability
Household wealth status, borrowing and saving
behaviour, investment priorities, coping
strategies in emergencies
Rising prosperity depends on having multiple
opportunities for asset accumulation.
Respondents were asked what they would
invest in if their income were to double.
Agricultural
production
Crops produced and purpose, multiplication rate
of major crops, adoption of modern crop varieties,
use of inputs, seed sources, proportion of crops
sold, marketing constraints
Food security Food shortages, how long the harvest lasts, reasons
for food shortage, number of meals eaten during the
hungry season
Land use and
management
Location of farm land, erosion control measures,
measures for improving soil fertility, tree planting
behaviour
Participation Optimism about the ability to bring about positive
change locally, willingness for children to become
small-scale farmers
The extent to which people are willing to act
collectively to solve social problems is a
good indication of the level of social
cohesion
Gender and gender
relations
3
Methodology
Both participatory rural appraisals (PRAs) and formal surveys were used to collect baseline data in the three
study sites. PRAs were conducted over one to two days and involved activities such as visioning and group
discussions on the gender division of labour, wealth ranking, prices and crop calendar. Formal surveys took
place during the first season of project activities: November 2001 in Rubaya, November-December 2001 in
Linthipe and June 2002 in Soni. Key informants from each study village were involved in wealth ranking
and the results used to assign surveyed households to wealth groups. Since wealth categories identified in
the three sites are not necessarily comparable (i.e. to be wealthy in Soni is not the same as being wealthy in
Linthipe), descriptions of wealth are provided in the appendix.

Total sample size 92 169 121 275 83 576
Table 1.2: Sample size (number of households)
Rubaya, Uganda Linthipe, Malawi Soni, Tanzania
Sample Number of
households
Sample Number of
households
Sample Number of
households
Project
villagesMuguli B: 32
Kalambo: 30
63
53
Mnthala: 49
Yazini: 31
160
36
Shashui: 53 107
Non-project
village
Rukore: 30 53 Chikonde: 41 79 Vuga: 30 469
Data analysis relied on descriptive statistics, namely frequencies, means, chi square, t tests and ANOVA to
compare means. To assess and compare men’s and women’s investment priorities more accurately,
frequencies and ranked data were converted to scores. A score of “1” was given non-ranked responses and
“0” for non-responses. Ranked responses were allocated scores of 2, 3 or 4 according to importance.
Throughout the report, variation within study communities was analyzed along three dimensions: wealth,
gender and location (village and country) with the objective of exploring how social differentiation affects
people’s experience of poverty.
Site description
Rubaya (Uganda)
Rubaya Sub-county is located in Kabale District in the highlands of south-western Uganda. The sub-county
covers 114 square kilometers and has an estimated population of 46,800 people. Rubaya consists of 8
administrative parishes, two of which, Mugandu (Muguli B, Rukore) and Buramba (Kalambo), were
sampled for the baseline survey. It is located in the Katuna watershed where agricultural production takes
place in valley bottoms, steep hillsides and hilltops. Land in the valley bottoms is owned by community
members and the Catholic and Protestant churches. Rubaya sub-county had 22 primary schools, 4 secondary
schools and 1 technical school. At the time of the study, there were two access roads; one passing through
Katuna border post and the other via Kacwekano Agricultural Research Development Centre (ARDC).
Most feeder roads were virtually impassable during the wet season, making transportation difficult. There
4
The formal survey covered a simple random sample of households from project villages plus a third nearby
non-project village. Table 1.2 shows the sample size and breakdown by location. Interviews were divided
into two parts: a first general section, addressed to farm couples, where applicable, and a second part
conducted individually with male and female farmers. The interview schedule covered the following topics:
household characteristics and resources, agricultural enterprises, use of inputs, marketing, environmental
issues, tree planting, household well being, savings and credit behaviour, group membership,
intra-household decision-making and conflict, social participation and conflict. All quantitative information
related to income, savings, borrowing and crops yields were based on farmer recall. Due to the unreliability
of income data collected through recall, farmers were only asked to report on agricultural income.
In Rubaya, 52% of the first part of the interview was conducted with women, 40% with farm couples and
8% with men alone. In Linthipe, 43% of interviews were held with couples, 37% with women alone and
20% with men alone. In Soni, 78% of interviews were conducted with couples, 19% with women alone and
2% with men alone.
was no electricity supply, but telephone connections existed through a mobile telecommunication network.
A sorghum-pea-bean-sweet potato based farming system is practiced in this high altitude, densely populated
area. There are two growing seasons: January to July (season A) and September to December (season B).
Ryakarimira was the nearest trading centre to the study villages. Bi-weekly markets were held there as well
as in Katuna, approximately 18 km away. The nearest health centre in Ryakarimira also offered family
planning services. Services were free but the centre had no medications. A private health centre was located
5 km away in Rwanda. Africare conducted nutrition training in Muguli B. Most villagers got water from
protected springs: there were 3 protected springs near Muguli B and Kalambo. The rate of HIV/AIDS
infection in the sub-county was thought to be relatively low, but moderate to high in neighbouring
sub-counties.
Linthipe (Malawi)
Linthipe EPA is located in Dedza District, central Malawi, along the Lilongwe-Blantyre highway. Linthipe
covers 1120 km2 and has a population of 160,000 people. Malawi has a unimodal rainfall pattern and the
Linthipe area receives an average of 800 mm falling between November and March. The single growing
season means that farmers must produce enough to last for a dry season that spans 7-8 months (April to
October). Maize is the most important food crop, with farmers commonly intercropping local varieties with
beans, pumpkin and minor vegetables. During the dry season, many farmers grow a dimba (off-season) and
watercourses (dambos) to take advantage of residual moisture.
A weekly market was held at Chimbiya Market, 10 kms from Mnthala. There were 30 primary schools and
5 community day schools in the area. Although most people were Christian, a sizable Muslim population
existed.
At village level, conditions in Mnthala were fairly representative of the wider area. There are two boreholes
in Mnthala that were constructed by the community and CU Malawi. Most families had no sanitation
facilities of any kind. Children attended two primary schools about 3 km away. A health centre was located
in the next village but no outreach services were available to Mnthala. The main causes of deaths were
malaria, cholera and HIV/AIDS. Conditions in Chikonde village appeared to be better than most villages
judging by the high proportion of households that fell in the top wealth category (83%). Affluence in Chikonde
may be attributed to the close ties that existed between this village and members of the Asian Muslim
community in Lilongwe through which villagers received clothes and money.
Soni (Tanzania)
Soni Ward is located in the southern part of Lushoto District (Tanga Region) in the highlands of the Usambara
Mountains in North-eastern Tanzania. The area is characterized by a maize-coffee based farming system.
There are two growing seasons: March to July (long rains) and September to December (short rains). Maize,
the main staple food crop, is typically intercropped with beans and sometimes coffee and bananas. Some
farmers in the area grew horticultural crops (vegetables, fruits) for urban markets in valley bottoms or on
hillsides using irrigation. Prior to 2000, TIP was involved in an irrigation project and organized farmers in
several villages in the Ward (including Shashui village) into water user groups to work on constructing
gravity borne traditional irrigation systems. The TIP project also focussed on organization development and
gender awareness. Other research and development projects operating in the Soni Ward at the time of the
study, or in the past, include SECAP (a project with an environmental focus that closed in 1998) and the
African Highlands Initiative (AHI) with which CIAT also collaborates in this site.
The nearest market is in Soni Town. Three primary schools were located near the village of Shashui (about
3 km) and there was a health dispensary 4 km away. The rate of HIV/AIDS infection was moderate to low:
in 2001, 5,620 cases were reported in Tanga Region, compared with 30, 320 cases in Mbeya, the hardest hit
region (Republic of Tanzania, 2001).
5

Table 1.3: Description of BAPPA project sites
1 To arrive at a single measure of household labour, children who work full time on the farm were counted as half of an adult working full
time, while children and adults who are part-time farm workers were counted as one third of a full time adult worker.
6
Altitude (m) 1800 1660 1300
Rainfall pattern/mm Bimodal/1000-1500 Unimodal/800 Bimodal
Population density
(persons/km2) 246 140 Not available but high
Market orientation Moderate Low High
Access to roads Good Good Moderate
Level of absolute poverty Moderate High Moderate
Major causes of poverty
Rubaya Sub-county
Uganda
Linthipe EPA
Malawi
Soni Ward
Tanzania
Low prices for agricultural
produce, lack of market
information
Small farm size, poor soil
fertility, environmental
degradation, low prices
for agricultural produce
Poor soil fertility,
drought, low agricultural
production
2. RUBAYA SUB-COUNTY, KABALE DISTRICT, UGANDA
Demographic profile of surveyed households
A total of 466 people lived in the 92 households surveyed in Rubaya: 200 in Muguli B, 136 in Rukore and
130 in Kalambo. Women, including many widows (Appendix Table 4), headed half of the households. This
figure is much higher than the national average of 23% and 2% respectively for de facto and de jure
female-headed households (Republic of Uganda, 1993). The high proportion of female-headed households
was mainly due to seasonal male migration to other parts of the country for work. Most male-headed
households (88%) had one wife. The mean age of male respondents was 42, compared with 37 for female
respondents. No child-headed households were included in the sample. Heads of households had lived in
their respective villages for most of their life, an average of 33 years. The Bakiga, a patrilineal, patrilocal
people, are the predominant ethnic group. Nearly all heads of households surveyed were Bakiga; 4% were
Banyankole.
Average household size in Rubaya was above the national average of 4.7 for rural areas (Government of
Uganda, 1993) (Appendix Table 5). On average, households in Muguli B were the largest with 6.2 members,
compared to 4.5 in Rukore and 4.3 in Kalambo.
The educational level of survey respondents was close to the average literacy rates for rural areas: 74% for
men and 47% for women (Government of Uganda, 1993). The majority of men surveyed (72%) could read
and write a local language and 34% could read and write English (Appendix Table 6). By contrast, 41% of
women could read and write a local language and only 13% were literate in English.
Among the 26% of households that had a school age child out of school, the number with girl and boy
dropouts was nearly equal (Appendix Table 7). Fifteen households had a girl out of school compared with
14 households with a boy out of school. A total of 22 girls were not attending school compared to 15 boys.
Notably, however, the major reason for girls not attending school (6 of 17 cases) was to take on domestic or
farming responsibilities, whereas lack of school fees was a key reason for both male (5 out of 14 cases) and
female (4 out of 17 cases) attrition.

2 US$ 1 = Ush. 1730
7
Household resources, poverty and vulnerability
Surveyed households had an average of 1.8 adult equivalent workers1 (AEWs) (Appendix Table 8) and a
mean of 1.4 adults involved full-time in farm work. Male-headed households had a significantly higher
number of AEWs than female-headed households: 2.1 compared with 1.5 (P ≤.003 for t test). Although
survey results indicates an equal number of men and women involved in agriculture full time or part time
(Appendix Table 8), information from PRAs, observation and other surveys (AHI, 1998; Puhalla, 1998)
suggest that in Kabale District generally, men’s involvement in agriculture is significantly lower than
women’s. The mean ratio of producers to consumers (people who do no farm work at all) was low at 1.7.
Informants identified three major wealth groups in Rubaya: wealthy, average and poor. A small fourth group,
the very poor, consisted mainly of households headed by elderly or handicapped people (Appendix Table 9).
As Table 2.1 shows, over half of surveyed households fell in the poor category. Notably, the standard of
living in Rukore was somewhat better, as a significantly lower proportion of households in that village
(30%) fell in the poor category, compared to 71% in project villages. There were significant differences
between wealth groups in terms of household size, household type, annual income, ownership of assets and
food security. Richer households were typically larger (a mean of 11 people compared to 5 in poor
households), tended to have a resident male head, had higher annual income and owned assets such as
livestock, a bicycle, radio and foam mattresses. Agricultural income data, though not highly accurate due to
respondents’ tendency to underreport income, shows the extent of poverty and indicates significant
differences between wealth groups (Table 2.1). Notably, female-headed households tended to be poorer: no
female-headed household fell in the wealthy category and on average, in 2001 they had a significantly lower
annual income compared to male-headed households (Ush 57,716 compared with Ush 153,371) 2 .
Table 2.1: Household differentiation by wealth on selected socio-economic characteristics, Rubaya
Household size 11.2 5.0 4.5 5.0 <0.001*
Per cent headed by women 0 38 62 51 <0.05
Adult equivalent workers 3.4 1.6 1.8 1.8 <0.001*
Annual agricultural income 454,000 125,826 57,144 111,782 <0.001*
(Ush), 2000-01
Owns livestock ( per cent) 100 65 57 62 <0.15
Owns a bicycle ( per cent) 80 12 0 9 <0.001
Owns a radio ( per cent) 100 42 8 26 <0.001
Owns a foam mattress (per cent) 100 82 41 60 <0.001
Wealthy
(n=5)
Average
(n=33)
Poor
(n=51)
Overall average
(N=92)
Probability
*Statistics from ANOVA; the rest from chi square
Most households earned their highest income between August and October, after season A harvest of the
major income earners (e.g. potatoes, sorghum), and their lowest income between April and June when crops
are still in the fields.
In addition to inter-household wealth differences, there was an income gap between men and women. Men
(53%) were more likely than women (36%) to engage in off-farm income generating activities and were
involved in more activities (a mean of 1.9 compared to 1.3). Women generally had more limited options for
making money due to their principal roles in farming, childcare and domestic work, limited mobility and
lower educational levels, and were typically involved in activities that yielded low returns (Appendix Table
10). The most important source of income for women was casual labour (52%), whereas men were engaged
in a wider range of activities, including casual labour and migration to tea plantations in Toro and Bunyoro.

8
Women in Rukore were more dependent on petty trade as a source of income, whereas beer brewing andhired labour were principal activities for women in project villages. Remittances are often an importantsource of capital for investing in agriculture but very few respondents in Rubaya reported receivingremittances.
The borrowing and saving behaviour of men and women was similar, although women’s greater povertywas reflected in the amounts they saved and borrowed (Appendix Table 11). Sixty-six per cent of surveyedmen and 68% of women saved money regularly, an average of Ush. 7,640 ($4) at a time for women and Ush.24,103 ($14) for men. Most (66% of men and 70% of women) saved on a monthly basis. As expected, thewealthy saved significantly higher amounts per time: an average of Ush 36,200 ($21) for women and Ush.91,200 ($53) for men, compared to Ush. 4,190 ($2) for poor women and Ush. 7,142 ($4) for men. Giventheir low incomes, the majority of surveyed farmers (89% of men and 91% of women) borrowed money. In2000, 68% of both male and female respondents borrowed money, mainly from relatives and friends(Appendix Table 11). Women borrowed from a wider number of sources compared to men, but very few ofeither sex obtained loans from formal credit institutions. In 2000, men borrowed significantly larger amountsof money (an average of Ush. 62,230 or $36 compared to Ush. 21,160 or $13 for women), with nosignificant difference between wealth groups. As borrowing is often a last resort measure, men and womenused borrowed money for similar expenditures, although the pattern followed the gender division ofresponsibilities. In 2000, respondents used borrowed money for medical expenses (39% of women and 23%of men), food (30% of women and 23% of men), and non-food household necessities (21% of women and14%). An important area of expenditure for men was land rental (23% compared with 7% of women).
Short term coping strategies used by farmers in less severe crises include borrowing or asking friends andrelatives for money or food, borrowing money from local credit groups, buying food and calling on localburial groups and neighbours to help bury the dead (Table 2.2). People responded to more severe crises suchas food shortage and crop failure by working for money or food, selling crops, livestock, land and otherproperty, reducing the number of meals eaten, eating wild foods and, finally, migrating. Men and womenresponded similarly to crises with a few exceptions. Women were more likely than men to borrow fromcredit groups in the event of sudden death, whereas men were more likely to borrow money from thesegroups to deal with crop failure. Women were also more likely than men to work for money and food and to begfor food from friends and relatives when affected by crop failure, whereas men were more likely to migrate inthis situation. Both men and women were more likely to turn to friends, rather than relatives, for help.
M W M W M W M W M W
18 11 33 33 53 46 7 3 0 4
2 11 18 18 21 26 16 11 12 4
0 0 20 17 14 12 0 0 0 0
0 0 15 16 7 10 14 16 9 10
0 0 0 0 0 0 36 46 18 44
0 0 0 0 0 0 16 13 33 28
0 0 0 0 0 0 9 9 9 16
7 3 15 16 5 4 5 2 15 2
Table 2.2: Emergency coping strategies, Rubaya (per cent)
Sudden death Need money for
school fees
Need money for
health expenses
Food shortage Crop failure
Borrow/ask
relatives/friends
for money
Borrow money from
credit groups
Sell crops/livestock
Sell land/property
Work for money/
food
Buy food
Ask relative/
friend for food
Other
Note: 73% of men and 74% of women reported that they would depend on a burial group or neighbours in the event
of a sudden death

Farmers’ investment aspirations
An analysis of investment scores shows that after land, women’s strongest interests centred around
purchasing livestock and clothes, improving their home and food security, business and school fees
(Appendix Table 12). Men’s investment priority scores were highest for land, livestock, and business,
housing and agricultural inputs (fertilizer, seed, tools). Farmers’ business interests centred around petty
trade of crops (sorghum, potatoes) and retailing. Judging from the priority both male and female farmers
gave to land and livestock, their paramount budgetary strategy was to increase crop production while
investing in an enterprise that would provide a reliable source of cash in-flow for immediate use. Livestock
provide manure and marketable products (e.g. milk, eggs, meat in the form of broilers and rabbits), and
cattle can serve as a store of wealth that can easily be sold. The investment priorities of both men and women
did not differ significantly by wealth (Table 2.3)- with the one exception that poor men, unlike men in other
wealth groups, had a stronger interest in improving their homes and the quality of their diet.
M W M W M W
Save 1.00 1.00 0.38 0.29 0.17 0.37
Business 0.80 0.60 1.44 0.97 0.70 0.35
Improve house 0.80 1.60 0.13 0.74 1.09 0.94
Buy livestock 1.20 1.20 1.56 0.68 2.17 1.41
Buy land 2.40 2.20 2.06 1.74 2.35 1.90
Better food 0.40 0.40 0 0.59 0.43 0.55
More food 0.20 0.20 0.19 0.62 0.57 1.06
Agricultural inputs 0.60 0.20 0.38 0.56 1.13 0.61
Buy clothes 0.80 1.60 0.63 0.97 0.61 1.18
School fees 1.60 1.60 0.63 0.65 0.39 0.45
Rent land 0 0 0.25 0.12 0 0.24
Other 0 0 0.63 0.24 0.17 0.51
Table 2.3: Investment priority scores by wealth status and gender, Rubaya
(men n=44; women n=90)
Wealth rank
Wealthy Average Poor
9
Agricultural production
Crops
Farmers in Rubaya grew a wide range of crops to meet their food and cash needs (Table 2.4). Potatoes were
grown in both uplands and wetlands. Climbing beans, a land saving, labour intensive technology that
provides significantly higher yields than bush beans, were introduced to Kabale District by NARO
(National Agricultural Research Organization) and CIAT researchers in the early 1990s. Minor crops
include fruits, wheat (22%), millet (16%), tomatoes (11%), coffee (7%), pyrethrum (2%), onions (2%) and
carrots (1%). Married couples in Kabale did not cultivate personal plots, and there was little gender
specialization in crops.

Sorghum 99 13 18 66 3
Bush beans 98 27 28 46 0
Sweet potatoes 98 62 17 20 1
Potatoes 97 19 22 53 6
Climbing beans 85 41 24 33 1
Maize 75 55 25 19 1
Cabbage 67 42 6 37 15
Peas 48 37 21 40 2
Tobacco 46 0 0 19 81
Bananas 42 84 5 11 0
Green leafy vegetables 39 94 3 3 0
Avocado 37 76 6 12 6
Passion fruit 34 52 6 29 13
Wheat 22 20 15 45 20
Table 2.4: Main crops usually grown and their uses, Rubaya (per cent)
Purpose
Per cent of
sample
(N=92)
Home
consumption
only
Mainly home
consumption
Home
consumption
and sale
Sale
mainly
10
Potatoes Potatoes grown in wetland Bush beans Climbing
beans
Amount planted 125 114 37 5
Amount harvested 312 2981 159 26
Per cent who sold 43 60 31 13
Amount sold 248 202 64 24
There was little crop specialization in Rubaya because, with the exception of tobacco, pyrethrum and coffee,
farmers grew few crops exclusively for sale (Table 2.4). At the time of the survey, only two households grew
pyrethrum (one each in Kalambo and one in Rukore). Notably, mainly wealthy farmers grew coffee, but
other new crops such as climbing beans and passion fruit were wealth neutral. Farmers grew horticultural
crops for both food and sale. Forty-seven per cent of households reported potatoes as their most important
source of crop income. Sorghum was a key income earner for 27% of households, while tobacco was
mentioned by 9% of households. The main secondary sources of on-farm income were sorghum (40%),
potatoes (18%) and bush beans (15%).
Multiplication rates for potatoes and beans were very low at 2.4 for potatoes grown on hillsides, 2.8 for
potatoes grown in valley bottoms, 4.3 for bush beans and 4.8 for climbing beans (Table 2.5). As typical
farmers’ multiplication rates are 7 for potatoes, 15-20 for bush beans and 22-25 for climbers (pers. comm.
CIP, CIAT), it is likely that farmers underreported planting and harvesting quantities. In the first season of
2001, 60% of potato farmers sold some of their crop. Farmers sold an average of 47% of potatoes harvested
from the main season and 51% of potatoes grown in wetlands. About a third of bush bean farmers sold an
average of 36% of their harvest. Relatively few farmers sold climbing beans; those who did sold a mean of
41% of their harvest.
Table 2.5: Production and sale of some principal crops in first season of 2001 (kg), Rubaya

Cruza
Rutuku
Kisoro
Victoria
Kachwekano
(K20 and/or
K132)
Gisenyi
Vunikingi
Ngwinurare
Africare
Kabuyanda
11
Farmers in Rubaya grew both local and researcher-introduced varieties of the main crops (Table 2.6). Because
identification of introduced varieties was problematic due to the use of local names and farmers’ lack of
information about the origins of varieties, some varieties may have been unreported. Varietal diversity was
high, even for climbing beans, a crop new to the area. Three introduced potato varieties were widely grown:
Cruza (used largely for home consumption) (64% of potato growers), Rutuku (43%) and Victoria (35%).
The first two are older varieties, while all farmers started growing Victoria after 1996. A significantly higher
number of potato growing households in project villages (53%) compared with non-project villages (25%)
were growing Victoria due to Africare’s seed distribution activities. There was no difference between sites
for adoption of other potato varieties.
Table 2.6: Number of varieties grown and names of introduced varieties, Rubaya
Potatoes Bush beans Climbing beans Maize
Total number of varieties grown 7 5 5 4
Mean number of varieties grown 3.0 2.7 1.6 2.1
Introduced varieties
The majority of bean farmers (96%) grew two bred bush bean varieties. K20, released in 1968, and K132
released in 1994, are both red mottled seed types that are difficult for farmers to differentiate. If time of
adoption is used to distinguish between the two varieties, it can be assumed that 24% of bean growing
households grew K132 at the time of the survey. Landraces of climbing beans, brought from neighbouring
Kisoro District, the DR Congo or Rwanda, were more widely grown than modern varieties. Ngwinurare,
grown by 32% of climbing bean growers, and Gisenyi grown by 13%, were the most common introduced
climbing bean varieties. Significantly more households were growing Ngwinurare in project (40%)
compared to non-project villages (13%) as a result of seed distribution by Africare, but there was no
difference for adoption of other bean varieties.
Livestock
The majority of households in Rubaya (62%) owned livestock, mainly poultry and small ruminants
(Appendix Table 13). It is noteworthy that a significantly higher proportion of project village households
(69%) compared to 47% in Rukore owned livestock - in part due to Africare’s livestock distribution
activities. Diary, but not local, cattle ownership was significantly associated with wealth, with 40% of wealthy
households owning dairy cows, compared with 4% of average and 7% of poor households. Dairy cattle were
only found in project villages. On average, the number of livestock owned is small due to land scarcity for
grazing and the high cost of animals. The only animals owned by women were goats, sheep, chickens and
rabbits.
Input use and seed sources
With the exception of labour and manure, few farmers in Rubaya used inputs in crop production (Appendix
Table 14). Fungicide and chemical fertilizer use were significantly associated with wealth (χ2 =7.56, Cramer’s
v=0.29; P ≤.02 for the former; χ2 =21.8, Cramer’s v=0.58; P ≤.001 for fertilizer). Farmers mainly used
fungicide on potatoes to control bacterial blight and insecticide on cabbage to control insect pests. They
applied manure to beans (to mitigate bean root rot, a disease associated with low soil fertility) (33%),
potatoes (19%) and sweet potatoes (17%).

12
Own stock 57 59 32 2
Markets/shops 41 36 24 35
Purchased from other farmers 14 12 22 43
Borrowed/exchange/gifts 2 1 13 12
Other 5 4 13 12
Table 2.7: Source of seed planted in the second season of 2001, Rubaya
Potatoes
(n=63)
Bush beans
(n=83)
Climbing
beans (n=75)
Cabbage
(n=49)
Notes: Other = Africare and Kabale District Farmers’ Association.
Totals exceed 100% due to multiple sources
As in most parts of Africa, farmers in Rubaya relied principally on their own stocks for seed or planting
material of potato and beans (Table 2.7). Cabbage was an exception, with the main seed sources being
purchases from other farmers, shops and markets. Notably, however, farmers were not self-sufficient in
seed, as in the second season of 2001 a significant proportion obtained potato and bean seed from off-farm
sources. Commercial sources were second in importance to own stock, followed by purchases from other
farmers. Surprisingly, none of the households interviewed sowed potato seed purchased from specialized
seed producers (the Uganda Seed Potato Producers’ Association) in the second season of 2001. Exchange,
loans and gifts accounted for a relatively unimportant source of potato and bush bean seed, a pattern
observed elsewhere in Uganda (David and Sperling, 1999). These sources were relatively more important
for climbing beans, a new crop to the area.
Marketing of agricultural produce
Farmers sold agricultural produce to other farmers, local traders and long distance traders, with some vari-
ation by crop. Most farmers sold potatoes, beans and sorghum to local traders, but both local and long
distance traders bought cabbage and tobacco (Table 2.8).
Table 2.8: Buyers of agricultural produce, Rubaya (per cent)
Potatoes Beans Sorghum Cabbage Tobacco Wheat
Farmers 11 15 2 8 4 0
Local traders 58 78 79 45 44 74
Long distance traders 31 7 19 47 52 26
As Table 2.9 shows, across crops, the single most important marketing problem mentioned by farmers was
low prices. Storage loss was a problem for potato, bean and sorghum producers, and fast spoilage was a
major constraint for cabbage growers.

13
Table 2.9: Marketing constraints of major cash crops, Rubaya (per cent)
Potatoes Beans Sorghum Cabbage Wheat
Low price 41 53 50 30 53
Storage loss 16 14 14 3 0
Lack of market 10 7 6 15 20
Fast spoilage 10 8 3 41 0
Lack of transport 7 6 11 4 13
Lack of storage facilities 6 3 8 3 0
Poor quality of produce 8 9 6 3 13
Lack of information on buyers 2 1 2 1 0
Land use and management
Because land is highly fragmented in Rubaya, farmers cultivated multiple plots in different locations (Table
2.10). Studies conducted in the1990s in Rubaya and neighbouring sub-counties document farmers
cultivating up to 16 fields (Olson, 1996; Puhalla, 1998). In the first season of 2001, most surveyed
households cultivated land on hillsides and on hilltops in their own village. In the majority of cases,
households owned hillside and hilltop plots in their own and in other villages. Hilltop plots that were not
abandoned as a result of overgrazing were mainly used for grazing or as woodlots. Over half of surveyed
households cultivated in the wetlands in 2001; however, wetland cultivation in the respondent’s own village
was strongly associated with wealth ((χ2 =19.56, Cramer’s v=0.46, P≤.001), with poor households having
least access (45% compared with 88% of average and 100% of wealthy households). In most cases, farmers
owned wetland plots, but a significant number of households rented land in the wetlands.
Table 2.10: Location of farmland, first season of 2001, Rubaya (per cent)
Hillside, same village 92
Hillside, other village 30
Hill top, same village 46
Hill top, other village 16
Wetlands, same village 64
Wetlands, other village 7
Continuous cultivation of steep slopes contributes to soil infertility and erosion. Consequently, the vast
majority of households in Rubaya (72%) attempted to improve soil fertility through the use of manure
(82%), crop residues (68%), crop rotation (50%), planting agro-forestry tree species (35%) and fertilizer
(6%). Surprisingly, no farmer mentioned fallowing as a measure to improve soil fertility, although a 1995
study in a nearby sub-county showed that 37% of land was under short and long term fallow (Olson, 1996).
Olson concluded that fallowing is practiced when potential returns to labour are low and is positively
associated with the amount of land owned.
Nearly all surveyed households (91%) had gullies on their farmland, a sign of serious soil erosion. Not
surprisingly, the majority (61%) considered soil erosion a very serious problem, while 29% considered it a
serious problem and nearly all (98%) had implemented measures to control soil erosion. The main soil
erosion control measures implemented in Rubaya were: terracing (98%), trenches (67%), contour bands
(62%), hedgerows (51%), grass strips (49%), mulching (29%) and trash lines (29%).
A third of surveyed households had established terraces during colonial times and in the immediate
post-colonial period (Table 2.11). Notably, in 2001, the year the BAPPA project began, 12% of households

14
built new terraces. In Kabale District, terrace destruction, a short-term strategy to obtain fertile soils
accumulated on terraces, was common, though illegal. Ninety-two per cent of households in Rubaya
reported “collapsing terraces”, a euphemism for this practice. As Table 2.11 shows, prior to 2001, relatively
few households dug trenches to control soil erosion and reclaim gullies. Farmers identified this intervention
as a BAPPA project activity and nearly all trenches were dug in 2001 at the start of the project. At the time
of the survey, a higher proportion of households in project villages had trenches: 77% in Kalambo and 81%
in Muguli B, compared with 43% in Rukore.
Table 2.11: Year of establishment of soil erosion measures, Rubaya (per cent)
1923-1969 30 0
1970-1986 31 0
1987-1994 11 3
1995-2000 18 21
2001 12 76
Terraces
(n=90)
Trenches
(n=62)
Table 2.12: Purpose of tree planting by niche, Rubaya (frequency, n=68)
Farm
boundaries
Crop
land
Homestead Bunds Terraces Woodlots Abandoned
land
Total
Erosion control 2 8 5 5 2 2 0 24
Firewood 1 0 0 0 0 11 6 18
Fruits 0 1 12 0 0 0 0 13
Poles/timber 1 3 1 2 0 4 0 11
Fodder 1 3 1 3 0 0 0 8
Soil fertility 0 3 1 0 0 0 0 4
Demarcation 2 1 0 0 0 0 0 3
Multi-purpose 1 9 7 1 0 22 13 53
Farmers reported a number of problems in controlling soil erosion, namely, lack of tools (for digging trenches,
etc), the presence of rocks and stones (which make digging difficult), and lack of labour. The main reason
for not implementing soil erosion control measures was lack of knowledge. Other reasons include lack of
labour, lack of materials (tree seedlings, mulch) and the belief that mulch, grass strips, contour bands and
trash lines harbour rats and waste land.
Tree planting
The vast majority of surveyed households (74%) planted trees between 1999 and 2001, mainly in woodlots,
cropland and homesteads (Appendix Table 15). This is a significant increase from the 10% recorded in
Africare’s baseline survey (Anaele, 1997) and may be attributed to promotion of tree planting by NGOs,
research institutions and the government. There was no significant difference in tree planting behaviour by
wealth. Most farmers (78%) planted trees to meet multiple objectives, principally firewood, timber and
poles (Table 2.12). Other objectives include erosion control, fruits stakes for climbing beans, fodder and
medicine. The main tree species planted were Eucaplytus (36%) (mainly in woodlots and abandoned land),
Calliandra (26%) (in cropland and homesteads), Grevillea (12%) (in cropland and homesteads), fruit trees
(9%) (in homesteads) and black wattle (9%) (in woodlots and abandoned land). Other species planted
included Sesbania spp., Erythrina abyssinica, Pinus and Alnus.

15
Table 2.14: Reasons for shortages of major staples, Rubaya (per cent)
Food security
The main dietary staples in Rubaya are potatoes and sweet potatoes accompanied by, or cooked together
with, beans, peas or cabbage. Sorghum is eaten as porridge and as an alcoholic drink (omuramba). There are
two periods of severe food shortage: April-May, when most agricultural produce have been used for
planting, and November-December. During these months, most households in Rubaya reduced the number
of meals eaten due to food scarcity, with poor households eating significantly fewer meals than better off
households (Appendix Table 16).
The majority of surveyed households regularly experienced shortages of the main staples - potatoes, beans
and sorghum (Table 2.13). Harvested crops fed households for only a short time: on average 3.2 months for
potatoes, 4.3 months for beans and 6.6 months for sorghum, with no significant difference between wealth
groups. When faced with food shortages, most farmers bought potatoes and beans, ate other foods in
substitute for potatoes and sorghum, or worked for food (Table 2.13). The main reasons farmers gave for
food shortages were low yields - due to unfavourable climatic conditions, low soil fertility and land shortage
(Table 2.14). In particular, the responses of bean farmers suggest their awareness of the linkage between
diseases, pests and low soil fertility, which has resulted in the devastating effects of bean root rots. The high
dependence on food crops for income is believed to contribute to food insecurity, but was only mentioned by
a significant proportion of farmers in the case of sorghum.
Table 2.13: Percentage of households experiencing shortages of major foods grown, and strategies to
alleviate shortage, Rubaya
Experience shortages Strategies to alleviate shortage
Potatoes 83 Buys 41
Eats other foods 33
Works for food 23
Other 3
Beans 77 Buys 52
Eats other foods 13
Works for food 22
Other 13
Sorghum 520 Buys 35
Eats other foods 38
Works for food 25
Other 2
Potatoes (n=73)
Sorghum(n=47)
Beans(n=69)
Poor yields due to heavy rains, drought, wind damage 45 29 21
Poor yields due to low soil fertility 15 25 26
Land shortage 19 20 30
Seed shortage 15 0 2
Diseases 4 22 0
Field pests 3 20 4
Sells crop 8 3 28
Post-harvest loss 7 3 0
Other 1 2 6
Note: Totals exceed 100% due to multiple responses
16
Development activities
Nearly half of the households surveyed (48%) in Rubaya had participated in activities organized by Africare/
BAPPA. The major Africare sponsored activities reported by farmers were seed distribution of new bean
(89%) and potato (86%) varieties, tree planting (86%), nutrition education (70%), compost making (61%)
and distribution of livestock (pigs and rabbits) (50%). Ninety-three per cent had participated in digging
trenches, an activity organized by the BAPPA project.
Although both men and women were reasonably optimistic about their ability to bring about positive change
in their local situation (Appendix Table 17), men tended to be more optimistic, reflecting their higher status
in society and their greater access to political power and resources such as education and land. Fifty per cent
of men compared to 34% of women felt they would do a lot to bring about change, but 27% of men and 26%
of women felt they could do little to change their environment. As evidence of their optimism about the
future, about half of the sample of both men and women would like their children to be small-scale farmers,
with little difference by sex of the child (Appendix Table 18).
Conflict, collective action and social capital
Although the majority of respondents felt that their community was peaceful (Appendix Table 19), they
noted social divisions in relation to ownership of livestock, gender, education, land size, access to swamps,
wealth, and involvement with NGOs (Appendix Table 20). Men and women had different perceptions of
social differentiation. For men, the main factors dividing the community were the number of livestock
owned, access to swamps, whether one works with an NGO or not, education and gender relations. Thirty
per cent or more of male respondents reported that the first three issues were responsible for social problems
and conflict. Women perceived ownership of livestock, gender, educational and land size differences as
major factors dividing their communities. Thirty per cent or more of women perceived ownership of
livestock and gender differences as the most serious divisional issues at community level. Theft is another
indicator of increased social differentiation and breakdown of communal values. Forty-one per cent of men
and 42% of women observed that theft had increased in the past 10 years, and a few respondents participated
in collective action against this problem.
In contrast to women, men perceived the spirit of participation/cooperation in their village to be high
(Appendix Table 21). Fifty-four per cent of men perceived participation as high or very high compared to
7% of women. Only 21% of men considered it to be low or very low; 38% of women rated the level of
participation as average. A high proportion of both men and women had been involved in collective action
between 2000 and 2001 (Table 2.15), with no significant difference between project and non-project
villages. Higher male involvement in collective action may reflect the types of issues involved (e.g. land
disputes and overgrazing are male domains), as well as men’s greater amount of free time. Notably,
domestic violence was the issue on which women participated most in collective action.

17
Table 2.15: Involvement in collective action, 2000-2001, Rubaya (per cent involved)
A wide array of local groups existed in Rubaya (Table 2.16), and 95% of surveyed households belonged to
at least one group. The mean number of household members belonging to a group was 2.4, with wealthy
households having a significantly higher number of group members (6.4 compared with 2.1 for average and
2.2 for poor households; F statistic=7.65, 86 df; P≤.001). It is unclear why the mean number of household
members belonging to groups was significantly higher in project villages: 2.7 compared to 1.9 in the
non-project village. Since all groups are village or parish based, they represent forms of bonding social
capital, which are useful as coping or survival strategies, but do not necessarily help poor people to
overcome poverty. The majority of households belonged to a burial group, which assists members to
purchase a coffin and with other burial activities. Most groups, with the exception of household utensil
groups, have mixed membership. Although the proportion of men and women belonging to groups was
nearly equal (88% for men and 82% for women), women appeared to be more active in groups that facilitate
their access to resources such as land, capital and labour.
Men (n=44) Women (n=90)
Overall 55 38
Type of issue
Excessive drinking by the opposite sex 2 2
Domestic violence 11 14
Land disputes 9 1
Improved farming methods/soil fertility 14 1
Theft 7 3
Transportation of sick 2 2
Overgrazing by livestock 5 1
Witchcraft 2 0
Other 23 19
Table 2.16: Household membership in local groups by gender, Rubaya (per cent)
Men alone Women alone % of households
(n=88)Both
Burial 83 21 32 47
Credit/savings 13 8 67 25
Stretcher (Ngozi) 9 25 38 38
Household utensil 8 0 100 0
Digging/agricultural 7 33 33 33
Clan based groups 2 1 0 1
As Table 2.17 shows, few farmers shared information indiscriminately, although both men and women were
more likely to share information and knowledge, rather than technologies, with anyone. Based on response
frequency, diffusion pathway patterns were similar for men and women but varied by technology. Women,
the key managers of seed and planting material, were more likely than men to share seed of new varieties.
Diffusion of new varieties and tools is likely to start in the donor’s own village, going to friends, relatives
and fellow group members in that order. Next, farmers share new varieties and tools with relatives and
NOTE: Digging groups dig to raise money that is used to purchase farmland for the group. Agricultural groups include
groups that give loans for purchasing seed and provide training. Household utensil groups assist women to purchase
household utensils.

18
Husband’s drinking 35 48
Wife’s disobedience 18 0
Decision-making about sale of property/produce, use
of money 18 23
Wife’s lack of respect for husband 12 0
Husband does not provide adequately/take on male
responsibilities 0 18
Other 18 13
Table 2.18: Areas of marital conflict, Rubaya (per cent)
Men
(n=17)Women
(n=40)a
friends in other villages. The higher proportion of farmers who share with friends compared with relatives is
similar to farmers’ preference for borrowing more from friends than relatives.
Table 2.17: Diffusion pathways of agricultural technologies and information (Rubaya percent)
Men (n=44) Women (n=89)
Seed Knowledge Tools Seed Knowledge Tools
Relative, same village 34 75 75 70 70 62
Friend, same village 77 73 86 82 81 82
Relative, other village 55 59 52 56 61 52
Friend, other village 41 48 45 40 46 36
Member of same group 55 73 59 56 62 52
Anyone 7 18 5 10 27 8
Marital conflict and decision-making
Married women (64%) were more likely than men (40%) to report marital conflict. For both husbands and
wives, male drinking was the principal area of conflict (Table 2.18). Women’s second area of concern was
decision-making about the sale of produce and use of money, whereas men had a range of concerns over
decision-making and wives’ disobedience.
Includes responses of women with both resident and non-resident husbands
A range of decision-making patterns were observed among married couples in Rubaya but, surprisingly, the
most commonly reported form (by a third or more of both husbands and wives) was a consensual one in
which husbands and wives discuss issues and make decisions together (Tables 2.19, 2.20). Notably,
however, couples’ responses on decision-making generally showed a high level of disagreement, which is
corroborated by the proportion of couples who reported conflicts over decision-making (Table 2.18).
Disagreements may also be attributed to the highly variable nature of decision-making, perception of that
behaviour and the tendency to report norms rather than actual behaviour. Couples showed the highest levels
of disagreement on decision-making about family planning and children’s education, with each sex reported
a stronger input for themselves. Contrary to expectation, there was little difference in decision-making
pattern by the amount of income and crop, with a third or more of both husbands and wives reporting joint
decision-making for all crops and revenue levels (Table 1.20). However, women were slightly more likely to
make decisions about the disposal of small amounts of money on their own.

MW
MW
MW
MW
MW
Am
ount o
f bean
s to sell
20
28
18
820
813
18
30
39
55
Am
ount o
f potato
es to sell
24
24
13
821
11
13
18
29
40
57
Adoptio
n o
f new
bean
varieties
22
17
24
24
20
10
15
15
17
34
60
Adoptio
n o
f new
potato
varieties
20
25
23
20
20
13
18
13
20
30
53
Fam
ily p
lannin
g20
16
10
29
17
313
16
40
40
67
Sen
din
g ch
ildren
to sch
ool
29
28
311
16
8 8
17
45
36
62
Tab
le 2.1
9: D
ecision-m
akin
g p
atterns o
n k
ey issu
es as perceiv
ed b
y h
usb
ands an
d w
ives an
d ex
tent o
f disag
reemen
t in resp
onses, R
ubay
a (per cen
t)
Tab
le 2.2
0: D
ecision-m
akin
g p
atterns o
n u
se of cro
p in
com
e as perceiv
ed b
y h
usb
ands an
d w
ives an
d ex
tent o
f disag
reemen
t in resp
onses, R
ubay
a (per cen
t)
Man
alon
eW
om
an
alon
e
Man
con
sults
wo
man
Wo
man
con
sults
man
Both
discu
ss
and d
ecide
togeth
er
%
disag
reemen
t
Man
alone
Wo
man
alon
e
Man
con
sults
wo
man
Wo
man
con
sults
man
Both
discu
ss
and d
ecide
togeth
er
%
disag
reemen
t
MW
MW
MW
MW
MW
Sm
all earnin
gs fro
m p
otato
es22
17
19
19
19
11
814
30
33
58
Larg
e earnin
gs fro
m p
otato
es24
19
311
30
22
814
35
35
49
Sm
all earnin
gs fro
m so
rghum
21
21
13
21
21
10
818
36
28
62
Larg
e earnin
gs fro
m so
rghum
23
20
513
23
10
820
43
38
55
Sm
all earnin
gs fro
m b
eans
19
17
14
22
19
11
11
17
32
28
53
Larg
e earnin
gs fro
m b
eans
18
21
811
29
16
818
34
34
58
19

20
3. LINTHIPE EPA, DEDZA DISTRICT, MALAWI
Demographic profile of surveyed households
A total of 530 people lived in the 121 households surveyed in Linthipe EPA: 223 from Mnthala, 199 from
Chikonde and 108 from Yazini. A resident male headed most households, but nearly a third was headed by
women, mostly widows (Appendix Table 4). The proportion of female-headed households was higher than
the national average of just under 25% (IFPRI, 2000). The mean age of male respondents was 41 years,
compared to 38 for female respondents. No child-headed households were included in the sample. Heads of
households had lived in their village for an average of 28 years. Among household heads, the Yao were the
predominant ethnic group, accounting for 54% of those sampled. Forty-two per cent of household heads
were Chewa, while 4% were Ngoni. The Yao and Chewa are matrilineal people, while the Ngoni are
patrilineal. While most people in Mnthala were Christian, the majority in Yazini and Chikonde were
Muslims.
Average household size was 4.4 persons (Appendix Table 5), close to the national average of 4.5 persons.
Mean household size differed significantly by village, with Chikonde, the non-project village, having the
largest households (4.8) and Yazini the smallest (3.4). Illiteracy levels were high, with a third of male heads
of households and 60% of wives being unable to read or write (Appendix Table 6). These figures are similar
to national rates of illiteracy of 26% for men and 55% for women (PHNIP, 2002). Sixty-two per cent of male
respondents could read and write a local language and 23% could read and write English. Only 29% of
surveyed women could read and write a local language, while a scant 6% were literate in English.
Twenty-one per cent of households in Linthipe had a school age child out of school (Appendix Table 7).
There was no evidence of deliberate educational discrimination against girls at primary level, as a slightly
higher number of households had a male child not attending school (18 compared with 13 with a female
drop out). Moreover, the total number of male school dropouts (N=23) was higher than the number of girl
dropouts (N=17). Irrespective of sex, the main reason for school non-attendance was refusal and laziness;
lack of money for fees was the third most important reason.
Household resources, poverty and vulnerability
On average, households had 2.3 AEWs (Appendix Table 8) and a mean of 2.1 adults involved full-time in
agricultural work. As in most countries, women have a heavier workload than men, divided between farm
and domestic work (see appendix). Households with a resident male head had a significantly higher number
of AEWs than female-headed households: 2.6 compared with 1.5 (P ≤ .000 for t test). The dependency ratio
was low, with, on average, one producer supporting 1.4 non-producers.
There were four distinct wealth groups in Linthipe: wealthy, average, poor and very poor. Notably, the
average wealth group was only identified by informants in Yazini village, and, as earlier mentioned, Chikonde
has a disproportionate number of wealthy households compared to the other two villages. Wealth groups
differed significantly by ownership of livestock and other key assets, annual agricultural income and
household type (Table 3.1). Better off households tended to be headed by men, but were not significantly
larger than households in other wealth groups. Poorer households had a disproportionate number of female
heads and were less likely to own key assets. Consequently, female-headed households, many of whom had
limited agricultural activities, had significantly lower annual agricultural income than male-headed
households: MK 1347 ($28.78) compared to MK 4737 ($101.21)3 (P ≤ .001 for t test).

Household size 5.2 3.8 4.5 4.0 4.4 0.12*
Per cent headed by 9 19 25 64 29 0.00
women
Adult equivalent 2.5 2.0 2.4 2.2 2.3 0.38*
workers
Annual agricultural income 5664 4706 3503 1419 3,752 0.02*
(MK) (2000-01)
Own livestock (%) 91 100 77 56 79 0.00
Owns a bicycle (%) 65 48 39 20 42 0.02
Owns a radio (%) 78 71 45 16 50 0.00
Owns a foam mattress (%) 22 10 2 4 7.5 0.02
Owns mats (%) 100 95 100 88 97 0.04
Owns chairs (%) 48 38 31 4 30 0.01
Table 3.1: Household differentiation by wealth on selected socio-economic characteristics, Linthipe
Wealthy
(n=23)
Average
(n=21)
Poor
(n=52)
Very poor
(n=25)
Overall
average
Probability
3 US$ 1 = Malawi Kwacha (MK) 46.88
21
*Statistics from ANOVA; the rest from chi square
Average annual income from agriculture was MK 3,752. According to recent research on poverty in
Malawi, in Dedza District, “just under 50 per cent of household incomes was derived from own production
of crops and livestock, and just over 50 per cent, therefore, from other sources comprising ganyu, non-farm
self-employment, remittance income or safety net transfers” (Ellis et al., 2002). For most households, April
to July, the period following the harvest from the main season, were the months of highest income, while
November to February, the planting period, were the months of least income. Eighty-two per cent of men
compared to 61% per cent of women engaged in some type of income generating activity, with men having
a wider portfolio of activities (Appendix Table 10). Men were typically involved in 1.4 off-farm activities
compared with 1.2 for women, with no significant difference in the number of activities by wealth. Ganyu
(casual) labour and business ranked first and second as the principal sources of personal income among both
men and women. Notably, petty trade was more important for women in Chikonde, whereas hired labour
was the principal source of income for 40% of women in project villages. Men in project villages were also
more dependent on ganyu labour than men in Chikonde. Whereas men tended to leave the village for ganyu
labour, women engaged in casual labour locally, often in exchange for food. Women were more likely than
men to rely on remittances.
Eighty per cent of men and 78% of women saved money. About half of the farmers who saved (49% of
women and 57% of men) did so monthly or more frequently. Women saved on average MK 548 ($11.70)
compared to MK 887 ($18.95) by men (P ≤ 0.16 for t test). Better off women saved significantly more
money than poor women, but the difference between men of different wealth groups was not significant. On
average, women borrowed MK 305 ($6.51) in 2000 and MK 212 ($4.52) in 2001, while men borrowed MK
512 ($10.94) in 2000 and MK 928 (19.82) in 2001. Amounts borrowed by men and women did not differ
significantly by wealth. Women were more likely than men to borrow money from relatives, whereas men
borrowed equally from friends, relatives and formal sources such as NGOs and churches (Appendix Table
11). No surveyed farmer had ever borrowed from a credit institution. Farmers mainly used borrowed money
to invest in business, purchase household necessities (mainly women), pay for medical expenses and
purchase food. A minority of men used borrowed money to rent land and build a house.
The main coping strategies that Malawian farmers fall back on in emergency situations included borrowing
money and seeking assistance from friends and relatives, using savings, doing ganyu labour or other types

Table 3.2: Emergency coping strategies, Linthipe (per cent)
22
of work, selling crops or livestock, letting children drop out of school, buying food and begging (Table 3.2).
Men and women responded to emergencies in similar ways, with begging being the one response more
likely to be taken by women. Survey respondents were more likely to seek assistance from friends rather
than relatives.
W M W M W M W M W M
Borrow money/seek
assistance from friends 58 59 51 56 70 59 9 7 6 0
Use saved money 9 11 1 2 1 1 0 1 0 0
Assistance from
parents/relatives 18 18 7 5 7 12 2 2 3 0
Do ganyu 0 0 11 10 3 2 59 61 46 41
Sell crops/livestock
assets 11 8 11 21 14 22 9 10 6 7
Let child drop school 0 0 10 0 0 0 1 2 0 0
Buy food 0 0 0 0 0 0 3 6 3 7
Beg 2 0 3 1 2 0 11 1 6 0
Work for money 0 0 5 4 4 4 6 5 22 41
Other 2 1 1 1 0 0 1 4 10 4
S u d d e n
death
Need money
for school fees
Need money for
health expenses
Food
shortage
Crop
failure
Farmers’ investment aspirations
Farmers’ two main investment priority areas were business and agricultural inputs (principally fertilizer)
(Appendix Table 12). Women’s preferred business activities included brewing, baking and petty trade of
maize or second hand clothes. Men were mainly interested in trading fish and maize. Other priority
investment areas for women were clothes and food security, while men favoured investing in livestock and
food security. Analysis of investment scores by wealth shows interesting trends (Table 3.3). Wealthy women
were more prepared to invest in agricultural inputs, women of average wealth were more interested in
improving their houses, while poor women were more concerned with food security. Men of different
wealth groups differed significantly on three areas of investment. Wealthier men (wealthy and average) put
high priority on buying land, agricultural inputs and more food, whereas poor men preferred to invest in
business, agricultural inputs and livestock, in that order.
Table 3.3: Investment priority scores by gender and wealth category (men n=83; women n=113), Linthipe
Wealth category
Wealthy Average Poor Very poor
M W M W M W M W
Save 0.76 0.57 0.41 0.74 0.58 0.79 0 0.72
Business 2.29 2.43 2.00 1.89 2.75 2.51 2.00 2.21
House improvement 0.81 0.48 0.53 0.68 0.44 0.15 0.11 0.08
Livestock 1.19 1.22 1.06 0.68 1.36 0.85 1.11 1.08
Land 1.00 1.00 0.12 0.21 0.78 0.53 0.33 0.83
Better food 0.52 0.48 0.18 0.47 0.25 0.40 0 0.21
More food 0.81 0.70 0.65 0.53 0.81 1.34 1.56 1.58
Agricultural inputs 2.43 2.00 3.47 3.26 1.94 1.87 1.78 1.21
Clothes 1.05 1.26 0.53 1.05 0.81 1.02 1.33 1.63
School fees 0.38 0.30 0.47 0.47 0.19 0.23 0 0
Rent land 0 0.09 0 0 0 0 0 0.04
Other 0.33 0 0.18 0.21 0.47 0.23 0.33 0

Agricultural production
Crops
A total of 30 crops were recorded in Linthipe, most of which farmers grew for both food and cash (Table
3.4). Beans, pumpkin and other vegetable crops were commonly intercropped with local maize. Minor crops
included papaya (18%), onions (12%), Bambara nuts (10%), okra (10%), rape (9%), cow pea (8%), peas
(8%), pitch fruit (8%), cabbage (7%), avocado (2%) and paprika (2%). Some crops, such as maize, sweet
potato, sorghum, millet and pigeon pea, were mainly grown for home consumption; the remaining crops had
both food and sale value. The two key cash crops grown by Linthipe farmers were soya bean and burley
tobacco. Potatoes, paprika, tobacco, onions, cabbage and tomatoes were relatively new crops to the area
with high market potential. It is significant that, while a higher proportion of wealthy and average
households grew potatoes, soya bean production was wealth neutral. During participatory planning
exercises, farmers noted that cassava and sweet potato production had increased over time in response to
recurrent droughts and increased food insecurity. They also pointed out the increased importance of fruits
for nutrition and income generation. Given the lack of crop specialization, no single crop was reported by a
high proportion of farmers as a key source of income. Farmers reported soya beans (27%), beans (23%)
cassava (19%) and groundnuts (9%) as their highest agricultural income earners; secondary sources of
income included beans (33%) and groundnuts (19%).
There was little gender specialization in crops in Linthipe, although men generally took more responsibility
for tobacco and some cultivated personal plots of this crop. However, women were also involved in tobacco
production.
Table 3.4: Major crops usually grown on upland fields and their uses, Linthipe (per cent)
23
Purpose
Per cent of
sample
(N=121)
Home consumption
only
Mainly home
consumption
Home
consumption
and sale
Sale
mainly
Beans 99 9 18 72 0Groundnut 91 13 15 73 0Local maize 88 80 1 17 1Pumpkin 87 87 1 12 0Soya bean 74 3 6 70 20Cassava 73 11 5 86 0Sweet potato 67 49 4 39 3Bananas 52 38 7 53 2Hybrid maize 46 55 9 35 2Sugar cane 43 20 6 67 8Mangoes 41 68 4 28 0Potatoes 39 32 4 60 4Sorghum 36 95 2 2 0Tomatoes 28 30 3 67 0Pigeon pea 28 76 12 12 0Mustard 27 15 3 79 3Millet 26 55 29 16 0Tobacco 20 8 0 17 75
The majority of households (70%) interviewed grew crops in dimbas during the dry season. As Table 3.5
shows, major dimba crops were: beans (78%), hybrid maize (68%), tomatoes (60%), green leafy vegetables
(60%), potatoes (49%), sugar cane (38%) local maize (34%), cabbage (26%) and sweet potato (26%).

Table 3.5: Crops usually grown in dimbas and their use, Linthipe (per cent)
Local maize
(n=104)
Hybrid maize
(n=51)
Beans
(n=119)
Potatoes
(n=40)
Cassava
(n=82)
Groundnuts
(n=106)
0.53 0.49 0.57 0.20 0.28 0.24
(0.10-1.22) (0.08-1.22) (0.10-1.42) (0.04-1.62) (0.04-0.61) (0.04-0.81)
13.7 10.5 9.7 38 84.6 8.8
(2-60) (2-50) (1-40) (2-400) (3-800) (1-75)
458.3 565 107.4 229 658.5 185.5
(20-1500) (26-2500) (9-1125) (13-3250) (50-5000) (3-1000)
176.3 175 56.9 304.1 596.1 107.8
(3-500) (50-450) (3-250) (25-3100) (10-4500) (8-500)
24
Beans 78 35 9 46 0
Hybrid maize 68 43 21 30 5
Leafy vegetables 60 42 6 50 2
Tomatoes 60 20 8 67 4
Potatoes 49 22 7 66 5
Sugar cane 38 6 3 84 6
Local maize 34 79 10 10 0
Sweet potato 26 30 25 40 5
Cabbage 26 10 5 86 0
Onions 22 25 20 50 5
Purpose
% of dimba
growers
(n=85)
Food
only
Mainly
food
Food and
sale
Sale
mainly
Farmers’ estimates suggest that the largest crop areas were sown to maize and beans (Tables 3.6, 3.7).
Multiplication rates for key crops were moderate to low (Tables 3.6, 3.7). On average from the 2000/01
season, farmers sold a quarter of their local maize harvest and nearly a fourth (38%) of their hybrid maize
harvest. Beans and groundnuts sales averaged 47-48% of amounts harvested. Average proportions of
potatoes and cassava harvests sold were high at 60% and 77% respectively. Although few farmers reported
growing crops in the dimbas mainly for sale (Table 3.5), figures on amounts sold suggests that dimba
production is commercially oriented for most crops and especially hybrid maize, beans and potatoes. Farmers
sold an average of 48-67% of the main staple crops grown in dimbas during the dry season of 2001.
Table 3.6: Production of some major crops on upland fields and quantities sold (kg), Linthipe, 2000-01
Area (ha)
Amount planted
Amount harvested
Amount sold

Varietal diversity at community level differed by crop (Table 3.8). A large number of bean, maize and sweet
potato varieties were reported, but individual households grew relatively few varieties of these crops.
Varietal diversity of cassava and potatoes was lower, not surprisingly in the case of for potatoes, a crop new
to the area. Two hybrid maize varieties had modest adoption rates: MB 18 (26%) and MH 17 (22%).
Adoption rates were only different between project and non-project villages for MH 18, which was more
widely grown in Chikonde (37% of households compared with 19% in Mnthala and Yazini). Only one
improved bean variety, Napilira (CAL 143), was widely grown by surveyed farmers (49%). Notably, this
variety was grown by significantly more households in project villages (66% compared with 17% in Chikonde)
as a result of seed distribution by CU. Other introduced varieties included Kenya sweet potato variety
(55%), CG7 groundnut variety (52%), Nkhalatsonga cassava variety (76%), and Red (43%) and Lusen
(26%) potato varieties. Of these varieties, only CG7 groundnut variety was grown by significantly more
farmers in project villages (70% compared with 8% in Chikonde).
Table 3.7: Production of some major crops in dimbas and quantities sold (kg), Linthipe, 2001 (Range in
parentheses)
Sweet potato Beans Potato Cassava Maize Groundnuts
5 6+ 4 3+ 6+ 5+
Table 3.8: Number of varieties grown and introduced varieties by crop, Linthipe
Introduced varieties Kenya Napilira Red
Luseni
Nkhalatsonga Parma
MH 18
MH 17
Masika
MH 41
CG 7
25
Local maize
(n=28)
Hybrid maize
(n=55)
Beans
(n=58)
Potatoes
(n=30)
Area (ha) 0.20 0.16 0.16 0.16
(0.04-0.40) (0.04-0.61) (0.02-0.40) (0.08-0.61)
Amount planted 3.2 4.1 4.2 21.3
(1-10) (1-20) (0.5-72) (1.5-100)
Amount harvested 65.1 82.9 28.5 99.3
(1-200) (1-800) (1-150) (1-500)
Amount sold 79.2 170.8 31.5 120.8
(50-150) (25-400) (10-100) (25-400)
Total number of
varieties grown
Mean number of
varieties grown
Livestock
The majority of surveyed households in Linthipe (79%) owned livestock, mainly goats and poultry
(Appendix Table 13). Livestock ownership was significantly correlated with wealth. There was no
significant difference between project and non-project villages in livestock ownership, although 83% of
households in project villages owned animals compared with 71% in Chikonde. Low livestock populations
and the absence of certain types of animals were attributed to several factors. Cattle rustling and disease
caused the absence of cattle, a recent phenomenon, which is consistent with findings by Ellis et al (2002).
Diseases were also responsible for low pig and duck populations. Notably, nearly a third of livestock
1.8 2.4 1.4 1.4 1.7 1.6

owners (29%) used drugs to treat their animals, nearly always chickens. Livestock theft was noted as a
common problem that forced farmers to keep their animals (goats particularly) indoors at night. Indicative
of the importance of livestock as an economic asset, some households had sold off their livestock to obtain
cash in emergency situations and could not afford to restock.
Input use and seed sources
Seed sourcing varied by crop and whether the crop was traditional or newly introduced (Table 3.9). In the
2000/01 season, the majority of farmer used farm saved seed of local maize and beans. Other important
sources for these two crops were exchange and purchasing from the market or other farmers, which
corroborates the findings of other studies (Ferguson, 1991).
Not surprisingly, the most important source of hybrid maize seed was the commercial sector. However, a
significant per cent of farmers recycled hybrid maize seed due to lack of cash. Another important source of
hybrid maize seed was government distribution programs such as Starter Pack. Probably because potato is a
relatively new crop to the area and has high cash value, most farmers obtained seed from off-farm sources.
It is notable that across crops, few farmers obtained seed as gifts from other farmers.
Table 3.9: Source of seed planted in 2000/01 season, Linthipe (per cent)
26
Own stock 56 21 53 22
Purchase from shops/markets 18 49 22 36
Purchase from other farmers 13 11 10 30
Borrowed/exchange/worked for seed 11 6 24 8
Gift from another farmer 7 1 3 2
Government 0 16 1 0
Concern Universal 0 7 12 2
Other 1 9 11 4
Local
maize
(n=106)
Hybrid
maize
(n=68)
Beans
(n=120)
Potatoes
(n=50)
Notes: Other included specialized seed producer for potatoes.
Totals exceed 100% due to multiple sources
Marketing of agricultural produce
Farmers sold agricultural produce principally to local traders (Table 3.10). Long distance traders came to
Linthipe to purchase potatoes, beans and cassava. A minority of farmers sold crops, mainly cassava, maize
and potatoes, to other farmers. Farmers complained about only one major marketing constraint: low price
(Table 3.11) - which is confirmed by the prices indicated in Table 3.12. Problems associated specifically
with the marketing of tubers include poor quality (cassava), storage loss and spoilage and lack of transport.
A minority of respondents noted the lack of markets and market information, and cheating by traders.

Table 3.10: Buyers of agricultural produce, Linthipe (per cent)
Low price 94 97 90 82
Lack of market 2 1 0 0
Lack of information on buyers 0 1 0 0
Lack of transport 2 0 7 9
Poor quality of produce 0 0 0 5
Storage loss 0 0 0 2
Lack of storage facilities 0 0 0 0
Cheating on scales 2 1 0 0
Fast spoilage 0 0 3 2
Table 3.11: Marketing constraints by crop. Linthipe (per cent)
Maize
(n=53)
Beans
(n=104)
Irish potatoes
(n=29)
Cassava
(n=56)
27
Farmers 15 8 12 20
Local traders 71 66 56 54
Long distance traders 14 26 33 26
Maize
(n=59)
Beans
(n=110)
Potatoes
(n=39)
Cassava
(n=79)
Table 3. 12: Price of major crops in 2000-01, Linthipe
Crop Time of year Price (MK/kg)
Maize May-June 3-3.50
July-September 3-10
November-December 12-15
Beans March-May 8
June-September 12-25
October-November 15-18
Potatoes Feb-May 80/pail
June-January 200/pail
Cassava August-December 25
Land use and management
In Linthipe, the average size of fields was 0.93 ha in the uplands and 0.29 ha in dimbas, with significant
differences for both land use types by wealth. Similar land size holdings, although not broken down by land
use categories, were cited by other studies (Malawi, 2000; Ellis et al, 2002). On average, male-headed
households cultivated a mean of 1.26 ha of land compared with 0.69 ha for female-headed households (P
≤.001 for t test). Land inheritance follows the matrilineal lineage and is passed on to female offspring, with
the maternal uncle presiding over ownership.
All households, with one exception, used soil fertility improvement measures, the most common being
incorporation of crop residues, crop rotation, chemical fertilizer and compost manure (Table 3.13).

Poles/timber 8 0 5 0 3 2 18
Multipurpose 3 2 5 0 4 2 16
Firewood 3 0 5 0 1 0 9
Shade 0 1 3 1 0 0 5
Other 1 2 0 0 0 1 4
Purpose Farm
boundaries
Crop
land
Home-
stead
Dimbas Woodlot Village
forests
Total
28
Reflecting the low livestock population, about a fourth of households used livestock manure. Farmers
typically applied soil amendments to maize, the main food crop.
Table 3.13: Soil fertility improvement measures, Linthipe (per cent) (N=120)
Crop residue 66
Crop rotation 56
Chemical fertilizer 56
Compost manure 56
Livestock manure 38
Farmyard manure 37
Other 13
The majority of farmers (93%) practiced some form of soil erosion control measure, mainly contour ridges
(68%), marker ridges (56%) and box ridges (48%), technologies promoted by CU. Although 38% of
households reported having gullies or rills on their farmland, over 58% perceived soil erosion as a minor
problem; only 28% rated it a very serious or serious problem.
Tree planting
Thirty-four per cent of households had planted trees between 1999 and 2001. The most common niches for
trees were the homestead and farm boundaries (Appendix Table 15). The most common trees planted were
Eucaplyptus and Acassia spp., but a few farmers planted Tephrosia, Grevillea and Leucaena. Farmers mainly
planted trees for timber and poles (43%), multiple purposes (38%) and firewood (21%). Farmers in Linthipe
did not plant trees exclusively to improve soil fertility, curb erosion or for fruit, but combined these with
other multi-purpose objectives, notably firewood production. Notably, the predominant cooking fuel among
surveyed households was firewood (95%) but 9% of households used maize stover for cooking as a result of
firewood shortages.
Table 3.14: Purpose of tree planting by niche, Linthipe (frequency; n=42)
Food security
The most important dietary staple in Malawi is maize, eaten as a stiff porridge (nsima); secondary staples
include sweet potato, cassava, millet and sorghum. Normally, the “hungry period” extends from June to
November, but recently, a number of factors have contributed to an extended hungry season lasting through
February. These factors include repeated droughts, frequent involvement of household members in ganyu
labour and the high incidence of HIV/AIDS (pers. comm. C. Chitsike). The last two factors have
significantly decreased labour available for agricultural activities, thereby contributing to lower
productivity. Nearly all surveyed households experienced food shortages of the major foods (Table 3.15).
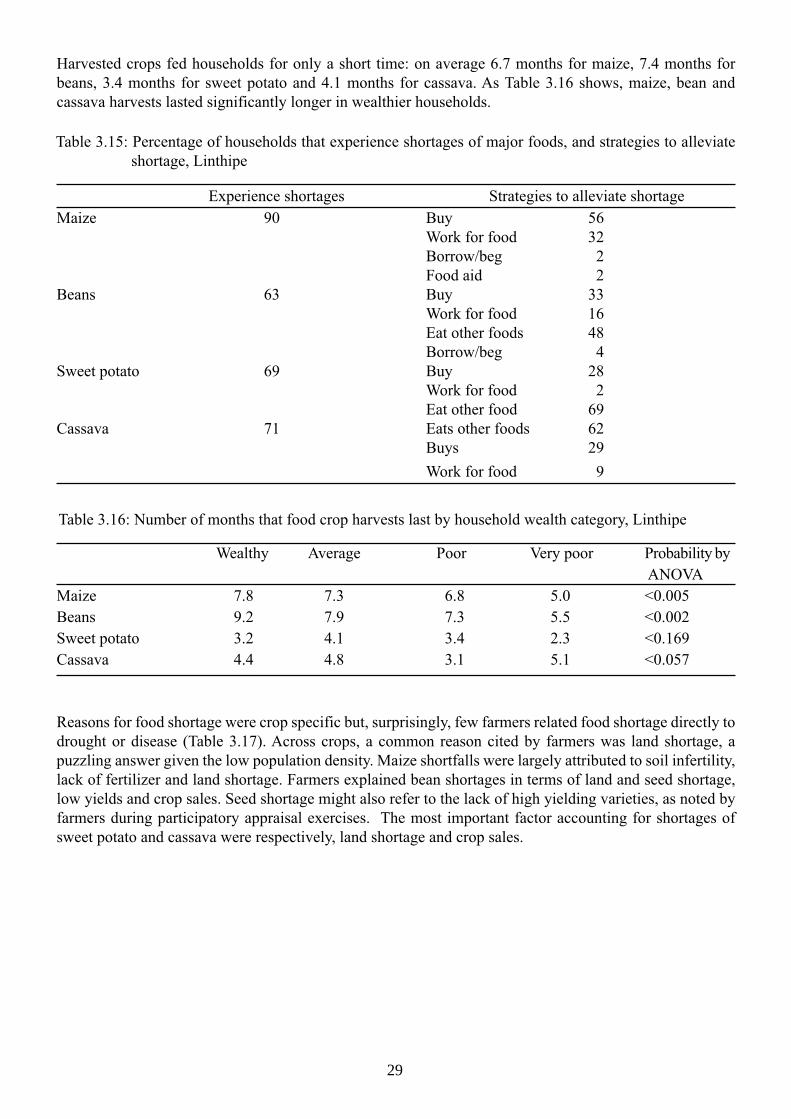
29
Harvested crops fed households for only a short time: on average 6.7 months for maize, 7.4 months for
beans, 3.4 months for sweet potato and 4.1 months for cassava. As Table 3.16 shows, maize, bean and
cassava harvests lasted significantly longer in wealthier households.
Maize 90 Buy 56
Work for food 32
Borrow/beg 2
Food aid 2
Beans 63 Buy 33
Work for food 16
Eat other foods 48
Borrow/beg 4
Sweet potato 69 Buy 28
Work for food 2
Eat other food 69
Cassava 71 Eats other foods 62
Buys 29
Work for food 9
Table 3.15: Percentage of households that experience shortages of major foods, and strategies to alleviate
shortage, Linthipe
Experience shortages Strategies to alleviate shortage
Wealthy Average Poor Very poor Probability by
ANOVA
Maize 7.8 7.3 6.8 5.0 <0.005
Beans 9.2 7.9 7.3 5.5 <0.002
Sweet potato 3.2 4.1 3.4 2.3 <0.169
Cassava 4.4 4.8 3.1 5.1 <0.057
Table 3.16: Number of months that food crop harvests last by household wealth category, Linthipe
Reasons for food shortage were crop specific but, surprisingly, few farmers related food shortage directly to
drought or disease (Table 3.17). Across crops, a common reason cited by farmers was land shortage, a
puzzling answer given the low population density. Maize shortfalls were largely attributed to soil infertility,
lack of fertilizer and land shortage. Farmers explained bean shortages in terms of land and seed shortage,
low yields and crop sales. Seed shortage might also refer to the lack of high yielding varieties, as noted by
farmers during participatory appraisal exercises. The most important factor accounting for shortages of
sweet potato and cassava were respectively, land shortage and crop sales.

30
Land shortage 18 19 42 21
Infertile soil/lack of fertilizer 45 4 0 0
Drought 6 4 0 0
Large households 5 1 3 0
Sells crop 4 16 13 31
Low yields/little harvest 8 18 10 6
Storage problems 1 3 18 7
Seed shortage 0 19 10 2
Theft 1 0 0 18
Diseases 0 3 0 3
Other 12 12 3 12
Maize
(n=99)
Beans
(n=67)
Sweet potato
(n=53)
Cassava
(n=56)
Table 3.17: Reasons for food shortages of major staples, Linthipe (per cent)
Farmers coped with food shortages in different ways depending on the crop (Table 3.15). When maize
stocks ran out, farmers purchased maize or did ganyu labour to obtain this preferred staple. When they ran
out of beans, sweet potatoes or cassava, most farmers either ate other foods or purchased those commodities.
During the hungry period, surveyed households ate an average of 1.4 meals a day, with no significant
difference by wealth categories (Appendix Table 16).
Development activities
Sixty-two per cent of households had participated in activities organized by CU, mainly in the area of
receiving seed/planting materials (97%), tree planting (32%), seed production (33%), making marker ridges
(27%), crop storage (19%), livestock donations (13%) and installation of treadle pumps (13%). A third of
respondents were members of CU village committees (31%).
The majority of respondents of both sexes were highly optimistic about their ability to bring about change
locally, with little difference in opinion by gender (Appendix Table 17). Slightly more than half of both male
and female respondents had no objection to their children becoming small-scale farmers, irrespective of
their sex (Appendix Table 18).
Conflict, collective action and social capital
About half of the farmers surveyed, both men and women, felt that their community was very peaceful
(Appendix Table 19). Only a minority reported a high level of conflict. The three factors reported by both
men and women to divide communities in Linthipe were land size, differences in educational level and
wealth (Appendix Table 20). Women, in particular, perceived differences in asset ownership as a
diversionary factor. A significant proportion of respondents (42% of men and 31% of women) felt that theft
had increased in the past 10 years, but a near equal number felt that there had been no change (28% of men
and 40% of women). Farmers, both men and women, reported a high level of participation in their
communities (Appendix Table 21). This was confirmed by the high proportion of both male and female
respondents who had taken part in some form of collective action in 2000-2001 (Table 3.18). Because
collective action was mainly related to constructing communal facilities (schools, bore hole and bridge
construction), all of which were initiated by government or CU, a slightly higher number of men than
women were involved. Also, more farmers in project villages compared with Chikonde were involved in
collective action. Relatively few respondents reported collective action unrelated to development activities,
such as theft reduction, family disputes and funeral arrangements.

Type of issue Men (n=60) Women (n=69)
Overall 71 60
Type of involvement:
School construction 28 33
Bore hole construction 28 28
Bridge construction 15 15
Theft reduction 13 9
Others 22 23
Village development group 65 32 36 32
Concern Universal groups 43 41 35 24
Burial groups 7 33 67 0
School committee group 7 67 0 33
Health group 5 100 0 0
Literacy School Community group 5 50 50 0
Khulamoyo Development group 2 0 100 0
Malawi Social Action Fund (MASAF) 2 0 0 100
Elderly women groups 2 0 100 0
% of households
(n=43)
Men
alone
Wo m e n
alone
Both
31
Table 3.18: Involvement in collective action, 2000-01, Linthipe (per cent)
Fifty-six per cent of households belonged to a group. On average, each household had 1.3 group members,
with no significant difference by household wealth status, gender or residence in a project or non-project
village. Relatively few households belonged to the three indigenous groups: Khalamoyo Development Group,
burial groups and groups formed by elderly women (Table 3.19). The relatively scarcity of indigenous
groups can be largely attributed to the Banda government’s policy of stamping out local organizations as
part of a strategy of containing political dissent. Village development groups (including MSAF), school
committees and health groups were established by the government, while literacy school community groups
and groups related to specific project activities were formed by CU. Group interviews confirmed the
important role of NGOs, especially CU, in fostering trust between people and encouraging group formation.
Table 3.19: Household membership in groups, Linthipe (per cent)
Most development groups had mixed membership with the exception of Khulamoyo Development Group,
an exclusive female group, and the health group, an exclusive male group. Although burial groups had
members of both sex, membership was predominantly female.
Patterns of technology and information/knowledge diffusion were similar for men and women (Table 3.20).
Most farmers shared seed and knowledge, but less commonly tools, possibly because new tools were rarely
available. Based on the frequency of responses, diffusion follows a spatial pattern, starting with relatives in
the same village, followed by friends in the same village and relatives and friends in other villages. Men
were more likely than women to share technologies indiscriminately.

32
Table 3.20: Diffusion pathways of new agricultural technologies and information, Linthipe (per cent)
Relative, same village 85 74 83 81 77 78
Friend, same village 55 48 50 47 48 57
Relative, other village 41 36 38 44 36 39
Friend, other village 44 38 33 34 31 30
Member of same group 52 47 54 38 31 52
Concern Universal 9 11 4 1 13 4
Agricultural officer 3 14 8 2 16 4
Anyone 26 22 17 17 15 9
Men (n=85) Women (n=113)
Seed
(n=66)
Knowledge
(n=73)
Tools
(n=24)
Seed
(n=85)
Knowledge
(n=95)
Tools
(n=23)
Marital conflict and decision-making
About half of married respondents (51% of women and 48% of men) reported conflicts with their spouse.
The single most important area of conflict reported by both men and women was financial decision-making
and decision-making generally (Table 3.21). Both sexes also reported conflicts over their spouses’ refusal to
work. Only women reported conflicts over extra-marital affairs by men. Excessive drinking and domestic
violence were mentioned by a minority of respondents of both sexes, the latter possibly because of social
norms. Other conflict areas include non-performance of conjugal roles and personality conflicts.
Table 3.21: Areas of marital conflict, Linthipe (per cent)
Men (n=39) Women (n=46)
Conflicts over money/decision-making 29 33
Refusal to work/division of labour 22 16
Conflicts over other women 5 15
Husband’s drinking 3 8
Wife’s drinking 2 3
Domestic violence 0 4
Laziness 3 0
Other 38 21
Note: includes women with both resident and non-resident husbands
Decision-making among married couples in Linthipe took two major forms dominated by men: husbands
made decisions unilaterally or consulted their wives before making a decision (Table 3.22). Joint
decision-making was common among a minority of couples. Women rarely initiated or made decision
unilaterally, the exception being the use of small amounts of money. There was a moderate degree of
disagreement among couples on decision-making patterns, which could mean that responses were largely
based on social norms, rather than reality. Couples agreed most on decisions related to land use and family
planning and least on financial decisions.
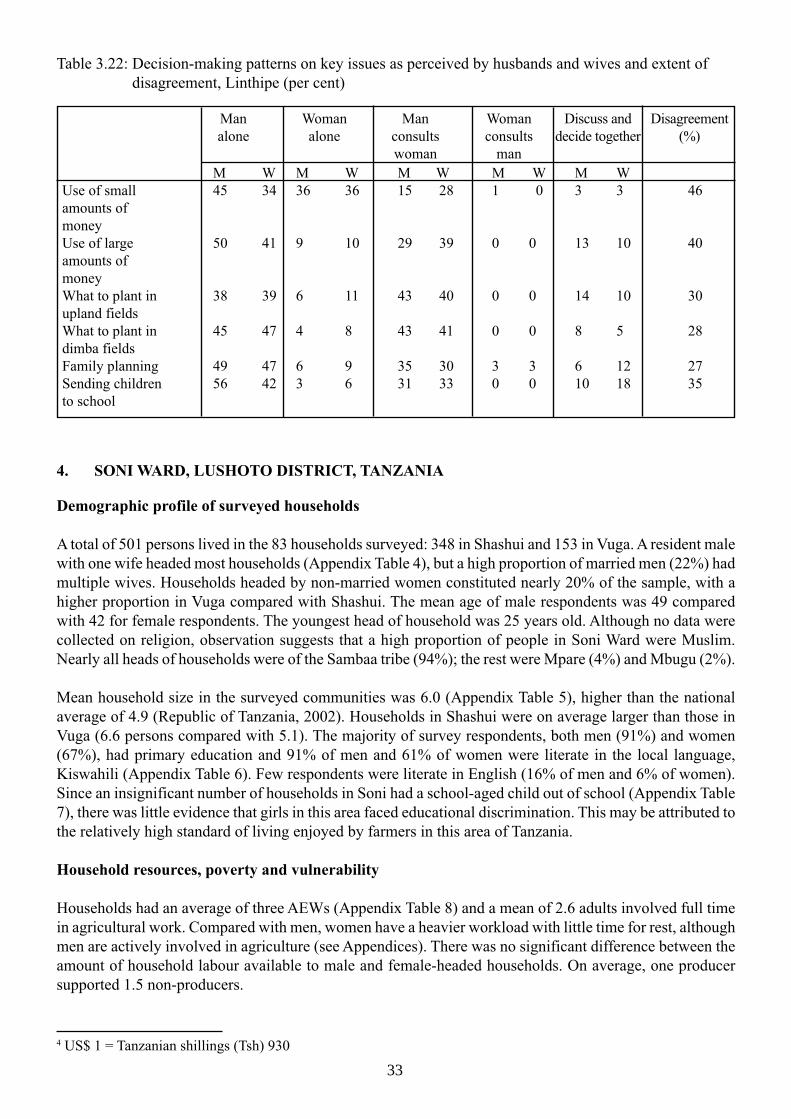
4 US$ 1 = Tanzanian shillings (Tsh) 930
33
Table 3.22: Decision-making patterns on key issues as perceived by husbands and wives and extent of
disagreement, Linthipe (per cent)
M W M W M W M W M W
Use of small 45 34 36 36 15 28 1 0 3 3 46
amounts of
money
Use of large 50 41 9 10 29 39 0 0 13 10 40
amounts of
money
What to plant in 38 39 6 11 43 40 0 0 14 10 30
upland fields
What to plant in 45 47 4 8 43 41 0 0 8 5 28
dimba fields
Family planning 49 47 6 9 35 30 3 3 6 12 27
Sending children 56 42 3 6 31 33 0 0 10 18 35
to school
Man
alone
Woman
alone
Man
consults
woman
Woman
consults
man
Discuss and
decide together
Disagreement
(%)
4. SONI WARD, LUSHOTO DISTRICT, TANZANIA
Demographic profile of surveyed households
A total of 501 persons lived in the 83 households surveyed: 348 in Shashui and 153 in Vuga. A resident male
with one wife headed most households (Appendix Table 4), but a high proportion of married men (22%) had
multiple wives. Households headed by non-married women constituted nearly 20% of the sample, with a
higher proportion in Vuga compared with Shashui. The mean age of male respondents was 49 compared
with 42 for female respondents. The youngest head of household was 25 years old. Although no data were
collected on religion, observation suggests that a high proportion of people in Soni Ward were Muslim.
Nearly all heads of households were of the Sambaa tribe (94%); the rest were Mpare (4%) and Mbugu (2%).
Mean household size in the surveyed communities was 6.0 (Appendix Table 5), higher than the national
average of 4.9 (Republic of Tanzania, 2002). Households in Shashui were on average larger than those in
Vuga (6.6 persons compared with 5.1). The majority of survey respondents, both men (91%) and women
(67%), had primary education and 91% of men and 61% of women were literate in the local language,
Kiswahili (Appendix Table 6). Few respondents were literate in English (16% of men and 6% of women).
Since an insignificant number of households in Soni had a school-aged child out of school (Appendix Table
7), there was little evidence that girls in this area faced educational discrimination. This may be attributed to
the relatively high standard of living enjoyed by farmers in this area of Tanzania.
Household resources, poverty and vulnerability
Households had an average of three AEWs (Appendix Table 8) and a mean of 2.6 adults involved full time
in agricultural work. Compared with men, women have a heavier workload with little time for rest, although
men are actively involved in agriculture (see Appendices). There was no significant difference between the
amount of household labour available to male and female-headed households. On average, one producer
supported 1.5 non-producers.

34
Informants identified eight wealth groups that were collapsed for ease of analysis into four groups: wealthy,
above average, average, poor and very poor (Appendix Table 9). The wealthiest and poorest groups, the
latter consisting of destitute people (e.g. the mentally disturbed and alcoholics), were not represented in the
surveyed communities. There was no significant difference in the representation of wealth groups in project
and non-project areas, although 17% of households in Vuga were classified as poor compared with 6% in
Shashui. The three wealth groups represented in the sample (above average, average and poor) differed
significantly on household size, available labour and annual agricultural income, with wealthier households
being largely male-headed and better endowed with people, labour and income (Table 4.1). On average, in
2001-02 households earned Tzs 139,077 from agriculture, with significant differences by wealth and
gender. Female-headed households had significantly lower annual agricultural incomes than male-headed
households: Tsh 41,066 compared with Tsh 155,6144 (P ≤ .01 for t test). Average annual earnings from
crops amounted to Tsh 106,182 and Tsh 79,156 from livestock.
Household size 7.1 5.9 4.4 6.1 0.02*
Percentage headed by women 10 24 25 20 0.37
Adult equivalent workers 3.9 2.8 2.1 3.0 0.00*
Annual agricultural income 235,914 105,204 88,125 139,077 0.00*
(Tsh) (2001-2002)
Own livestock (percent) 100 96 88 96 0.28
Owns a radio (percent) 81 59 50 64 0.14
Table 4.1: Household differentiation by wealth on selected socio-economic characteristics, Soni
Above average
(n=21)
Average
(n=51)
Poor
(n=8)
Overall
averageProbability
* *Statistics from ANOVA; the rest from chi square
Average annual income from agriculture was Tsh. 139,077. A recent household budget survey in Tanzania
estimated mean annual income for rural households at Tsh. 169,608, with 60% generated by agricultural
activities (United Republic of Tanzania, 2001). Most farmers had their highest income between July and
November, when they sell produce from the long rains. Generally, incomes were depressed between March
and June when crops are in the field.
Only a quarter of female respondents had off-farm sources of income, compared with 56% of men. Women
were involved in a limited number of income generating activities (Appendix Table 10), with petty trade and
baking providing the highest income. The most common and lucrative income generating activities for men
were business and casual labour. Petty trade was more important for men in Shashui, whereas salaried
employment was a principal source of income for men in Vuga. On average, men were involved in 1.4
off-farm activities compared with 1.2 for women, with no significant difference in the number of activities
by wealth.
The majority of farmers (75% of men and 78% of women) saved money, but for the most part, irregularly.
Most (74% of men and 66% of women) saved less than 5 times a year. Amount saved did not differ
significantly by wealth among both men and women, but on average, per saving period, men saved
significantly more money than women: Tsh 11,642 compared to Tsh 2,137 (P≤ 0.001 for t test). Fifty-five
per cent of men borrowed money in 2000 compared to a third of women. The main sources of borrowed
money were relatives and friends, but a minority of women got loans from informal credit and savings
groups, while a few men obtained loans from formal institutions such as NGOs and churches (Appendix
Table 11). Survey respondents mainly used borrowed money to purchase non-food household necessities,
food, pay for medical and school related expenses, invest in business (mainly men) and purchase
agricultural inputs (mainly men).

35
Table 4.2: Emergency coping strategies, Soni (per cent)
Strategy Need money for
school fees
Need money for
health expenses
Food shortage Crop failure
Women Men Women Men Women Men Women Men
Borrow money from 31 26 62 53 23 26 17 20
friends or relatives
Sell livestock 28 29 17 27 19 17 16 20
Work as hired 13 15 7 9 18 17 23 24
labour
Sell crop 14 8 4 4 0 1 4 1
Sell land or 9 13 2 1 2 1 1 2
property
Borrow food from 0 0 0 0 20 26 18 9
shop, relative
or friend
Buy food 0 0 0 0 14 9 14 16
Other 6 7 8 4 4 3 6 9
Farmers’ coping strategies in emergency situations included borrowing money, selling livestock, working as
hired labour, borrowing or buying food, and more rarely, selling crops, land or property (Table 4.2).
Differences in men’s and women’s coping strategies corresponded to gender differences in spheres of
control over property such as livestock and land.
M W M W M W
Save 0.53 1.00 0.72 0.72 0.50 1.00Business 0.84 1.29 1.18 0.84 1.33 0.29House improvement 2.11 1.10 2.0 1.74 2.50 0.71Livestock 1.26 1.90 1.26 1.72 1.67 0.71Land 1.63 1.05 1.10 1.08 1.17 1.00Better food 0.42 0.38 0.41 0.42 0.67 1.57More food 0.42 0.78 0.77 0.90 1.17 1.86Agricultural inputs 1.74 0.52 1.23 0.48 1.50 0.86Clothes 0.37 0.81 0.31 1.10 1.00 2.00School fees 1.00 1.33 0.90 0.54 0.50 0.86Other 0.21 0 0.23 0.04 0 0
Table 4.3: Investment priority scores by wealth status and gender, Soni (men n=83; women n=113)
Wealth rank
Above average Average Poor
Farmers’ investment aspirations
Men and women had similar broad areas of investment interests, but different priorities (Appendix Table
12). Women’s emphasis was on livestock, housing, clothes and business, whereas men’s priorities were
housing, agricultural inputs (seed, fertilizer, pesticide), livestock and business - in that order. Improving
food security, an area emphasized more by women, received relatively low priority. Business interests
centred around retail shops and petty trade of crops (mainly women). Investment scores showed that wealthier
women had a strong interest in using extra income for school fees, whereas poor women put more emphasis
on improving food security (Table 4.3). Aside from poor men’s strong interest in buying clothes, there were
no wealth-related differences in men’s investment scores.
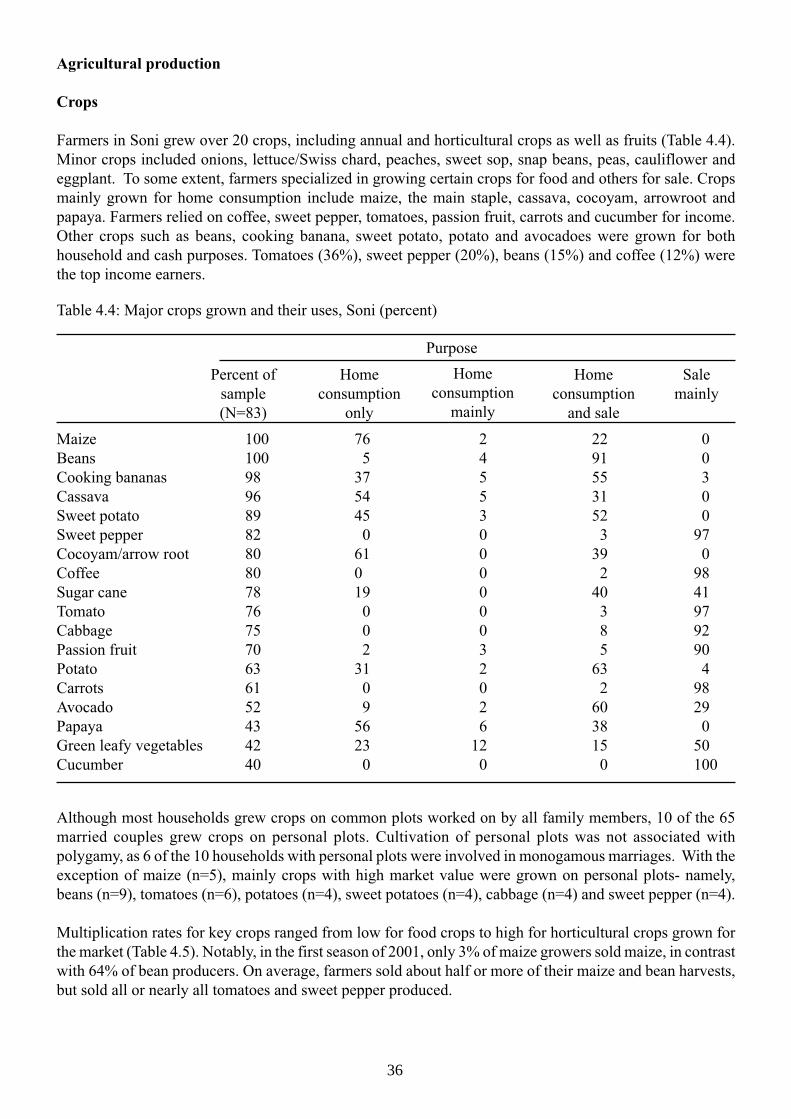
Maize 100 76 2 22 0
Beans 100 5 4 91 0
Cooking bananas 98 37 5 55 3
Cassava 96 54 5 31 0
Sweet potato 89 45 3 52 0
Sweet pepper 82 0 0 3 97
Cocoyam/arrow root 80 61 0 39 0
Coffee 80 0 0 2 98
Sugar cane 78 19 0 40 41
Tomato 76 0 0 3 97
Cabbage 75 0 0 8 92
Passion fruit 70 2 3 5 90
Potato 63 31 2 63 4
Carrots 61 0 0 2 98
Avocado 52 9 2 60 29
Papaya 43 56 6 38 0
Green leafy vegetables 42 23 12 15 50
Cucumber 40 0 0 0 100
Table 4.4: Major crops grown and their uses, Soni (percent)
Purpose
Percent of
sample
(N=83)
Home
consumption
only
Home
consumption
mainly
Home
consumption
and sale
Sale
mainly
36
Agricultural production
Crops
Farmers in Soni grew over 20 crops, including annual and horticultural crops as well as fruits (Table 4.4).
Minor crops included onions, lettuce/Swiss chard, peaches, sweet sop, snap beans, peas, cauliflower and
eggplant. To some extent, farmers specialized in growing certain crops for food and others for sale. Crops
mainly grown for home consumption include maize, the main staple, cassava, cocoyam, arrowroot and
papaya. Farmers relied on coffee, sweet pepper, tomatoes, passion fruit, carrots and cucumber for income.
Other crops such as beans, cooking banana, sweet potato, potato and avocadoes were grown for both
household and cash purposes. Tomatoes (36%), sweet pepper (20%), beans (15%) and coffee (12%) were
the top income earners.
Although most households grew crops on common plots worked on by all family members, 10 of the 65
married couples grew crops on personal plots. Cultivation of personal plots was not associated with
polygamy, as 6 of the 10 households with personal plots were involved in monogamous marriages. With the
exception of maize (n=5), mainly crops with high market value were grown on personal plots- namely,
beans (n=9), tomatoes (n=6), potatoes (n=4), sweet potatoes (n=4), cabbage (n=4) and sweet pepper (n=4).
Multiplication rates for key crops ranged from low for food crops to high for horticultural crops grown for
the market (Table 4.5). Notably, in the first season of 2001, only 3% of maize growers sold maize, in contrast
with 64% of bean producers. On average, farmers sold about half or more of their maize and bean harvests,
but sold all or nearly all tomatoes and sweet pepper produced.

Table 4.5: Production of some principal crops in first season of 2001 (kg), Soni
Maize
(n=68)
Beans
(n=61)Tomatoes
(n=50)
Sweet pepper
(n=52)
Amount planted 17 23 0.1 4.6
(3-60) (3-80) (0.01-0.5) (0.1-120)
Amount harvested 265 105 1051 333
(36-1200) (2-400) (5-5000) (20-3200)
Amount sold 300* 77 1072 333
(4-300) (40-5000) (20-3200)
Note: Only 2 farmers sold maize
Total number of 8 12 7 3varieties grownMean number of 1.8 3.1 1.6 1.2varieties grownIntroduced varieties Red maize
KatumaniIlongaKilimaHybrid F1H632Et al
Maize(n=83)
Beans(n=83)
Tomato(n=63)
Sweet pepper(n=69)
Lyamungu 85/90
Selian 94
Jesca
Dumudumu/
Kigongo
Kitaruma
Yellow wonder
A and B
California
37
The level of varietal diversity at community level was high for the main crops with the exception of sweet
pepper, a cash crop (Table 4.6). However, at household level, varietal diversity was relatively low. Farmers
in Soni were moderately or highly responsive to new maize and bean varieties. Commonly adopted maize
varieties include Red maize (46%), Katumani (43%), Ilonga (33%) and Kilima (25%); most households had
adopted these varieties prior to 1996. There was no clear pattern of differences in adoption rates for maize
varieties between project and non-project villages. Lyamungu 85 and 90 bean varieties, introduced in the
late 1980s or early 1990s, were grown by 77% of households, but only 2% of households grew other
introduced bean varieties (i.e. Selian and Jesca). Notably, a significantly higher proportion of bean growing
households in Shashui grew Lyamungu 85/90 (94%) compared with Vuga (47%).
Table 4.6: Number of varieties grown of some major crops and names of introduced varieties, Soni
Livestock
Nearly all households in Soni (95%), irrespective of wealth status, owned livestock, mainly chickens, cattle,
goats and sheep (Appendix Table 13). However, all households in Shashui owned livestock compared with
87% of households in Vuga. Mainly men owned cattle, sheep and goats, while women and children owned
chickens. Farmers kept cattle for income generation (milk and meat) and manure: dairy farming, an activity
promoted by a German project in the early 1990s, was an important activity mainly for men. Goats were
kept as an asset (44%), while sheep were both an asset and source of manure (33%).
Input use and seed sources
Reflecting the prevalence of hybrid maize, vegetable and coffee production in Soni, the vast majority of
surveyed farmers used manure, fungicide, insecticide and chemical fertilizer (Appendix Table 14). Farmers
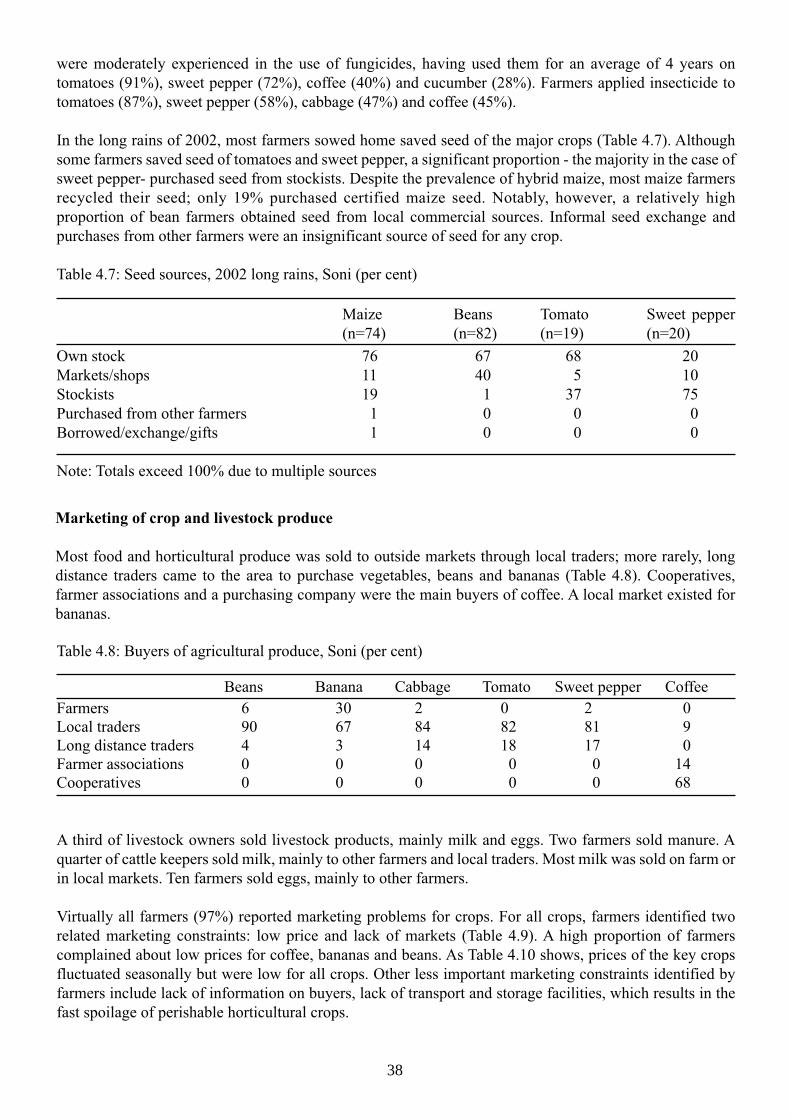
were moderately experienced in the use of fungicides, having used them for an average of 4 years on
tomatoes (91%), sweet pepper (72%), coffee (40%) and cucumber (28%). Farmers applied insecticide to
tomatoes (87%), sweet pepper (58%), cabbage (47%) and coffee (45%).
In the long rains of 2002, most farmers sowed home saved seed of the major crops (Table 4.7). Although
some farmers saved seed of tomatoes and sweet pepper, a significant proportion - the majority in the case of
sweet pepper- purchased seed from stockists. Despite the prevalence of hybrid maize, most maize farmers
recycled their seed; only 19% purchased certified maize seed. Notably, however, a relatively high
proportion of bean farmers obtained seed from local commercial sources. Informal seed exchange and
purchases from other farmers were an insignificant source of seed for any crop.
Table 4.7: Seed sources, 2002 long rains, Soni (per cent)
Own stock 76 67 68 20
Markets/shops 11 40 5 10
Stockists 19 1 37 75
Purchased from other farmers 1 0 0 0
Borrowed/exchange/gifts 1 0 0 0
Note: Totals exceed 100% due to multiple sources
Maize
(n=74)
Beans
(n=82)
Tomato
(n=19)
Sweet pepper
(n=20)
38
Marketing of crop and livestock produce
Most food and horticultural produce was sold to outside markets through local traders; more rarely, long
distance traders came to the area to purchase vegetables, beans and bananas (Table 4.8). Cooperatives,
farmer associations and a purchasing company were the main buyers of coffee. A local market existed for
bananas.
Table 4.8: Buyers of agricultural produce, Soni (per cent)
Beans Banana Cabbage Tomato Sweet pepper Coffee
Farmers 6 30 2 0 2 0
Local traders 90 67 84 82 81 9
Long distance traders 4 3 14 18 17 0
Farmer associations 0 0 0 0 0 14
Cooperatives 0 0 0 0 0 68
A third of livestock owners sold livestock products, mainly milk and eggs. Two farmers sold manure. A
quarter of cattle keepers sold milk, mainly to other farmers and local traders. Most milk was sold on farm or
in local markets. Ten farmers sold eggs, mainly to other farmers.
Virtually all farmers (97%) reported marketing problems for crops. For all crops, farmers identified two
related marketing constraints: low price and lack of markets (Table 4.9). A high proportion of farmers
complained about low prices for coffee, bananas and beans. As Table 4.10 shows, prices of the key crops
fluctuated seasonally but were low for all crops. Other less important marketing constraints identified by
farmers include lack of information on buyers, lack of transport and storage facilities, which results in the
fast spoilage of perishable horticultural crops.

39
Table 4.9: Marketing constraints of major crops, Soni (per cent)
Beans Bananas Cabbage Tomato Sweet pepper Coffee
Low price 58 63 38 32 38 68
Lack of market 23 16 27 24 26 13
Lack of information 2 0 6 8 7 8
on buyers
Lack of transport 8 9 8 7 8 6
Poor quality of produce 0 0 0 4 0 1
Storage loss 3 0 7 7 8 0
Lack of storage 6 2 8 11 7 2
facilities
Fast spoilage 1 9 6 7 6 0
Table 4.10: Prices of major crops at different times of the year, Soni
Crop Season Price (Tsh/kg)
Tomato June-October 150
October-January (short rains) 250-300
Cabbage June-September 50
Carrots Feb-May (long rains) 100
June-September 100-150
Sweet pepper May-September 100
October-January (short rains) 250
Beans February-May (long rains) 200
Land management
All farmers (99%) sought to improve soil fertility in the mountainous conditions of the Usambaras by using
manure (97%), incorporating crop residues (95%), chemical fertilizer (52%), planting agroforestry trees
(52%), crop rotation (32%) or terracing (32%). Possibly as a reflection of the success of conservation
programs, only 12% of respondents perceived erosion as a serious problem.
Food security
Maize is the most important staple food in Lushoto District and is eaten as a stiff porridge (ugali) typically
accompanied by beans and other sauces. Secondary staples include rice and potatoes. The hungry period
extends from July to November, during the short rains, which tend to be unpredictable. During that period,
households did not significantly cut down consumption, eating an average of 2.3 meals, with no difference
by household wealth status (Appendix Table 16). As the staple crops of maize and beans lasted for an
average of 5.8 and 3.7 months respectively, a high proportion of surveyed households experienced shortages
of maize and beans (Table 4.11) primarily as a result of drought (Table 4.12). Bean, but not maize, harvests
lasted significantly longer among better off households, possibly due to the more diversified diet enjoyed by
this group. Given the dietary importance of maize and beans and the commercialized economy, most farmers
buy these commodities when they run out of them. Notably, because farmers in Soni grow cash crops, few
attributed food shortages to crop sale.

Maize (n=72) Beans (n=76)
Drought 57 52
Scarcity of land 11 9
Storage problems 3 1
Low yields/sell harvest 2 4
Low soil fertility 9 5
Other 19 22
Experience shortages Strategies to alleviate shortage
Maize 87 Buys 73
Eats other foods 25
Work for food 2
Beans 92 Buys 75
Eats other foods 24
Works for food 1
Table 4.12: Reasons for food shortages, Soni (per cent)
40
Table 4.11: Percentage of households that experienced shortages of major foods and strategies to alleviate
shortages, Soni
Development activities
All surveyed households in Shashui had been involved with TIP in a range of activities including terrace
construction (98%), digging irrigation canals (98%) collecting stones for building the reservoir (85%),
collecting forest soil for tree planting (77%), planting trees (21%), maintaining irrigation canals (23%) and
attending training seminars (15%). On average, surveyed households had worked with TIP for 7.8 years.
Farmers in Soni were relatively optimistic about their ability to influence their local situation, with about
half of surveyed respondents reporting some level of influence (Appendix Table 17). There was little
difference in men’s and women’s views on this issue. Perhaps reflecting their relatively high level of
prosperity, over half of men and women respondents wanted their children to follow their footsteps and
become small-scale farmers (Appendix Table 18).
Conflict, collective action and social capital
The vast majority of farmers, both men and women, felt that their community was peaceful (Appendix Table
19). As further evidence of the relatively high degree of social harmony, and perhaps reflecting the
prevailing Islamic culture, the majority of men (70%) and women (64%) felt that there had been no change
in the incidence of theft in the past 10 years. Respondents perceived several factors as responsible for social
divisions, namely, wealth, education and land size (Appendix Table 20). The majority of respondents felt
that the level of participation in their community was moderate to high (Appendix Table 21). A higher
proportion of men than women, particularly from Shashui, were involved in collective action in 2001-02
(Table 4.13). While men were more likely than women to be involved in mediating family disputes and
transporting the sick to hospital, both sexes were involved in activities related to burials, communal work
generally and irrigation.

(n=67)
Men (n=67) Women (n=81)
Seed Knowledge Tools Seed Knowledge Tools
41
Table 4.13: Involvement in collective action in 2001-2002, Soni (per cent)
Men (n=35) Women (n=30)
Percent involved 52 39
Type of problem
Burials 49 60
Communal work 49 40
Family disputes 17 7
Distillation of irrigation canal 17 13
Transport of sick to hospital 20 10
Construction related to irrigation 11 10
Other 37 23
Most households (81%) belonged to a local group. Aside from the land conservation groups created by TIP,
all groups were indigenous. Respondents belonged to 6 categories of groups (Table 4.14). While
membership in burial groups was widespread, relatively few households belonged to other types of groups.
On average, 1.2 household members belonged to a group, with no significant difference between the two
villages. Wealthier households had a significantly higher number of members belonging to groups: 2.2
compared to 1.4 for poor households (F statistic=3.70, 62 df; P ≤ 0.03). Membership in groups was generally
mixed, with the exception of credit and savings groups and sewing groups that had exclusively female
membership, and land conservation groups and communal work groups, which were dominated by men. A
higher proportion of women (49%) compared to men (27%) belonged to groups.
Table 4.14: Household membership in local groups by gender, Soni (per cent)
% of households Men alone Women alone Both
Farmers carefully select those with whom they shared information, following a geographically spatially
pattern, starting with relatives and friends in the same village, members of the same group and relatives and
friends in other villages Table 4.15). There was little difference between men’s and women’s diffusion
patterns.
Table 4.15: Diffusion of new technologies and knowledge, Soni (per cent)
Relative, same village 90 85 81 90 89 77
Friend, same village 85 82 73 40 78 73
Relative, other village 43 55 24 82 42 20
Friend, other village 43 48 27 37 42 24
Member of same group 79 82 75 59 61 55
Anyone 9 15 2 9 12 0
Burial group 94 3 62 35
Communal work/digging group 12 63 13 25
Religious group 9 17 33 50
Soil/land conservation 5 67 33 0
Income generating group 3 50 50 0
Sewing group 2 0 100 0
Credit/savings 2 0 100 0

Drunkenness 0 24
Coming home late 0 28
Doesn’t provide money for household necessities 0 8
Domestic violence 0 24
Unfaithfulness 25 0
Failure to do assigned work 40 0
Other 35 16
Table 4.16: Areas of marital conflict as reported by husbands and wives, Soni (per cent)
Husbands
(n=14)
Wives
(n=18)
42
Marital conflict and decision-making
About a quarter of husbands (23%) and wives (28%) reported having marital conflicts, but significantly,
they perceived areas on which they disagreed very differently (Table 4.16). According to husbands, marital
discord mainly centred on wives’ failure to work and unfaithfulness. Wives complained about three related
issues: male drinking, staying out late and domestic violence.
Conjugal decision-making followed three common patterns: decisions are taken unilaterally by the
husband, the husband consults the wife and the couple discusses the issue and decides together. In rare
cases, mainly involving the adoption and sale of food crops such as beans and the use of family planning,
wives make decisions on their own or in consultation with husbands (Table 4.17). In 25-30% of households,
decisions regarding crop sales and varietal adoption were made jointly by husbands and wives. However, in
a significant number of households, men unilaterally made decisions involving cash crop sales and use of
large amounts of money (Table 4.18). Women were more likely to make decisions about the use of small
amounts of money from both food and cash crops. In the majority of households, family planning and
school-related decisions were made jointly by husbands and wives. A high proportion of couples disagreed
about who made financial decisions and on the decision to adopt new sweet pepper and bean varieties. There
was moderate disagreement on sale of cash crops such as sweet pepper (29%) and tomato (25%) but high
disagreement on bean sales (41%) - perhaps because some women played down their role in making
decisions about this food crop. Most couples agreed on how they made family planning and school-related
decisions.

MW
MW
MW
MW
MW
Am
ount o
f bean
s to sell
23
23
11
517
11
19
28
25
28
41
Am
ount o
f sweet p
epper to
sell36
24
00
36
34
23
24
36
29
Am
ount o
f tom
atoes to
sell 3
329
00
36
34
03
28
31
25
Adoptio
n o
f new
bean
varieties
28
15
611
14
11
12
23
35
35
49
Adoptio
n o
f new
sweet p
epper v
arieties37
32
00
32
29
02
27
35
43
Adoptio
n o
f new
tom
ato v
ariety 4
131
02
24
31
03
31
29
34
Fam
ily p
lannin
g 7
10
03
30
25
89
82
21
Sen
din
g ch
ildren
to sch
ool
13
16
00
86
02
79
76
25
Tab
le 4.1
7: D
ecision-m
akin
g p
atterns o
n k
ey issu
es as perceiv
ed b
y h
usb
ands an
d w
ives an
d ex
tent o
f disag
reemen
t, Soni (p
er cent)
Wo
man
alon
e
Man
co
ns
ults
wo
man
Wo
man
con
sults
man
Bo
th d
iscuss an
d
decid
e togeth
er
%
disag
reemen
tM
an alo
ne
Wo
man
alon
e
Man
co
ns
ul t s
wo
man
Wo
man
con
sults
man
Bo
th d
iscuss an
d
decid
e togeth
er%
disag
reemen
t
Man
alone
Tab
le 4.1
8: D
ecision-m
akin
g p
atterns o
n u
se of cro
p in
com
e as perceiv
ed b
y h
usb
ands an
d w
ives an
d ex
tent o
f disag
reemen
t, Soni (p
er cent)
MW
MW
MW
MW
MW
Sm
all earnin
gs fro
m b
eans
15
18
29
19
86
16
29
26
22
49
Larg
e earnin
gs fro
m b
eans
24
24
13
810
66
18
29
30
51
Sm
all earnin
gs fro
m sw
eet pep
per
23
27
20
19
21
23
22
30
24
45
Larg
e earnin
gs fro
m sw
eet pep
per
42
40
02
024
20
27
27
43
Sm
all earnin
gs fro
m to
mato
es26
36
914
26
19
23
30
21
47
Larg
e earnin
gs fro
m to
mato
es40
48
03
26
16
02
29
24
47
43

44
5. ACROSS-SITE COMPARISON AND RECOMMENDATIONS
The picture that emerges from the three sites is one of varying levels of poverty across and within sites,
when poverty is measured by factors such as income, ownership of assets, access to resources (credit, land,
etc.) and vulnerability. Of the three sites, farmers in Soni (Tanzania) were relatively better off, enjoying the
highest annual agricultural income ($149). Poverty was most acute in Linthipe (Malawi), while Rubaya
(Uganda) represents a situation of moderate poverty. The following section analyzes poverty within and
across the three study communities in the context of four dimensions: agricultural production, livelihood
activities, ownership of assets and vulnerability.
Agricultural production and livelihood activities
In all three sites, agriculture was the predominant economic activity. Farmers in Soni had the most diverse
portfolio of crops, including at least 7 crops grown exclusively for sale. By contrast, in Rubaya and Linthipe,
farmers grew some crops mainly for subsistence, many for both consumption and sale, and only relied on
one or two crops exclusively for sale. In these two sites, however, there was evidence of diversification of
cash crops: soybean, potatoes and paprika in Linthipe and coffee, wheat and pyrethrum in Rubaya.
Additionally, in Linthipe, there was evidence of food crop diversification, away from the traditional
dependence on maize to increased production of cassava and sweet potato. As this and other studies (David,
1999) show, the absence of traditional cash crops contributes to food insecurity, with farmers falling into a
cycle of selling large parts of their food crop harvests when prices are low and buying those same foods
when prices are high. Significantly, although farmers in Soni bought maize and beans when they
experienced food shortages, unlike farmers in the other two sites, they did not attribute shortages to food
crop sales.
Crop productivity was generally low due to soil infertility (Linthipe and Rubaya especially), diseases and
pests, low input use (Linthipe and Rubaya) and adverse climatic conditions. Although the study did not
directly investigate the extent to which new agricultural technologies contributed to shaping the asset base
of rural households, the level of technology adoption gives some indication of the contribution of
agricultural research to poverty alleviation. The study investigated the uptake of crop varieties and land
management technologies. On the whole, the adoption of introduced crop varieties in the study sites was
moderate to high, but yield estimates for some crops such as potatoes and maize suggest that farmers had not
benefited fully from the yield advantages of introduced varieties because of their failure or inability to carry
out good agronomic practices (e.g. fertilizer use, fungicide use on potatoes, good seed selection, planting
“clean” seed). In addition, in areas where NGOs were involved in seed dissemination, the low adoption of
some bean varieties (climbing beans in Rubaya, beans in Linthipe) was unexpected. One possible
explanation may be related to the practice of one-time seed dissemination by NGOs and farmers’ difficulties
in retaining seed of new varieties (David and Sperling, 1999), especially in communities where informal
social networks are weak. Overall, study results across sites did not show consistently higher adoption of
new crop varieties in project villages, although this was the case with some varieties.
Uptake of land management technologies provides insight into the types of support farmers and communi-
ties need to facilitate technology adoption. As the Linthipe data suggests, CU’s input in terms of training and
follow-up was largely responsible for the high adoption of land management technologies. The significant
increase in the digging of trenches in Rubaya in the early days of the BAPPA project highlights two basic
ingredients needed for effective NRM and community development generally: organization and means.
Prior to 2001, few households in Rubaya had dug trenches to control erosion and reclaim gullies, despite
farmers’ awareness of the technology. The BAPPA project organized farmers into groups to dig trenches
across plots belonging to several households and provided digging tools. This intervention subsequently led
village leaders to establish by-laws requiring all households to dig trenches.

45
The study highlights several important issues pertaining to the role of women in agriculture. Although the
study does not quantify male and female labour, qualitative information on daily activity schedules and the
gender division of labour confirms that women provide a disproportionate amount of labour in farming.
Moreover, the high numbers of female headed households, both de facto and de jure, in all sites, is further
evidence of the feminisation of agriculture in the study communities. However, the factors contributing to
this phenomenon vary between communities: in Rubaya many women head households due to male
migration, while the reason for the high number of unmarried women in Dedza is unclear, but may be due to
high male mortality caused by HIV/AIDS. As the study shows, in all study communities, female-headed
households formed a disproportionate number of the poorest group.
Despite women’s predominant role in agriculture, they remain disadvantaged in terms of decision-making
and control over agricultural income. The study did not investigate married women’s access to productive
resources such as land and labour but shows that female-headed households have least access to productive
resources. In all sites, farming is usually done on household plots, and while analysis of conjugal decision
making data was problematic, the findings across sites suggest that married women rarely make agricultural
or personal decisions on their own. On the whole, however, women do tend to have greater control over
smaller amounts of income. Cultivation on personal plots, which allows married women more economic
freedom, was only found in Soni, the most market oriented location. Male dominant decision-making
patterns were responsible for marital conflict in all study communities. The implications of these findings
on intra-household resource allocation, which need more detailed investigation using qualitative research
methods, are disturbing and need to be taken with other evidence that shows an association between higher
female income and input in decision-making and improved household nutrition and well-being (Quisambing
et al., 1995).
A major factor preventing farmers in the study communities from benefiting fully from improved
productivity was the combination of low prices and limited market outlets. This problem is associated with
multiple factors including lack of crop diversification, poor quality of produce, farmers’ lack of pricing
information and low bargaining power, the low volumes sold by individual farmers and the high volume of
trade with middlemen. Farmer marketing groups were non-existent in all communities.
In all sites, the combination of low agricultural productivity and limited market opportunities has increased
household dependence on non-farm activities. The high proportion of Linthipe farmers that were involved
in non-farm activities, for example, is a reflection of poor agricultural performance and chronic food
insecurity in Malawi due to drought, low soil fertility and the inability of most households to achieve
self-sufficiency in maize. Farmers’ attempts to minimize risk by opting for a dualistic strategy of
intensifying agricultural production while seeking off-farm employment as a short term survival strategy is
clearly evident in their investment priorities. Farmers in Linthipe and Soni attached a high premium to
purchasing chemical fertilizer, while farmers in all three sites showed strong interest in business.
While non-farm activities offer a potential pathway out of poverty for rural African households (Ellis et al,
2002: 17), the types of opportunities available to farmers are limited, and some may even contribute to low
agricultural performance. Four areas of off-farm income generating activities were common to the three
sites: casual labour, petty trade, brewing and salaried employment. A recent study in Malawi (McDonagh,
2002) shows that, while casual labour is an effective survival strategy, it forces many farmers, the poor in
particular, to neglect their own fields at key periods during the farming season. The study concludes that the
overall effect of casual labour on farm-based livelihoods is negative. Due to high start-up costs and limited
credit opportunities, relatively few farmers in the three communities were involved in remunerative
self-employment activities, such as maize milling, carpentry and poultry that could serve as pathways out of
poverty. Indeed, farmers’ investment aspirations highlight the need to expose farmers to new business ideas.

46
Because of women’s higher labour contribution to farming and household reproduction, across sites, men
were more likely than women to engage in income generating activities and had a more diverse portfolio
ofactivities, including more skilled activities such as salaried employment. Male migration for casual
employment was only found in Rubaya, an area of low male involvement in agriculture. Aside from petty
trade, women tended to engage in relatively low paying activities such as casual labour, brewing and
handicraft production, which complement their farming and domestic activities. Efforts to diversify
women’s income generating activities must consider their heavy workloads, limited mobility and tendency
by some husbands to appropriate women’s earnings. Working through women’s groups is often an effective
strategy for avoiding the latter problem, but problems in group-based income generating efforts should not
be underestimated.
Asset ownership
The key assets of rural African households are land, livestock, labour, educational attainment, implements
and tools, and networks that increase trust, ability to work together, access to opportunities and informal
safety nets. Access to enough productive land for crop cultivation and livestock rearing is crucial for the
ability of rural households to generate a viable living. It is well established that in most parts of rural Africa,
poor households have smaller land holdings and farm the least productive land. In Rubaya, there was
evidence that the poorest households had least access to land in the wetlands, the most suitable land
production for vegetable production. In Linthipe, better off farmers cultivated significantly larger land
holdings in both the uplands and dambos.
Ownership of agricultural tools and use of agricultural inputs are also associated with improved well-being,
as they enhance agricultural productivity and the latter in turn permits further investment in inputs. Farmers’
inability to dig trenches in Rubaya due to lack of appropriate tools illustrates the association between
ownership of agricultural tools and poverty. The relatively high use of inputs by farmers in Soni, together
with access to irrigation, is one factor responsible for successful cash crop production that in turn permits
reinvestment in inputs. The high importance farmers attach to investing in inputs was noted earlier.
In all sites, wealth was strongly correlated with livestock ownership. However, because an important aspect
of livestock lies in substitution of lower value livestock (e.g. chickens, small ruminants) for higher value
livestock (cattle, pigs, donkeys), the type and number of livestock owned is key to achieving rising assets
over time. While most surveyed households owned chickens, only the wealthiest households owned cattle,
pigs or donkeys. In Soni, a third or more of livestock owners kept cattle and small ruminants, whereas in
Rubaya and Linthipe few households owned cattle. In those two sites, aside from chickens, most households
owned, on average, 2-3 goats or sheep, not enough to make a significant contribution to poverty alleviation.
Not surprisingly, farmers in Rubaya and Soni attached high importance to livestock as an investment
priority. Livestock received lower priority in Linthipe because of the high risk associated with theft.
Another point of importance was the consistently higher ownership of livestock in project villages than in
non-project villages, even by this early stage in project activities, which suggests a need for development
assistance in kind.
Survey data confirms that the amount of available household labour contributes to household well-being.
Households in Soni had the highest number of productive workers, and notably in Rubaya and Soni, but not
Linthipe, wealthier households had a significantly higher number of productive workers. Rubaya had the
lowest number of productive workers due to the high number of men and women engaged part time in
agriculture. The lack of correlation between wealth and household labour in Linthipe may be related to
another recent study that showed, with the exception of livestock holding, few significant differences in the
asset profiles (defined as household size, educational attainment, ownership of tools, land and livestock) of
different income groups in Malawi (Ellis et al, 2002).

47
At community level, Soni had the highest proportion of formally educated farmers, both male and female,
while farmers in Linthipe were the least educated. Tanzania during President Nyerere’s time was known for
its emphasis on education and self-reliance and, unlike Uganda, has enjoyed stable government. At
household level, however, a correlation between wealth and educational level was only found among men in
Linthipe. Educational attainment contributes to poverty alleviation through various direct and indirect
mechanisms, an area not explored in this study.
Significant differences existed between study communities in terms of membership in indigenous groups,
with Rubaya having the highest number of groups and proportion of households belonging to groups. Soni
had the next highest number of local groups and number of households belonging to groups, while there
were few indigenous groups in Linthipe. Across sites, group membership per household was not
significantly different between project and non-project villages, even in Linthipe and Soni, where many
groups were initiated by NGOs. Neither was involvement in collective action or community related
activities higher in project compared to non-project villages. Local groups played various functions
including providing informal safety nets for burial assistance, transportation to hospital, facilitating credit,
savings and the exchange of new technologies and information, providing services such as labour exchange,
and generally strengthening social cohesion among kin-based groups. Despite the importance of local social
networks for farmers’ coping and survival strategies, there was little evidence that they play a central role in
poverty alleviation.
Wealthier households in Rubaya and Soni had more members involved in groups, presumably because of
their larger size and better access to resources (e.g. time, money and skills). Surprisingly, with the exception
of Soni, there was little difference in the proportion of men and women belonging to groups. In Rubaya,
women were more likely than men to join groups which improve their access to resources. In Linthipe,
where social networks were weak, but also in Soni, government and NGOs created groups to carry out
development activities. The basis on which these groups were formed, and the consequent implications for
their sustainability after the end of development projects, is an issue of concern and require further
investigation.
Vulnerability
Rural households in the three study sites and throughout Africa are subject to trends, shocks and seasonality
in health, prices, agricultural production, employment opportunities and resource availability, factors that
are outside their control. Ill health, particularly malaria and HIV/AIDS, was an important shock not
investigated by the study. The study did not find any evidence of child-headed households, a recent
phenomenon related to the AIDS epidemic. As noted by a recent study in Malawi and Tanzania, rural
households are unable to plan ahead and therefore cope with illnesses with short-term survival strategies,
resulting in losses in net welfare, cash and capacity that weaken the capacity of households to generate work
(Koestle, 2002). Across sites, drought, crop failure, food shortages, insufficient capital, low prices and lack
of markets were common shocks. In a number of instances, farmers showed great innovation, often without
external assistance, in tackling major shocks. For example, in Rubaya, farmers responded to the devastating
effects of bean root rots by spontaneously adopting more tolerant climbing beans obtained from
neighbouring districts or countries. In line with government policy to combat the effects of drought, farmers
in Linthipe had diversified their food crops and were growing more drought tolerant crops such as cassava.
Farmers’ response to drought in other sites was not clear. Crop diversification was a general response to
vulnerability observed in all three sites but was most successful in Soni due to several factors including
favourable climatic conditions and strong institutional support for horticultural production dating back to
the late1960s (pers comm., R. Kirkby).
Coping strategies were similar across sites, with most households reducing the number of meals eaten
during the “hungry season”, borrowing money from friends and relatives, working for food or money and

48
borrowing or buying food. To cover educational and health expenses, farmers were often forced to sell
crops, land or livestock, contributing to the cycle of poverty. Local groups played an important safety net
role by providing credit only in Rubaya, but farmers everywhere showed a stronger tendency to seek
assistance from friends.
Vulnerability may be exacerbated at community level by a high level of social division that prevents
communities from engaging in collective action to address common problems. The major social divisions
identified in the study communities were asset related (access to land, including wetlands, wealth,
ownership of livestock, educational attainment). Interestingly, a high proportion of farmers in Linthipe and
Rubaya, the poorest communities, perceived an increase in the level of theft, suggesting an association
between poverty, theft and social divisions.
Although Rubaya was the only site where survey respondents highlighted poor relations between men and
women as a social problem, the study consistently documents women’s disadvantaged position and greater
poverty in the three communities. Generally, women were less educated, saved and borrowed smaller amounts
of money compared with men, had less decision making powers than men and owned fewer productive
assets (livestock, land).
Women had heavier workloads than men, largely due to their domestic responsibilities - but in the case of
Rubaya, also as a result of male migration and men’s lower input in agriculture generally. Surprisingly, the
study did not reveal strong educational discrimination against girls, possibly because most children in
surveyed households were in primary school where girls face less discrimination. Still, this finding
represents an important advance in the education of girls. The challenge for most African countries is how to
keep girls in school at the higher levels of primary school and in secondary school and to improve their
performance.
Across sites, women complained of similar marital problems: conflicts over money and decision-making,
failure of men to work and provide for their families, drinking and domestic violence. Marital problems
shared by men in the three communities include conflict over money and decision-making, and wives’
disobedience.
Even though this study presents a rather dismal snapshot view of the three communities, farmers in all sites,
but especially in Soni where living standards were better, were relatively optimistic about the future, with
half or more wanting their children to become small-scale farmers. As other studies have proposed, the key
to developing pathways out of poverty in rural Africa “is a cumulative process that requires the ability to
build assets and diversity across farm and non-farm activities” (Ellis et al., 2002). Farmers in the BAPPA
project sites, working together with development partners, have started this process. The BAPPA project, an
unusually close partnership between an agricultural research institution and NGOs, can build on progress
made and make unique contributions to understanding poverty alleviation. Based on the study’s findings,
some specific recommendations for project interventions that complement on-going activities include:
• Developing creative, workable mechanisms for credit and identifying partners who can manage credit
programs that cater for the needs of both men and women of different wealth categories;
• Assisting men and women farmers to build assets, particularly livestock holdings;
• Training farmers in the identification of market opportunities and working with them to carry out diverse
non-farm economic activities;
• Organizing farmers into producer associations for both food (for input supply) and cash crops;
• Improving farmer access to agricultural inputs through credit and more creative programs;
• Strengthening farmers’ capacity to form and manage groups based on a sound understanding of social
ties and existing groups, and developing conflict resolution skills at group and local leadership level;
• Identifying partners that can improve farmers’ literacy levels;
• Developing sustainable technology dissemination mechanisms;
• Redressing gender inequalities in work load, decision making and income levels through awareness
raising among adults and children, introducing labour saving technologies for women and diversifying
women’s non-farm economic activities.
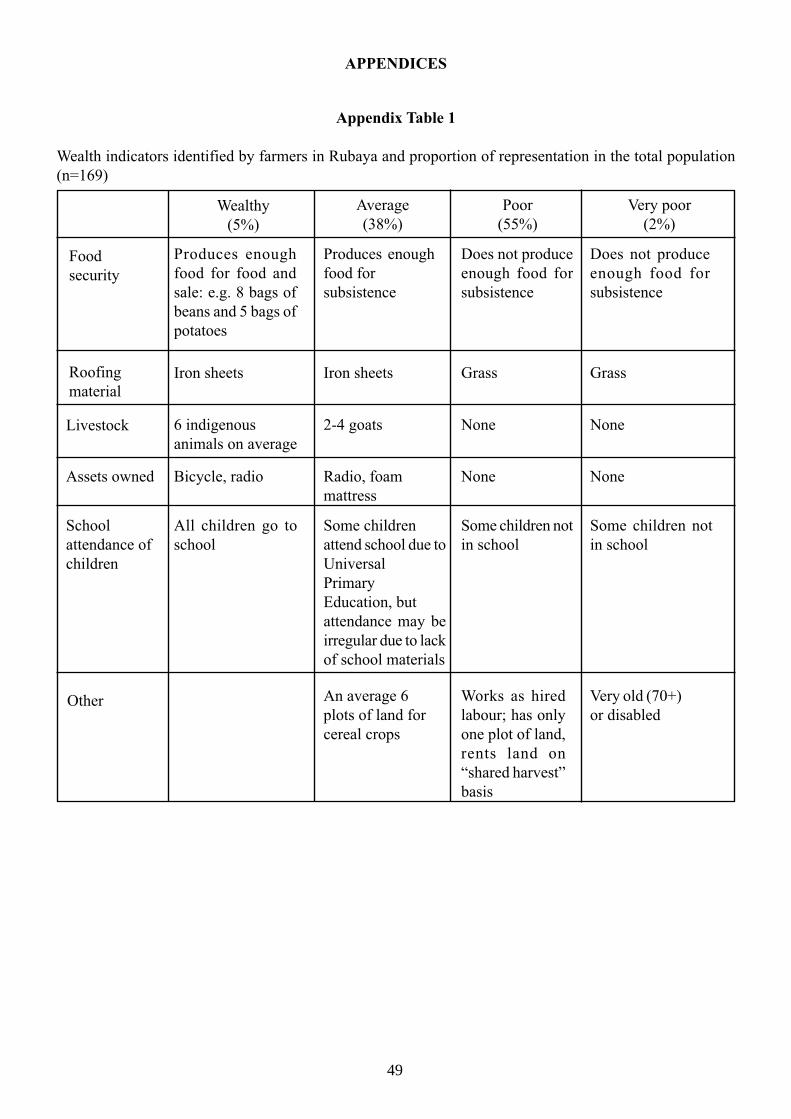
APPENDICES
Appendix Table 1
Wealth indicators identified by farmers in Rubaya and proportion of representation in the total population
(n=169)
Wealthy
(5%)
Average
(38%)
Poor
(55%)
Very poor
(2%)
Food
security
Produces enough
food for food and
sale: e.g. 8 bags of
beans and 5 bags of
potatoes
Produces enough
food for
subsistence
Does not produce
enough food for
subsistence
Does not produce
enough food for
subsistence
Roofing
material
Iron sheets Iron sheets Grass Grass
Livestock 6 indigenous
animals on average
2-4 goats None None
Assets owned Bicycle, radio Radio, foam
mattress
None None
School
attendance of
children
All children go to
school
Some children
attend school due to
Universal
Primary
Education, but
attendance may be
irregular due to lack
of school materials
Some children not
in school
Some children not
in school
Other An average 6
plots of land for
cereal crops
Works as hired
labour; has only
one plot of land,
rents land on
“shared harvest”
basis
Very old (70+)
or disabled
49

Month Task Crops
January** Planting Sorghum
Harvesting Millet, beans, maize, peas
February** Planting Sorghum
Harvesting Millet, maize, peas
March** Weeding Sorghum
Planting S. potatoes, beans, peas
Harvesting Peas
April** Planting Peas, potatoes, beans, bananas
May* Planting Potatoes, beans, s.potatoes
June* Land preparation Millet
Planting Potatoes
July* Planting Cabbage, potatoes in reclaimed valleys
Weeding Potatoes and cabbage
Harvesting Sorghum, peas, beans, s.potatoes
August** Weeding Potatoes and cabbage
Harvesting Sorghum, peas, beans, potatoes
September** Planting S.potatoes, millet, maize
Harvesting Potatoes, bananas
October** Land preparation Peas, millet, maize
Planting Peas, millet, s.potatoes, beans
November** Land preparation S.potatoes, bananas
Planting S.potatoes, beans, maize, sorghum
December Planting Sorghum
Harvesting Beans, s.potatoes
Weeding Millet
Source: AHI, 1998
** Peak labour periods, * Non-peak labour periods
Cropping calendar, Rubaya
50

Gender division of labour, Rubaya
Operation Enterprise Gender
Bush clearing All Men
Land opening All Both
Planting Bananas Men
S.potatoes Women
Beans Women
Potatoes Women
Millet Women
Peas Both
Sorghum Both
Trees Men
Tobacco Men
Weeding Millet Women
Sweet potatoes Women
Others Both
Harvesting Tobacco Men
Sweet Potatoes Women
Millet Women
Others Both
Threshing Sorghum, beans, peas Men
Winnowing Sorghum, beans, peas Women
Grinding Sorghum, beans, peas Women
Fetching Fuel wood, water Children, Women
Processing Banana beer Men
Grazing Livestock Men, Children
Selling Tobacco Men
Beer bananas Men
Sweet potatoes Women
Millet Women
Sorghum Both
Irish potatoes Both
Beans Both
Land Men
Source: AHI, 1998
51

Appendix Table 2
Wealth categories identified by farmers in Linthipe and their proportional representation in the total
population (n=275)
Assets Wealthy (16%) Average (7%) Poor (43%) Very poor (33%)
Food security Have enough
maize throughout
the year
Maize harvest
lasts from June to
Dec-January
Maize harvest lasts
1-6 months;
sometimes all is
eaten from the
field
Maize harvest
lasts for 1 month;
sometimes all is
eaten from the
field
Livestock Own many
including cattle in
the past
Chickens, ducks,
rarely goats
None None
Hires labour Yes No No No
Amount of
fertilizer used
4-6 bags 1 bag None None
Monthly cash
earnings
K800 K100 K50 Negligible
Other assets
And activities
Owns a bicycle,
radio, iron sheet
house, can afford
soap for washing
and bathing
May own a bicycle Relies as ganyu
labour
Depends largely
on ganyu labour
52

Daily activity schedule for men and women in Linthipe
Summer
Winter
Time Activity Time Activity
Women Men
5-6 a.m Sweep compound, draw
water
4 a.m-12 p.m Work in the field (clearing,
ridging, weeding)
6-11 a.m. Work in the fields with the
husband
12 p.m Eat
11 a.m-12 p.m. Look for relish for lunch,
prepare food and eat
12-1 p.m Rest
12-1 p.m. Rest 1-5 p.m Work in the fields
2-4 p.m. Work in the fields 6 p.m Bathe
4-5 p.m. Look for relish for supper
5-6 p.m. Draw water and boil for bathing
(for self and husband)
7 p.m Eat
6-7 p.m. Prepare food and eat 7-8 p.m. Chat
7-8 p.m. Chat with family members ,
go to bed
8 p.m. Go to bed
Time Activity Time Activity
Women Men
6-7 p.m. Sweep compound, draw water
and clean plates.
5-11 a.m. Work in the dimba
7-9 a.m. Work in the dimba 11-12 p.m. Do various activities at home i.e.
cutting poles for reinforcing the
roof, constructing kholas
9-11 a.m. Gather firewood 12-1 p.m. Eat
11-12 p.m. Look for relish 1-3 p.m. Rest or chat with
friends
12-1 p.m. Cook and eat
3-5 p.m.May do any work
at home1-4 p.m. Rest and chat with friends
4-5 p.m. Water crops in the dimba.
5-6 p.m. Boil water for husband and herself,
bathe5-6 p.m. Bathe and rest at home
6-7 p.m. Prepare supper 6-7 p.m. Wait for supper
7-8 p.m. Eat chat, chat, go to bed. 7-8 p.m. Eat, chat, go to bed
53

Note: A fifth group, the very poor, was omitted from this table as it consisted of only one household (0.2%).
Appendix Table 3
Wealth categories identified by farmers in Soni and their proportional representation in the total population
(N=576)
Wealthy
(groups A and B)
(0.5%)
Above average
(groups C and D)
(27%)
Average
(groups E and F)
(64%)
Poor
(group G)
(8%)
Assets Owns a car or
motor bike
Owns a bicycle None None
Land size 5+ acres of coffee 5-10 acres 1-3 acres acre34
Livestock 1+ crossbred cow 5-10 indigenous
cows, goats,
sheep, not
healthy
5-10 goats/sheep,
free range
chickens None
Housing Modern house of
bricks or stone
with kitchen
Modern house or
mud and wattle
house with iron
sheets with
kitchen
Iron sheets or tin,
grass thatched,
mud and wattle,
outside kitchen,
covered or
1uncovered
latrine
Small mud and
wattle, grass
thatched, no
latrine
Education of
children
Best primary/
secondary schools
Government
primary and
secondary schools
G o v e r n m e n t
schools,
Only up to
primary
(group F)
Do not go to
school
54

Daily activity schedules in Soni Ward
Women
Time Activity
6-7 am Wake up, plaster the house, fetch water
7:00- 1.00 Prepare breakfast, wash utensils, collect fodder, fieldwork
1.00 – 2.00 Prepare food, lunch
2.00 – 6.00 Wash utensils, clothes, collect fuel wood, fetch water, bathe children
6.00 - 8.00 Prepare food
8.00 – 9.00 Dinner
9.00 onwards Sleep
Men
Time Activity
6.00 onwards Wake up
Morning prayer
7.15 - 8.00 Collect fodder
Irrigate crops
8.00 – 9.00 Breakfast
9.00 – 2.00 Work in the fields
2.00 - 3.00 Lunch
3.00 – 5.00 Work in the fields
5.00 – 7.00 Rest
7.00 – 9.00 Bath
Dinner
9.00 onwards Sleep
55

Girls 19 10 1
Boys 15 14 2
Male headed, one wife 41 60 61
Male headed, multiple wives 5 7 17
De jure female headed 22 22 19
De facto female headed 29 7 0
Other 2 4 2
Note: other includes single men with no children, single women, with no children
Appendix Table 4
Household type (per cent)
Rubaya
(N=92)
Linthipe
(N=121)
Soni
(N=83)
Appendix Table 5
Mean household size, number of adults and children
Rubaya
(N=92)
Linthipe
(N=121)
Soni
(N=83)
Mean household size 5.0 4.4 6.0
Mean number of adults 2.6 2.2 3.2
Mean number of children 2.9 2.6 3.2
Appendix Table 6
Educational levels of respondents (per cent)
Soni
Men
(n=43)
Women
(n=90)
Men
(n=86)
Women
(n=116)
Men
(n=67)
Women
(n=81)
Rubaya Linthipe
No formal education 23 53 31 60 8 33
Primary 63 42 65 39 91 67
Secondary and above 14 4 3 1 2 0
Note: Information on absent male heads was sometimes missing
Appendix Table 7
Non-attendance of school by school-aged children (per cent of households)
Rubaya
(N=92)
Linthipe
(N=121)
Soni
(N=83)
56

Appendix Table 8
Mean number of household members involved in agriculture
Rubaya (N=92) Linthipe (N=121) Soni (N=83)
Full time female 1.1 1.2 1.4
Part time female 1.5 1.0 1.1
Full time male 1.1 1.2 1.4
Part time male 1.6 1.1 1.2
Full time children 1.0 1.3 2.5
Part time children 1.8 1.8 1.8
Total labour expressed as
adult equivalent workers
Appendix Table 9
Wealth classification of surveyed households (per cent)
Rubaya (N=92) Linthipe (N=121) Soni (N=83)
Wealthy 5 19 0
Above average 0 0 26
Average 37 17 64
Poor 57 43 10
Very poor 1 21 0
Appendix Table 10
Sources of non-farm income by gender (per cent)
Casual labourer 52 30 37 25 14 25
Handicraft 21 0 3 3 0 0
Business/trade 21 13 27 33 38 28
Brewing 6 9 14 1 0 3
Salaried employment 0 13 0 6 0 14
Baking 0 0 0 0 29 0
Remittances 0 0 17 3 10 3
Sale of timber/poles 0 9 0 0 0 12
Migrant labor 0 9 0 0 0 0
Other 0 13 1 30 10 17
Rubaya Linthipe Soni
Women
(n=33)
Men
(n=23)
Women
(n=70)
Men
(n=70)
Women
(n=21)
Men
(n=34)
57
1.8 2.3 3.0

Appendix Table 11
Borrowing and saving behavior of men and women (per cent)
Rubaya Linthipe Soni
Male
(n=44)
F e m a l e
(n=90)
Male
(n=67)
Male
(n=85)
F e m a l e
(n=115)
Female
(n=81)
Saves money 66 68 88 78 75 78
Ever borrowed money 89 91 31 26 68 33
Borrowed money in 2000 59 62 22 16 55 30
Usual source of borrowed money
Relative 87 82 42 73 73 74
Friend 69 78 42 20 61 59
Informal savings/credit group 77 63 0 0 0 7
Money lender 0 1 4 7 0 0
NGO/church 0 4 12 3 2 0
Bank/credit institution 3 1 0 0 0 0
Rubaya Linthipe Soni
Male
(n=44)
F e m a l e
(n=90)
Male
(n=67)
Male
(n=83)
F e m a l e
(n=113)
Female
(n=81)
Appendix Table 12
Investment scores by gender (per cent)
Purchase land 2.25 1.86 0.65 0.64 1.22 1.02
Improve house 0.70 0.90 0.52 0.29 2.01 1.43
Invest in business 0.98 0.60 2.40 2.33 1.04 0.88
Buy livestock 1.84 1.12 1.23 0.95 1.30 1.64
Buy better food 0.27 0.56 0.28 0.39 0.42 0.56
Buy more food 0.39 0.84 0.86 1.12 0.73 0.96
Buy agricultural inputs 0.80 0.57 2.36 1.99 1.49 0.56
Buy clothes 0.64 1.12 0.87 1.20 0.40 1.14
Pay school fees 0.61 0.59 0.28 0.24 0.91 0.79
Save 0.34 0.38 0.53 0.72 0.66 0.86
Other 0.32 0.38 0.36 0.13 0.19 0.02
Appendix Table 13
Livestock holdings
Local cattle 12 1.1 0 0 34 1.8
Dairy cattle 9 1.8 0 0 45 1.9
Goats 37 2.4 46 2.9 46 2.7
Sheep 49 1.8 0 N/A 32 2.0
Chickens 51 2.5 79 5.8 91 5.2
Rabbits 18 3.6 5 2.4 3 2.5
Pigs 0 N/A 6 2.2 0 N/A
Donkeys 0 N/A 1 2 0 N/A
Ducks 0 N/A 15 1.9 10 2.3
Rubaya (n=57) Linthipe (n=96) Soni (n=79)
Percentage
owningMean Percentage
owningMean Percentage
owningMean
58

Appendix Table 14
Input use (per cent)
Manure 59 37 98
Fungicide 16 Na 70
Insecticide 20 Na 66
Chemical fertilizer 4 56 52
Rubaya
(N=92)
Linthipe
(N=121)Soni
(N=83)
Appendix Table 15
Tree planting niches, 1999-2001 (per cent)
Rubaya
(n=68)
Linthipe
(n=42)
Crop land 41 12
Farm boundaries 12 36
Homestead 40 42
Bunds or terraces 19 N/A
Woodlots 56 19
Abandoned land 28 N/A
Dimbas N/A 2
Village forest 0 12
Appendix Table 16
Number of meals eaten during periods of food scarcity, by wealth
Linthipe**
(N=121)
Soni***
(N=83)
Rubaya*
(N=92)
Overall average 1.5 1.4 2.3
Wealthy 1.8 2.0 2.5
Average 1.7 1.4 2.2
Poor 1.3 1.3 2.4
Very poor N/A 1.4 N/A
Significance for difference between wealth groups: *P ≤ .04; **P ≤ 0.025; ***P ≤ 0.1
A lot 50 34 79 70 43 35
Some 23 40 11 13 48 53
Not very much 25 19 9 8 9 11
Not at all 2 7 1 3 0 1
Appendix Table 17
Farmer perception of their ability to change their local situation (per cent)
Rubaya Linthipe Soni
Men
(n=44)
Women
(n=89)
Men
(n=85)
Women
(n=115)
Men
(n=67)
Women
(n=81)
59

Appendix Table 18
Farmers’ willingness for their children to become small-scale farmers (per cent)
Rubaya Linthipe Soni
Men
(n=40)
Women
(n=76)
Men
(67)
Women
(n=88)
Men
(n=66)
Women
(n=81)
Girls 45 52 53 54 61 65
Boys 52 50 51 58 60 64
Note: This question was asked irrespective of whether the respondent had children of any age in Rubaya
and Soni. In Linthipe, answers are only for people who had children.
Appendix Table 19
Perception of the level of social harmony in the community (per cent)
Rubaya Linthipe Soni
M e n
(n=44)
Women
(n=81)Men
(n=84)
Women
(n=115)
Men
(n=67)
Women
(n=78)
Very peaceful 39 37 55 48 8 10
Mostly peaceful 34 37 27 32 88 89
Little peace 20 20 14 18 5 1
No peace 7 6 2 2 0 0
Appendix Table 20
Factors dividing the community, by gender (per cent)
Rubaya Linthipe Soni
Men
(n=44)
Women
(n=89)Men
(n=85)
Women
(n=115)
Men
(n=67)
Women
(n=81)
Education 34 27 11 14 55 62
Wealth 30 24 8 13 64 63
Land size 23 27 44 43 43 64
Religion 27 20 2 1 27 21
Gender 32 33 1 3 10 11
Working with NGOs 34 21 1 4 28 20
Tribe 9 15 0 0 3 3
Clans 11 13 N/A N/A 3 5
Access to swamps/irrigation 41 16 8 10 35 37
Number of livestock owned 45 40 N/A N/A 34 46
Politics 5 7 N/A N/A N/A N/A
Asset ownership N/A N/A 8 18 N/A N/A
Age 0 1 N/A N/A N/A N/A
Appendix Table 21
Willingness of community members to engage in collective action (per cent)
Rubaya Linthipe Soni
Men
(n=44)
Women
(n=87)
Men
(n=85)
Women
(n=115)
Men
(n=67)
Women
(n=81)
Very high 11 5 48 48 6 5
High 43 47 34 27 49 42
Average 25 39 9 13 43 47
Low 20 7 8 12 2 6
60

61
REFERENCES
AHI, 1998. A participatory rural appraisal in Kwalei Catchment, Lushoto District, Tanzania. Selian
Agricultural Research Institute, Arusha, Tanzania.
AHI, 1998. Diagnosis and characterization in the African Highland Initiative (AHI) benchmark in
South-Western Uganda.
Africare, 2000. Nutrition survey report. Uganda food security initiative project, Kabale District. Draft
report.
Anaele, S. 1997. Baseline survey report of Uganda Food Security Initiative Project. Africare, Kampala,
Uganda.
Carney, D. 1998. Sustainable rural livelihoods: what contribution can we make? London: Department for
International Development (DFID).
David, S. 1999. Beans in the farming system and domestic economy of Uganda: a tale of two parishes.
Network on Bean Research in Africa, Occasional Publications Series, No. 28, CIAT,
Kampala, Uganda.
David, S. and L. Sperling. 1999. Improving technology delivery mechanisms: Lessons from bean seed
systems research in Eastern and Central Africa. Agriculture and Human Values.
16:381- 388.
Ellis, F., M. Kutengule and A. Nyasulu. 2002. Livelihoods and rural poverty reduction in Malawi. LADDER
Working paper no. 17. DFID.
Ferguson, A., P. Kambewa, R. Mkandawire. 1991. Bean production and use use pratices: results of the
1990-91 socio-economic research in three regions of Malawi. Bean/cowpea CRSP,
Michigan State University, East Lansing.
IFPRI, 2000. The state of Malawi’s poor: who are they? PMS Policy Brief, no. 3. IFPRI, Washington
D.C.
Malawi, National Economic Council, 2000. Profile of poverty in Malawi, 1998: Poverty analysis of the
Malawi Integrated Household Survey, 1997-98. Lilongwe, NEC, November.
Olson, J. 1996. Initial results concerning the use of fallow in Kabale District, Uganda. Unpublished
report, ICRAF, Nairobi.
Population, Health and Nutrition Information Project (PHNIP), 2002. Country Health Statistics Report-
Malawi. Washington, D.C.
Puhalla, J. 1998. Soil fertility management by women farmers in Kabale District, Uganda. A report for the
Gender and Soil Fertility Management Project, USAID Soil Management CRSP.
Unpublished report, University of Florida.
Putnam. R. 1996. “ The strange disappearance of civic America”. The American Prospect. Winter. 34-48.

62
Quisambing, A., L. Brown, H. Sims Feldstein, L. Haddad and C. Pena. 1995. Women: the key to food
security. Food Policy Statement no. 21, IFPRI, Washington D.C.
Republic of Uganda, Ministry of Planning and Economic Development. 1993. Household integrated survey,
1992-93. Kampala, Uganda.
United Republic of Tanzania. 2002, Population and housing census results. National Bureau of Statistics.
United Republic of Tanzania, 2001. HIV/AIDS/STI surveillance report. Report no. 16. National AIDS
Control Program, Ministry of Health.
United Republic of Tanzania, 2001.Household Budget Surveys, 2000-01. National Bureau of Statistics,
Dar es Salaam.
Woolcock. M. 2000 Friends in high places? Development Research Insights. No. 34. Institute of
Development Studies, Brighton, England.

Recommended