Social returns to education
in a developing country
Alpay Filiztekin∗
Sabancı University
December 1, 2011
Abstract
This paper estimates social returns to education in Turkey. Most
evidence on spillovers from human capital comes mostly from developed
countries, and estimates vary from country to country. The paper finds
that social returns to education are around 3-4%, whereas private re-
turns per year of education amount to 5% in Turkey. Moreover, the
findings indicate that workers with lower skills, or working in sectors
with lower average wages benefit most from externalities. The results
are robust to a series of checks, using a number of individual and re-
gional controls, as well as instrumental variable estimation.
Keywords: human capital externalities, returns to education, wages
∗This paper was written when I was visiting the Department of Economics at the Uni-versity of Sheffield. I greatly appreciate their hospitality.Address: Sabanci University, Faculty of Arts and Social Sciences, Orhanli 34956 Tuzla,Istanbul, Turkey. e-mail: [email protected]
1 Introduction
There is ample evidence that higher levels of human capital are associated with
higher levels of economic growth at the aggregate level. Following seminal
papers by Barro (1991) and Mankiw et al. (1992), there has been a large
number of studies confirming the importance of human capital at international
and at regional levels. While these findings, that human capital significantly
increases growth rate, answer one particular question, a second one, who will
finance investment in human capital, relies on whether the growth is reflecting
simply private returns to human capital or whether there are significant and
positive externalities arising from accumulation of skills.
An extensive theoretical literature claims that there are indeed positive
externalities arising from accumulation of human capital. Two types of ex-
ternalities are assumed to exist, market and non-market. The former can be
either technological in nature (Lucas, 1988), that a high level of average hu-
man capital increases the speed of diffusion of knowledge among workers, or
pecuniary (Acemoglu, 1996), that firms choose their investment level by ob-
serving the average level of human capital when there is costly search and
complementarity between physical and human capital. As non-market exter-
nalities, reductions in crime rates, increases in the level of health and quality
of involvement in political process are the most cited ones. However, to what
extent the predictions of these models are valid is an empirical question.
Recent studies to estimate the degree of social returns have mixed results.
Rauch (1993) is the first study that provides a comprehensive estimation of
human capital externalities. He finds that geographic concentration of hu-
man capital has a significant positive impact on productivity in the US and
human capital externalities are in the order of 3-5%. However, this finding
is challenged by Acemoglu and Angrist (2000) on the grounds that aggregate
education could be endogenous to income and by Ciccone and Peri (2006) that
the results could be simply driven by supply changes along a downward sloping
demand curve which in turn depends on the substitutability between different
levels of human capital. Both papers underline the problems associated with
the identification of the social returns to human capital. Using data from the
US, yet different identification schemes, Acemoglu and Angrist (2000) con-
1
clude that the return to human capital is much less than Rauch’s estimates,
around 1-2%; and Ciccone and Peri (2006) report insignificant human capital
externalities by taking into account changes in the composition of skills. Con-
trary to these studies, using a large set of individual and regional controls and
instruments, Moretti (2004b) finds that there are significant human capital
externalities in the US and moreover, the social return to education is even
higher than the private returns: a one percent increase in the college share
yields more than one percent increase in wages.
The discussion about the significance and size of social returns to education
in the US has led to a number of studies examining the existence and extent
of human capital externalities in some European countries. As these countries
subsidize education relatively more than the US (OECD, 2009), the size of
the return to social capital has important policy implications. The evidence
from the European countries yields consistently significant and positive social
returns, however the estimated size is much lower than the estimates of Moretti
(2004b). For example, Dalmazzo and de Blasio (2007) estimate the social
return to an additional year of aggregate education to be less than half of the
private return in Italy; Kirby and Riley (2008) report a social return around
2 to 3 fifths of private returns in the UK; and Heuermann (2011) finds that a
percentage point increase in the share of highly skilled workers in a region in
Germany increases the wages of highly skilled workers by 1.8%, but the same
increase only adds 0.6% more to the wages of unskilled workers.
Finally, there are two papers on human capital externalities in transition
countries. Liu (2007) examining China reports social returns as high as twice
private returns and Muravyev (2008) finds that a percentage increase in the
share of university graduates increases wages around by one percent in Russia,
an effect similar to Moretti (2004b) in magnitude, although in some specifica-
tions his estimates are statistically insignificant.
Leaving the differences in estimation methodology aside (without ignoring
their importance, of course), studies after Moretti (2004b) which use more
or the less same set of variables and same methodology report a wide range
of estimates. Heuermann (2011) claims that the difference between Germany
and the US could be attributable to different labor market institutions, such as
labor mobility, the degree of substitutability between skill groups and collective
2
wage agreements. To what extent these arguments can explain the differences
between Italy and Germany or between the US and UK is unknown. Similarly,
institutional arguments could be made also for transition economies as their
labor markets are, at best, in transition. Then the question is to what extent
the findings of these limited but important studies could be generalized to
other countries, particularly to developing countries where both income and
human capital levels are significantly low, regional disparities are high and
spending on education is limited. This last point is also important from a
policy perspective as macro studies show that accumulation of human capital
is essential for growth, yet these countries face tight public budget constraints
and innumerable needs. So, then, is there a justification to continue fully
subsidizing education?
This paper contributes to the existing literature by estimating social re-
turns in such a country, namely Turkey, using data from the Household Labor
Force Surveys (HLFS) from 2004 to 2009. Turkey has lower per capita income
and a lower level of schooling than the countries mentioned above (except that
per capita income in China is much lower, yet the average level of education
is much higher), around $8,000 per capita income and 7.4 years of average
education among the working age population in 2010. Regional disparities in
Turkey are the highest among OECD countries, the ratio of the highest per
capita regional output to the lowest was 4.4 in 2004, and the ratio is even
higher when one considers average regional earnings instead of output. There
are also wide differences in average human capital, the share of college grad-
uates in the working age population in NUTS II regions ranges from 4% to
18%. In the last couple of decades there has been many public and private
initiatives to increase the level of schooling. The 1990 population census fig-
ures show that average education level was merely 5.3 years, implying one
additional year increase in schooling for every decade since then. The ques-
tion this paper is looking for an answer to is then whether the extent of social
returns is comparable to those obtained in developed countries.
The methodology employed here is similar to Moretti (2004b), Dalmazzo
and de Blasio (2007), and Liu(2007). First, a standard Mincerian equation
augmented by regional average education is estimated. As mentioned before,
the identification of external returns is problematic. First, individual and
3
regional controls are used to deal with omitted variables bias. Second, in-
strumental variables estimation is performed using previous levels of regional
education and demographic composition. The estimates show that the private
returns to a year of education is around 7% and social returns are in the order
of 4-6%. Despite significant differences in the characteristics of the Turkish
economy from the one observed in developed countries, the estimated returns
are of similar magnitude. From a policy perspective, these results confirm the
findings of aggregate studies and justify subsidizing education in developing
countries.
The rest of the paper is structured as follows. The next section describes
the data set used in the analysis and discusses the empirical model specification
along with the identification of key parameter estimates. The third section
provides estimation results and the fourth section concludes.
2 Data and methodology
2.1 Data
The data used in this paper is from the Household Labor Force Surveys (HLFS)
conducted between the years 2004 and 2009 by the Turkish Institute of Statis-
tics covering over 120,000 households representing population in 26 NUTS II
regions and the entire country with appropriate weights. In 1997 the com-
pulsory years of schooling has been increased to eight years from the previous
requirement of five years. Thus, individuals who were younger than 20 in
2004 are affected by this change. To eliminate the effect of the new legislation
the sample is restricted to individuals who are between the ages 20-64, em-
ployed permanently at full-time non-agricultural jobs as wage-earners and who
declared positive earnings are used in the estimations below. Self-employed
individuals and family workers are excluded, as well as workers in agricultural
sector, part-time workers1 and apprentices and trainees as their earnings are
usually not comparable to those of full time workers.
Earnings are monthly wages net of tax and social security contributions and
1Despite reporting themselves as full-time employees, some individuals reported less than40 hours a week. These individuals are considered as part-timers, as well.
4
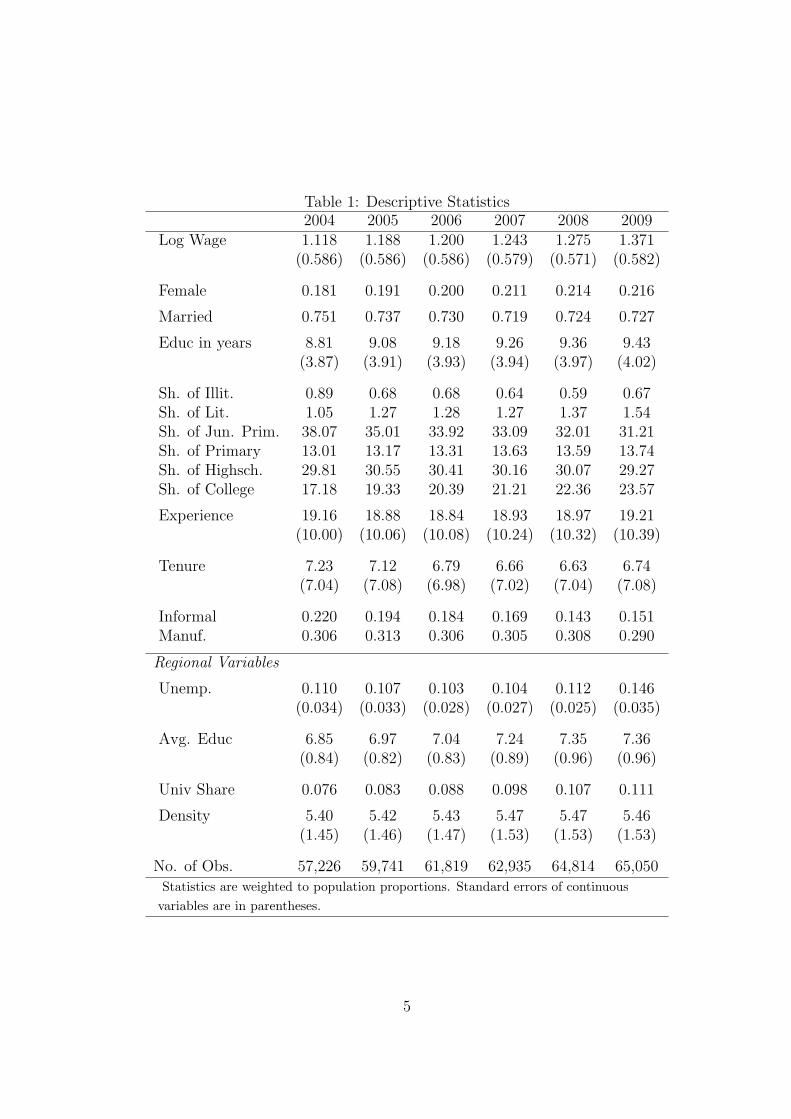
Table 1: Descriptive Statistics2004 2005 2006 2007 2008 2009
Log Wage 1.118 1.188 1.200 1.243 1.275 1.371(0.586) (0.586) (0.586) (0.579) (0.571) (0.582)
Female 0.181 0.191 0.200 0.211 0.214 0.216
Married 0.751 0.737 0.730 0.719 0.724 0.727
Educ in years 8.81 9.08 9.18 9.26 9.36 9.43(3.87) (3.91) (3.93) (3.94) (3.97) (4.02)
Sh. of Illit. 0.89 0.68 0.68 0.64 0.59 0.67Sh. of Lit. 1.05 1.27 1.28 1.27 1.37 1.54Sh. of Jun. Prim. 38.07 35.01 33.92 33.09 32.01 31.21Sh. of Primary 13.01 13.17 13.31 13.63 13.59 13.74Sh. of Highsch. 29.81 30.55 30.41 30.16 30.07 29.27Sh. of College 17.18 19.33 20.39 21.21 22.36 23.57
Experience 19.16 18.88 18.84 18.93 18.97 19.21(10.00) (10.06) (10.08) (10.24) (10.32) (10.39)
Tenure 7.23 7.12 6.79 6.66 6.63 6.74(7.04) (7.08) (6.98) (7.02) (7.04) (7.08)
Informal 0.220 0.194 0.184 0.169 0.143 0.151Manuf. 0.306 0.313 0.306 0.305 0.308 0.290
Regional Variables
Unemp. 0.110 0.107 0.103 0.104 0.112 0.146(0.034) (0.033) (0.028) (0.027) (0.025) (0.035)
Avg. Educ 6.85 6.97 7.04 7.24 7.35 7.36(0.84) (0.82) (0.83) (0.89) (0.96) (0.96)
Univ Share 0.076 0.083 0.088 0.098 0.107 0.111
Density 5.40 5.42 5.43 5.47 5.47 5.46(1.45) (1.46) (1.47) (1.53) (1.53) (1.53)
No. of Obs. 57,226 59,741 61,819 62,935 64,814 65,050Statistics are weighted to population proportions. Standard errors of continuous
variables are in parentheses.
5
include overtime work and bonuses. They are converted to hourly wages using
reported usual weekly hours (monthly earnings/(4.33*weekly work hours)).
They are adjusted to real values using the national consumer price index,
though no adjustment is made with respect to regional purchasing power pari-
ties as the theoretical model on which the estimation is based refers to nominal
wages, that are not corrected for regional purchasing power. To eliminate some
extreme values, log real hourly wages are trimmed at one percent from both
lower and upper tails2.
The remaining sample has a little less than 350 thousand observations, with
on average around 60 thousand individuals per year. The data has information
on gender, marital status, schooling, age and tenure on the current job, as
well some information on the job characteristic, such as one digit sector and
firm size. The schooling variable is reported as the highest degree completed,
which is converted to years of schooling using the appropriate number of years
required to obtain the degree. Unlike most developed countries, there is a
significant amount of informal workers in Turkey, that is workers that are not
registered for any kind of social security. These workers constitute around
20% of all workers using appropriate weights in the data and around 4% of
them are university graduates. They are also included in the data set but
are identified with a dummy variable indicator whether they are working as
formal or informal employees. The variables at the regional level are calculated
using the entire HLFSs with the proper weighting provided by the Institute,
therefore representing all individuals in the region.
Table 1 reports summary statistics on these variables. There are a few
noteworthy observations that somehow differentiates Turkey from the earlier
studies. First and foremost, the share of females in total employment is around
20%. The female labor force participation is also very low in Turkey, which is
mostly related to the traditional family structure but also to some economic
factors such as that educational attainment being much lower within female
population, the alternative to home production being relatively expensive, and
females being usually employed as unpaid and unreported family workers. Sec-
ond important property of the Turkish work force is that they are substantially
2Trimming does not change empirical results qualitatively in any way. These estimationresults are available upon request.
6
less educated than in developed (or transition) countries. In the last couple of
decades there is some improvement, as can be seen by increasing years of edu-
cation in the data. The rate of increase in the education level is partially due
to the fact that Turkey has a relatively young population, and that every year
the new entrants have significantly higher education than the exiting ones.
2.2 Econometric model
The econometric model is based on the theoretical framework discussed in
Moretti (2004a, 2004b) which yields a Mincerian wage equation augmented
with aggregate human capital in the region. The model is an extension of
Roback (1982) which discusses firms’ and workers’ location choice in a general
equilibrium setting with externalities. Firms and workers are free to move
across regions. Firms produce a tradable good using land and two types of
human capital, high and low skill. Each worker’s productivity is assumed to
be a function of his own human capital and aggregate human capital to the
extent spillovers affect individual’s productivity. While the model is general
enough to capture a wide variety of externalities, the aim in this paper is not
to identify them separately despite their importance in policy making, because
with the available data such a task is simply not possible. The worker’s indirect
utility function involves housing prices, wages and amenities of which aggregate
human capital is an element. The model predicts that low skilled workers
benefit from externalities, if they ever exist, positively, through their increased
productivity due to imperfect substitutability between skill types and through
spillovers. However, the impact of aggregate human capital on the wages of
the high skilled workers depends on the magnitude of two counteracting forces:
an increase in the supply of skilled workers reduces their wages as the demand
curve is downward sloping, on the other hand, increasing the level of human
capital increases their efficiency and thus wages.
Estimation is based upon the following equation of (log) real wages, ln(w),
of worker i residing in region r at time t:
ln(wirt) = αt +Xitβ + ηHjrt +Rrtγ + uirt (1)
7

where αt controls for time effects, Xit is a vector of individual specific ob-
servable variables, including years of schooling, experience, tenure and their
squared terms, Hrt is average years of schooling in region r at time t, Rrt is a
set of constant or time varying regional characteristics.
As mentioned earlier, identification of the main parameter of interest, η is
complicated by the possibility that there could be some unobservable variables
that are important in wage determination at both the individual level and the
regional level. The residual therefore can be thought of a composite of three
factors:
uijt = µrεi + νrt + εirt (2)
where εi is an individual level permanent unobservable component involving
ability or family background, and µr is the region specific coefficient enabling
ability to be valued differently in each region. The second term, νrt, captures
time-varying demand and supply shocks in region r, and finally εirt is the
error term assumed to be independently and identically distributed over all
individuals in every region at each point in time.
In most labor market studies, fixed effects are used to control for individual
ability. However, the HLFS does not have a panel structure. Therefore, a set
of individual characteristics are used to control for unobserved ability. Along
with variables identifying gender, marital status, experience and job tenure
of the individual that are used in any standard Mincerian equation estima-
tion, dummy variables of the industry and the size of the firm the individual
works are also employed. To control for individual ability, another variable
that measures the average education level of her immediate family, an average
of spouse’s, children’s (if they have completed their studies and are still living
in the same household), and parent’s education if they are co-residing with
the individual, is constructed3. Using parents’ education is common in labor
studies. However there are very few individuals who live together with their
parents. If parents’ skill level is a proxy for children, the reverse must also
be true. Finally, assortative mating (Hyslop, 2001) indicates that high-skilled
men tend to marry high-skilled women, while less-skilled men are more likely
3Each degree is converted into years of schooling by using the appropriate years requiredto earn the degree.
8
to marry less-skilled women. Indeed, 45-50% of individuals in our data set
are married to someone with the same completed degree. Unobserved individ-
ual heterogeneity is then controlled by using this family background variable
interacted with region specific dummies.
There could be several region specific characteristics that may affect wages
the omission of which may cause average human capital to be biased. These
could be fixed characteristics, such as amenities, or time varying factors that
affect demand and supply. Following the literature, the model is extended to
include a full set of regional dummies, to control for time-invariant amenities;
regional unemployment rates, to eliminate the possibility that regional educa-
tion may capture the unemployment effect in case more educated people are
less likely to be unemployed; and regional population density, to account for
agglomeration economies. Similar to Moretti (2004b), to control for demand
shifts, a set of indices based on Katz and Murphy (1992) are also generated.
If regions do not have same specialization pattern, then sectoral shocks may
have different effects on each region. In the case of sectors employing differ-
ent compositions of skills, then the demand shocks may also not be constant
over different skill groups in every region. Moretti (2004b) proposes an in-
dex that is related to national employment growth in sectors weighted by
the regional employment shares of each sector and education group, namely
DSkr =∑S
s wsr∆Eks, where DSkr is the demand shock for workers employed
in sector s in region r, ∆Eks is the change in national employment of kth ed-
ucation group in sector s, and wsr is the employment share of sector in region
r.
Finally, the regional average education level is instrumented by using de-
mographic variables and schooling in 1990. Despite all the controls there could
be still some reverse causality in the data. To test for the robustness of the
results a set of instrumental variable models are estimated. Demographic vari-
ables are a commonly used instruments in labor studies and earlier studies that
examined social returns to education (Ciccone and Peri, 2006; Dalmazzo and
de Blasio, 2007). Considering that children under the age of 10 in 1990 will
have partially completed their education in 2004 and younger people have more
education than the older, regions with a higher share of children are expected
to have higher regional human capital in 2004. In the same way, since older
9
people are less educated than the young ones, regions with a higher share of
old people in 1990 are expected to observe a higher increase in their regional
education level as most of these people are already retired in 2004. The share
of children under the age of 10 and the share of individuals above 50 in 1990,
and the square terms to allow for possible non-linearity along with average
years of schooling in the region in 1990 are used to instrument regional human
capital.
3 Estimation results
3.1 OLS estimates
Table 2 presents the result of the first set of regressions using ordinary least
squares. The first specification is the basic one and includes only the standard
Mincerian equation co-variates and the average years of schooling in each re-
gion. The results indicate that while an additional year of schooling increases
private returns by 8%, a one-year increase in the average regional education
level provides an additional 6.5% increase in wages. Experience and tenure
have positive coefficients and their square terms negative coefficients as usual,
implying that returns to experience and tenure are increasing at a decreas-
ing rate. Surprisingly, in this specification the coefficient of female dummy is
insignificant.
In the second specification, a full set of regional dummies is included in
the model. While there is no change in private returns, social returns decline
to 4.4%. It is immediately apparent that if heterogeneity at the regional
level is controlled for, the social returns will capture all other effects. In
the third column some additional individual characteristics are added to the
model. These are a set of dummies indicating the sector of the individual’s
job, the size of the firm and whether the individual is employed in the formal
sector. The inclusion of individual characteristics do not affect social returns
but significantly reduces private returns to education. While not reported
in the table, the wages increase as the firm gets larger, and the industry
dummies are jointly significant. Individuals who have a formal job earn 17%
more. Considering that the wages are measured in net terms, net of taxes and
10
social security payments, this is a large difference. A plausible explanation
for this finding is that more able workers are preferred by the formal sector
employers. Thus, the omission of a control for the sector of employment may
produce biased results. Notice that, once individual attributes are controlled
for, females earnings are significantly lower than male earnings.
The fourth and fifth columns incorporate additional terms to control for
unobserved heterogeneity. First only family background interacted with region
dummies are introduced. The family background variables are individually
and jointly significant at conventional levels, and the average return is a little
above two percent. Controlling for unobserved individual ability this way,
private returns decrease to 5.2% and social returns are 3.3% while the latter
is now marginally significant. The last column in the table reports results of
the regression that includes regional population density, unemployment and
two demand shift variables one for highschool and above, the other for lower
than highschool graduates as defined above. None of these regional variables
turn out to be significant even though they have expected sign, that is, the
density variable has a positive coefficients and unemployment has a negative
coefficient. Most probably these variables change very little in the period
examined here.
To explore the robustness of the results in Table 2 a few additional regres-
sions are run. The first one allows private returns to vary across regions. The
estimated coefficients for both private4 and social returns are very close to the
coefficient estimates in the final specification of the table, and thus are not
reported here.
To assess who benefits more from human capital externalities, a specifica-
tion where gender, being employed in the manufacturing sector, and being an
employee in the formal sector are interacted with private and social returns in
addition to all variables in the fifth column of Table 2 is also formulated. The
results presented in Table 3 has some interesting implications.
In this specification, females on average earn less than around 25% than
males. However, there is an additional 1.3% return to every year of schooling
for females. Females in Turkey have much fewer years of education than males,
4The average of region-specific estimates is around 5.5%.
11
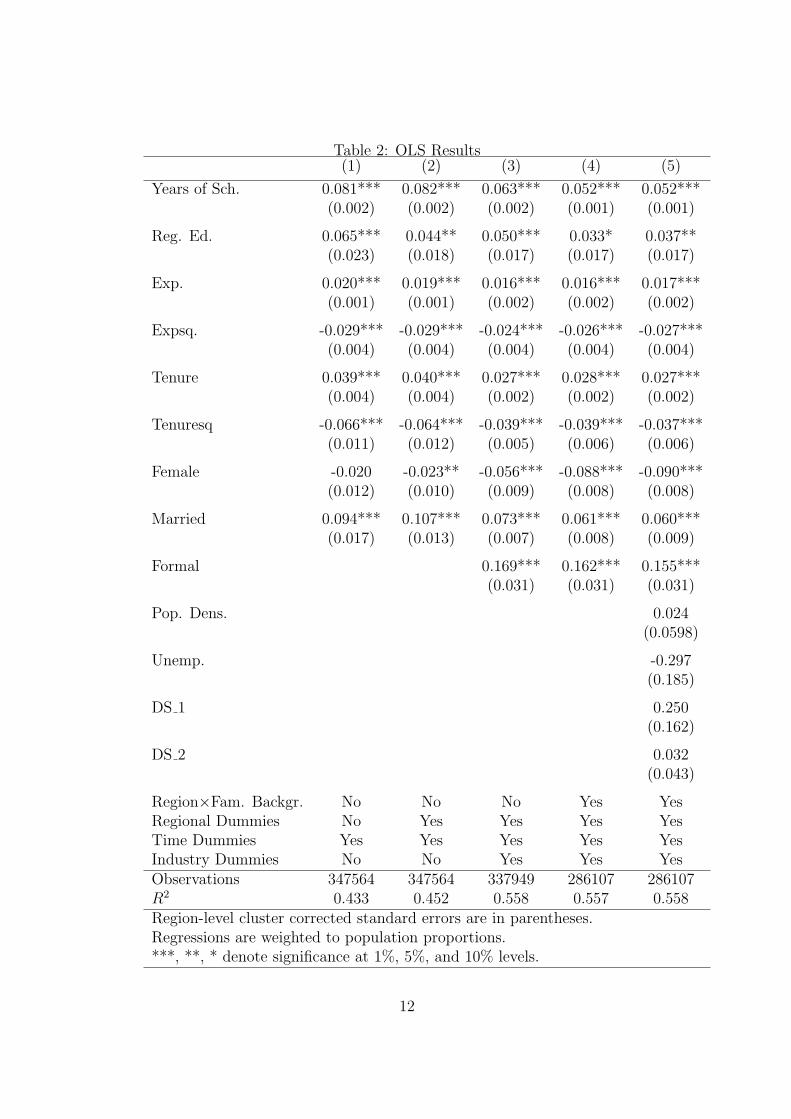
Table 2: OLS Results(1) (2) (3) (4) (5)
Years of Sch. 0.081*** 0.082*** 0.063*** 0.052*** 0.052***(0.002) (0.002) (0.002) (0.001) (0.001)
Reg. Ed. 0.065*** 0.044** 0.050*** 0.033* 0.037**(0.023) (0.018) (0.017) (0.017) (0.017)
Exp. 0.020*** 0.019*** 0.016*** 0.016*** 0.017***(0.001) (0.001) (0.002) (0.002) (0.002)
Expsq. -0.029*** -0.029*** -0.024*** -0.026*** -0.027***(0.004) (0.004) (0.004) (0.004) (0.004)
Tenure 0.039*** 0.040*** 0.027*** 0.028*** 0.027***(0.004) (0.004) (0.002) (0.002) (0.002)
Tenuresq -0.066*** -0.064*** -0.039*** -0.039*** -0.037***(0.011) (0.012) (0.005) (0.006) (0.006)
Female -0.020 -0.023** -0.056*** -0.088*** -0.090***(0.012) (0.010) (0.009) (0.008) (0.008)
Married 0.094*** 0.107*** 0.073*** 0.061*** 0.060***(0.017) (0.013) (0.007) (0.008) (0.009)
Formal 0.169*** 0.162*** 0.155***(0.031) (0.031) (0.031)
Pop. Dens. 0.024(0.0598)
Unemp. -0.297(0.185)
DS 1 0.250(0.162)
DS 2 0.032(0.043)
Region×Fam. Backgr. No No No Yes YesRegional Dummies No Yes Yes Yes YesTime Dummies Yes Yes Yes Yes YesIndustry Dummies No No Yes Yes YesObservations 347564 347564 337949 286107 286107R2 0.433 0.452 0.558 0.557 0.558Region-level cluster corrected standard errors are in parentheses.Regressions are weighted to population proportions.***, **, * denote significance at 1%, 5%, and 10% levels.
12
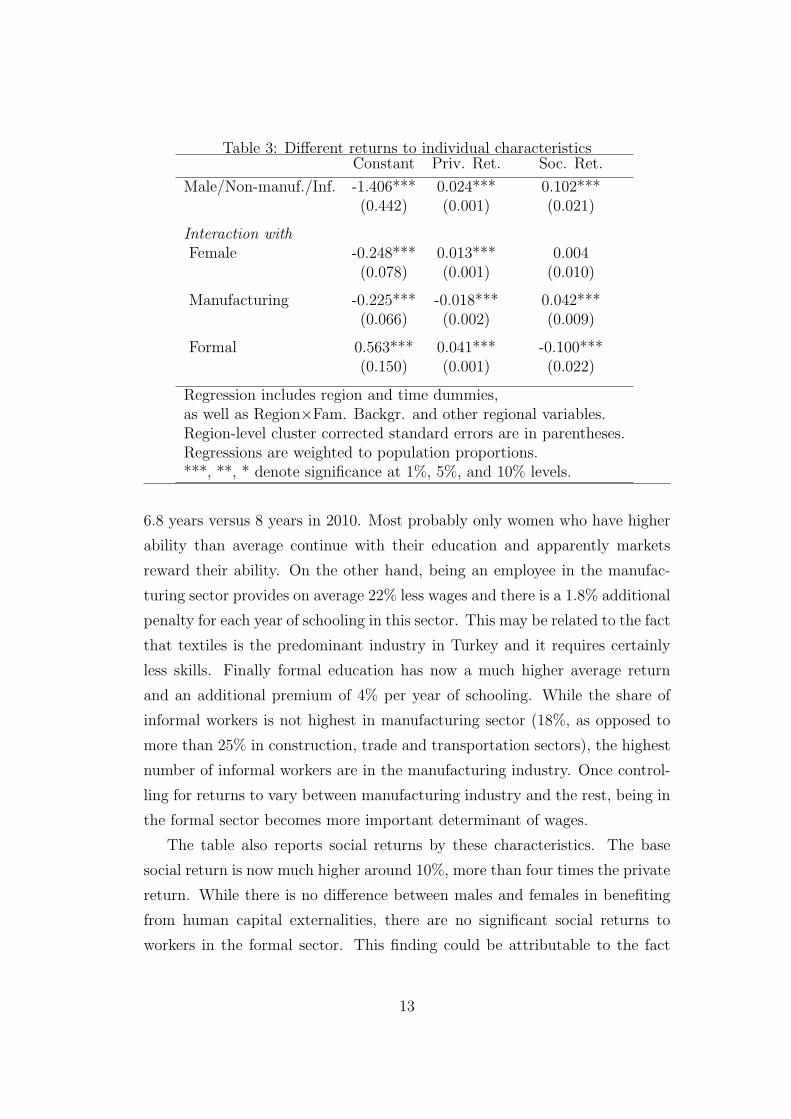
Table 3: Different returns to individual characteristicsConstant Priv. Ret. Soc. Ret.
Male/Non-manuf./Inf. -1.406*** 0.024*** 0.102***(0.442) (0.001) (0.021)
Interaction withFemale -0.248*** 0.013*** 0.004
(0.078) (0.001) (0.010)
Manufacturing -0.225*** -0.018*** 0.042***(0.066) (0.002) (0.009)
Formal 0.563*** 0.041*** -0.100***(0.150) (0.001) (0.022)
Regression includes region and time dummies,as well as Region×Fam. Backgr. and other regional variables.Region-level cluster corrected standard errors are in parentheses.Regressions are weighted to population proportions.***, **, * denote significance at 1%, 5%, and 10% levels.
6.8 years versus 8 years in 2010. Most probably only women who have higher
ability than average continue with their education and apparently markets
reward their ability. On the other hand, being an employee in the manufac-
turing sector provides on average 22% less wages and there is a 1.8% additional
penalty for each year of schooling in this sector. This may be related to the fact
that textiles is the predominant industry in Turkey and it requires certainly
less skills. Finally formal education has now a much higher average return
and an additional premium of 4% per year of schooling. While the share of
informal workers is not highest in manufacturing sector (18%, as opposed to
more than 25% in construction, trade and transportation sectors), the highest
number of informal workers are in the manufacturing industry. Once control-
ling for returns to vary between manufacturing industry and the rest, being in
the formal sector becomes more important determinant of wages.
The table also reports social returns by these characteristics. The base
social return is now much higher around 10%, more than four times the private
return. While there is no difference between males and females in benefiting
from human capital externalities, there are no significant social returns to
workers in the formal sector. This finding could be attributable to the fact
13

that informal workers have on average less years of schooling. Possible non-
linearities in returns to education are discussed later in Table 4. The table also
shows that manufacturing workers enjoy an additional four percent of social
returns, compounding to more than 14%. The theoretical model discussed
above assumes that firms produce a tradable product and thus the model’s
prediction is that there would be higher returns in the manufacturing industry
is supported by the data.
In the presence of non-linearities to returns the model could be misspecified
and there would be bias in the estimates of externalities. Given that average
years of schooling are around eight years and the share of university graduates
is around 10% in Turkey (over nine years and 20% among employed popula-
tion), there would be more grounds to expect some non-linear returns. Table
4 replaces years of schooling with the highest degree earned by individual, and
each category is also interacted with aggregate human capital. Indeed, every
additional degree has increasing private returns, a three-year highschool degree
provides 25%, around 8% per year, additional wages, when a four-year uni-
versity degree provides 40% higher wages, a 10% premium for each additional
year.
The table also allows for non-linear social returns. An important predic-
tion of the model is that while externalities would be unambiguously positive
for workers with lower skill levels, the returns to high skill types are deter-
mined by the competing forces of positive externalities and declining wages
due to the increased supply of more educated individuals (to the extent that
the two types are imperfect substitutes). The second column of Table 4 shows
additional social returns to each education group and the third column reports
F-statistics (p-values in parentheses) indicating whether net social return to
particular group is significantly different from zero. Social return to illiterate
workers is around 6%, and declines with each additional degree. The net return
to employees with a highschool degree and above are statistically insignificant
at conventional levels. The results are similar to earlier research, with the ex-
ception of Heuermann (2011), however, net social returns are statistically zero
for individuals who have higher than average education. Plausibly, there are
very few jobs that require high degrees in Turkey, as expected in most develop-
ing countries since they specialize in industries with lower skill requirements,
14
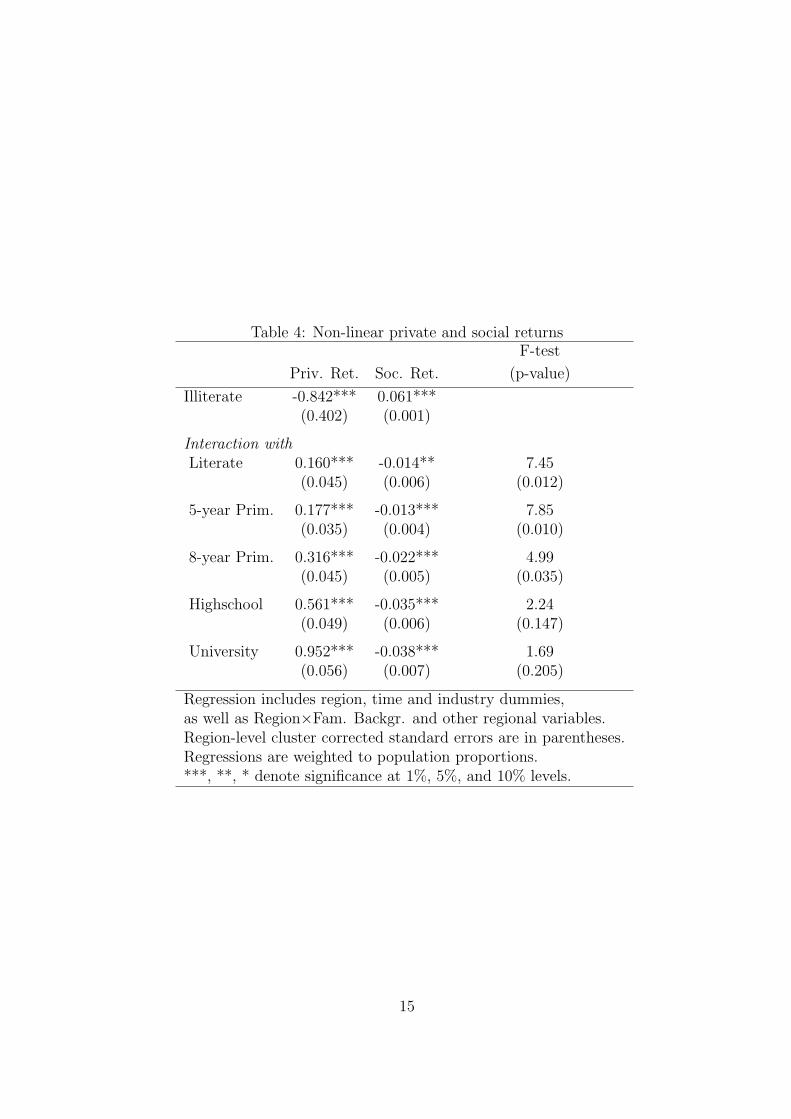
Table 4: Non-linear private and social returnsF-test
Priv. Ret. Soc. Ret. (p-value)
Illiterate -0.842*** 0.061***(0.402) (0.001)
Interaction withLiterate 0.160*** -0.014** 7.45
(0.045) (0.006) (0.012)
5-year Prim. 0.177*** -0.013*** 7.85(0.035) (0.004) (0.010)
8-year Prim. 0.316*** -0.022*** 4.99(0.045) (0.005) (0.035)
Highschool 0.561*** -0.035*** 2.24(0.049) (0.006) (0.147)
University 0.952*** -0.038*** 1.69(0.056) (0.007) (0.205)
Regression includes region, time and industry dummies,as well as Region×Fam. Backgr. and other regional variables.Region-level cluster corrected standard errors are in parentheses.Regressions are weighted to population proportions.***, **, * denote significance at 1%, 5%, and 10% levels.
15
and the demand for higher education is pretty steep.
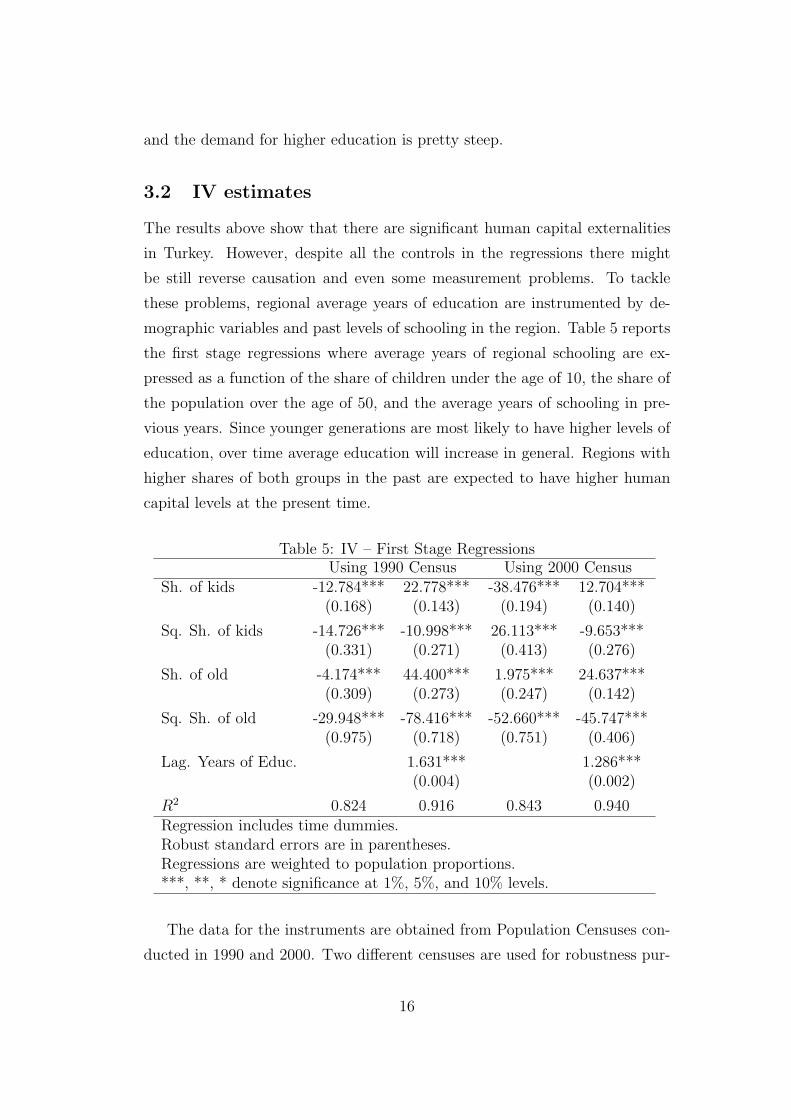
3.2 IV estimates
The results above show that there are significant human capital externalities
in Turkey. However, despite all the controls in the regressions there might
be still reverse causation and even some measurement problems. To tackle
these problems, regional average years of education are instrumented by de-
mographic variables and past levels of schooling in the region. Table 5 reports
the first stage regressions where average years of regional schooling are ex-
pressed as a function of the share of children under the age of 10, the share of
the population over the age of 50, and the average years of schooling in pre-
vious years. Since younger generations are most likely to have higher levels of
education, over time average education will increase in general. Regions with
higher shares of both groups in the past are expected to have higher human
capital levels at the present time.
Table 5: IV – First Stage RegressionsUsing 1990 Census Using 2000 Census
Sh. of kids -12.784*** 22.778*** -38.476*** 12.704***(0.168) (0.143) (0.194) (0.140)
Sq. Sh. of kids -14.726*** -10.998*** 26.113*** -9.653***(0.331) (0.271) (0.413) (0.276)
Sh. of old -4.174*** 44.400*** 1.975*** 24.637***(0.309) (0.273) (0.247) (0.142)
Sq. Sh. of old -29.948*** -78.416*** -52.660*** -45.747***(0.975) (0.718) (0.751) (0.406)
Lag. Years of Educ. 1.631*** 1.286***(0.004) (0.002)
R2 0.824 0.916 0.843 0.940Regression includes time dummies.Robust standard errors are in parentheses.Regressions are weighted to population proportions.***, **, * denote significance at 1%, 5%, and 10% levels.
The data for the instruments are obtained from Population Censuses con-
ducted in 1990 and 2000. Two different censuses are used for robustness pur-
16

poses, on the grounds that age structure may reflect expectations about the
changes in the regional economy. In all specifications the instruments are sig-
nificant even though when lagged average years of schooling are not included
the coefficients on the share of the young and old population have unexpected
signs. But after controlling for lagged average education, the current level of
regional years of schooling is an increasing function of both the share of the
young and old population as expected.
Table 6: IV – Second Stage RegressionsUsing 1990 Census Using 2000 CensusIV (1) IV (2) IV (1) IV (2)
Private return 0.052*** 0.052*** 0.052*** 0.052***(0.001) (0.001) (0.001) (0.001)
Social return 0.043*** 0.045*** 0.077*** 0.048***(0.004) (0.004) (0.003) (0.004)
Using the same set of variables as specification (5) in Table 2.Region-level cluster corrected standard errors are in parentheses.Regressions are weighted to population proportions.***, **, * denote significance at 1%, 5%, and 10% levels.
The second-stage estimates are presented in Table 6 using the instruments
as in the same order of previous table. The estimated social returns are slightly
higher than the OLS estimates for three specifications. Only in one IV esti-
mation, when only the age structure in 2000 is used to instrument regional
education, human capital externalities exceed private returns. The instru-
mental variable estimation confirms the findings of previous subsection.
3.3 The share of university graduates
Finally, the same set of regressions are run using the share of university gradu-
ates in regions rather than using average years of schooling. In a country with
low levels of education, using the share of university graduates may not be ap-
propriate. Besides, Acemoglu and Angrist (2000) point out that most human
capital accumulation in currently developed countries in early stages of their
development is accounted for by increases in secondary schooling. Nonetheless,
to be able to compare results with some of the previous research, the results
17
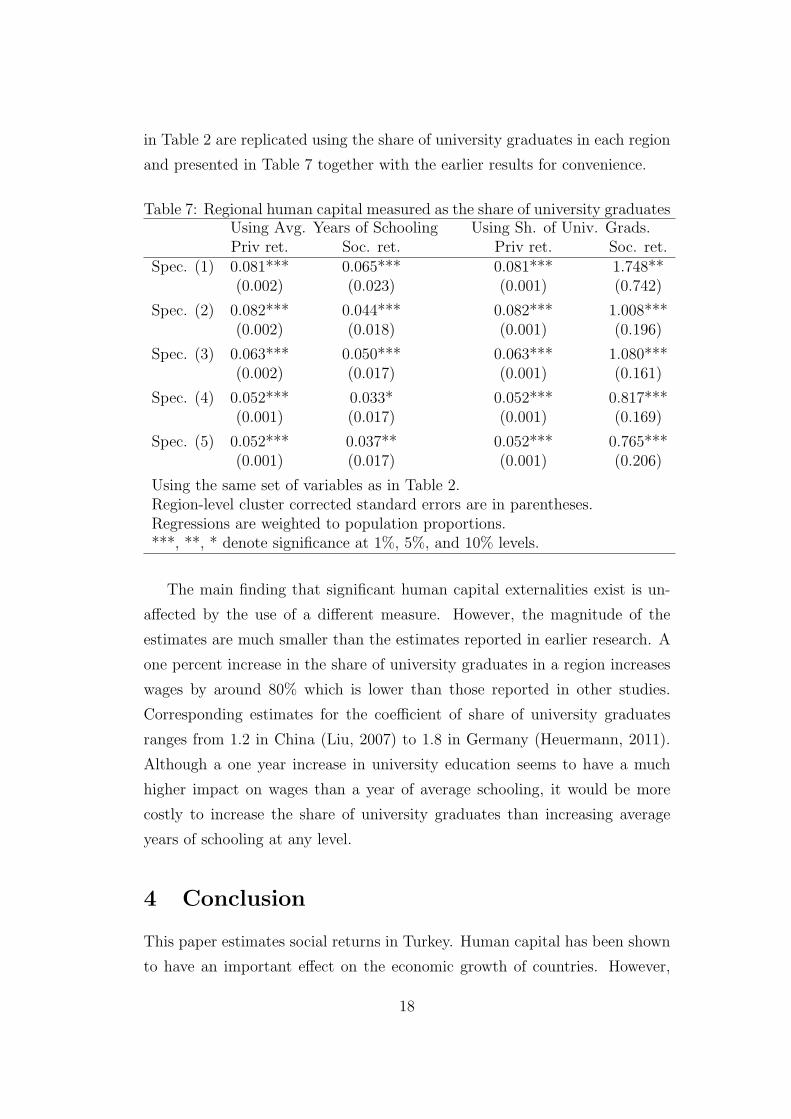
in Table 2 are replicated using the share of university graduates in each region
and presented in Table 7 together with the earlier results for convenience.
Table 7: Regional human capital measured as the share of university graduatesUsing Avg. Years of Schooling Using Sh. of Univ. Grads.Priv ret. Soc. ret. Priv ret. Soc. ret.
Spec. (1) 0.081*** 0.065*** 0.081*** 1.748**(0.002) (0.023) (0.001) (0.742)
Spec. (2) 0.082*** 0.044*** 0.082*** 1.008***(0.002) (0.018) (0.001) (0.196)
Spec. (3) 0.063*** 0.050*** 0.063*** 1.080***(0.002) (0.017) (0.001) (0.161)
Spec. (4) 0.052*** 0.033* 0.052*** 0.817***(0.001) (0.017) (0.001) (0.169)
Spec. (5) 0.052*** 0.037** 0.052*** 0.765***(0.001) (0.017) (0.001) (0.206)
Using the same set of variables as in Table 2.Region-level cluster corrected standard errors are in parentheses.Regressions are weighted to population proportions.***, **, * denote significance at 1%, 5%, and 10% levels.
The main finding that significant human capital externalities exist is un-
affected by the use of a different measure. However, the magnitude of the
estimates are much smaller than the estimates reported in earlier research. A
one percent increase in the share of university graduates in a region increases
wages by around 80% which is lower than those reported in other studies.
Corresponding estimates for the coefficient of share of university graduates
ranges from 1.2 in China (Liu, 2007) to 1.8 in Germany (Heuermann, 2011).
Although a one year increase in university education seems to have a much
higher impact on wages than a year of average schooling, it would be more
costly to increase the share of university graduates than increasing average
years of schooling at any level.
4 Conclusion
This paper estimates social returns in Turkey. Human capital has been shown
to have an important effect on the economic growth of countries. However,
18
whether it contributes through increasing the efficiency of individuals who
acquire higher levels of education or through externalities that also increase
the wages of those who have lower human capital is a subject that has been
investigated only very recently. The paper finds a strong correlation between
the aggregate level of education and wages regardless how local human capital
is measured, or the methodology used to estimate the magnitude of spillovers.
The private returns to education in Turkey are found to be around 5%,
lower than typical estimates in most developed countries (Card, 1999; Mid-
dendorf, 2008). Considering the rather scarce human capital in Turkey, one
would expect higher returns. Yet similar estimates are reported for China and
Russia, though these countries have higher levels of education. This could be
due to either the quality of education in Turkey being lower, or that human
capital unless accompanied with the appropriate physical capital and technol-
ogy is not as productive as it should be.
Social returns to education in Turkey, on the other hand, have a similar
size as in developed economies, around 3-4%, when measured as average years
of education, but much smaller when measured as the share of university
graduates in the region. At an early stage of development, degrees lower than
university degrees may play more important role. Given that the estimates
from developed countries also vary, new research on why and how externalities
are internalized by employees, and what is the role of institutional factors and
existing levels of technology in the country is required.
The positive association between aggregate education and wages, and par-
ticularly the fact that it contributes to the wages of less skilled workers, or
workers that are employed in sectors with lower average wages, implies that
subsidizing education in developing countries will not only increase the growth
rate but will also improve income distribution. Nonetheless, the size of total
returns to education is less than 10%, and as claimed by Acemoglu and An-
grist (2000), the evidence is not supporting the importance attached by macro
studies to human capital to explain wide income differences across countries
and regions.
19
References
Acemoglu, D., (1996). A micro-foundation for social increasing returns
in human capital accumulation. Quarterly Journal of Economics, 111,
779-804.
Acemoglu, D., Angrist, J. (2000). How large are human capital external-
ities? Evidence from compulsory schooling laws. NBER Macroeconomic
Annual, 15, 9-59.
Barro, R., (1991), Economic growth in a cross-section of countries.
Quarterly Journal of Economics, 106(2), 407-443.
Card, D., (1999). The causal effects of education on earnings. In O.
Ashenfelter and D. Card (eds.) Handbook of Labor Economics, Amster-
dam, Elsevier-North Holland.
Ciccone, A., Peri, G. (2006). Identifying human capital externalities:
theory with applications. Review of Economic Studies, 73, 381-412.
Dalmazzo, A., de Blasio, G. (2007). Social return to education in
Italian local labor markets. Annals of Regional Science, 41, 51-69.
Heuermann, D. (2011). Human capital xxternalities in Western Ger-
many. Spatial Economic Analysis, 6, 139-165.
Hyslop, D.R., (2001). Rising U.S. earnings inequality and family la-
bor supply: The covariance structure of intrafamily earnings. American
Economic Review, 91, 755-777.
Katz, L.F., Murphy, K.M., (1992). Changes in relative wages, 19631987:
supply and demand factors. The Quarterly Journal of Economics, 107,
3578.
20

Kirby, S., Riley, R. (2008). The external returns to education: UK
evidence using repeated cross-sections. Labour Economics, 15, 619630.
Liu, Z., (2007). The external returns to education: Evidence from
Chinese cities. Journal of Urban Economics, 61, 542-564.
Lucas, R. (1988), On the mechaniscs of economic development. Journal of
Monetary Economics, 22, 3-42.
Mankiw, N.G., Romer, D., and Weil, D. (1992), A contribution to
the empirics of economic growth. Quartery Journal of Economics, 107(2),
407-437.
Middendorf, T., (2008). Returns to education in Europe. Ruhr Eco-
nomic Papers, No. 65.
Moretti, E., (2004a). Human capital externalities in cities. In J.
Henderson and J.-F. Thisse (eds.) Handbook of Regional and Urban Eco-
nomics Vol. 4: Cities and Geography, Amsterdam, Elsevier-North Holland.
Moretti, E., (2004b). Estimating the social return to higher educa-
tion: evidence from longitudinal and repeated cross-sectional data.
Journal of Econometrics,121, 175-212.
Muravyev, A., (2008). Human capital externalities: Evidence from
the transition economy of Russia. Economics of Transition, 16, 415-443.
OECD, (2009). Education at a Glance 2009: OECD Indicators.
Roback, J. (1982). Wages, rents and the quality of life. Journal of
Political Economy, 90, 12571278
21
Recommended