Article
Smoothened Variants Exp
lain the Majority of DrugResistance in Basal Cell CarcinomaGraphical Abstract
Highlights
d Functional SMO mutations are detected in the majority of
SMO inhibitor-resistant BCCs
d Resistance occurs by suppressing drug responsiveness and
SMO autoinhibition
d SMO mutants explain both intrinsic and acquired tumor
resistance
d Inhibition of aPKC-i/l or GLI2 bypasses SMO variants to
suppress Hedgehog signaling
Atwood et al., 2015, Cancer Cell 27, 342–353March 9, 2015 ª2015 Elsevier Inc.http://dx.doi.org/10.1016/j.ccell.2015.02.002
Authors
Scott X. Atwood, Kavita Y. Sarin, ...,
Anthony E. Oro, Jean Y. Tang
[email protected] (A.E.O.),[email protected] (J.Y.T.)
In Brief
Atwood et al. identify key SMO mutations
that confer resistance to SMO inhibitors
in basal cell carcinomas (BCC) and show
that these mutants respond to aPKC-i/l
or GLI2 inhibitors, providing potential
approaches for treating BCCs resistant to
SMO inhibitors.
Accession Numbers
GSE58377

Cancer Cell
Article
Smoothened Variants Explain the Majorityof Drug Resistance in Basal Cell CarcinomaScott X. Atwood,1,2 Kavita Y. Sarin,1,2 Ramon J. Whitson,1 Jiang R. Li,1 Geurim Kim,1 Melika Rezaee,1 Mina S. Ally,1
Jinah Kim,1 Catherine Yao,1 Anne Lynn S. Chang,1,3 Anthony E. Oro,1,3,* and Jean Y. Tang1,3,*1Program in Epithelial Biology and Department of Dermatology, Stanford University School of Medicine, Stanford, CA 94305, USA2Co-first author3Co-senior author
*Correspondence: [email protected] (A.E.O.), [email protected] (J.Y.T.)
http://dx.doi.org/10.1016/j.ccell.2015.02.002
SUMMARY
Advanced basal cell carcinomas (BCCs) frequently acquire resistance to Smoothened (SMO) inhibitorsthrough unknown mechanisms. Here we identify SMO mutations in 50% (22 of 44) of resistant BCCs andshow that these mutations maintain Hedgehog signaling in the presence of SMO inhibitors. Alterationsinclude four ligand binding pocket mutations defining sites of inhibitor binding and four variants conferringconstitutive activity and inhibitor resistance, illuminating pivotal residues that ensure receptor autoinhibition.In the presence of a SMO inhibitor, tumor cells containing either class of SMO mutants effectively outcom-pete cells containing the wild-type SMO. Finally, we show that both classes of SMO variants respondto aPKC-i/l or GLI2 inhibitors that operate downstream of SMO, setting the stage for the clinical use ofGLI antagonists.
INTRODUCTION
Uncontrolled activation of the Hedgehog (HH) pathway drives
tumor progression in a number of cancers, including basal cell,
medulloblastoma, pancreatic, colon, lung, breast, prostate,
and blood cancers (Amakye et al., 2013). Normally, HH ligand ac-
tivates the pathway by binding to and inhibiting the receptor
Patched1 (PTCH1), derepressing G protein-coupled receptor
(GPCR) Smoothened (SMO) and activating the GLI transcription
factors. In oncogenic contexts, loss of PTCH1 and mutagenic
activation of SMO are the most common alterations that induce
the inappropriate activation of the HH pathway. Basal cell carci-
nomas (BCCs) represent the most common cancer in the United
States, with approximately two million new cases per year
(Rogers et al., 2010). Advanced BCCs, a small but significant
proportion of total BCCs, lead to functional impairment, invasive-
ness, metastasis, and increased mortality. HH pathway antago-
nists are under development to combat HH-driven cancers, with
most therapies directed at inhibiting SMO. Like other heptaheli-
cal transmembrane proteins (7-TM), SMO is believed to be auto-
inhibited in its baseline state through both interactions with a
PTCH1-dependent mechanism and through an unidentified
ligand binding in its ligand binding pocket (LBP). All current
Significance
Advanced BCCs acquire resistance to SMO inhibitors throughtances in BCCs and structurally elucidate SMO-mediated Hedgfunctions similarly as other class AGPCRsdespite less than 10%tumors use to evade drug resistance prior to treatment and he
342 Cancer Cell 27, 342–353, March 9, 2015 ª2015 Elsevier Inc.
pathway inhibitors targeting SMO bind the LBP and stabilize
the autoinhibited state, although the details of these interactions
remain unexplored.
As part of the Stanford BCCConsortium, we have enrolled and
treated patients for advanced BCCs that led to the approval of
the SMO inhibitor vismodegib by the Food and Drug Administra-
tion for treatment of advanced/inoperable and metastatic BCCs
(Sekulic et al., 2012; Tang et al., 2012). All syndromic BCCs in pa-
tients with basal cell nevus syndrome (Gorlin syndrome, caused
by inherited PTCH1 loss) respond to vismodegib and have a low
rate of acquired resistance (Tang et al., 2012). In contrast,
advanced and metastatic BCCs have an overall response rate
of 48% (Axelson et al., 2013; Sekulic et al., 2012), with an addi-
tional 20% of patients developing resistance during the first year
(Chang and Oro, 2012). Vismodegib and other SMO inhibitors
have also shown promising results in early clinical trials for me-
dulloblastoma (Gajjar et al., 2013). Despite these successes,
many tumors acquire clinical resistance during therapy (Atwood
et al., 2012), reinforcing the critical need to understand the basis
of inherent resistance at the time of diagnosis and how these
tumors evolve resistance during drug treatment. In contrast
to visceral tumors, patients with advanced BCCs have a low
mortality and often develop multiple resistant tumors that are
two distinct mechanisms that explain the majority of resis-ehog signaling. These genetic alterations suggest that SMOsequence identity. Furthermore, this work offers strategies
lps with the development of second-line therapies.

accessible to sequential biopsies (Atwood et al., 2012), providing
a unique opportunity to assess spatially and temporally distinct
clones during the evolutionary process using genomic tools.
Studies in mice and humans have provided initial insights into
the mechanisms of resistance to SMO inhibitor therapy. Specific
to the HH pathway, germline loss of SUFU, which encodes a
GLI inhibitor downstream of PTCH1, has been shown to bestow
primary resistance to vismodegib in pediatric patients with
medulloblastoma (Kool et al., 2014). Additional mechanisms of
acquired resistance found in medulloblastoma include amplifi-
cation of GLI2 (Dijkgraaf et al., 2011), MYCN (Kool et al., 2014),
and CCND1 (Dijkgraaf et al., 2011) and a missense mutation
in SMO (D473H) that confers resistance through disruption of
vismodegib binding (Yauch et al., 2009). In BCCs, activation
of the GLI kinase atypical protein kinase C i/l (aPKC-i/l) was
found to be elevated in vismodegib-resistant tumors, and
aPKC-i/l inhibition in resistant cell lines suppressed growth (At-
wood et al., 2013). However, HH-driven medulloblastomas have
been shown to evade SMO inhibition by switching their onco-
genic signaling pathway and, therefore, losing their addiction
to theHH pathway (Buonamici et al., 2010; Kool et al., 2014;Met-
calfe et al., 2013). How BCCs evade SMO inhibition remains
unknown.
RESULTS
Hedgehog Signaling Is Maintainedin Vismodegib-Resistant BCCAs each BCC, regardless of patient origin, arises from a distinct
clone, we interrogated the nature of tumor resistance by
sequencing 44 resistant BCCs from 15 patients. ‘‘Resistant
BCCs’’ were defined as refractory to vismodegib (91%, 40 of
44 tumors) or recurrent (9%, 4 of 44) according to the National
Cancer Institute criteria. ‘‘Sensitive BCCs’’ were defined as
BCCs that exhibited a partial or complete response to vismode-
gib treatment. The histology of resistant tumors was similar to
sensitive tumors except for the absence of the superficial sub-
type (Figure 1A). All biopsies were obtained while patients were
undergoing at least 3 months of continuous vismodegib therapy.
Previous work on HH-driven medulloblastomas indicates that
medulloblastomas can switch oncogenic pathways to continue
tumor growth in the presence of SMO inhibition (Kool et al.,
2014), but it is not known whether BCCs behave similarly. Using
paired-end, high-throughput RNA sequencing and pathway
analysis with DAVID (Huang da et al., 2009), we identified
the HH signaling pathway as the most significantly enriched
signaling pathway in resistant BCCs (n = 9) compared with sen-
sitive BCCs (n = 4) or normal skin (n = 8, p = 0.0007) (Figure 1B).
Vismodegib-sensitive BCCs had slightly elevated GLI1 (a HH
target gene)mRNA levels comparedwith normal skin (Figure 1C).
In contrast, resistant BCCs had high GLI1 mRNA levels despite
concurrent treatment with vismodegib (p = 0.0001). Immunoflu-
orescence for GLI1 revealed elevated levels of GLI1 protein in
resistant BCCs compared with sensitive tumors, confirming
persistent HH signaling in resistant BCCs at the protein level (Fig-
ures 1D and 1E). These data suggest that resistant BCCs are still
addicted to the HH pathway and that genetic alterations that
maintain HH pathway output in the presence of vismodegib are
the primary mechanisms of resistance.
Exome Sequencing Identifies Recurrent SMOMutationsin Resistant BCCsAs resistant BCCs rely on the HH pathway for continued growth,
we wanted to identify the HH-specific genetic alterations under-
lying resistance. We performed whole genome and exome
sequencing on 14 resistant BCC tumors along with correspond-
ing matching skin samples with a mean target coverage of 114X
(Figure 2A). We identified a mean of 2,364 somatic coding muta-
tions per BCC. Although the non-silent single-nucleotide variant
(SNV) rate of 42/Mb (range, 5–107/Mb) is somewhat lower than
reported previously in BCCs (Jayaraman et al., 2014), it supports
the notion that skin cancers carry higher mutation rates than
other non-cutaneous tumors. PTCH1 alterations, the most com-
mon driver of BCC growth, were detected in 57% (8 of 14) of
samples. Given that TP53 mutations have been reported in
BCCs, we investigated whether there was a correlation between
TP53 and PTCH1mutations. We found TP53mutations in only 4
of 14 tumors, and they had no correlation with the associated
PTCH1 mutation (Figure 2B).
We next focused our analysis on genes downstream of
PTCH1 that are implicated in HH signaling to assess where
along the pathway resistance originates. We identified genetic
alterations in 15 of 29 HH pathway genes, including multiple
regulatory units of the cyclic AMP/protein kinase A signaling
pathway and amplification of GLI2, which has been shown pre-
viously to confer resistance against SMO antagonists in a me-
dulloblastoma allograft model (Dijkgraaf et al., 2011; Figure 2C).
In fact, genetic alterations of the HH pathway downstream of
PTCH1 were present in 85% of the resistant BCCs. Of these
genes, SMO was the most recurrently mutated gene (42%, 6
of 14 samples). Because one SMO mutation (D473H) has
been identified previously as a driver of resistance in a medullo-
blastoma patient (Yauch et al., 2009), we concentrated our ef-
forts on SMO. Interestingly, we detected SMO D473H and
D473G in two resistant BCCs originating from one sporadic tu-
mor and one Gorlin syndrome patient and W535L in another
three resistant BCCs (Figure 2B). Also known as SMO-M2,
W535L is a known oncogenic mutation present at low rates in
sporadic BCCs and can drive tumor progression in the absence
of PTCH1 loss (Xie et al., 1998). The genetic alterations in SMO
were significantly more frequent than reported previously in
BCCs (Reifenberger et al., 2005), suggesting that SMO could
be a key driver of BCC resistance.
SMO Mutations Are Enriched in Resistant BCCsCompared with Untreated BCCsTo interrogate how SMO drives tumor resistance, we sequenced
an additional 30 resistant BCCs along with 36 untreated, spo-
radic BCCs (Figures 2D and 2E). The coding regions of SMO
and PTCH1 were amplified using the Fluidigm Access Array mi-
crofluidic device followed by next-generation sequencing with a
mean coverage of 2365X (±755). This validation set did not have
paired germline DNA; therefore, we cannot exclude the possibil-
ity that some of the genetic alterations are germline. However,
non-pathogenic mutations present in dbSNP with a minimum
allele frequency of >3% were excluded during our analysis.
Overall, we detected heterozygous SNV mutations in SMO in
77% (23 of 30) of resistant and 33% (12 of 36) of untreated
BCCs (p = 0.0001), suggesting that genetic alterations in SMO
Cancer Cell 27, 342–353, March 9, 2015 ª2015 Elsevier Inc. 343

Figure 1. Hedgehog Signaling Is Upregulated in Resistant BCCs
(A) Clinical photographs (scale bar, 1 in) and histology (scale bar, 100 mm) depicting the time course of a sensitive and a resistant BCC in the same patient during
vismodegib therapy.
(B) Pathway-driven gene set enrichment analysis (DAVID) in resistant BCCs compared with sensitive BCCs and normal skin.
(C) A boxplot representation comparing the log2 RPKM forGLI1 in resistant BCCs, sensitive BCCs, and normal skin (p = 0.0001). The box represents the first and
third quartiles, with whiskers representing range. Center line, median; diamond, mean; circle, outliers.
(D) Quantification of GLI1 immunofluorescence pixel intensity in K14-positive regions (n = 10). Error bars indicate SEM.
(E) Representative immunofluorescence staining against GLI1 and K14 as well as DAPI counterstaining. Adjacent sections were stained with H&E. Scale bar,
100 mm.
344 Cancer Cell 27, 342–353, March 9, 2015 ª2015 Elsevier Inc.
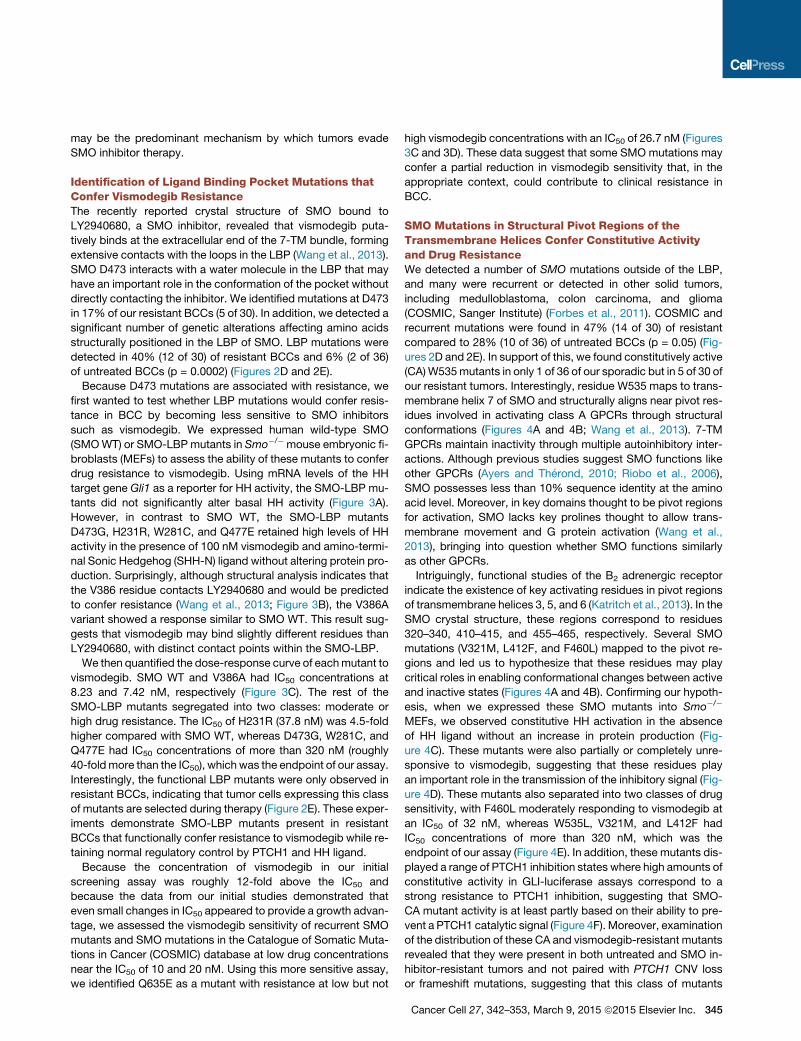
may be the predominant mechanism by which tumors evade
SMO inhibitor therapy.
Identification of Ligand Binding Pocket Mutations thatConfer Vismodegib ResistanceThe recently reported crystal structure of SMO bound to
LY2940680, a SMO inhibitor, revealed that vismodegib puta-
tively binds at the extracellular end of the 7-TM bundle, forming
extensive contacts with the loops in the LBP (Wang et al., 2013).
SMO D473 interacts with a water molecule in the LBP that may
have an important role in the conformation of the pocket without
directly contacting the inhibitor. We identified mutations at D473
in 17% of our resistant BCCs (5 of 30). In addition, we detected a
significant number of genetic alterations affecting amino acids
structurally positioned in the LBP of SMO. LBP mutations were
detected in 40% (12 of 30) of resistant BCCs and 6% (2 of 36)
of untreated BCCs (p = 0.0002) (Figures 2D and 2E).
Because D473 mutations are associated with resistance, we
first wanted to test whether LBP mutations would confer resis-
tance in BCC by becoming less sensitive to SMO inhibitors
such as vismodegib. We expressed human wild-type SMO
(SMOWT) or SMO-LBP mutants in Smo�/� mouse embryonic fi-
broblasts (MEFs) to assess the ability of these mutants to confer
drug resistance to vismodegib. Using mRNA levels of the HH
target gene Gli1 as a reporter for HH activity, the SMO-LBP mu-
tants did not significantly alter basal HH activity (Figure 3A).
However, in contrast to SMO WT, the SMO-LBP mutants
D473G, H231R, W281C, and Q477E retained high levels of HH
activity in the presence of 100 nM vismodegib and amino-termi-
nal Sonic Hedgehog (SHH-N) ligand without altering protein pro-
duction. Surprisingly, although structural analysis indicates that
the V386 residue contacts LY2940680 and would be predicted
to confer resistance (Wang et al., 2013; Figure 3B), the V386A
variant showed a response similar to SMO WT. This result sug-
gests that vismodegib may bind slightly different residues than
LY2940680, with distinct contact points within the SMO-LBP.
We then quantified the dose-response curve of eachmutant to
vismodegib. SMO WT and V386A had IC50 concentrations at
8.23 and 7.42 nM, respectively (Figure 3C). The rest of the
SMO-LBP mutants segregated into two classes: moderate or
high drug resistance. The IC50 of H231R (37.8 nM) was 4.5-fold
higher compared with SMO WT, whereas D473G, W281C, and
Q477E had IC50 concentrations of more than 320 nM (roughly
40-foldmore than the IC50), which was the endpoint of our assay.
Interestingly, the functional LBP mutants were only observed in
resistant BCCs, indicating that tumor cells expressing this class
of mutants are selected during therapy (Figure 2E). These exper-
iments demonstrate SMO-LBP mutants present in resistant
BCCs that functionally confer resistance to vismodegib while re-
taining normal regulatory control by PTCH1 and HH ligand.
Because the concentration of vismodegib in our initial
screening assay was roughly 12-fold above the IC50 and
because the data from our initial studies demonstrated that
even small changes in IC50 appeared to provide a growth advan-
tage, we assessed the vismodegib sensitivity of recurrent SMO
mutants and SMO mutations in the Catalogue of Somatic Muta-
tions in Cancer (COSMIC) database at low drug concentrations
near the IC50 of 10 and 20 nM. Using this more sensitive assay,
we identified Q635E as a mutant with resistance at low but not
high vismodegib concentrations with an IC50 of 26.7 nM (Figures
3C and 3D). These data suggest that some SMO mutations may
confer a partial reduction in vismodegib sensitivity that, in the
appropriate context, could contribute to clinical resistance in
BCC.
SMO Mutations in Structural Pivot Regions of theTransmembrane Helices Confer Constitutive Activityand Drug ResistanceWe detected a number of SMO mutations outside of the LBP,
and many were recurrent or detected in other solid tumors,
including medulloblastoma, colon carcinoma, and glioma
(COSMIC, Sanger Institute) (Forbes et al., 2011). COSMIC and
recurrent mutations were found in 47% (14 of 30) of resistant
compared to 28% (10 of 36) of untreated BCCs (p = 0.05) (Fig-
ures 2D and 2E). In support of this, we found constitutively active
(CA)W535mutants in only 1 of 36 of our sporadic but in 5 of 30 of
our resistant tumors. Interestingly, residue W535 maps to trans-
membrane helix 7 of SMO and structurally aligns near pivot res-
idues involved in activating class A GPCRs through structural
conformations (Figures 4A and 4B; Wang et al., 2013). 7-TM
GPCRs maintain inactivity through multiple autoinhibitory inter-
actions. Although previous studies suggest SMO functions like
other GPCRs (Ayers and Therond, 2010; Riobo et al., 2006),
SMO possesses less than 10% sequence identity at the amino
acid level. Moreover, in key domains thought to be pivot regions
for activation, SMO lacks key prolines thought to allow trans-
membrane movement and G protein activation (Wang et al.,
2013), bringing into question whether SMO functions similarly
as other GPCRs.
Intriguingly, functional studies of the B2 adrenergic receptor
indicate the existence of key activating residues in pivot regions
of transmembrane helices 3, 5, and 6 (Katritch et al., 2013). In the
SMO crystal structure, these regions correspond to residues
320–340, 410–415, and 455–465, respectively. Several SMO
mutations (V321M, L412F, and F460L) mapped to the pivot re-
gions and led us to hypothesize that these residues may play
critical roles in enabling conformational changes between active
and inactive states (Figures 4A and 4B). Confirming our hypoth-
esis, when we expressed these SMO mutants into Smo�/�
MEFs, we observed constitutive HH activation in the absence
of HH ligand without an increase in protein production (Fig-
ure 4C). These mutants were also partially or completely unre-
sponsive to vismodegib, suggesting that these residues play
an important role in the transmission of the inhibitory signal (Fig-
ure 4D). These mutants also separated into two classes of drug
sensitivity, with F460L moderately responding to vismodegib at
an IC50 of 32 nM, whereas W535L, V321M, and L412F had
IC50 concentrations of more than 320 nM, which was the
endpoint of our assay (Figure 4E). In addition, these mutants dis-
played a range of PTCH1 inhibition states where high amounts of
constitutive activity in GLI-luciferase assays correspond to a
strong resistance to PTCH1 inhibition, suggesting that SMO-
CA mutant activity is at least partly based on their ability to pre-
vent a PTCH1 catalytic signal (Figure 4F). Moreover, examination
of the distribution of these CA and vismodegib-resistant mutants
revealed that they were present in both untreated and SMO in-
hibitor-resistant tumors and not paired with PTCH1 CNV loss
or frameshift mutations, suggesting that this class of mutants
Cancer Cell 27, 342–353, March 9, 2015 ª2015 Elsevier Inc. 345

A
B
E
D
C
Figure 2. Resistant BCCs Harbor Recurrent SMO Mutations
(A) Schematic of the tumor biopsy and adjacent normal skin collection followed by whole-exome or genome sequencing and analysis.
(B) List of SMO, PTCH1, and TP53 mutations identified for each resistant BCC sample subjected to exome sequencing.
(C) Spectrum of HH pathway genes with genetic alterations seen in exome sequencing of resistant tumor-normal pairs. The genes are listed on the left side, and
the tumor samples are across the bottom. The fraction of samples with HH pathway mutations is listed in the bar graph to the right.
(legend continued on next page)
346 Cancer Cell 27, 342–353, March 9, 2015 ª2015 Elsevier Inc.

A
C D
B
Figure 3. Variation in Responsiveness of SMO Ligand Binding Pocket Mutations
(A) SMO variants expressed in Smo�/�MEFs and treated with SHH-N conditionedmedium (CM) with or without 100 nM vismodegib. TheWestern blot shows the
expression of SMO WT and SMO variants. dR, delta reporter.
(B) Side view (left) and top-down view (right) of the position of the SMO variants within the SMO crystal structure showing their arrangement relative to an inhibitor
(Wang et al., 2013).
(C) Response of the indicated SMO mutants with different concentrations of vismodegib. IC50 values are shown in brackets.
(D) HH pathway activity in Smo�/� MEFs expressing the indicated SMO and treated with SHH-N CM with or without 10, 20, or 80 nM vismodegib.
All error bars indicate SEM.
drives initial BCC tumorigenesis and confers inherent resistance
at the time of treatment (Figure 2B). These results identify SMO-
CA mutants, in addition to W535L, that impart dual roles in
tumorigenesis and acquired resistance, pointing to a class of
mutations that would cause inherent resistance to SMO
inhibition.
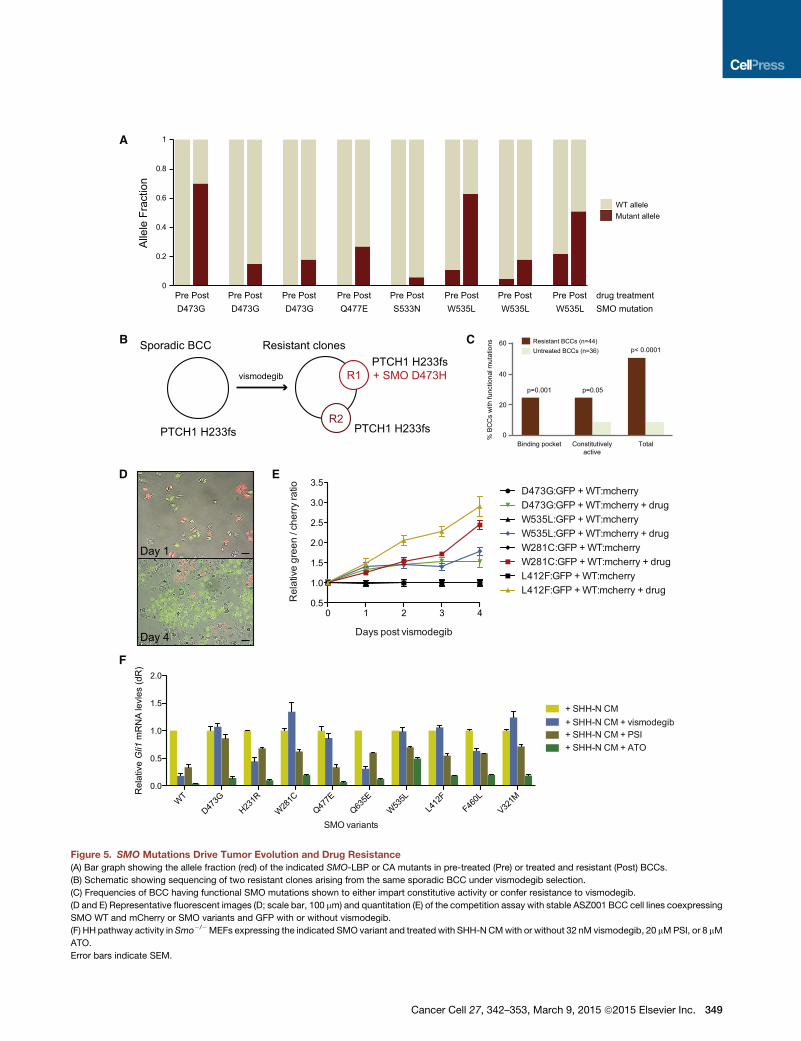
SMO Mutations Confer Both Intrinsic and AcquiredResistance to VismodegibTo better understand tumor evolution, we identified 12 resistant
BCCs in which we had obtained paired pre-treatment biopsies
and interrogated these samples for the presence of SMO muta-
tions. Eight of the post-treatment samples had functionally
proven resistant SMO mutations (Figure 5A). Four of the resis-
tant BCCs harbored either D473G or Q477E LBP mutations
that were undetectable in the matched pre-treatment tumors.
In fact, we were unable to detect any functionally validated
(D) Bar graph showing recurrent, LBP, and COSMIC database SMO mutations in
(E) Schematic showingSMOmutations in resistant BCCs comparedwith untreated
represents a unique sample with patient number and other relevant information lis
acid located in the SMO-LBP; blue, amutation also reported as somatically mutat
LBP nor the COSMIC database.
LBP mutations in untreated BCCs (Figure 2E), suggesting that
tumor cells expressing this class of mutant are selected during
therapy. Interestingly, one patient developed two spatially
distinct resistant clones during treatment with vismodegib.
Both clones arose from a single sporadic BCC that harbored
the original PTCH1 H233fs driver mutation. One clone acquired
a D473H LBP mutation, whereas the second clone had no
detectable SMO mutation, illustrating the heterogeneity of tu-
mor evolution and acquired drug resistance (Figure 5B). In
contrast, three pretreatment BCCs harbored subclones of the
W535L allele that was then enriched in the post-treatment-
resistant BCCs (Figure 5A). Additionally, another resistant
BCC acquired a S533N clone that is a putative SMO-CA variant
and has been shown to cause medulloblastoma in mice (Dey
et al., 2012). Because SMO-CA mutants are present in both un-
treated and resistant tumors in the larger BCC cohort (Fig-
ure 2E), this suggests that SMO-CA mutants may confer
resistant BCCs compared with untreated samples.
BCCs.SMOmutations are listed on the left side of each row, and each column
ted at the bottom. The mutations are color-coded. Red, a mutation in an amino
ed in cancer in the COSMIC database; green, a recurrent mutation neither in the
Cancer Cell 27, 342–353, March 9, 2015 ª2015 Elsevier Inc. 347

A
C
E F
D
B
Figure 4. Two Distinct Mechanisms of SMO-Mediated Resistance in BCCs
(A) Position of the SMO variants within the SMO crystal structure showing their arrangement relative to an inhibitor (Wang et al., 2013) in TM3 (V321), TM5 (F460),
TM6 (L412F), and TM7 (W535L).
(B) Side view (left) and top-down view (right) of the overlay of the pivot regions of the B2 adrenergic receptor (gray) with those of SMO (green). Black numbers
represent prolines in the B2 adrenergic receptor structure, around which the lower receptor pivots.
(C) Baseline HH pathway activity inSmo�/�MEFs under serum starvation conditions expressing SMOWT or indicated SMO-CA variants. Shown is aWestern blot
of the expression of SMO WT compared with SMO variants.
(D) HH pathway activity in Smo�/� MEFs expressing the indicated SMO treated with SHH-N CM with or without 100 nM vismodegib.
(E) Response of the indicated SMO with different concentrations of vismodegib. IC50 values are shown in brackets.
(F) Coexpression of SMO-CA variants and PTCH1 or GFP in a GLI-luciferase reporter assay.
Error bars indicate SEM.
intrinsic resistance prior to treatment and may represent a sig-
nificant population in untreated samples. The apparent low
allele fraction of the SMO-CA mutants prior to treatment may
point to robust heterogeneity of tumor clones within these large
advanced tumors that constantly compete and evolve, with
only the drug-resistant clones enriching upon drug treatment.
Taken together, our results show that 50% (22 of 44) of resis-
tant BCCs harbor SMO mutations that have been shown func-
tionally to confer vismodegib resistance either through disrup-
348 Cancer Cell 27, 342–353, March 9, 2015 ª2015 Elsevier Inc.
tion of ligand responsiveness or release of autoinhibition
(Figures 2E and 5C).
SMO Mutations Impart a Growth Advantage in thePresence of VismodegibOur data suggest that tumor clones that can maintain high HH
activation in the presence of a SMO antagonist gain a selective
growth advantage and become overrepresented within the
tumor. To quantify the selective advantage of identified SMO
A
B
D
F
0
0.2
0.4
0.6
0.8
1
WT allele
Alle
le F
ract
ion
Mutant allele
D473G D473G D473G Q477E S533N W535L W535L W535LPre Post drug treatmentPre Post Pre Post Pre Post Pre Post Pre Post Pre Post Pre Post
SMO mutation
vismodegib
PTCH1 H233fs PTCH1 H233fs
PTCH1 H233fs+ SMO D473HR1
R2
Sporadic BCC Resistant clones
0 1 2 3 40.5
1.0
1.5
2.0
2.5
3.0
3.5
Days post vismodegib
Rel
ativ
e gr
een
/ che
rry ra
tio
D473G:GFP + WT:mcherry + drugD473G:GFP + WT:mcherry
W535L:GFP + WT:mcherryW535L:GFP + WT:mcherry + drugW281C:GFP + WT:mcherryW281C:GFP + WT:mcherry + drugL412F:GFP + WT:mcherryL412F:GFP + WT:mcherry + drug
E
C Resistant BCCs (n=44)Untreated BCCs (n=36)
% B
CC
s w
ith fu
nctio
nal m
utat
ions
p=0.001 p=0.05
p< 0.0001
Binding pocket Constitutivelyactive
Total0
20
40
60
WT
D473G
H231R
W281C
Q477E
Q635E
W535L
L412
FF46
0L
V321M
0.0
0.5
1.0
1.5
2.0
SMO variants
Rel
ativ
e Gli1
mR
NA
levl
es (d
R)
+ SHH-N CM
+ SHH-N CM + PSI+ SHH-N CM + vismodegib
+ SHH-N CM + ATO
Day 1
Day 4
Figure 5. SMO Mutations Drive Tumor Evolution and Drug Resistance
(A) Bar graph showing the allele fraction (red) of the indicated SMO-LBP or CA mutants in pre-treated (Pre) or treated and resistant (Post) BCCs.
(B) Schematic showing sequencing of two resistant clones arising from the same sporadic BCC under vismodegib selection.
(C) Frequencies of BCC having functional SMO mutations shown to either impart constitutive activity or confer resistance to vismodegib.
(D and E) Representative fluorescent images (D; scale bar, 100 mm) and quantitation (E) of the competition assay with stable ASZ001 BCC cell lines coexpressing
SMO WT and mCherry or SMO variants and GFP with or without vismodegib.
(F) HH pathway activity in Smo�/�MEFs expressing the indicated SMO variant and treated with SHH-NCMwith or without 32 nM vismodegib, 20 mMPSI, or 8 mM
ATO.
Error bars indicate SEM.
Cancer Cell 27, 342–353, March 9, 2015 ª2015 Elsevier Inc. 349

mutations, we designed a red:green competition assay where
ASZ001 BCC cells expressing SMO WT were marked with
mCherry and those expressing SMO-LBP or SMO-CA mutants
were marked by GFP to determine which alleles confer a growth
advantage and outcompete the other in the presence of vismo-
degib. Interestingly, in the absence of selection, SMO-D473G,
W535L, L412F, and W281C grew at approximately the same
rate as wild-type SMO-containing cells, presumably because
of the high pathway activation already present because of
PTCH1 loss. However, in the presence of vismodegib, tumor
cells expressing any of the variants gained a significant growth
advantage and outcompeted SMO WT-containing tumor cells,
indicating that these SMOmutations can selectively grow during
SMO antagonist therapy to cause drug resistance (Figures 5D
and 5E).
HHAntagonists Downstreamof SMOAre Effective in thePresence of SMO VariantsA subset of SMO variants has slightly elevated IC50 concentra-
tions, suggesting that higher SMO inhibitor concentrations may
be therapeutically beneficial. However, many other variants do
not significantly respond to the drug, even at high inhibitor con-
centrations. This led us to explore whether previously identified
GLI antagonists that act downstream of SMO may be effective
in suppressing the HH pathway in the presence of SMO inhibi-
tor-resistant variants. We expressed SMO-LBP and SMO-CA
variants into Smo�/� MEFs and observed a loss of Gli1 mRNA
in the presence of SHH-N ligand and inhibitor concentrations
4-fold greater than their respective IC50. As expected, all variants
had partial or complete resistance to vismodegib (Figure 5F).
However, the aPKC-i/l/GLI inhibitor PSI (Atwood et al., 2013)
and the GLI2 antagonist arsenic trioxide (ATO) (Kim et al.,
2013) were both effective at suppressing HH pathway activation
in the presence of any SMO variant, suggesting that GLI antag-
onists may be useful against SMO inhibitor-resistant tumors.
DISCUSSION
The nature of acquired resistance in advanced BCCs has been
largely unexplored despite skin tumors representing an easily
accessible model system to study tumor evolution. We made
the surprising discovery that, despite the ability of other cancers
to feed on oncogenic signals originating frommultiple pathways,
BCCs rely exclusively on the HH pathway for growth. This unique
property of BCCs allowed us to use SMO inhibitor-resistant tu-
mors as a robust system to uncover how tumors evolve to
bypass SMO inhibition and maintain high levels of HH activity.
Our results indicate that 50% of resistant BCCs operate under
two distinct modes of resistance: disruption of ligand respon-
siveness and release of autoinhibition. In addition, HH antago-
nists downstream of SMO are effective at suppressing HH acti-
vation andmay present viable therapies to treat resistant tumors.
Despite the high mutational load in BCCs that makes it one of
the most mutated human cancers (Jayaraman et al., 2014), a
finding we confirmed in our study, the inherently low rate of resis-
tance to SMO antagonists is surprising. A likely reason may be
the limited repertoire of variants that could confer pathwaymain-
tenance in the presence of vismodegib. Although HH-dependent
medulloblastomas use multiple signaling pathways for growth
350 Cancer Cell 27, 342–353, March 9, 2015 ª2015 Elsevier Inc.
and differentiation (Metcalfe et al., 2013), we find that BCCs
have an absolute dependence on the HHpathway. This limitation
appears to reduce the chance that another mutation outside of
the HH pathway would cause drug resistance and may be the
reason why we observe a high proportion of SMO mutations in
resistant BCCs. Another reason may be that only one copy of
SMO is required to transduce the active signal. Low selective
pressure and the slow growth potential of BCCs may naturally
suppress any need to bypass SMO as the active signal trans-
ducer of the HH pathway.
Our data provide strong structural support that a conserved
autoinhibitory mechanism exists in SMO despite less than 10%
sequence identity at the amino acid level (Wang et al., 2013).
This structural conservation allowed us to predict which SMO
variants would confer resistance. We identified five SMO muta-
tions that mostly decorate the LBP and conferred resistance to
vismodegib in our assays. The functionally relevant mutations
were not found in untreated BCCs, presumably because they
did not confer additional HH activity in the presence of ligand
and, therefore, would have no selective pressure and appear
after drug treatment. Moreover, because CA mutants would
confer a growth advantage to BCCs in addition to resistance to
therapy, it is not surprising that we find these inherently resistant
variants in both untreated and resistant tumors. Consistent
with this idea, we found that non-advanced BCCs from Gorlin
syndrome patients that contain PTCH1 mutations lack SMO
mutations and respond to vismodegib (K. Y. Sarin, personal
communication).
In addition, SMO contains 7-TM a helices that act in concert to
transduce activity, with helices 3, 5, 6, and 7 having pivotal roles
in the activation of the receptor. W535L is a previously described
CA mutant found on helix 7 (Xie et al., 1998) and is believed to
interact with helices 5 and 6 to prevent activation. We found CA
mutants on helix 3 (V321M), helix 5 (L412F), and helix 6 (F460L)
that complementW535L. The proximity within the SMO structure
of L412 and F460 suggests that they interact to reinforce autoin-
hibition through helix 5 and 6 interaction. Because V321 lies at the
interface between the LBP and the autoinhibitory loops, we
postulate that this residue may help LBP inhibition with helices
5 and 6. Our study defines key interface residues for SMO activa-
tion that may be hotspots for resistance alleles in other HH-
dependent cancers.
Because a subset of functionally validated SMO variants is
present in untreated BCCs, our data present an opportunity for
genetic prescreening to determine the optimal personal therapy
to evade drug resistance. All functionally validated SMO variants
operated on a spectrum of vismodegib sensitivity that point to
two important criteria for treatment options. Tumors harboring
mutations that partially suppress vismodegib sensitivity may
be treatable with higher drug concentrations to overcome their
elevated IC50. We found that HH target gene expression can
be effectively suppressed at higher drug concentrations but
not at low concentrations. Tumors harboring mutations that
show nearly complete vismodegib resistancemay be better can-
didates for drugs that inhibit HH activity outside of the SMO-LBP.
In fact, we found that HH antagonists such as PSI, which targets
the GLI kinase aPKC-i/l (Atwood et al., 2013), or ATO, which tar-
gets GLI2 (Kim et al., 2013), are quite effective at suppressing HH
activation associated with any SMO variant. Other inhibitors that

target at the level of GLI, such as the bromodomain and extrater-
minal domain family of chromatin modifiers or S6K1, that have
been shown to function in medulloblastoma or esophageal
adenocarcinoma, respectively, may also be useful in counteract-
ing resistance (Tang et al., 2014; Wang et al., 2012). Knowledge
of the genetic alterations present in resistant BCCs improves our
understanding of SMO structure and function, enables personal-
ized therapy based on pre-existing mutations, and helps with the
development and application of future treatments.
EXPERIMENTAL PROCEDURES
Case Samples
After Stanford Human Subjects panel approval, written informed consent was
obtained from patients 18 years or older with advanced BCCs for tumor
sequencing (protocol 18325). BCCs were defined as resistant or sensitive to
vismodegib therapy using the following criteria: resistant BCC, continuous
treatment with vismodegib at therapeutic doses of 150mg/day with stable dis-
ease or progressive disease as defined by the response evaluation criteria in
solid tumors (RECIST v. 1.1); sensitive BCC, partial or complete response to
vismodegib therapy at doses of 150 mg/day as defined by RECIST.
RNA Sequencing
RNA sequencing (RNA-Seq) was performed on nine resistant BCCs, four sen-
sitive BCCs, and eight normal skin biopsies. 2 mg of total RNA was extracted
from tissue samples stored in RNALater using the RNeasy kit (QIAGEN) ac-
cording to the manufacturer’s protocol. RNA integrity was confirmed with
the Agilent 2001 bioanalyzer. cDNA was prepared using the Ovation RNA-
Seq System V2 (NuGen) according to the manufacturer’s protocol. cDNA li-
braries were sheared by sonication (Covaris model S1) and purified using
the QIAGEN Minelute kit. End repair was performed with T4 DNA polymerase,
T4 polynucleotide kinase, and KlenowDNApolymerase (NewEngland Biolabs)
at 20�C for 30 min and purified using the QIAGEN Minelute kit. dA tailing was
performed with Klenow fragment 30 to 50 exonuclease (New England Biolabs)
at 37�C for 30 min and purified using the QIAGENMinelute kit. Adaptor ligation
was performed with Illumina adapters and T4 DNA ligase (New England Bio-
labs) and purified with the QIAGEN Minelute kit, and 150–400 base pair (bp)
fragments were gel-purified on a 3% GTG low melting point agarose gel.
RNA-Seq libraries were PCR-amplified for 18 cycles with Phusion DNA poly-
merase (New England Biolabs), purified with the QIAGEN Minelute kit, and
size-selected on a 3% GTG low melting point agarose gel. RNA-Seq libraries
were analyzed with the Agilent 2001 bioanalyzer and were sequenced paired-
end at 100 bp using an Illumina HiSeq 2500.
RNA-Seq reads were aligned to the human reference genome sequence
(hg19) with TopHat. We obtained an average of 250 million reads per sample
and 88% alignment to the human genome. Uniquely genomic and split-map-
ped reads were used to quantify the expression levels for GLI1. The NCBI
Reference Sequence (RefSeq) databases were used as reference annotations
to calculate values of reads per kilobase of transcript permillionmapped reads
for known transcripts (RPKM) (Mortazavi et al., 2008). RPKM values were then
log2-transformed, and box plot analysis was used to visualize the differential
expression of GLI1 among the normal skin, sensitive BCC, and resistant
BCC tissue samples. The general linear model (GLM) was used to assess sta-
tistical differences among the groups.
Whole-Exome Sequencing and Analysis
Fresh tissue samples of 14 resistant BCCs and adjacent normal skin were ob-
tained and stored in RNALater at�20�C (Ambion). DNA was isolated using the
DNeasy blood and tissue kit according to the manufacturer’s protocols
(QIAGEN). Capture libraries were constructed from 2 mg of DNA from BCC
and normal skin using the Agilent SureSelect XTHuman All Exon V4 kit accord-
ing to the manufacturer’s specifications. Enriched exome libraries were multi-
plexed and sequenced on the Illumina HiSeq 2500 platform to generate
100-base pair paired-end reads. Sequencing reads were aligned to the human
reference genome sequence (hg19) using Burrows-Wheeler aligner (BWA).
SAM-to-BAM conversion and marking of PCR duplicates were performed us-
ing Picard tools (version 1.86), followed by local realignment around indels and
base quality score recalibration using the Genome Analysis Toolkit (GATK)
(v2.3.9). We obtained mean target coverage of 114X over the coding regions.
Somatic SNVs and indels were called using both Samtools mpileup andGATK.
Variants were annotated for standard quality metrics for the presence in
dbSNP138 and for the presence in the National Heart, Lung, and Blood Insti-
tute (NHLBI) Exome Sequencing Project (ESP) (ESP6500, Exome Variant
Server, http://evs.gs.washington.edu/EVS/) and COSMIC database v. 64. Var-
iants were filtered when they did not result in a predicted change to the protein
coding sequence. Genetic alterations were selected when they occurred in
genes listed in the human HH signaling pathway in the KEGG database. To
determine copy number variation for PTCH1 and TP53, read counts were
calculated for each exon and scaled to 10 million. Log2 (tumor/normal) was
calculated, and the average log2 (tumor/normal) was calculated for each tu-
mor. A copy number gain or loss was called when the average log2 (tumor/
normal) for a given gene was less than or more than 0.35.
Targeted Resequencing of SMO and PTCH1 in FFPE Samples
Five to eight 10-mm sections were obtained from the formalin-fixed, paraffin-
embedded (FFPE) tumor block, and DNA was isolated using the QIAGEN
DNeasy blood and tissue kit according to manufacturer’s protocol (QIAGEN).
The exonic regions of PTCH1 and SMOwere amplified using the Access Array
platform (Fluidigm). The samples were amplified in a multiplex format with
genomic DNA (100 ng) according to the manufacturer’s recommendation
(Ambry Genetics). Subsequently, the multiplexed library pools were subjected
to deep sequencing using the Illumina MiSeq platform. After demultiplexing
and FASTQ file generation for the raw data, 150 base pair reads were aligned
to the human reference genome sequence (hg19) using the BWA aligner. Sam-
tools mpileup was used to call variants. Only basesmeeting theminimum base
quality score of 20 from reads meeting the minimum mapping quality score of
20 were considered. A minimum allele frequency of 5% at a position with a
read depth of >100 was required to make calls. Identified variants were anno-
tated using SeattleSeq138 to exclude non-pathogenic variants reported in
dbSNP138 and to identify variants that had nonsynonymous consequences
or affected splice sites.
Hedgehog Signaling Assays
Variants were inserted into the full-length human SMO gene by standardmuta-
genesis and cloned into peGFP-C1 (Clontech). SMO variants were nucleo-
fected (Amaxa) into Smo null mouse embryonic fibroblasts and plated at
confluence in DMEM plus 10% FBS. To test for HH response, the serum
was removed after 48 hr, and SHH-N conditioned medium was added. Cells
were treated with or without varying concentrations of vismodegib (LC
Labs), PSI (Atwood et al., 2013), or ATO (Sigma) for 48 hr, and RNA was har-
vested using the RNeasy Minikit (QIAGEN). Quantitative RT-PCR was per-
formed using the Brilliant II SYBR Green qRT-PCR Master Mix kit (Agilent
Technologies) on a Mx3000P qPCR system (Agilent). The fold change in
mRNA expression of the HH target gene Gli1 was measured using DDCt anal-
ysis with Gapdh as an internal control gene. For luciferase assays, vectors ex-
pressing SMO variants and either PTCH1 or GFP were transfected (Fugene6,
Promega) into CH310T1/2 cells with pGL3B 6xGliCS (Atwood et al., 2013) and
serum-starved for 48 hr. Cells were lysed and luciferase expression was deter-
mined using the Dual-Luciferase Assay System (Promega) and a TD-20/20 lu-
minometer. For competition assays, lentiviral pCDHGFP or pCDHmCherry
(SBI) vector expressing SMO WT or SMO variants were used to generate sta-
ble lines in ASZ001 BCC cells using puromycin selection. Cells coexpressing
SMO WT and GFP were mixed with cells coexpressing a SMO variant and
mCherry and grown in the presence or absence of vismodegib for the specified
amount of time. Live fluorescent images (Zeiss Axio Observer with 103 objec-
tive) of four random fields per competition assay per biological replicate were
taken at each time point, and the number of green and red cells was counted to
generate green-to-cherry ratios.
Statistical Analysis
The p values for the comparison of the log2 RPKM for GLI1 among the normal
skin, resistant, and sensitive BCCs were calculated using the GLM test.
The p values for the percentage of samples with SMOmutations in resistant
BCCs compared with the untreated BCCs were calculated using a Z test
Cancer Cell 27, 342–353, March 9, 2015 ª2015 Elsevier Inc. 351

for two population portions. p Values were calculated using two-tailed
comparisons.
Immunofluorescence Staining
Immunofluorescence staining was carried out using antibodies against GLI1
(1:100; R&D Systems, catalog no. AF3455) and keratin 14 (1:500; Abcam, cat-
alog no. ab7800). Secondary antibodies were from Invitrogen. GLI1 staining
was quantified using pixel intensity measurements in ImageJ. Pixel intensity
was measured in K14-positive regions in ten fields for both sensitive and resis-
tant BCCs. Adjacent tumor sections were stained with H&E.
ACCESSION NUMBERS
The data discussed in this publication have been deposited in the NCBI GEO
and are accessible through GEO series accession number GSE58377.
AUTHOR CONTRIBUTIONS
S.X.A., K.Y.S., A.E.O., and J.Y.T. designed the experiments and wrote the
manuscript. S.X.A. and K.Y.S. performed the majority of the experiments.
S.X.A., K.Y.S., and J.R.L. performed and analyzed sequencing. K.Y.S.,
A.L.S.C., J.Y.T., M.R., M.S.A., and J.K. collected and annotated clinical sam-
ples. K.Y.S. and A.E.O. worked on structure modeling. R.J.W. performed
immunofluorescence staining and helped with competition experiments.
G.K. and M.R. helped with tumor DNA isolation. C.Y. helped with functional
experiments.
ACKNOWLEDGMENTS
Wewish to thankmembers of the A.E.O. lab for guidance and F. deSauvage for
sharing data prior to publication. The work was funded by the V Foundation
Translational Award, by NIAMS (5ARO54780 and 2AR046786), by NIH
Pathway to Independence Award 1K99CA176847 (to S.X.A.), by a Damon
Runyon clinical investigator award (to J.T.), by an American Skin Association
clinical scholar award (to A.C.), by a Stanford Cancer Institute grant, and by
a Dermatology Foundation career development award (to K.S.).
A.O. and A.C. are investigators in Genentech, Novartis, and Eli Lilly clinical
trials. J.T. is a consultant for Genentech.
Received: May 20, 2014
Revised: November 11, 2014
Accepted: February 4, 2015
Published: March 9, 2015
REFERENCES
Amakye, D., Jagani, Z., and Dorsch, M. (2013). Unraveling the therapeutic po-
tential of the Hedgehog pathway in cancer. Nat. Med. 19, 1410–1422.
Atwood, S.X., Chang, A.L., and Oro, A.E. (2012). Hedgehog pathway inhibition
and the race against tumor evolution. J. Cell Biol. 199, 193–197.
Atwood, S.X., Li, M., Lee, A., Tang, J.Y., and Oro, A.E. (2013). GLI activation by
atypical protein kinase C i/l regulates the growth of basal cell carcinomas.
Nature 494, 484–488.
Axelson,M., Liu, K., Jiang, X., He, K.,Wang, J., Zhao, H., Kufrin, D., Palmby, T.,
Dong, Z., Russell, A.M., et al. (2013). U.S. Food and Drug Administration
approval: vismodegib for recurrent, locally advanced, or metastatic basal
cell carcinoma. Clin. Cancer Res. 19, 2289–2293.
Ayers, K.L., and Therond, P.P. (2010). Evaluating Smoothened as a G-protein-
coupled receptor for Hedgehog signalling. Trends Cell Biol. 20, 287–298.
Buonamici, S.,Williams, J., Morrissey, M.,Wang, A., Guo, R., Vattay, A., Hsiao,
K., Yuan, J., Green, J., Ospina, B., et al. (2010). Interfering with resistance to
smoothened antagonists by inhibition of the PI3K pathway in medulloblas-
toma. Sci. Transl. Med. 2, 51ra70.
Chang, A.L., and Oro, A.E. (2012). Initial assessment of tumor regrowth after
vismodegib in advanced Basal cell carcinoma. Arch. Dermatol. 148, 1324–
1325.
352 Cancer Cell 27, 342–353, March 9, 2015 ª2015 Elsevier Inc.
Dey, J., Ditzler, S., Knoblaugh, S.E., Hatton, B.A., Schelter, J.M., Cleary, M.A.,
Mecham, B., Rorke-Adams, L.B., and Olson, J.M. (2012). A distinct
Smoothened mutation causes severe cerebellar developmental defects and
medulloblastoma in a novel transgenic mouse model. Mol. Cell. Biol. 32,
4104–4115.
Dijkgraaf, G.J., Alicke, B., Weinmann, L., Januario, T., West, K., Modrusan, Z.,
Burdick, D., Goldsmith, R., Robarge, K., Sutherlin, D., et al. (2011). Small mole-
cule inhibition of GDC-0449 refractory smoothened mutants and downstream
mechanisms of drug resistance. Cancer Res. 71, 435–444.
Forbes, S.A., Bindal, N., Bamford, S., Cole, C., Kok, C.Y., Beare, D., Jia, M.,
Shepherd, R., Leung, K., Menzies, A., et al. (2011). COSMIC: mining complete
cancer genomes in the Catalogue of Somatic Mutations in Cancer. Nucleic
Acids Res. 39, D945–D950.
Gajjar, A., Stewart, C.F., Ellison, D.W., Kaste, S., Kun, L.E., Packer, R.J.,
Goldman, S., Chintagumpala, M., Wallace, D., Takebe, N., et al. (2013).
Phase I study of vismodegib in children with recurrent or refractory medullo-
blastoma: a pediatric brain tumor consortium study. Clin. Cancer Res. 19,
6305–6312.
Huang da, W., Sherman, B.T., Zheng, X., Yang, J., Imamichi, T., Stephens, R.,
and Lempicki, R.A. (2009). Extracting biological meaning from large gene lists
with DAVID. Curr. Protoc. Bioinformatics Chapter 13. Unit 13.11.
Jayaraman, S.S., Rayhan, D.J., Hazany, S., and Kolodney, M.S. (2014).
Mutational landscape of basal cell carcinomas by whole-exome sequencing.
J. Invest. Dermatol. 134, 213–220.
Katritch, V., Cherezov, V., and Stevens, R.C. (2013). Structure-function of the
G protein-coupled receptor superfamily. Annu. Rev. Pharmacol. Toxicol. 53,
531–556.
Kim, J., Aftab, B.T., Tang, J.Y., Kim, D., Lee, A.H., Rezaee, M., Kim, J., Chen,
B., King, E.M., Borodovsky, A., et al. (2013). Itraconazole and arsenic trioxide
inhibit Hedgehog pathway activation and tumor growth associated with ac-
quired resistance to smoothened antagonists. Cancer Cell 23, 23–34.
Kool, M., Jones, D.T., Jager, N., Northcott, P.A., Pugh, T.J., Hovestadt, V.,
Piro, R.M., Esparza, L.A., Markant, S.L., Remke, M., et al.; ICGC PedBrain
Tumor Project (2014). Genome sequencing of SHH medulloblastoma predicts
genotype-related response to smoothened inhibition. Cancer Cell 25,
393–405.
Metcalfe, C., Alicke, B., Crow, A., Lamoureux, M., Dijkgraaf, G.J., Peale, F.,
Gould, S.E., and de Sauvage, F.J. (2013). PTEN loss mitigates the response
of medulloblastoma to Hedgehog pathway inhibition. Cancer Res. 73, 7034–
7042.
Mortazavi, A., Williams, B.A., McCue, K., Schaeffer, L., and Wold, B. (2008).
Mapping and quantifying mammalian transcriptomes by RNA-Seq. Nat.
Methods 5, 621–628.
Reifenberger, J., Wolter, M., Knobbe, C.B., Kohler, B., Schonicke, A.,
Scharwachter, C., Kumar, K., Blaschke, B., Ruzicka, T., and Reifenberger,
G. (2005). Somatic mutations in the PTCH, SMOH, SUFUH and TP53 genes
in sporadic basal cell carcinomas. Br. J. Dermatol. 152, 43–51.
Riobo, N.A., Saucy, B., Dilizio, C., and Manning, D.R. (2006). Activation of het-
erotrimeric G proteins by Smoothened. Proc. Natl. Acad. Sci. USA 103, 12607–
12612.
Rogers, H.W., Weinstock, M.A., Harris, A.R., Hinckley, M.R., Feldman, S.R.,
Fleischer, A.B., and Coldiron, B.M. (2010). Incidence estimate of nonmela-
noma skin cancer in the United States, 2006. Arch. Dermatol. 146, 283–287.
Sekulic, A., Migden, M.R., Oro, A.E., Dirix, L., Lewis, K.D., Hainsworth, J.D.,
Solomon, J.A., Yoo, S., Arron, S.T., Friedlander, P.A., et al. (2012). Efficacy
and safety of vismodegib in advanced basal-cell carcinoma. N. Engl. J.
Med. 366, 2171–2179.
Tang, J.Y., Mackay-Wiggan, J.M., Aszterbaum, M., Yauch, R.L., Lindgren, J.,
Chang, K., Coppola, C., Chanana, A.M., Marji, J., Bickers, D.R., and Epstein,
E.H., Jr. (2012). Inhibiting the hedgehog pathway in patients with the basal-cell
nevus syndrome. N. Engl. J. Med. 366, 2180–2188.
Tang, Y., Gholamin, S., Schubert, S., Willardson, M.I., Lee, A.,
Bandopadhayay, P., Bergthold, G., Masoud, S., Nguyen, B., Vue, N., et al.

(2014). Epigenetic targeting of Hedgehog pathway transcriptional output
through BET bromodomain inhibition. Nat. Med. 20, 732–740.
Wang, Y., Ding, Q., Yen, C.-J., Xia, W., Izzo, J.G., Lang, J.-Y., Li, C.-W., Hsu,
J.L., Miller, S.A., Wang, X., et al. (2012). The crosstalk of mTOR/S6K1 and
Hedgehog pathways. Cancer Cell 21, 374–387.
Wang, C., Wu, H., Katritch, V., Han, G.W., Huang, X.P., Liu, W., Siu, F.Y., Roth,
B.L., Cherezov, V., and Stevens, R.C. (2013). Structure of the human smooth-
ened receptor bound to an antitumour agent. Nature 497, 338–343.
Xie, J., Murone, M., Luoh, S.M., Ryan, A., Gu, Q., Zhang, C., Bonifas,
J.M., Lam, C.W., Hynes, M., Goddard, A., et al. (1998). Activating
Smoothened mutations in sporadic basal-cell carcinoma. Nature 391,
90–92.
Yauch, R.L., Dijkgraaf, G.J., Alicke, B., Januario, T., Ahn, C.P., Holcomb, T.,
Pujara, K., Stinson, J., Callahan, C.A., Tang, T., et al. (2009). Smoothened mu-
tation confers resistance to a Hedgehog pathway inhibitor in medulloblas-
toma. Science 326, 572–574.
Cancer Cell 27, 342–353, March 9, 2015 ª2015 Elsevier Inc. 353
Recommended