a Corresponding author: [email protected]
Simulation of water movement and its distribution in a soil column under a water source using pore - scale network modelling
Saeed Samadianfard1,a
, Amir Hossein Nazemi1 and Ali Ashraf Sadraddini
1
1 Water Engineering Department, Faculty of Agriculture, University of Tabriz, Tabriz, Iran
Abstract. The relationship between capillary pressure and saturation has a remarkable value in investigating
interactions of two immiscible fluids in porous media. Pore network models, as predictors of fluids movement in
porous media, can play undeniable role in determining the mentioned relationship. In the current study, the results of
numerical pore network modelling, which represents pore structure of a real porous medium with networks of pore
bodies connected with pore throats, are used for computing the macroscopic relationship between capillary pressure
and saturation. A notable volume of soil is influenced by water source and according to the results of previous
studies, it seems practically impossible to simulate water movement in macro scale dimensions by use of pore scale
models. Meanwhile a suitable solution was found in this study, by considering a thin vertical soil column under the
water source which was divided to smaller volumes as cells, by horizontal crossings. Each cell was considered as a
pore network unit, so the soil column was consisted of series of pore network units which were vertically jointed to
each other. The moisture distribution and also wetting front movement in the column were determined by application
of pore network model, using the dynamic update saturation solution method. The solution was conducted between
each pair of consequent cells in an alternative manner within a time step since arrival time of the water from an upper
cell to the lower one. Moreover, for evaluation of the model ability, soil moisture profiles in a sandy soil of an
experimental tank under the water source were studied. Comparison of the simulation and observation data confirmed
the high ability of the column pore network model in prediction of the moisture distribution and wetting front
movement in a soil column.
1 Introduction
The vadose zone of soil is a fundamental segment of
the hydrological cycle, straightforwardly influencing
infiltration, storm runoff, evapotranspiration and aquifer
recharge. Understanding the way of water movement in
the vadose zone and the measurement of its physical
characteristics are the key factors to solving a variety of
engineering issues. Examples of such issues are:
forecasting runoff from given precipitation events for
erosion control; sediment transport and flood control;
estimation of the water accessibility for plant growth and
the amount of water recharge to the aquifer. Therefore,
the investigation of soil-water movement has intrigued
researchers from different disciplines, e.g. soil science,
hydrology, agriculture and environmental sciences for
years.
In recent decades, different methods have been
presented for prediction of water movement in soils
which can be classified in three groups including a)
numerical and analytical methods, b) empirical models
and c) pore scale models.
Numerical and analytical methods are typically based
on Richards' equation. Numerical modeling of Brandt et
al. [1] and Taghavi et al. [2] can be categorized in this
group. In numerical methods, hydraulic characteristics of
soil e.g. residual soil water content, saturated soil water
content, saturated hydraulic conductivity, etc have to be
measured experimentally before starting the iterative
numerical procedure. In other words, performing time
consuming experiments are prerequisite of numerical
methods.
Another group of methods are empirical models,
which have been applied by a lot of researchers using
experimental data in specific soil types. Empirical models
are derived from data observed either in field or in
laboratory. The models of Ben-Asher [3], Schwartzman
and Zur [4] and Amin and Ekhmaj [5] etc. fall in the
category of empirical models.
The third group consists of network models like pore
network models. In order to properly represent the soil,
they need to have the same void ratio and grain size
distribution as the soil. Therefore, macro scale
constitutive parameters and coefficients can be obtained
by pore network models using basic soil properties. In the
mentioned pore network models, soil moisture profile can
be simulated by defining the pore distributions of
specified soil type. Pore network models have been used
for studying solute transport in porous media and
petroleum engineering. The movements of fluids such as
DOI: 10.1051/, 9
E 2016-
E3S Web of Conferences e3sconf/20160916001UNSAT
16001 (2016)
© The Authors, published by EDP Sciences. This is an open access article distributed under the terms of the Creative Commons Attribution License 4.0 (http://creativecommons.org/licenses/by/4.0/).

oil, water and gas in porous media have been the most
interesting issues for researchers. Also, pore network
models have been used for investigation of single and
multi-phase flow processes [6,7], investigation of
relationship between capillary pressure, saturation and
interfacial area [8-11] and drainage and imbibition [12].
So, applying pore network models for investigating
infiltration phenomenon from water source improved the
insight to the water movement in pore structure of soil.
In spite of increasing use of new and innovative pore
scale models such as pore network models, lattice
boltzmann models and smoothed particle hydrodynamic
approach in simulating fluid flows in porous media, these
models are still less known in water and soil sciences.
Although pore network models have innovative
characteristics and researchers have used them for
investigation of fluid flow in porous media, these models
have been applied on pore scale and till now they have
not been used for simulation of soil moisture profile in
macro scale directly.
A pore network model for representing a porous
medium such as soil usually has a volume of few cubic
centimeters or less. The network with these dimensions
has dozens of pore bodies and pore throats and solving
fluid flow governing hydraulic equations in this pore
network model demands few days to be fulfilled by new
modern computers. So, practically it seems impossible to
simulate fluid flow in soil in macro scale using one single
pore network model. In the current research, a notable
idea is presented for joining a series of pore networks to
each other, and for this purpose as a case study, the
vertical movement of water in a sandy soil under a water
source is investigated.
2 Materials and Methods
2.1 Pore Network Model
2.1.1 Network topology
Pore network models can be classified in two groups:
structured and unstructured. Up to now, most pore
network models had a two-dimensional or three-
dimensional lattice with uniform dividing. In such a
network, pore bodies are placed at the lattice nodes,
which are all similarly divided, and pore throats are lined
up along the grid coordinates. The quantity of pore
throats associated with a pore body is called coordination
number.
2.1.2 Network geometry
Network geometry is identified with the geometrical
state of pore bodies and cross sections of pore throats.
Most researchers used pore bodies of cubic or spherical
shapes; Joekar-Niasar and Hassanizadeh [13] introduced
the pore bodies as truncated octahedrons and Ryazanov et
al. [14] utilized n-cornered star-shaped pores in their
researches.
2.1.3 Computational algorithms
Continuum-scale formulations of two-phase flow in
porous media are typically solved for the pressure and
saturation of wetting or nonwetting phases. Therefore, the
accompanying system of equations for an inflexible
porous medium and incompressible immiscible
nonreactive fluids ought to be solved:
wn,α,.t
Sφ α
α
V (1)
wn,α,Pkμ
1 αα
α
α KV (2)
1SS nw (3)
wwnc SfPPP (4)
where, superscripts n and w denote nonwetting and
wetting phases, respectively, φ is the porosity, μ is the
viscosity of phase α, S is saturation of phase α, u is the
velocity of phase α, K is the intrinsic permeability tensor,
k is the relative permeability of phase α, P is the pressure
of phase α and Pc is the capillary pressure.
In this study, we have used a pore network model
which has been proposed by Joekar-Niasar et al. [11].
The pore network model has a three-dimensional regular
lattice structure with constant coordination number of six.
Pore bodies have cubic shape and pore throats have
square cross sections. Figure 1 shows a schematic
presentation of two pore bodies which are connected with
a pore throat.
Figure 1. Schematic presentation of two pore bodies and the
connected pore throats.
2.2 Numerical solution of Richards' equation using finite difference scheme
The Richards' equation is the most general method to
compute soil moistures and hydrological fluxes, such as
infiltration in porous media [15]. Consider two-and/or
three-dimensional isothermal uniform Darcian flow of
water in a variably saturated rigid porous medium and
assume that the air phase plays an insignificant role in the
liquid flow process. The governing flow equation for
these conditions is given by the following modified form
of the Richards' equation [16]:
ht,z,r,Sz
K
z
hhK
zr
hhrK
rr
1
t
hC
(5)
DOI: 10.1051/, 9
E 2016-
E3S Web of Conferences e3sconf/20160916001UNSAT
16001 (2016)
2
where C is the specific capacity of water, h is the pressure
head, r, z are radial and vertical directions, t is time, S is
sink term and K denotes the unsaturated hydraulic
conductivity function.
The general form of Richards' equation after
discretization, linearization and simplification can be
expressed as [17]:
n
ji,
n
1ji,
n
1ji,
21n
j1,i
21n
j1,i
21n
ji,
2
n
1ji,
n
ji,
n
21ji,
n
ji,
n
1ji,
n
21ji,
2
21n
j1,i
21n
ji,
21n
j,21i
21n
ji,
21n
j1,i
21n
j,21i
i
n
ji,
21n
ji,n
ji,
S2ΔΔ
KK
2ΔΔ
hh
iΔΔ
K
Δz
hhKhhK
Δr
hhKhhK
Δz
hhC
(6)
In Eq. 6, superscript n refers to the current time step
and superscript n+1/2 denotes the arithmetic mean of a
parameter at time steps n and n+1. Furthermore,
unsaturated hydraulic conductivity function (K) is
defined by:
2
mm
1
e
l
es S11SKK
(7)
where Ks is the saturated hydraulic conductivity, Se is the
effective saturation, m and l are shape parameters. For K,
we take the geometrical mean as proposed by Vauclin et
al. [18].
ji,j1,ij,21i KKK (8)
ji,j1,ij,21i KKK (9)
It should be noted that a third-type (Cauchy type)
boundary condition is used to prescribe the water flux
from water source in the soil surface and constant water
content has been used as initial condition in numerical
scheme [19].
2.3 Laboratory experiments
For evaluating the accuracy of the proposed model,
experiments of water infiltration under surface water
source were conducted on a sandy soil (90% sand, 5% silt
and 5% clay). Laboratory experiments were carried out
using a 120 cm × 120 cm × 120 cm transparent Plexiglas
box (as shown in Fig. 2). Air dried sand with a mean
particle size d50 = 0.4 mm was compacted at
predetermined dry bulk density of 1.5 g.cm-3
. A
polyethylene pipeline connected to water reservoir was
laid on the soil surface which had a 16 mm outside
diameter, a wall thickness of 2 mm and used for
supplying water on top surface of the soil column. During
operation, wetted soil dimensions were measured using
high performance photography and analyzed by
Digimizer Software. The observed soil moisture profile
had a high degree of the horizontal symmetry and the
flow in the centerline of this profile was considered as a
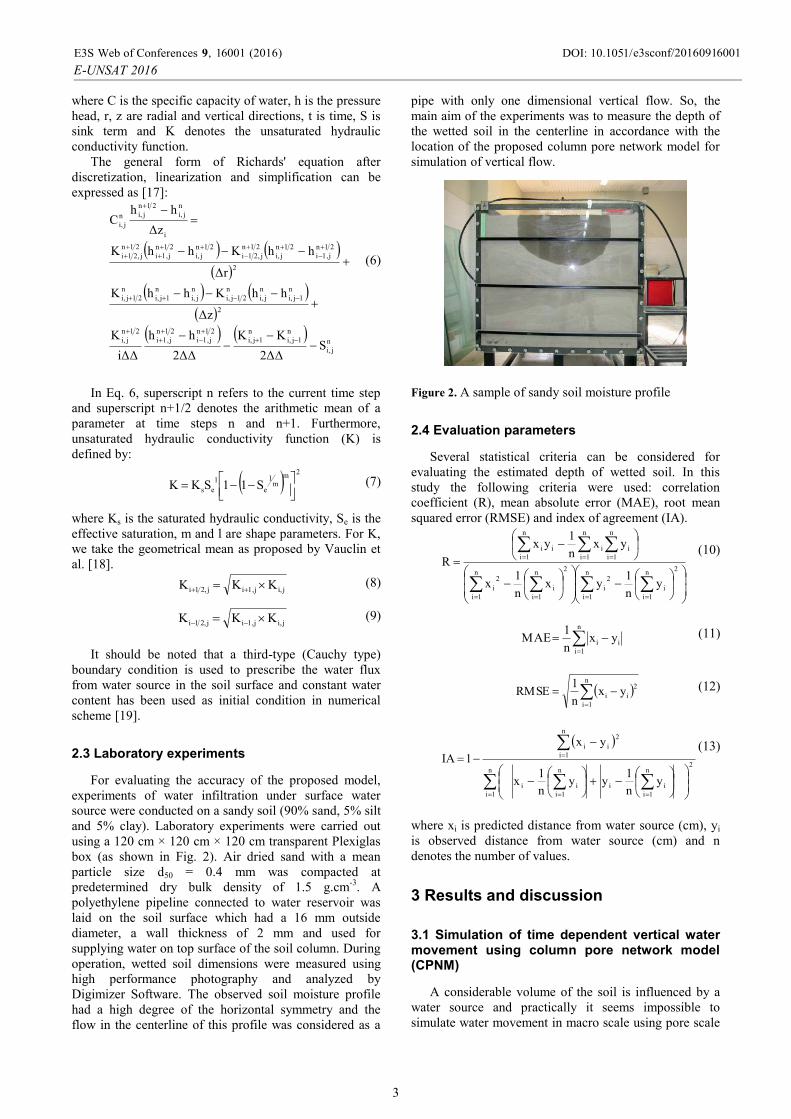
pipe with only one dimensional vertical flow. So, the
main aim of the experiments was to measure the depth of
the wetted soil in the centerline in accordance with the
location of the proposed column pore network model for
simulation of vertical flow.
Figure 2. A sample of sandy soil moisture profile
2.4 Evaluation parameters
Several statistical criteria can be considered for
evaluating the estimated depth of wetted soil. In this
study the following criteria were used: correlation
coefficient (R), mean absolute error (MAE), root mean
squared error (RMSE) and index of agreement (IA).
2n
1i
i
n
1i
2
i
2n
1i
i
n
1i
2
i
n
1i
i
n
1i
i
n
1i
ii
yn
1yx
n
1x
yxn
1yx
R (10)
n
1i
ii yxn
1MAE (11)
n
1i
2
ii yxn
1RMSE (12)
n
1i
2n
1i
ii
n
1i
ii
n
1i
2
ii
yn
1yy
n
1x
yx
1IA(13)
where xi is predicted distance from water source (cm), yi
is observed distance from water source (cm) and n
denotes the number of values.
3 Results and discussion
3.1 Simulation of time dependent vertical water movement using column pore network model (CPNM)
A considerable volume of the soil is influenced by a
water source and practically it seems impossible to
simulate water movement in macro scale using pore scale
DOI: 10.1051/, 9
E 2016-
E3S Web of Conferences e3sconf/20160916001UNSAT
16001 (2016)
3

models. So, a notable solution is proposed for simulating
vertical flow in the current research and it is based on
dividing a considered thin column in the center part of the
volume using cells to smaller volumes, in which pore
network model can be applied for each cell. In other
words, the volume of the mentioned soil column consists
of severed pore network models which connect to each
other in vertical direction. The upper surface of each pore
network model is considered as inflow boundary
condition and the lower surface as drainage boundary
condition.
In this research, the size distribution of pore bodies in
a porous medium is computed using grain distribution of
the experimental soil by considering a truncated log-
normal distribution. Then, these pore bodies are arranged
randomly in a porous medium. After that, the space
between the centers of two adjacent pore bodies in a
generated porous medium is considered twice the radial
size of the maximum pore body (see Fig. 1). This
established pore network size is selected in an iterative
manner, so that to be as a representative volume of the
studied soil. The selection procedure of this optimum-
sized pore network is defined in the following section of
the article. To facilitate the explanations in this
discussion, the optimum size of pore network is named
cell. For better imagination of the column pore network
model, the connections of three typical cells, in which
each cell has 4 pore bodies in each direction, are
illustrated in Fig. 3.
3.2 Simulation of time-dependent soil moisture’s vertical profile using pore network model coupled with numerical solution of Richards' equation (PNMRE)
It should be noted that the computation of PNMRE by
finite difference scheme were done by an algorithm
which has been developed in Wolfram Mathematica 10.0.
To attain an optimum pore network size, arrangement of
computations was carried out utilizing the same
algorithm. For this reason, 6 different networks having
12, 16, 20, 24, 28 and 32 pore bodies in each bearing
were considered. These simulations took 4 to 170 hours
long with a high speed processing computer.
It was resulted that the capillary pressure - saturation
curve changed with the network smaller than the network
size of 28×28×28 pore bodies and afterward these
changes were negligible for greater networks.
Subsequently, the resulted curve from the selected
network with 32 pore bodies in each direction was
utilized for simulation of soil moisture profile in macro
scale. In other words, the resulted pressure-saturation
curve was used in solving the Richards' equation by
finite difference scheme. The mentioned procedure
started with initial pressures of all nodes of the network
and the next pressures were computed by equation 6.
Then, the correspondent saturations of all nodes were
computed by the pressure-saturation curve resulted from
pore network modeling. This procedure was continued
until two pressure values of all nodes were less than a
constant prescribed value.
Figure 3. Connection of three typical cells in a vertical
column, in which each cell has four pore bodies in each
direction
Finally, by using the prepared algorithms, simulations
of the pore network models were done numerically in two
different scenarios including CPNM and PNMRE. In the
CPNM, the simulations using developed algorithms took
15-20 days on the high speed processing computer.
Consequently, distances of the wetting front from soil
surface for different time durations from the beginning of
the experiment were computed, which are presented in
Fig. 4. Also, the corresponding statistical evaluations are
given in Table 1.
Figure 4. Observed and predicted distances of wetting
front from soil surface for different time durations
DOI: 10.1051/, 9
E 2016-
E3S Web of Conferences e3sconf/20160916001UNSAT
16001 (2016)
4

Table 1. Statistical results of PNMRE and CPNM models in
experiments
Statistical criteria
Model
IA RMSE MAE R
0.989 2.863 2.428 0.999 PNMRE
0.997 1.362 0.939 0.998 CPNM
As it is clear from Fig. 4 and Table 1, the CPNM by
having less root mean squared error and higher index of
agreement in comparison with PNMRE has been
simulated the depth of soil moisture profile precisely.
Figure 5 shows the simulated water content
distributions using PNMRE and CPNM models in
different time durations from the beginning of the
experiment. Each figure contains comparisons of the
water contents simulated by the both mentioned methods
in the vertical direction under the water source.
Figure 5. simulated water content distributions using PNMRE and CPNM models for different time durations
It is clear from the plots in Fig. 5 that, in general, the
spatial distributions of the water content under the water
source for the both models are in excellent agreement.
But, since the curves have been plotted in the range of 70
cm in the distance and 0.3 in the water content, the
differences (approximately 0.02 in the water content and
DOI: 10.1051/, 9
E 2016-
E3S Web of Conferences e3sconf/20160916001UNSAT
16001 (2016)
5

few centimeters in the distance) between two simulated
curves are not clearly visible. However, according to
table 1, the CPNM gives precise predictions in
comparison with the PNMRE.
4 Conclusion
In the current study, capability of the pore network
model in simulating time-dependent moisture vertical
movement under the water source has been investigated
in two separate parts including the pore network model
coupled with numerical solving of Richards' equation and
column pore network model. For achieving the optimum
size of pore network model, series of computations have
been done using the developed algorithms and by
considering grain size distribution of the experimental
soil. As a result, the network with 32 pore bodies in each
direction has been selected as the optimum network for
simulation of soil moisture profile in macro scale. In
column pore network modeling, the simulations using the
developed algorithms took 15-20 days on the high speed
processing computer. The results proved that the CPNM
in comparison with PNMRE had been simulated the
depth of soil moisture profile with higher precision. As a
conclusion, it can be stated that the connecting pore
network cells and generating column pore network have
increased the precision of pore network modeling and
proved the efficiency of the presented idea about
connecting the pore network models.
References
1. Brandt, A., Breslker, E., Diner, N., Ben-Asher, J.,
Heller, J. and Goldberg, D. 1971. Infiltration from a
trickle source: I. Mathematical models. Soil Science
Society of American Journal. 35: 683-689.
2. Taghavi, S.A., Marino Miguel, A. and Rolston, D.E.
1984. Infiltration from trickle-irrigation source. Journal
of Irrigation and Drainage Engineering-ASCE. 10: 331-
341.
3. Ben-Asher, J. 1986. Infiltration and water extraction
from trickle irrigation source: the effective hemisphere
model. Soil Science Society of American Journal. 50 (4):
882-887.
4. Schwartzman, M. and Zur, B. 1986. Emitter spacing
and geometry of wetted soil volume. Journal of Irrigation
and Drainage Engineering. 112(3): 242-253.
5. Amin, M.S.M., Ekhmaj, A.I.M. 2006. DIPAC-drip
irrigation water distribution pattern calculator. 7th
International micro irrigation congress. September 10–16,
Kuala Lumpur, Malaysia.
6. Rajaram, H., Ferrand, L.A. and Celia, M.A. 1997.
Prediction of relative permeabilities for unconsolidated
soils using pore-scale network models. Water Resources
Research. 33: 43-52.
7. Fischer, U. and Celia, M.A. 1999. Prediction of
relative and absolute permeabilities for gas and water
from soil water retention curves using a pore-scale
network model. Water Resources Research. 35: 1089-
1100.
8. Reeves, P.C. and Celia, M.A. 1996. A functional
relationship between capillary pressure, saturation, and
interfacial area as revealed by a pore-scale network
model. Water Resources Research. 32: 2345-2358.
9. Joekar-Niasar, V., Hassanizadeh, S.M., Pyrak-Nolte, L.
and Berentsen, C. 2009. Simulating drainage and
imbibition experiments in a high-porosity micro-model
using an unstructured pore-network model. Water
Resources Research. 45 (2): 1-15.
10. Joekar-Niasar, V., Prodanovic, M., Wildenschild, D.
and Hassanizadeh, S.M. 2010a. Network model
investigation of interfacial area, capillary pressure and
saturation relationships in granular porous media. Water
Resources Research. 46: 1-18.
11. Joekar-Niasar, V., Hassanizadeh, S.M. and Dahle,
H.K. 2010b. Non-equilibrium effects in capillarity and
interfacial area in two-phase flow: Dynamic pore-
network modeling. Journal of Fluid Mechanics. 665: 38-
71.
12. Hilfer, R. and Manwart, C. 2001. Permeability and
conductivity for reconstruction models of porous media.
Physical Review E. 64(021304): 1-4.
13. Joekar-Niasar, V. and Hassanizadeh, S.M. 2011.
Effect of fluids properties on non-equilibrium capillarity
effects: Dynamic pore-network modeling. International
Journal of Multiphase Flow. 37(2): 198-214.
14. Ryazanov, A.V., Van Dijke, M.I.J. and Sorbie, K.S.
2009. Two-phase pore-network modelling: existence of
oil layers during water invasion. Transport in Porous
Media. 80(1): 79-99.
15. Richards, L.A. 1931. Capillary conduction of liquids
in porous mediums. Physics. 1: 318-333.
16. Bear, J. 1988. Dynamics of Fluids in Porous Media,
Dover Publications, New York.
17. Besharat, S., Nazemi, A.H. and Sadraddini, A.A.
2010. Parametric modeling of root length density and
root water uptake in unsaturated soil. Turkish
Journal of Agriculture and Forestry. 34, 439-449.
18. Vauclin, M., Haverkamp, R. and Vauchaud, G. 1989.
Résolution de l'équation de l'infiltration de l'eau dans le
sol : approches analytiques et numériques. Presses
Universitaires de Grenoble, Grenoble, 183 pp.
19. Shan, Y. and Wang, Q. 2012. Simulation of salinity
distribution in the overlap zone with double-point-source
drip irrigation using HYDRUS-3D. Australian Journal of
Crop Science. 6(2), 238-247.
DOI: 10.1051/, 9
E 2016-
E3S Web of Conferences e3sconf/20160916001UNSAT
16001 (2016)
6
Recommended
![Fast Fluid Simulation Using Residual Distribution Schemesgamma.cs.unc.edu/FFRDS/ffrds_paper.pdf · Fast Fluid Simulation Using Residual Distribution ... [Computer Graphics]: Types](https://img.dokumen.tips/doc/110x75/5b5d28297f8b9ad21d8d935e/fast-fluid-simulation-using-residual-distribution-fast-fluid-simulation-using.jpg)