
System of Environmental-Economic Accounting
Session 3: Ecosystem service classification and links to ecosystem
functions and conditions
Mark Eigenraam – UNSD
Forum of Experts in SEEA Experimental Ecosystem Accounting United Nations Headquarters, New York
28-30 April 2015
System of Environmental-Economic Accounting
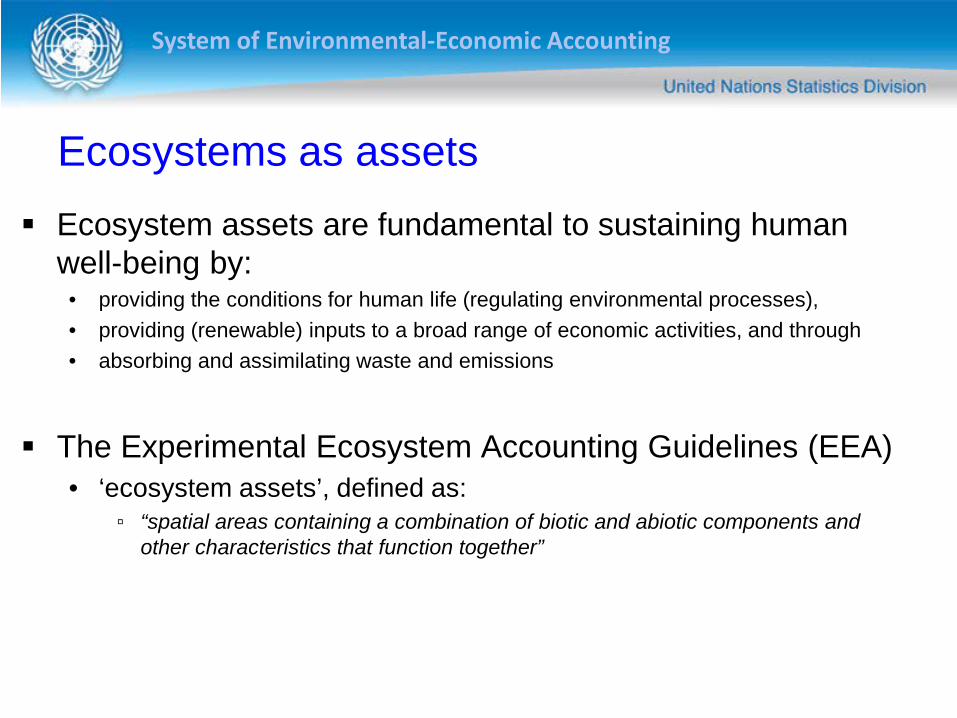
Ecosystems as assets Ecosystem assets are fundamental to sustaining human
well-being by: • providing the conditions for human life (regulating environmental processes), • providing (renewable) inputs to a broad range of economic activities, and through • absorbing and assimilating waste and emissions
The Experimental Ecosystem Accounting Guidelines (EEA)
• ‘ecosystem assets’, defined as: ▫ “spatial areas containing a combination of biotic and abiotic components and
other characteristics that function together”

System of Environmental-Economic Accounting
Objectives • Clarifying ecosystem services and linking them to
ecological units – ecosystem assets
• Defining ecosystem services in a coherent and consistent manner ▫ Boundary to measure ecosystem services with respect to the
SNA (production boundary)?
• Do we go beyond final ecosystem services? ▫ Supporting and intermediate?

System of Environmental-Economic Accounting
Linking methods and principles – looking for commonalities
How do we classify our assets and link them to services?
Can the asset classification methodology be extended and applied to condition assessments?
Can the asset classification and condition approaches then be extended to estimating services?
“Can this be done building on ecological science and methods to inform our choice of characteristics (SEEA)?” • What is the set of characteristics?

System of Environmental-Economic Accounting
Ecosystem Characteristics Ecosystem characteristics Ecosystem Components Ecosystem Functions
Biotic
Energetic Cycles – regulation
Biogeochemical Cycles– regulation
Evolution – Information, development, behavior,
integration, diversity
Producers
(1) Autotrophs: Plants (trees, shrubs, herbs, grasses)
Consumers
(2) Heterotrophs: e.g. animals
Decomposers
(3) Saprotrophs : e.g. fungi and bacteria
Abiotic
(4) Inorganic Substances (C, N, CO2, Water), air, water,
(5) Environment: substrate (bedrock)
Other linking compounds
(6) Organic Compounds – proteins, humic substances (soil), fossil fuels

System of Environmental-Economic Accounting
Is there a common thread?
Plant structure and composition • Area that has a common class of plant structure and
composition is a Functional Ecosystem Unit (FEU)
Autotrophs: Plants (trees, shrubs, herbs, grasses), that convert the energy [from photosynthesis (the transfer of sunlight, water, and carbon dioxide into energy), or other sources such as hydrothermal vents] into food.
Marine and aquatic? • Follow similar principles…….
▫ More work

System of Environmental-Economic Accounting
Plant structure and composition
• Classify assets by plant structure and composition ▫ Links very well with ecology
• Use plant structure and composition as a basis for condition measures ▫ Already commonly applied around the world (natural
systems) ▫ Agriculture and forestry* – link to soil condition (asset
account)
• Use plant structure and composition to parameterize ecosystem service models ▫ Process based biophysical and causal models

System of Environmental-Economic Accounting
Structure and composition example
Type Species Target Density
Overstorey Buloke (Allocasuarina luehmannii) 50 plants per ha
River Red-gum (Eucalyptus camaldulensis)
Yellow Gum (Eucalyptus leucoxylon)
Yellow Box (Eucalyptus melliodora)
Grey Box (Eucalyptus microcarpa)
Waxy Yellow-gum (Eucalyptus leucoxylon subsp. pruinosa)
Understorey Tree or Large Shrub > 5m tall
Lightwood (Acacia implexa) Present
Silver Needlewood (Hakea leucoptera subsp. leucoptera)
Sugarwood (Myoporum platycarpum subsp. platycarpum)
Medium Shrub 1-5m tall Gold-dust Wattle (Acacia acinacea s.l.) 200 plants per ha
Mallee Wattle (Acacia montana)

System of Environmental-Economic Accounting
Geography Building analytical capability for units and ensure that GIS
standards are maintained
Accounting FEU - Unified and
hierarchical classifications for BSUs

System of Environmental-Economic Accounting
CF – Land Cover – Extent account

System of Environmental-Economic Accounting
CF to EEA – FEU
Sum of Area (ha) AR_LU_SEEA_CFAR_LU_FEU 6 Tree-covered areas Grand Total2.2.0 Production forestry 9328 93283.1.3 Other forest production 6 6Box Ironbark Forest 2227 2227Creekline Grassy Woodland 658 658Drainage-line Woodland 690 690Floodplain Riparian Woodland 853 853Grassy Woodland/Riverine Grassy Woodland Mosaic 27 27Heathy Dry Forest 250 250Heathy Woodland 8 8Hillcrest Herb-rich Woodland 731 731Low Rises Woodland 2 2Metamorphic Slopes Shrubby Woodland 90 90Plains Savannah 69 69Plains Woodland 1394 1394Red Gum Swamp 47 47Riverine Chenopod Woodland 321 321Riverine Chenopod Woodland/Lignum Swamp Mosaic 121 121Riverine Chenopod Woodland/Plains Grassland Mosaic 1 1Semi-arid Woodland 7 7Grand Total 16830 16830
System of Environmental-Economic Accounting
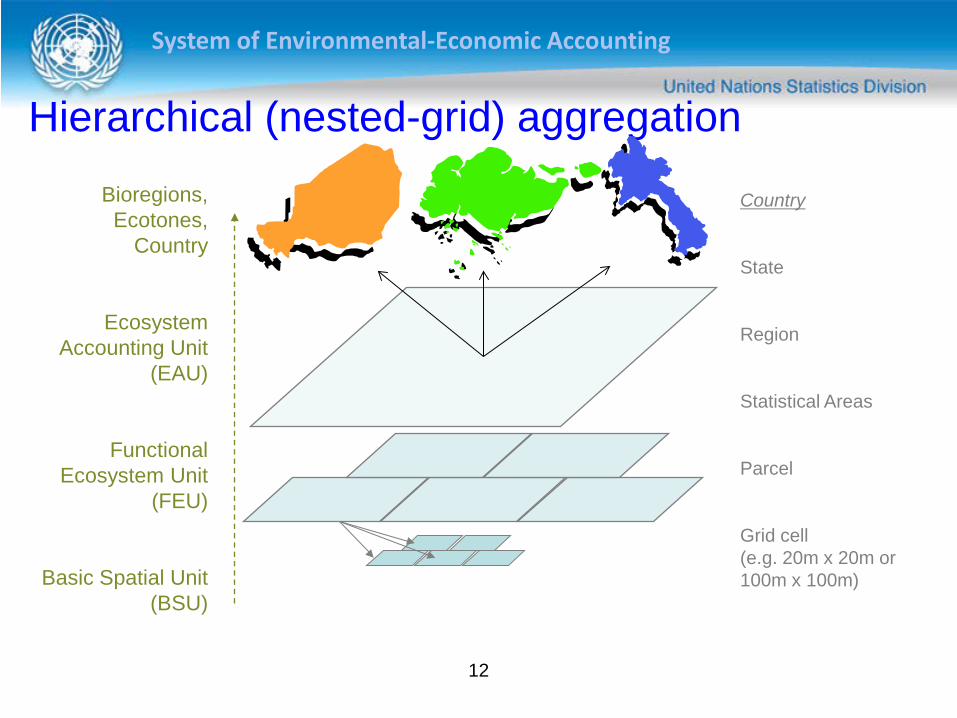
Hierarchical (nested-grid) aggregation
12
Bioregions, Ecotones,
Country
Ecosystem Accounting Unit
(EAU)
Functional Ecosystem Unit
(FEU)
Basic Spatial Unit (BSU)
Country
State
Region
Statistical Areas
Parcel
Grid cell (e.g. 20m x 20m or 100m x 100m)

System of Environmental-Economic Accounting
Continuum between land cover and FEU

System of Environmental-Economic Accounting
Modelling ecosystem services
Plant structure and composition • Key input to process based biophysical models
▫ Evaporation, transpiration, runoff, erosion, recharge, carbon and biomass accumulation, etc
• Benchmarking condition to infer (via causal and
associative models) ecosystem services ▫ To assess how an ecosystem compares to a benchmark of
expected structure and composition ▫ Canopy cover, litter, logs, density, diversity, age, recruitment ▫ Estimate – Habitat, species suitability, resilience, etc

System of Environmental-Economic Accounting
Water services (runoff, retention, filtration)
Wetland
Grazing
Crop
System of Environmental-Economic Accounting
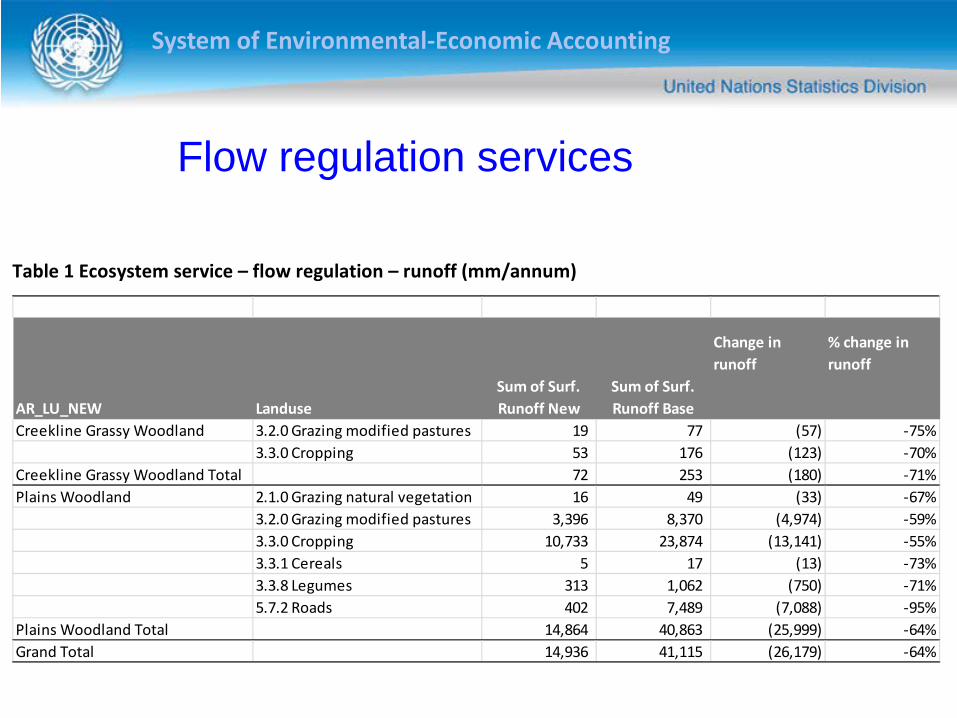
Flow regulation services
Table 1 Ecosystem service – flow regulation – runoff (mm/annum)
Change in runoff
% change in runoff
AR_LU_NEW LanduseSum of Surf. Runoff New
Sum of Surf. Runoff Base
Creekline Grassy Woodland 3.2.0 Grazing modified pastures 19 77 (57) -75%3.3.0 Cropping 53 176 (123) -70%
Creekline Grassy Woodland Total 72 253 (180) -71%Plains Woodland 2.1.0 Grazing natural vegetation 16 49 (33) -67%
3.2.0 Grazing modified pastures 3,396 8,370 (4,974) -59%3.3.0 Cropping 10,733 23,874 (13,141) -55%3.3.1 Cereals 5 17 (13) -73%3.3.8 Legumes 313 1,062 (750) -71%5.7.2 Roads 402 7,489 (7,088) -95%
Plains Woodland Total 14,864 40,863 (25,999) -64%Grand Total 14,936 41,115 (26,179) -64%

System of Environmental-Economic Accounting
Causal Links - Habitat change Calculator
http://www.dse.vic.gov.au/__data/assets/pdf_file/0008/97352/NativeVeg_Gain_Approach.pdf
STEP 10Current Habitat ScoreAttribute Max Default Assessed Comments
Large Trees 10Tree canopy cover 5Understorey 25Lack of weeds 15Recruitment 10
Organic litter 5Logs 5Landscape context 25
Standardised Habitat Sco 100

System of Environmental-Economic Accounting
Causal Links – River Health (Change)
River Health MetricInstream Current ConditionBank Condition Score (1-4)TemperatureInstream Large Wood Score (1-4)
Current Condition TerrestrialStanding Trees - TCC/5 (0-1) (0 if removing trees is not allowed)Fallen Timber - Logs/5 (0-1)Woody Weed Condition (0-1)Supplementary planting/revegetationExclude Stock(1 - grazing allowed, 0 - otherwise)

System of Environmental-Economic Accounting ES - Level 1
ES - Level 2
Intermediate or Final ES
Direct benefits
Indirect/Other Benefits Description Measure
Plant growth – biomass
Grass Final Animals - Input
Animals - Asset (Gross Fixed Capital)
Meat, dairy products (milk, cheese, yoghurt), honey etc. Dung, fat, oils, cadavers from land, water and marine animals for burning and energy production
Reared animals and their outputs
tonnes /ha
Total head
Plant growth – biomass
Wheat Final Wheat Fodder / animal food
Cultivated crops - Cereals (e.g. wheat, rye, barely), potatoes, vegetables, fruits etc.
tonnes /ha
Plant growth – biomass
Nuts, berries, fungi, etc
Final Wild berries, fruits, mushrooms, water cress, salicornia (saltwort or samphire); seaweed (e.g. Palmaria palmata = dulse, dillisk) for food
Wild plants, algae and their outputs
tonnes /ha
Intermediate Food source for animals outside of the FEU
Wild animals

System of Environmental-Economic Accounting
Conclusions / Observations
The FEU is based on ecological principles • Plant composition and structure • Commonly applied with long history • Variable country capability and application
CICES & FEGS • FEU is consistent with the principles of both • Builds on current asset in SEEA • Minor differences in boundary for classification of
services

System of Environmental-Economic Accounting
Conclusions / Observations
Aggregation • Local to global ecological units
▫ National bioregions…….
Data and feasibility • Science is available, Can be data intensive
▫ Start in areas of policy interest……..
• There are alternative methods for estimating structure and composition ▫ Maintain the fundamental principles

System of Environmental-Economic Accounting
Conclusions / Observations
Estimating ecosystem services • Links well with process based biophysical models
▫ Physical data – water, carbon, biomass, etc ▫ Local models – detailed plant structure ▫ Global models – land cover (proxy for plant structure)
• Causal models ▫ Less common – but many examples to build on ▫ Suitable for habitat linkages
Recommended


