Seismic Retrofitting of RC Building by Using Different Bracing Systems
S. I. Khan, Prof. P. O. Modani
1(Department of Civil Engineering, B.N.C.O.E, Pusad
2(Assist. Professor Department of Civil Engineering, B.N.C.O.E, Pusad
ABSTRACT
The Buildings, which appeared to be strong enough, may
crumble like houses of cards during earthquake and
deficiencies may be exposed. Experience gain from the
recent earthquake of Bhuj, 2001 demonstrates that the most
of buildings collapsed were found deficient to meet out the
requirements of the present day codes. In last decade, four
devastating earthquakes of world have been occurred in
India, and low to mild intensities earthquakes are shaking
our land frequently. It has raised the questions about the
adequacy of framed structures to resist strong motions,
since many buildings suffered great damage or collapsed.
Under such circumstances, seismic qualification of existing
buildings has become extremely important. Seismic
qualification eventually leads to retrofitting of the deficient
structures
A nonlinear static pushover analysis using the
displacement coefficient method, as described in FEMA 356
is carried out on an existing hostel building in Babasaheb
Naik College of Engineering, Pusad. Built in 1987, the
subject hostel building is a four-story, rectangular
structure.
1. INTRODUCTION
1.1 General
A large number of existing buildings in India are
severely deficient against earthquake forces and the number
of such buildings is growing very rapidly. This has been
highlighted in the past earthquake. Retrofitting of any
existing building is a complex task and requires skill,
retrofitting of RC buildings is particularly challenging due
to complex behavior of the RC composite material. The
behavior of the buildings during earthquake depends not
only on the size of the members and amount of
reinforcement, but to a great extent on the placing and
detailing of the reinforcement. There are three sources of
deficiencies in a building, which have to be accounted for
by the retrofitting engineer:
(i) Inadequate design and detailing
(ii) Degradation of material with time and use
(iii) Damage due to earthquake or other
catastrophe.
The three sources, suggest a retrofit scheme to
make up for the deficiencies and demonstrate that the
retrofitted structure will be able to safely resist the future
earthquake forces expected during the lifetime of the
structure. In particular, the seismic rehabilitation of older
concrete structures in high seismicity areas is a matter of
growing concern, since structures vulnerable to damage
must be identified and an acceptable level of safety must be
determined [1].
Thus, the structural engineering community has
developed a new generation of design and seismic
procedures that incorporate performance based structures
and is moving away from simplified linear elastic methods
and towards a more non-linear technique. Recent interests
in the development of performance based codes for the
design or rehabilitation of buildings in seismic active areas
show that an inelastic procedure commonly referred to as
the pushover analysis is a viable method to assess damage
vulnerability of buildings. Basically, a pushover analysis is
a series of incremental static analysis carried out to develop
a capacity curve for the building. Based on the capacity
curve, a target displacement which is an estimate of the
displacement that the design earthquake will produce on the
building is determined. The extent of damage experienced
by the structure at this target displacement is considered
representative of the damage experienced by the building
when subjected to design level ground shaking. Many
methods were presented to apply the nonlinear static
pushover (NSP) to structures. These methods can be listed
as:
2052
International Journal of Engineering Research & Technology (IJERT)
Vol. 2 Issue 7, July - 2013
IJERT
IJERT
ISSN: 2278-0181
www.ijert.orgIJERTV2IS70715

(1) Capacity Spectrum Method (CSM) (ATC)
(2) Displacement Coefficient Method (DCM)
(FEMA-356)
(3) Modal Pushover Analysis (MPA).
The approach has been developed by many
researchers with minor variation in computation procedure.
Since the behavior of reinforced concrete structures may be
highly inelastic under seismic loads, the global inelastic
performance of RC structures will be dominated by plastic
yielding effects and consequently the accuracy of the
pushover analysis will be influenced by the ability of the
analytical models to capture these effects. In general,
analytical models for the pushover analysis of frame
structures may be divided into two main types: (1)
distributed plasticity (plastic zone) and (2) concentrated
plasticity (plastic hinge). Although the plastic hinge
approach is simpler than the plastic zone, this method is
limited to its incapacity to capture the more complex
member behavior that involve severe yielding under the
combined actions of compression and bi-axial bending and
buckling effects [1].
1.2 Seismic Retrofitting.
All buildings those are constructed, before the
modern regulations came up for the design of buildings in
seismic areas, those which are constructed before thirty
years or those constructed recently but not properly
designed, constructed or maintained can be considered as a
possible candidates for retrofitting. These buildings may be
damaged by earthquake action. It is not always possible to
strengthen the existing buildings to the level corresponding
to modern seismic codes due to economic reasons. The
building should be retrofitted to achieve the required
performance level. Although engineering safety is the prime
criterion, other criteria such as social, cultural, financial,
historical, artistic, and political should also be considered
[13].
Existing building can become seismically deficient
when
a) Seismic design code requirements are up graded since
the design of these buildings is with an older version of the
code,
b) Seismic design codes used in their design are deficient,
c) Engineering knowledge makes advances rendering
insufficient the previous understanding used in their design,
and
d) Designers lack understanding of the seismic behavior of
the structures.
Indian buildings built over the past two
decades are deficient because of items (b), (c) and (d)
above. The last revision of the Indian seismic code in 1987
IS 1893 (1984) is deficient from many points of view, and
engineering knowledge has advanced significantly from
what was used. Also the seismic design was not practiced in
most buildings being built [2].
2. OBJECTIVES OF THE PROJECT
a) To analyse the response of existing RC building
subjected to seismic loading by pushover analysis
using SAP2000.
b) To suggest a retrofit scheme to existing RC
building as per seismic analysis.
c) To identify the suitable retrofitting technique for
resisting the seismic loads efficiently and
effectively.
d) To compare response of conventional rc building
and the building having energy dissipating devices
subjected to seismic loads.
3. MODELING AND ANALYSIS OF
BUILDING.
4.1 Modeling and Analysis of Building.
Fig. 4.1 Elevation of Building
2053
International Journal of Engineering Research & Technology (IJERT)
Vol. 2 Issue 7, July - 2013
IJERT
IJERT
ISSN: 2278-0181
www.ijert.orgIJERTV2IS70715

Fig 4.2 Plan of building
Fig 4.3 Elevation of X Braced Building
Fig 4.4 Elevation of Inverted V Braced Building
Fig 4.5 Elevation of Inclined Tensile Braced
Building
Fig 4.6 Elevation of Inclined Compression Braced
Building
4.2 Building Description
i) Zone V
ii) Zone factor 0.36
iii) Response reduction
factor 5
iv) Important factor 1
v) Soil condition Medium
vi) Height of building 12.50 m
vii) Wall thickness
External 230 mm
Internal 115 mm
2054
International Journal of Engineering Research & Technology (IJERT)
Vol. 2 Issue 7, July - 2013
IJERT
IJERT
ISSN: 2278-0181
www.ijert.orgIJERTV2IS70715

viii)
Weight density of
Brick
Masonry 20 kN/m3
ix) Weight density of RC
material 25 kN/m3
x) Thickness of slab 120 mm
xi) Floor to floor height 3.5 m
xii) Plinth height above
ground level 2.0 m
xiii) Size of columns 230 mm x 450 mm
xiv) Size of beams 230 mm x 400 mm
xv) Size of brace ISMC 250
xvi) Type of bracing system X- bracing
Inverted V bracing
Inclined bracing
xv) Grade of steel
Fe-415
xvi) Grade of concrete
M20
xvii) Floor finish
1.0 kN/m2
xviii) Imposed load
4.0 kN/m2
5. RESULTS AND DISCUSSION
5.1 General
In the present study, non-linear response of
existing RC frame building using SAP 2000 under the
loading has been carried out. The objective of this study is
to see the variation of load-displacement graph and check
the maximum base shear and displacement of the frame.
After running the analysis, the pushover curve is
obtained as shown in figures.
A table also obtain which gives the coordinates of each step
of the pushover curve and summarizes the number of
hinges in each state (for example, between IO, LS, CP or
between D and E). This data is shown in following table.
Fig. 5.1 Pushover Curve of an Existing Building in X
direction
Fig. 5.2 Capacity Spectrum Curve of an Existing
Building in X direction
0
1000
2000
3000
4000
5000
6000
7000
0 50 100 150 200 250
Ba
se F
orc
e (K
N)
Displacement (mm)
2055
International Journal of Engineering Research & Technology (IJERT)
Vol. 2 Issue 7, July - 2013
IJERT
IJERT
ISSN: 2278-0181
www.ijert.orgIJERTV2IS70715

Table 5.1 Tabular data for pushover curve in X direction
Steps Displaceme
nt (mm)
Base
Force
(KN)
A to B B to
IO
IO to
LS
LS to
CP
CP to
C
C to
D
D to
E
Beyond E Total
0 0 0 1164 0 0 0 0 0 0 0 1164
1 12 2897 1164 0 0 0 0 0 0 0 1164
2 22 4724 986 178 0 0 0 0 0 0 1164
3 26 5244 837 327 0 0 0 0 0 0 1164
4 35 5579 714 450 0 0 0 0 0 0 1164
5 97 6373 532 357 275 0 0 0 0 0 1164
6 104 6417 476 406 282 0 0 0 0 0 1164
7 189 6637 444 83 435 201 0 1 0 0 1164
8 189 6573 449 77 436 201 0 0 1 0 1164
9 189 6593 451 81 428 203 0 0 1 0 1164
10 189 6599 438 82 436 207 0 0 1 0 1164
11 189 6602 437 82 427 217 0 0 1 0 1164
12 192 6611 445 77 420 220 1 0 1 0 1164
13 192 6556 445 78 421 218 0 0 2 0 1164
14 192 6589 445 78 421 218 0 0 2 0 1164
15 192 6602 445 78 421 218 0 0 2 0 1164
16 200 6625 443 79 422 218 0 0 2 0 1164
17 200 6575 422 80 411 247 0 0 4 0 1164
After Pushover analysis hinges formation in each stage
of a building are calculated, also from fig.5.2 it is obvious
that the demand curve tend to intersect the capacity curve
near the event point, which means an elastic response and
the security margin is greatly enhanced. Therefore, it can be
concluded that the margin safety against collapse is high
and there are sufficient strength and displacement reserves.
To improve the seismic performance of existing
building, different bracing systems are proposed and the
analysis is carried out for existing building with different
combinations of bracing systems. The analysis results are
demonstrated with the help of figures and charts. Finally,
the comparative study is carried out based on different
parameters such as lateral displacement, base shear.
After running the analysis of building with
different bracing combinations, the pushover curve is
obtained as shown in figure 5.3 to 5.9. Tables also obtain
which gives the coordinates of each step of the pushover
curve.
5.2 Pushover Curve of Building With Different
Bracing System:
Fig. 5.3 Pushover Curve of X-Braced Building in X
direction
0
2000
4000
6000
8000
10000
0 10 20 30 40 50
Base
Forc
e (K
N)
Displacement (mm)
2056
International Journal of Engineering Research & Technology (IJERT)
Vol. 2 Issue 7, July - 2013
IJERT
IJERT
ISSN: 2278-0181
www.ijert.orgIJERTV2IS70715

Fig. 5.4 Pushover Curve of Inverted V-Braced Building
in X direction
Fig. 5.5 Pushover Curve of Inclined Compression
Braced Building in X direction
Fig. 5.6 Pushover Curve of Inclined Tensile Braced
Building in X direction
5.3 Capacity Spectrum Curve of Building With
Different Bracing Systems:
Fig. 5.7 Capacity Spectrum Curve of X-Braced
Building in X direction
Fig. 5.8 Capacity Spectrum Curve of Inverted
V-Braced Building in X direction
0
2000
4000
6000
8000
10000
0 10 20 30 40 50
Base
Forc
e (K
N)
Displacement (mm)
0
2000
4000
6000
8000
10000
0 10 20 30 40 50
Base
Forc
e (K
N)
Displacement (mm)
0
2000
4000
6000
8000
10000
0 10 20 30 40 50
Base
Forc
e (K
N)
Displacement (mm)
2057
International Journal of Engineering Research & Technology (IJERT)
Vol. 2 Issue 7, July - 2013
IJERT
IJERT
ISSN: 2278-0181
www.ijert.orgIJERTV2IS70715
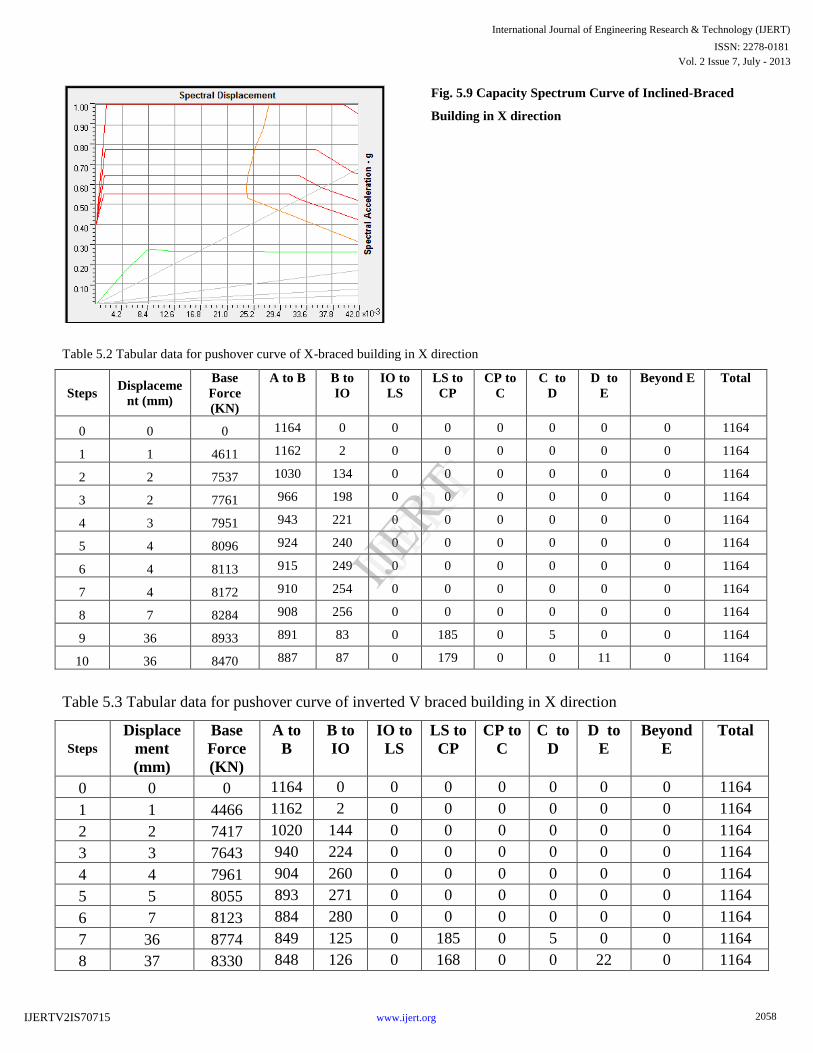
Fig. 5.9 Capacity Spectrum Curve of Inclined-Braced
Building in X direction
Table 5.2 Tabular data for pushover curve of X-braced building in X direction
Steps Displaceme
nt (mm)
Base
Force
(KN)
A to B B to
IO
IO to
LS
LS to
CP
CP to
C
C to
D
D to
E
Beyond E Total
0 0 0 1164 0 0 0 0 0 0 0 1164
1 1 4611 1162 2 0 0 0 0 0 0 1164
2 2 7537 1030 134 0 0 0 0 0 0 1164
3 2 7761 966 198 0 0 0 0 0 0 1164
4 3 7951 943 221 0 0 0 0 0 0 1164
5 4 8096 924 240 0 0 0 0 0 0 1164
6 4 8113 915 249 0 0 0 0 0 0 1164
7 4 8172 910 254 0 0 0 0 0 0 1164
8 7 8284 908 256 0 0 0 0 0 0 1164
9 36 8933 891 83 0 185 0 5 0 0 1164
10 36 8470 887 87 0 179 0 0 11 0 1164
Table 5.3 Tabular data for pushover curve of inverted V braced building in X direction
Steps Displace
ment
(mm)
Base
Force
(KN)
A to
B
B to
IO
IO to
LS
LS to
CP
CP to
C
C to
D
D to
E
Beyond
E
Total
0 0 0 1164 0 0 0 0 0 0 0 1164
1 1 4466 1162 2 0 0 0 0 0 0 1164
2 2 7417 1020 144 0 0 0 0 0 0 1164
3 3 7643 940 224 0 0 0 0 0 0 1164
4 4 7961 904 260 0 0 0 0 0 0 1164
5 5 8055 893 271 0 0 0 0 0 0 1164
6 7 8123 884 280 0 0 0 0 0 0 1164
7 36 8774 849 125 0 185 0 5 0 0 1164
8 37 8330 848 126 0 168 0 0 22 0 1164
2058
International Journal of Engineering Research & Technology (IJERT)
Vol. 2 Issue 7, July - 2013
IJERT
IJERT
ISSN: 2278-0181
www.ijert.orgIJERTV2IS70715

Table 5.4 Tabular data for pushover curve of inclined compression braced building in X direction.
Steps Displace
ment
(mm)
Base
Force
(KN)
A to
B
B to
IO
IO to
LS
LS to
CP
CP to
C
C to
D
D to
E
Beyond
E
Total
0 0 0 1164 0 0 0 0 0 0 0 1164
1 4 4347 1162 2 0 0 0 0 0 0 1164
2 8 7414 985 179 0 0 0 0 0 0 1164
3 9 7708 917 247 0 0 0 0 0 0 1164
4 11 8011 892 272 0 0 0 0 0 0 1164
5 11 8089 874 290 0 0 0 0 0 0 1164
6 13 8140 865 299 0 0 0 0 0 0 1164
7 43 8811 838 136 0 184 0 6 0 0 1164
8 42 8523 836 137 0 175 0 2 14 0 1164
Table 5.5 Tabular data for pushover curve of inclined tensile braced building in X direction.
Steps Displace
ment
(mm)
Base
Force
(KN)
A to
B
B to
IO
IO to
LS
LS to
CP
CP to
C
C to
D
D to
E
Beyond
E
Total
0 0 0 1164 0 0 0 0 0 0 0 1164
1 4 4547 1162 2 0 0 0 0 0 0 1164
2 6 7101 982 182 0 0 0 0 0 0 1164
3 7 7750 923 241 0 0 0 0 0 0 1164
4 8 8011 866 298 0 0 0 0 0 0 1164
5 9 8089 870 294 0 0 0 0 0 0 1164
6 11 8201 863 301 0 0 0 0 0 0 1164
7 41 8799 827 139 0 190 0 8 0 0 1164
8 40 8896 824 145 0 176 0 3 16 0 1164
After Pushover analysis of different braced
systems building, hinges formation in each stage of a
building are calculated, from table 5.1 it can been seen that
total number of yielding occurs in building without bracing
in X direction at event B, IO, LS, and E respectively is 742
while from table 5.3 to 5.6 it can be seen that total number
of yielding occurs in building with X-bracing, inverted V
bracing, and inclined bracing in X direction is 277, 316,
328 and 340 respectively. Also from fig.5.9 and fig. 5.10 it
is obvious that the demand curve is not intersecting the
capacity curve which mean building is safe against
collapse.
5.4 Plastic Hinges Mechanism.
Plastic hinge formation for the without braced
building and building with different braced systems have
been obtained at different displacement levels. The hinging
patterns are plotted in figures 5.10, 5.11, 5.12 and 5.13.
From figure 5.10 it can be seen that the plastic hinges
formation starts with beam ends and base columns of lower
stories, then propagates to upper stories and continue with
yielding of interior intermediate columns in the upper
stories.
Comparison of the figures 5.11, 5.12 and 5.13
reveals that the patterns of plastic hinge formation for the
different braced building are quite similar. But since
yielding occurs at events B, IO and LS respectively, the
amount of damage in the three buildings will be limited
2059
International Journal of Engineering Research & Technology (IJERT)
Vol. 2 Issue 7, July - 2013
IJERT
IJERT
ISSN: 2278-0181
www.ijert.orgIJERTV2IS70715
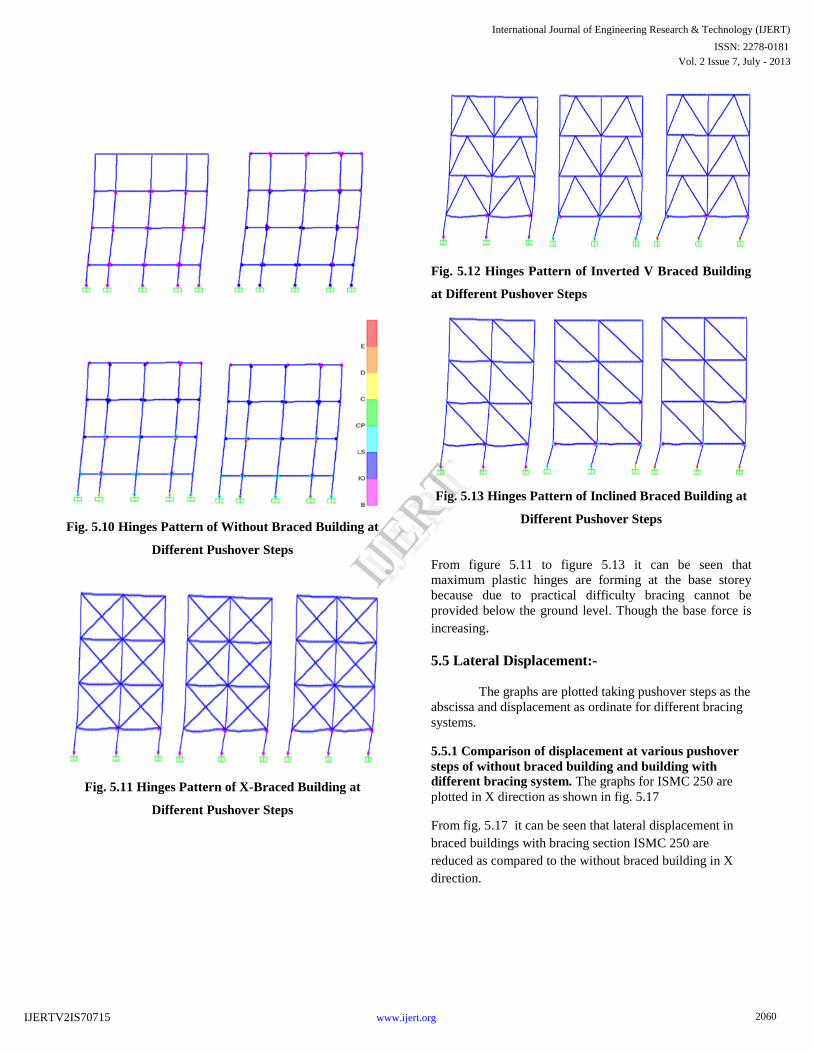
Fig. 5.10 Hinges Pattern of Without Braced Building at
Different Pushover Steps
Fig. 5.11 Hinges Pattern of X-Braced Building at
Different Pushover Steps
Fig. 5.12 Hinges Pattern of Inverted V Braced Building
at Different Pushover Steps
Fig. 5.13 Hinges Pattern of Inclined Braced Building at
Different Pushover Steps
From figure 5.11 to figure 5.13 it can be seen that
maximum plastic hinges are forming at the base storey
because due to practical difficulty bracing cannot be
provided below the ground level. Though the base force is
increasing.
5.5 Lateral Displacement:-
The graphs are plotted taking pushover steps as the
abscissa and displacement as ordinate for different bracing
systems.
5.5.1 Comparison of displacement at various pushover
steps of without braced building and building with
different bracing system. The graphs for ISMC 250 are
plotted in X direction as shown in fig. 5.17
From fig. 5.17 it can be seen that lateral displacement in
braced buildings with bracing section ISMC 250 are
reduced as compared to the without braced building in X
direction.
2060
International Journal of Engineering Research & Technology (IJERT)
Vol. 2 Issue 7, July - 2013
IJERT
IJERT
ISSN: 2278-0181
www.ijert.orgIJERTV2IS70715

Fig. 5.11 Displacement of Floor at Various Steps in X-
Direction
The displacement at last step at the top storey
reduces by 82.17%, 81.7%, 78.76% and 79.79 for X
bracing, inverted V bracing, inclined compression bracing
and inclined tensile bracing respectively in X direction.
6. CONCLUSION
A. Introduction
For buildings that needed to be rehabilitated, it is
easy to investigate the effect of different strengthening and
retrofitting schemes. By using pushover analysis we can
select the suitable strengthening and retrofitting schemes by
changing member properties of weaker sections and
carrying out the analysis again. For retrofitting pushover
analysis provides better and economical solution as
compared to other methods. The results of present study
demonstrate that most of the plastic hinges are forming
within beam element. In that case, we can restrengthen the
structure by providing X-bracing systems which provides
an excellent mechanism for energy dissipation.
Conclusion
Based on analysis results following conclusion are drawn
1. The joints of the structure have displayed rapid
degradation and the inter storey deflections have
increased rapidly in non- linear zone in structure
without bracings. Severe damages have occurred at
joints at lower floors whereas moderate damages
have been observed in the first and second floors.
Minor damage has been observed at roof level.
2. The behavior of properly detailed reinforced
concrete frame building is adequate as indicated by
the intersection of the demand and capacity curves
and the distribution of hinges in the beams and the
columns. Most of the hinges developed in the
beams and few in the columns.
3. The results obtained in terms of demand, capacity
and plastic hinges gave an insight into the real
behavior of structures.
4. It is observed that inherent deficiencies in the
detailing of the beam-column joints get reflected
even after providing bracing systems in Y-
direction, though the performance factors indicate
significant improvement. There is a need to evolve
suitable performance factors when the system
shows a negative stiffness.
5. The floor displacement is maximum for without
braced building frame as compared to braced
building frame. In the braced building frame, floor
displacement is minimum for X bracing, and
nearly same for inclined bracing and inverted V
bracing.
6. From above discussion it is concluded that in
inclined bracing system deflection is nearly same
as that of X-bracing and inverted V bracing and
base shear is also nearly same, so from economic
point of view we can provide inclined bracing
system to the structure to resist the seismic forces
without compromising with strength and stiffness
of the structure.
REFERENCES
1) V.S.R. Pavan Kumar.Rayaprolu, P. Polu Raju,
Incorporation of Various Seismic Retrofitting
Techniques and Materials for RC Framed Building
Using SAP2000, International Journal of Emerging
trends in Engineering and Development ISSN 2249-
6149 Issue 2,Vol.3 (April-2012)
2) Murty C.V.R. (2002). “Quantitative approach to
seismic strengthening of RC frame buildings”, Seminar
on seismic assessment and retrofitting of buildings at
mumbai, 16th
Feb 2002
3) W. Huang, L.A. Toranzo-Dianderas, A Case Study Of
Performance-Based Seismic Evaluation And Retrofit
Of An Existing Hospital Building In California, U.S,
The 14th
World Conference on Earthquake Engineering
October12-17, 2008, Beijing, China.
0
50
100
150
200
250
0 4 8 12 16 20
Dis
pla
cem
ent
(mm
)
Pushover Steps
Displacement (mm) Without Bracing
Displacement (mm) X-Bracing
Displacement (mm) Inverted V
Displacement (mm) Inclined Compression
2061
International Journal of Engineering Research & Technology (IJERT)
Vol. 2 Issue 7, July - 2013
IJERT
IJERT
ISSN: 2278-0181
www.ijert.orgIJERTV2IS70715
4) Giuseppe Oliveto and Massimo Marletta, Seismic
Retrofitting Of Reinforced Concrete Buildings Using
Traditional And Innovative Techniques, ISET Journal
of Earthquake Technology, Paper No. 454, Vol. 42, No.
2-3, June-September 2005, pp. 21-46
5) Ghobarah, Rehabilitation of a Reinforced Concrete
Frame Using Eccentric Steel Bracing, Engineering
Structures Volume. 23 Pages 745–755, 2001.
6) Keiji Kitajima, Hideaki Chikui, Hideaki Ageta and
Hajime Yokouchi, Application To Response Control
Retrofit Method By Means Of External Damping
Braces Using Friction Dampers, 13th World
Conference on Earthquake Engineering Vancouver,
B.C., Canada August 1-6, 2004 Paper No. 2112
7) Mitsukazu Nakanishi and Hiromi Adachi, Pseudo-
Dynamic Test On An Existing R/C School Building
Retrofitted With Friction Dampers, 13th World
Conference on Earthquake Engineering Vancouver,
B.C., Canada August 1-6, 2004 Paper No. 2112
8) N. Lakshmanan, Seismic Evaluation And Retrofitting
Of Buildings And Structures, ISET Journal of
Earthquake Technology, Paper No. 469, Vol. 43, No.
1-2, March-June 2006, pp. 31-48
9) CERONI. Francesca, MANFREDI Gaetano, Maria
Rosaria PECCE. A formulation of plastic hinge length
in R.C. Columns. Department of Engineering,
University of Sannio. Department of Analysis and
Structural Design, University of Naples Federico II. 17
May 2007.
10) X.-K. Zou, C.-M. Chan. Optimal seismic performance-
based design of reinforced concrete buildings using
nonlinear pushover analysis. Department of Civil
Engineering, Hong Kong University of Science and
Technology, Kowloon, Hong Kong, China. May 2005.
11) Cosenza, E., Greco, C., Manfredi, G. An equivalent
steel index in the assessment of the ductility
performances of the reinforcement. Ductility-
Reinforcement, Comitè Euro- International du Béton,
Bulletin N°242: 157-170, 1998.
12) A. Shuraim, A. Charif. Performance of pushover
procedure in evaluating the seismic adequacy of
reinforced concrete frames. King Saud University
[email protected].(2007)
13) Collins K. R. (1995). “A reliability based dual level
seismic design procedure for building structures”,
Earthquake spectra, Vol. 11 No. 3, August.
14) Sermin Oguz. A thesis on “EVALUATION OF
PUSHOVER ANALYSIS PROCEDURES FOR
FRAME STRUCTURES‖, April, 2005.
15) Fib Bulletin of TG7.2 (in press). Displacement-based
design and assessment, (2003).
16) ATC (1996). Seismic Evaluation and Retrofit of
Concrete Buildings, Volume 1, ATC – 40 Report,
Applied Technology Council, Redwood City,
California.
17) FEMA (1997). NEHRP Guidelines for the Seismic
Rehabilitation of Buildings, Developed by the Building
Seismic Safety Council for the Federal Emergency
Management Agency (Report No. FEMA 273),
Washington, D.C)
18) IS: 1893 (Part1): 2002. “Criteria for earthquake
resistant design of structure “Bureau of Indian
Standards, New Delhi.
19) IS: 456 (2000) “Indian standard code of practice for
plain reinforced concrete “Bureau of Indian standards,
New Delhi.
20) P. Poluraju, Pushover Analysis Of Reinforced Concrete
Frame Structure Using SAP 2000, International
Journal of Earth Sciences and Engineering ISSN 0974-
5904, Volume 04, No 06 SPL, October 2011, pp. 684-
690
21) Egor Popov, Seismic Steel Framing Systems for Tall
Buildings, Sino-American Symposium on Bridge and
Structural Engineering, Volume. 17 (3), Sept. 1982.
22) A. Kadid∗ and A. Boumrkik, “PUSHOVER
ANALYSIS OF REINFORCED CONCRETE FRAME
STRUCTURE”, Asian Journal Of Civil Engineering
(Building And Housing) Vol. 9, NO. 1 PAGES 75-83
(2008)
23) Priestley, M. J. N. & Park, R. “Strength and Ductility
of Concrete Bridge Columns Under Seismic Loading”’.
ACI Structural Journal, Technical paper, Title n° 84-
S8, 79(1), pp. 61-76, January-February, 1987.
2062
International Journal of Engineering Research & Technology (IJERT)
Vol. 2 Issue 7, July - 2013
IJERT
IJERT
ISSN: 2278-0181
www.ijert.orgIJERTV2IS70715

24) Rohit Bansal. A thesis on “PUSHOVER ANALYSIS
OF REINFORCED CONCRETE FRAME”, July,
2011.
25) Michael Fardis. (April 2005) “Seismic Performance
Assessment and Rehabilitation of Existing Buildings”.
Proceedings of International workshop at European
Laboratory for Structural Assessment (ELSA) I-21020
Ispra – Italy
26) S. S. Vidhale. “SEISMIC RESPONSE OF STEEL
BUILDING WITH LINEAR BRACING SYSTEM (A
Software Approach)”. International Journal of
Electronics, Communication & Soft Computing Science
and Engineering ISSN: 2277-9477, Volume 2.
27) Pankaj Agrawal, Manish Shrikhande. “Earthquake
Resistant Design of Structures”.2006 PHI Learning
Private Limited, New Delhi.
28) www.mosttutorials.blogspot.com
29) www.slideserve.com/delling/analysis-and-design-of-
rc-buildings-using-sap-2000.
2063
International Journal of Engineering Research & Technology (IJERT)
Vol. 2 Issue 7, July - 2013
IJERT
IJERT
ISSN: 2278-0181
www.ijert.orgIJERTV2IS70715
Recommended