
SEISMIC DATA PROCESSING REPORT
for
3D OIL LIMITED
Project: T41P 2008 Processing
Survey: TDOB08
Location: T41P, Bass Strait
Date: September 2008
Fugro Seismic Imaging Pty Ltd69 Outram Street
WEST PERTH WA 6005Tel: +61 (0)8 9322 2490Fax: + 61 (0)8 9481 6721
Email: info@fugrofsi.com.au
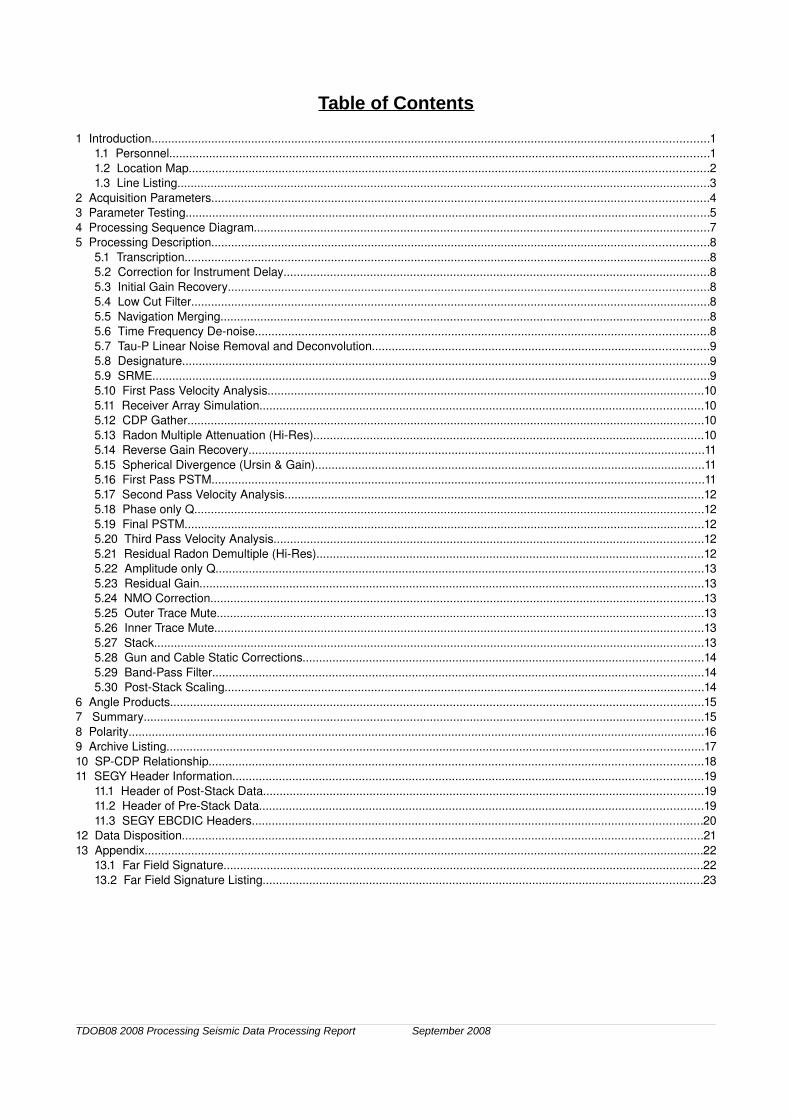
Table of Contents
1 Introduction.......................................................................................................................................................................11.1 Personnel..................................................................................................................................................................11.2 Location Map............................................................................................................................................................21.3 Line Listing................................................................................................................................................................3
2 Acquisition Parameters.....................................................................................................................................................43 Parameter Testing.............................................................................................................................................................54 Processing Sequence Diagram.........................................................................................................................................75 Processing Description.....................................................................................................................................................8
5.1 Transcription..............................................................................................................................................................85.2 Correction for Instrument Delay................................................................................................................................85.3 Initial Gain Recovery................................................................................................................................................85.4 Low Cut Filter............................................................................................................................................................85.5 Navigation Merging...................................................................................................................................................85.6 Time Frequency Denoise........................................................................................................................................85.7 TauP Linear Noise Removal and Deconvolution.....................................................................................................95.8 Designature..............................................................................................................................................................95.9 SRME.......................................................................................................................................................................95.10 First Pass Velocity Analysis...................................................................................................................................105.11 Receiver Array Simulation.....................................................................................................................................105.12 CDP Gather...........................................................................................................................................................105.13 Radon Multiple Attenuation (HiRes).....................................................................................................................105.14 Reverse Gain Recovery.........................................................................................................................................115.15 Spherical Divergence (Ursin & Gain).....................................................................................................................115.16 First Pass PSTM....................................................................................................................................................115.17 Second Pass Velocity Analysis..............................................................................................................................125.18 Phase only Q.........................................................................................................................................................125.19 Final PSTM............................................................................................................................................................125.20 Third Pass Velocity Analysis.................................................................................................................................125.21 Residual Radon Demultiple (HiRes)....................................................................................................................125.22 Amplitude only Q..................................................................................................................................................135.23 Residual Gain.......................................................................................................................................................135.24 NMO Correction....................................................................................................................................................135.25 Outer Trace Mute..................................................................................................................................................135.26 Inner Trace Mute...................................................................................................................................................135.27 Stack.....................................................................................................................................................................135.28 Gun and Cable Static Corrections........................................................................................................................145.29 BandPass Filter...................................................................................................................................................145.30 PostStack Scaling................................................................................................................................................14
6 Angle Products................................................................................................................................................................157 Summary........................................................................................................................................................................158 Polarity.............................................................................................................................................................................169 Archive Listing.................................................................................................................................................................1710 SPCDP Relationship....................................................................................................................................................1811 SEGY Header Information.............................................................................................................................................19
11.1 Header of PostStack Data....................................................................................................................................1911.2 Header of PreStack Data.....................................................................................................................................1911.3 SEGY EBCDIC Headers.......................................................................................................................................20
12 Data Disposition............................................................................................................................................................2113 Appendix........................................................................................................................................................................22
13.1 Far Field Signature................................................................................................................................................2213.2 Far Field Signature Listing....................................................................................................................................23
TDOB08 2008 Processing Seismic Data Processing Report September 2008

1 IntroductionThe TDOB08 survey was recorded by CGG Veritas using M/V Pacific Titan in the month of April 2008. A total of 2204.550 km of seismic data was acquired, comprised of 65 lines. The survey is located in the T41P, Bass Strait area in water depths of approximately 80 metres.
Testing for the TDOB08 survey was comprehensive with attention paid to multiple and noise attenuation, steep dip and amplitude preservation. The zone of interest was approximately 1.5 seconds, and it was important to remove the linear noise as much as possible so that the shallow events could be tracked across all offsets.
The main final delivered products consisted of Final Migrations, Raw Migrations and Angle Migrations. Final PSTM gathers with NMO were also archived.
All processing, including velocity picking and QC was undertaken at the Fugro Seismic Imaging office in Perth, Western Australia.
Geological setting:
The TBOB08-Survey was acquired in the Eastern Bass basin, where the Eastern View Coal measures are known to contain coal sequences. Prospective targets extend from the Oligiocene sands to the base of the Eastern View Coal measures. AVO has differentiated Hydrocarbons previously in this basin, and considerable efforts were made to retain relative amplitude information.
1.1 PersonnelFugro Seismic Imaging Pty LtdKelly Beauglehole Chief GeophysicistSimon Stewart Processing ManagerLouise Onslow Geophysicist
3D OilJohn Cant ConsultantBruce Hawkes Consultant
TDOB08 2008 Processing Seismic Data Processing Report September 2008 Page 1

1.2 Location Map
T41P, Bass Strait
TDOB08 2008 Processing Seismic Data Processing Report September 2008 Page 2
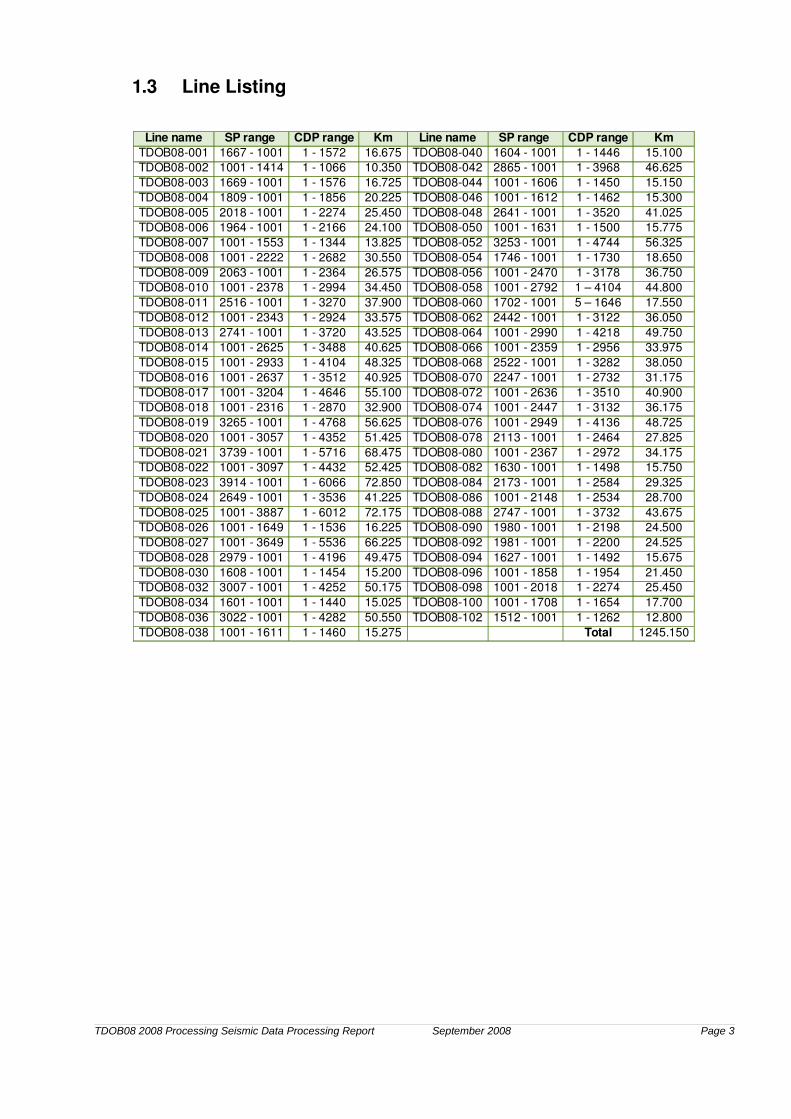
1.3 Line Listing
TDOB08 2008 Processing Seismic Data Processing Report September 2008 Page 3
Line name SP range CDP range Km Line name SP range CDP range KmTDOB08001 1667 1001 1 1572 16.675 TDOB08040 1604 1001 1 1446 15.100TDOB08002 1001 1414 1 1066 10.350 TDOB08042 2865 1001 1 3968 46.625TDOB08003 1669 1001 1 1576 16.725 TDOB08044 1001 1606 1 1450 15.150TDOB08004 1809 1001 1 1856 20.225 TDOB08046 1001 1612 1 1462 15.300TDOB08005 2018 1001 1 2274 25.450 TDOB08048 2641 1001 1 3520 41.025TDOB08006 1964 1001 1 2166 24.100 TDOB08050 1001 1631 1 1500 15.775TDOB08007 1001 1553 1 1344 13.825 TDOB08052 3253 1001 1 4744 56.325TDOB08008 1001 2222 1 2682 30.550 TDOB08054 1746 1001 1 1730 18.650TDOB08009 2063 1001 1 2364 26.575 TDOB08056 1001 2470 1 3178 36.750TDOB08010 1001 2378 1 2994 34.450 TDOB08058 1001 2792 1 – 4104 44.800TDOB08011 2516 1001 1 3270 37.900 TDOB08060 1702 1001 5 – 1646 17.550TDOB08012 1001 2343 1 2924 33.575 TDOB08062 2442 1001 1 3122 36.050TDOB08013 2741 1001 1 3720 43.525 TDOB08064 1001 2990 1 4218 49.750TDOB08014 1001 2625 1 3488 40.625 TDOB08066 1001 2359 1 2956 33.975TDOB08015 1001 2933 1 4104 48.325 TDOB08068 2522 1001 1 3282 38.050TDOB08016 1001 2637 1 3512 40.925 TDOB08070 2247 1001 1 2732 31.175TDOB08017 1001 3204 1 4646 55.100 TDOB08072 1001 2636 1 3510 40.900TDOB08018 1001 2316 1 2870 32.900 TDOB08074 1001 2447 1 3132 36.175TDOB08019 3265 1001 1 4768 56.625 TDOB08076 1001 2949 1 4136 48.725TDOB08020 1001 3057 1 4352 51.425 TDOB08078 2113 1001 1 2464 27.825TDOB08021 3739 1001 1 5716 68.475 TDOB08080 1001 2367 1 2972 34.175TDOB08022 1001 3097 1 4432 52.425 TDOB08082 1630 1001 1 1498 15.750TDOB08023 3914 1001 1 6066 72.850 TDOB08084 2173 1001 1 2584 29.325TDOB08024 2649 1001 1 3536 41.225 TDOB08086 1001 2148 1 2534 28.700TDOB08025 1001 3887 1 6012 72.175 TDOB08088 2747 1001 1 3732 43.675TDOB08026 1001 1649 1 1536 16.225 TDOB08090 1980 1001 1 2198 24.500TDOB08027 1001 3649 1 5536 66.225 TDOB08092 1981 1001 1 2200 24.525TDOB08028 2979 1001 1 4196 49.475 TDOB08094 1627 1001 1 1492 15.675TDOB08030 1608 1001 1 1454 15.200 TDOB08096 1001 1858 1 1954 21.450TDOB08032 3007 1001 1 4252 50.175 TDOB08098 1001 2018 1 2274 25.450TDOB08034 1601 1001 1 1440 15.025 TDOB08100 1001 1708 1 1654 17.700TDOB08036 3022 1001 1 4282 50.550 TDOB08102 1512 1001 1 1262 12.800TDOB08038 1001 1611 1 1460 15.275 Total 1245.150

2 Acquisition Parameters
DESCRIPTION DETAILS
Data recorded by: CGGVeritasDate recorded: April 2008Vessel: M/V Pacific Titan
General:Nominal fold 120Recording format: SEG D 8058 rev 1.0
Seismic source:Type Air gunVolume 3040 cu.in.Pressure: 2000 psiDepth: 6 mShot interval: 25 mGun delay 0 ms
Recording system:Instrument: Sercel Seal 408XLRecord length: 6000 msSample interval: 2 msInstrument delay: 50 msLow cut filter: 4.7Hz@12dB/OctaveHigh cut filter: 200 Hz @ 370 dB/octave
Receivers:Streamer length: 6000 mStreamer depth: 8 mNumber of groups: 480Near group number: 1Group interval: 12.5 mCentre source to centre near group: 145m
SP annotation: Source position
TDOB08 2008 Processing Seismic Data Processing Report September 2008 Page 4

3 Parameter Testing
Line TDOB08030002 was chosen as our main test line.
The processing test sequence includes review of the following processing phases and parameter choices:
1) DesignatureUsing far field signature provided by CGG Veritas. Test various fuzzy cable ghost at 8m +/ 0.5m , 1m 1.5m and 2m.
2) Gain RecoveryInitial gain correction estimate, compensating for spherical divergence and inelastic attenuation losses. Test t**2 gain to confirm applicability.
3) PreFilterReapplication of boat lowcut frequency filter: 4 Hz at 12 dB/oct.
4) Time Frequency DenoiseTest different frequency ranges and threshold attributes.
5) TauP DeconvolutionTest various gap lengths and operators.
6) TauP Linear Noise Attenuation Test different severities of muting in TauP domain. Compare shot records and stack sections.
7) SRMEComparison of shot records and stack sections with and without SRME plus using different global shifts.
8) Radon Demultiple Test the linear mode versus parabolic mode with varying inputs, and velocities.
9) Surface consistent amplitude correction (SCAMP) To confirm the applicability of SCAMP.
10) Inverse QIt was decided to apply phase only inverse Q prior to final PSTM .
11) PreStack Kirchhoff Migration Test straight ray versus curved ray.
12) Residual Radon Demultiple Test varying frequency range, number of p values.Also test the linear mode versus parabolic mode.
13) Inverse QAmplitude only Q was used to with a boost to 12d/B.
TDOB08 2008 Processing Seismic Data Processing Report September 2008 Page 5

14) MutesTest different severities of normal outer and inner mutes.
15) Bandpass FilterRun suites of bandpass varying low cut and varying high cut to pick the filters.
16) PostStack ScalingProduce stacks with various dual window AGC with different percentages of mixback.
17) Angle MigrationsTest different ranges of angle of incidence and also the various limiting offsets to apply the angle mutes.
TDOB08 2008 Processing Seismic Data Processing Report September 2008 Page 6

4 Processing Sequence Diagram
TDOB08 2008 Processing Seismic Data Processing Report September 2008 Page 7
Field Tape Transcription
Correction for Instrument Delay
Initial Gain Recovery
low cut filter
Navigation Merging
Swell Noise Attenuation
TauP Deconvolution
TauP Linear Noise Attenuation(subtraction method)
Designature output to zero phase
SRME
First Pass Velocity Analysis
Receiver Array Simulation
Sort to CDP gathers
Radon Multiple Attenuation
Removal of T**2 Scaling and application of Spherical Divergence Correction
First Pass PSTM
Second Pass Velocity Analysis
Phase only Q compensation
Final PSTM
Third Pass Velocity Analysis
Residual Radon Demultiple
Amplitude only Q compensation
NMO correction
Outer Trace Mutes
Inner Trace Mutes
Stack
Gun and Cable Static Corrections
Dual Gate AGC Scaling
Band Pass Filter
5 Processing DescriptionA brief description of each of the processes used in the processing sequence follows:
5.1 TranscriptionThe supplied field tapes were copied directly to disk, without transcription from SEGD format. The practice of preserving a pristine field tape image ensures that the field tapes need only be read once in a processing project. The field tape images are later converted to Fugro Seismic Imaging internal format trace sequential with samples in 32 bit IEEE floating point.
5.2 Correction for Instrument DelayA static correction of 50 ms is applied to the whole survey to account for the instrument delay.
5.3 Initial Gain RecoveryA gain function is applied to the data set to compensate for amplitude decay. The functions applied use t squared compensation for inelastic attenuation and spherical divergence losses. (t is the two way travel time in milliseconds).
5.4 Low Cut FilterA lowcut filter ( 4 Hz at 12 dB/Octave) was applied to the shot records.
5.5 Navigation MergingThe seismic trace headers are updated with easting and northing values for sources, receivers and CDPs from the supplied navigation files. Water bottom times are digitised from stacks and read into the headers.
Parameters for NavigationSpheroid: GDA 94 (6378137.000 298.2572236)
Projection type: 002 UTM SouthProjection Zone: 55 SLongitude of CM: 147 0 0.000 E
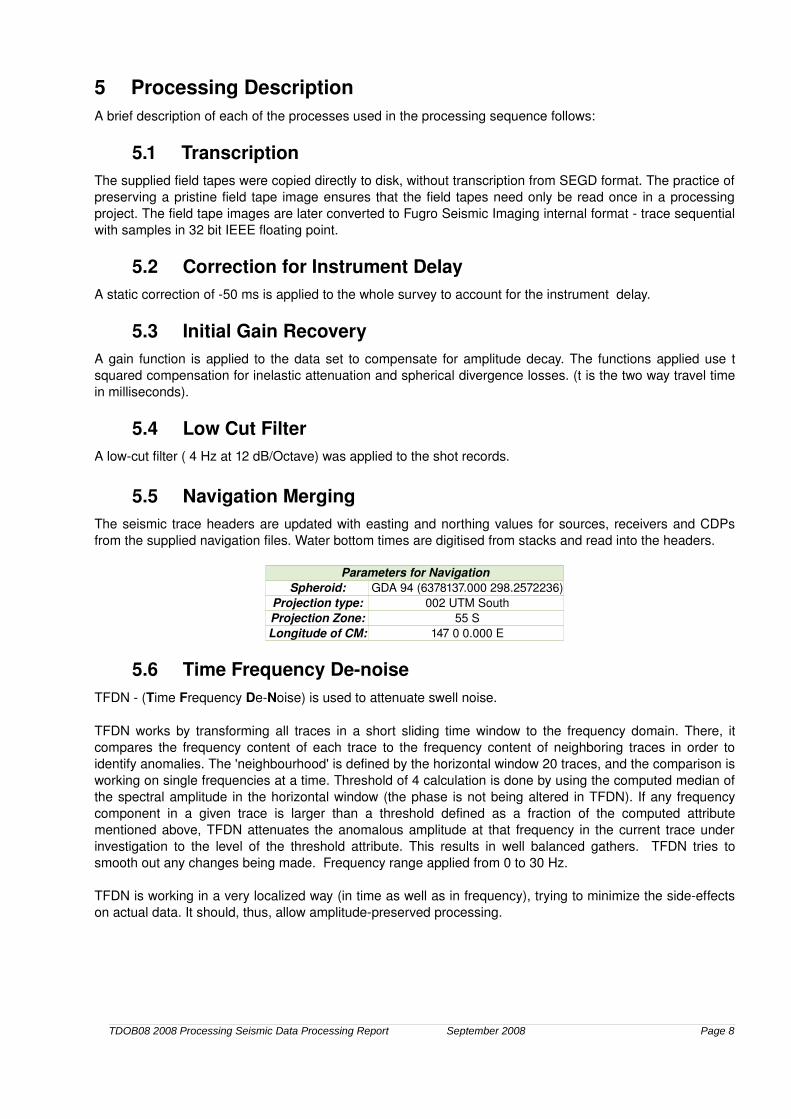
5.6 Time Frequency DenoiseTFDN (Time Frequency DeNoise) is used to attenuate swell noise.
TFDN works by transforming all traces in a short sliding time window to the frequency domain. There, it compares the frequency content of each trace to the frequency content of neighboring traces in order to identify anomalies. The 'neighbourhood' is defined by the horizontal window 20 traces, and the comparison is working on single frequencies at a time. Threshold of 4 calculation is done by using the computed median of the spectral amplitude in the horizontal window (the phase is not being altered in TFDN). If any frequency component in a given trace is larger than a threshold defined as a fraction of the computed attribute mentioned above, TFDN attenuates the anomalous amplitude at that frequency in the current trace under investigation to the level of the threshold attribute. This results in well balanced gathers. TFDN tries to smooth out any changes being made. Frequency range applied from 0 to 30 Hz.
TFDN is working in a very localized way (in time as well as in frequency), trying to minimize the sideeffects on actual data. It should, thus, allow amplitudepreserved processing.
TDOB08 2008 Processing Seismic Data Processing Report September 2008 Page 8

5.7 TauP Linear Noise Removal and DeconvolutionThe data was transformed to the TauP domain using the linear transform. The transform was performed with p limits of 2500ms and +4500ms, with increments of 6ms at the far offset.
A long gap deconvolution (total operator length 308ms, gap 48ms tied to the water bottom) was applied in TauP domain to remove short period multiples whilst minimising any wavelet shaping effects.
Strong linear noise trains with large dip can be differentiated from primary energy in the linear TauP space, and these events are attenuated by a scaling pattern tapering from the primary to noise areas of the transform.
Some mixback of data are employed to protect the shallow section from aliased artefacts generated in the modelling process.
Parameters for TauP Muting
WBT(ms) Tau (ms) Trace numbers in transform (pass)
100
0 120 1050
175 140 900
450 180 750
2950 230 650
Parameters for TauP Muting for Parabolic Radon Transform
WBT (ms) Tau (ms) Primary p range (muted) (ms)
100
100 1400 to 900
1000 1400 to 300
2000 1400 to 200
6000 1400 to 100
5.8 DesignatureUsing the supplied calculated far field signature the designature is applied to convolve the wavelet to zero phase wavelet with the same spectrum. – refer to appendices for details of the wavelet used.
5.9 SRMESRME or Surface Related Multiple Elimination uses the geometry of shot recording to estimate all possible multiples that can be generated by the surface. It was developed by the Delphi Consortium at TUDelft in the Netherlands. One order of surface related multiples is predicted using autoconvolutions of input data. The predicted multiple energy is then removed from the input gathers by a process of cascaded adaptive subtraction.
Prior to forming the multiple estimate, it is necessary to interpolate new shots such that the shotpoint interval is equal to the group interval. The recorded data is then extrapolated to zero offset, before constructing the multiple estimate by a series of convolutions and summation.
A mute is applied to the input shot records prior to remove direct arrival energy. Before adaptive subtraction, the modelled multiples are NMO corrected and any energy above the first seafloor multiple removed by muting.
TDOB08 2008 Processing Seismic Data Processing Report September 2008 Page 9

Parameters for SRMEGroup interval 12.5m
SP interval (after interpolation) 12.5mSRME 80 reciprocal traces to generate
60 reciprocal traces to taper560 shots used8 ms global shift
Adaptive subtraction Common shot domain30 filter traces
500 ms window21 adjacent traces used in matching
5.10 First Pass Velocity AnalysisThe first pass velocities were picked at a 1km interval using our Fugro Seismic Imaging Pty Ltd “MGIVA” interactive velocity analysis program. Each velocity analysis comprises a semblance display, a CDP stacked panel repeated 14 times with a suite of velocity functions, and a central CDP gather. The suite of functions are generated using 0%, +/5%, +/10%, +/15%, +/20%, +/25% , +/30% and +/40% increments from a central velocity function. The central functions for this velocity analysis were based on crude velocity functions varied according to WBT. QC of the velocities by client representatives was carried out on SRME data.
5.11 Receiver Array SimulationA receiver array simulation is achieved by using a frequencywavenumber filter.
After decimation, the shot records consist of half the number of channels, with new group intervals being double the original group intervals.
5.12 CDP GatherData from each source/cable combination is sorted into the common midpoint domain.
Parameters for CDP Gather
Shot interval: 25 m
Group interval: 25 m
Number of channels: 240
CDP interval: 12.5 m
CDP fold: 120
5.13 Radon Multiple Attenuation (HiRes)Attenuation of multiples was achieved by modelling and subtraction using a least squares, parabolic radon transform. Normal moveout corrections were performed using the first pass velocities, and the CDP gathers transformed into the parabolic TauP domain. The segment of the TauP domain corresponding to primary reflections is muted, leaving the multiple energy to be transformed back into the TX domain and subtracted from the original CDP gather. The Hiresolution radon option was invoked, where the resolution of the radon transform is improved by adding weighting terms to the least squares solution, thus minimising the residual error. To further reduce the potential for aliasing, the radon transform was performed on 240 fold gathers formed by FX interpolation of new shots. After demultiple, the interpolated traces were dropped from the processing stream. A mild tx mute was applied immediately before the radon transform to remove NMO stretch noise from the shallow zone of longer offsets.
TDOB08 2008 Processing Seismic Data Processing Report September 2008 Page 10
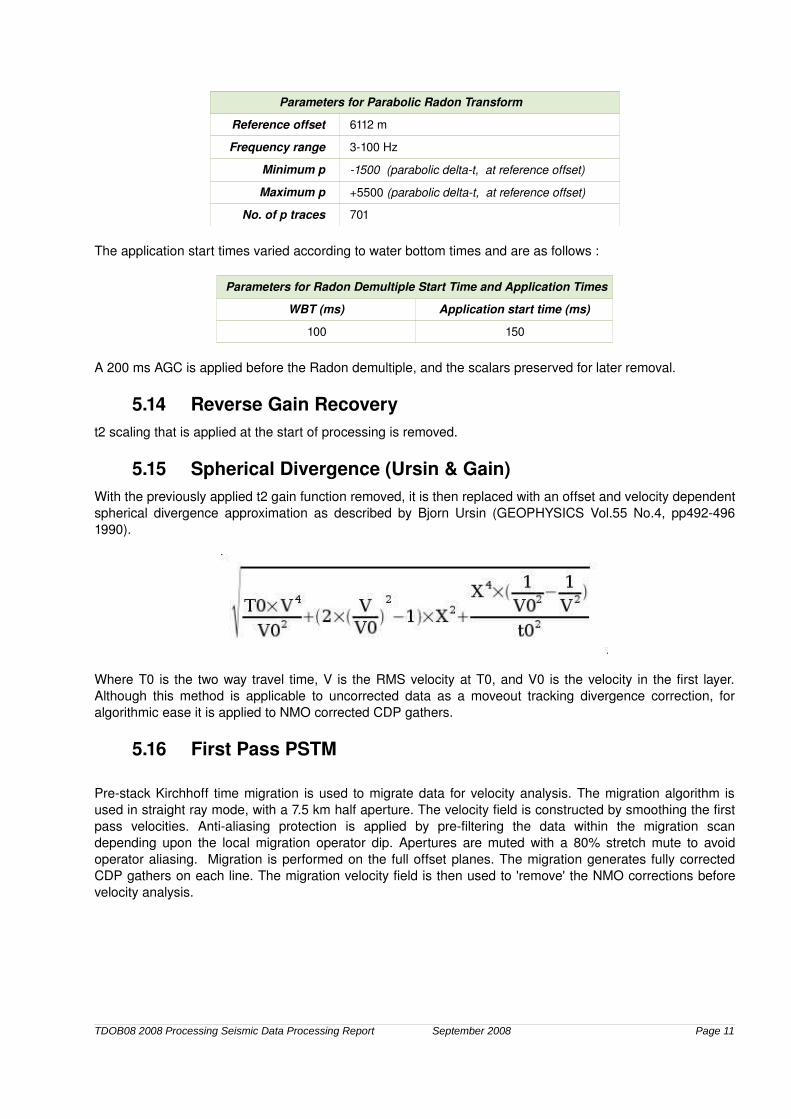
Parameters for Parabolic Radon Transform
Reference offset 6112 m
Frequency range 3100 Hz
Minimum p 1500 (parabolic deltat, at reference offset)
Maximum p +5500 (parabolic deltat, at reference offset)
No. of p traces 701
The application start times varied according to water bottom times and are as follows :
Parameters for Radon Demultiple Start Time and Application Times
WBT (ms) Application start time (ms)
100 150
A 200 ms AGC is applied before the Radon demultiple, and the scalars preserved for later removal.
5.14 Reverse Gain Recoveryt2 scaling that is applied at the start of processing is removed.
5.15 Spherical Divergence (Ursin & Gain)With the previously applied t2 gain function removed, it is then replaced with an offset and velocity dependent spherical divergence approximation as described by Bjorn Ursin (GEOPHYSICS Vol.55 No.4, pp492496 1990).
Where T0 is the two way travel time, V is the RMS velocity at T0, and V0 is the velocity in the first layer. Although this method is applicable to uncorrected data as a moveout tracking divergence correction, for algorithmic ease it is applied to NMO corrected CDP gathers.
5.16 First Pass PSTM
Prestack Kirchhoff time migration is used to migrate data for velocity analysis. The migration algorithm is used in straight ray mode, with a 7.5 km half aperture. The velocity field is constructed by smoothing the first pass velocities. Antialiasing protection is applied by prefiltering the data within the migration scan depending upon the local migration operator dip. Apertures are muted with a 80% stretch mute to avoid operator aliasing. Migration is performed on the full offset planes. The migration generates fully corrected CDP gathers on each line. The migration velocity field is then used to 'remove' the NMO corrections before velocity analysis.
TDOB08 2008 Processing Seismic Data Processing Report September 2008 Page 11

5.17 Second Pass Velocity AnalysisFull pre stack Kirchhoff time migration was used to migrate lines for velocity analysis. The velocity field was constructed by smoothing the first pass velocities. Migration was performed on 120 offset planes.
The second pass of velocities are picked at 750m interval on first pass PSTM gathers using our Fugro Seismic Imaging Pty Ltd “MGIVA” interactive velocity analysis program. Each velocity analysis comprises a semblance display, a CDP stacked panel repeated 14 times with a suite of velocity functions, and a central CDP gather. The suite of functions are generated using 0%, +/2%, +/4%, +/6%, +/8%, +/10%, +/12%, +/14% increments from a central velocity function. The first pass velocities are used as the central function for this suite of velocity variant functions.
5.18 Phase only QEarth filtering can be modelled as an exponential decay of energy with propagation distance. This decay is approximately constant with each frequency cycle. The net result is high frequency attenuation and dispersion: high frequencies travel faster than low frequencies, causing distortion of the waveform. Q compensation adds to the model by correcting for the amplitude and/or phase effects of earth filtering.
Q compensation was performed using the method described by Hargreaves and Calvert, published in Geophysics Vol 56 No4, April 1991. This applies corrections to the phase spectrum only. A Q value of 140 was used.
5.19 Final PSTMKirchhoff prestack time migration is applied using curved ray algorithm with a maximum half aperture of 15 km,invoking the curved ray algorithm. Antialiasing protection is applied by prefiltering the data within the migration scan depending upon the local migration operator dip. Apertures are muted with a 80% stretch mute to avoid operator aliasing. Smoothed 100% second pass velocities at 750m are used and migration is performed on the full offset planes.
Surface consistent velocity smoothing for final PSTM employs the same scheme as that for the first pass PSTM
5.20 Third Pass Velocity AnalysisThe third pass of velocities are picked at 500m intervals on final PSTM gathers using our Fugro Seismic Imaging Pty Ltd “MGIVA” interactive velocity analysis program. Each velocity analysis comprises a semblance display, a CDP stacked panel repeated 14 times with a suite of velocity functions, and a central CDP gather. The suite of functions are generated using 0%, +/2%, +/4%, +/6%, +/8%, +/10%, +/12%, +/14% increments from a central velocity function. The second pass of velocities are used as the central function for this suite of velocity variant functions.
5.21 Residual Radon Demultiple (HiRes)The initial demultiple was performed in a lenient fashion because the preliminary velocity field did not permit fine discrimination between primary and multiple energy. Most seafloor multiple energy was removed. The data benefits from applying a residual Radon demultiple to remove some of the steeply dipping noises still residing on the PSTM gathers which could not be removed in the earlier attempt of demultiple. It is also used to target multiple events with similar moveout to the primary data. The Hiresolution radon option was invoked, where the resolution of the radon transform is improved by adding weighting terms to the least squares solution, minimising the residual error. A mild tx mute was applied immediately before the radon transform to remove NMO stretch noise from the shallow zone of longer offsets.
Normal moveout corrections are performed using the third pass velocities, and the prestack time migrated gathers transform into the linear TauP domain. The segment of the TauP domain corresponding to primary
TDOB08 2008 Processing Seismic Data Processing Report September 2008 Page 12

reflections is then muted, leaving the multiple energy to be transformed back into the TX domain and subtracted from the original CDP gather.
Parameters for Linear Radon Transform
Reference offset 6112 m
Frequency range 3200 Hz
Minimum p 500 ms (linear deltat, at reference offset)
Maximum p +1500 ms (linear deltat, at reference offset)
No. of p traces 401
TauP muting Time variant
Parameters for TauP Muting for Parabolic Radon Transform
WBT (ms) Tau (ms) Primary p range (muted) (ms)
100
400 500 to 400
500 500 to 320
800 500 to 280
1100 500 to 200
1600 500 to 160
2400 500 to 140
To reduce the potential for aliasing, 2:1 interpolation is performed in the CDP domain prior to demultiple. After demultiple, the interpolated traces are dropped from the processing stream.
5.22 Amplitude only QUsing a Q value of 155 and a maximum boost of 12dB.
5.23 Residual GainA value of 2.5db/sec held constant after 3.5 seconds was used.
5.24 NMO CorrectionFourth order NMO corrections are applied using the final picked PSTM velocity functions.
5.25 Outer Trace MutePostNMO outer trace mutes are applied to remove any coherent noise on the outer races and to reduce contamination from the effect of NMO stretch on the far offsets.
5.26 Inner Trace MuteA post NMO inner trace mute is applied to help remove remnant multiple energy still apparent on the inner traces following the demultiple.
5.27 StackThe traces within each common depth point gather are summed using 1/rootN stack compensation.
TDOB08 2008 Processing Seismic Data Processing Report September 2008 Page 13

5.28 Gun and Cable Static CorrectionsA static compensation of 9ms for gun and cable depths is applied.
5.29 BandPass FilterUnwanted noise that lay outside the frequency range of the desired reflection data is attenuated by the application of a series of zero phase Butterworth time variant filters.
Parameters for BandPass Filter (milder version)
WBT Time(ms) Frequency (Hz)(dB/oct)
100ms 100 9/20 150/72
400 8/18 – 140/72
800 6/18 – 110/72
1200 4/18– 85/72
2000 3/18 78/72
2500 3/18 – 72/72
3000 3/18 – 62/68
4000 3/18 – 55/65
6000 3/18 55/60
5.30 PostStack ScalingThe CDP gather traces were modulated to compensate for amplitude irregularities by scaling each trace using a combination of trace balance, and nested AGC. The detrimental effects normally associated with AGC are avoided by employing two different length windows to determine the amplitude model (using the minimum of the two mean amplitudes determined at each sample). This time variant amplitude model is then conditioned by a weighted mix with the static amplitude model derived from a single window per trace. Variations in the mix weighting gives the user fine control over the amount of trace modulation.
Window lengths of 1000 ms and 200 ms are defined with equalization applied at 50%.
TDOB08 2008 Processing Seismic Data Processing Report September 2008 Page 14

6 Angle ProductsAngle products, stacks generated after restricting input to a portion of the pstm gathers corresponding to a particular range of incident angles, are produced for lithology and fluid predictions. The angle of incidence calculations are performed using 1D raytracing method, and considered a smoothed version of the final velocities. The angle gathers are produced where the incident angles are restricted to the specified ranges, divide equally into 3 parts, prior to stacking.
The angle mutes use smoothed velocities (3 passes of lateral and temporal smoothing with 50% mixback) and the stacks do not have any prestack nor poststack scaling applied. Matching scalars are used to bring the near and far angle products to an overall mean value of 1000.
Parameters for Angle Products
Near Angle First 33% of 4 – 38 degrees
Mid Angle Second 33% of 4 – 38 degrees
Far Angle Last 33% of 4 – 38 degrees
The 38 degree angle mute is applied from the offset of 501 m and the 4 degree angle mute is applied to the offset of 500m so as to preserve the beginning part of water bottom and the deeper section. These products were scaled prestack as per the supplied pstm gathers, I.e. with a transmission loss of 2.5dB/sec held constant after 3.5seconds.
7 Summary
The sections are generally good, with improved imaging and bandwidth down to the coals of the Eastern View Coal measures. These coals result in high reflection coefficients, which dominate the sections and generate complex interbed multiples. These were to a certain degree resolved through the use of TauP deconvolution and two passes of Radon Demultiple. However, attempts to produce “ true amplitude “ sections were hampered.
All the gain recovery on the Gathers, Raw Stacks and Angle Stacks are reversible relative amplitude processes. As such the deep section below the coals are likely to have reduced amplitudes.
The final filtered and scaled stacks used a two window AGC in an attempt to recover effects due to lateral changes in amplitude losses.
TDOB08 2008 Processing Seismic Data Processing Report September 2008 Page 15

8 Polarity
The final desired polarity was SEG negative (or SEG reverse), where an increase in acoustic impedance is represented by a negative number on tape, and white trough on display.
TDOB08 2008 Processing Seismic Data Processing Report September 2008 Page 16
Figure 7.1 Desired polarity diagram. An acoustic impedance increase is represented by a trough.

9 Archive Listing
Tape Number Media Lines Description
672FS001DVD DVD All Lines Final Enhanced, Filtered and Scaled Full Stacks SEGY Format – Copy 1
672FS002DVD DVD All Lines Final Enhanced, Filtered and Scaled Full Stacks SEGY Format – Copy 2
672RS003DVD DVD All Lines Raw Stacks SEGY Format – Copy 1
672RS004DVD DVD All Lines Raw Stacks SEGY Format – Copy 2
672RA005USB USB All Lines
Relative Amplitude PreStack Time Migrated Gathers with NMO,Raw Stacks, Final Enhanced, Filtered and Scaled Stacks, Final Enhanced, Filtered Mid, Near and & Far Stacks, Final Velocitiesand High Density Velocities at 25m Spacing.
672VF006DVD DVD All Lines Initial Velocities (Prevels) SEGY Format – Copy 1
672VF007DVD DVD All Lines Initial Velocities (Prevels) SEGY Format – Copy 2
672VF008DVD DVD All Lines Smoothed Velocities for PSTM (Smooth) SEGY Format – Copy 1
672VF009DVD DVD All Lines Smoothed Velocities for PSTM (Smooth) SEGY Format – Copy 2
672VF010DVD DVD All Lines Final Stacking Velocities (Stack) SEGY Format Copy 1
672VF011DVD DVD All Lines Final Stacking Velocities (Stack) SEGY Format Copy 2
672AS012DVD DVD All Lines Final Enhanced, Filtered Near Angle Stack (SEGY Format) – Copy 1
672AS013DVD DVD All Lines Final Enhanced, Filtered Near Angle Stack (SEGY Format) – Copy 2
672AS014DVD DVD All Lines Final Enhanced, Filtered Mid Angle Stack (SEGY Format) – Copy 1
672AS015DVD DVD All Lines Final Enhanced, Filtered Mid Angle Stack (SEGY Format) – Copy 2
672AS016DVD DVD All Lines Final Enhanced, Filtered Far Angle Stack (SEGY Format) – Copy 1
672AS017DVD DVD All Lines Final Enhanced, Filtered Far Angle Stack (SEGY Format) – Copy 2
672WV018DVD DVD All Lines Final Velocities in Western Format (Prevel, Smooth, Stack & HDVA) – Copy 1
672WV019DVD DVD All Lines Final Velocities in Western Format (Prevel, Smooth, Stack & HDVA) – Copy 2
672RA020LTO LTO All Lines Relative Amplitude PreStack Time Migrated Gathers with NMO TAR SEGY
672PR021CD CD All Lines Final Processing Report (PDF Format) – Copy 1
672PR022CD CD All Lines Final Processing Report (PDF Format) – Copy 2
672PR023CD CD All Lines Final Processing Report (PDF Format) – Copy 3
TDOB08 2008 Processing Seismic Data Processing Report September 2008 Page 17

10 SPCDP Relationship
The SP-CDP relationships for all lines are as follows:
TDOB08 2008 Processing Seismic Data Processing Report September 2008 Page 18
JOB LINE FSP FCDP LSP LCDP JOB LINE FSP FCDP LSP LCDP1 TDOB08044001 1001 240 1606 1450 35 TDOB08078035 2113 240 1001 24642 TDOB08030002 1608 240 1001 1454 36 TDOB08003036 1669 240 1001 15763 TDOB08022003 1001 240 3097 4432 38 TDOB08012038 1001 240 2343 29244 TDOB08036004 3022 240 1001 4282 39 TDOB08024039 2649 240 1001 35366 TDOB08050006 1001 240 1631 1500 40 TDOB08038040 1001 240 1611 14607 TDOB08034007 1601 240 1001 1440 41 TDOB08060041 1704 240 1001 16468 TDOB08046008 1001 240 1612 1462 42 TDOB08074042 1001 240 2447 31329 TDOB08054009 1746 240 1001 1730 43 TDOB08082043 1630 240 1001 1498
10 TDOB08064010 1001 240 2990 4218 44 TDOB08009044 2063 240 1001 236411 TDOB08042011 2865 240 1001 3968 45 TDOB08018045 1001 240 2316 287012 TDOB08026012 1001 240 1649 1536 46 TDOB08048046 2461 240 1001 316013 TDOB08040013 1604 240 1001 1446 47 TDOB08058047 1001 240 2792 382214 TDOB08007014 1001 240 1553 1344 48 TDOB08068048 2522 240 1001 328215 TDOB08001015 1667 240 1001 1572 49 TDOB08076049 1001 240 2949 413616 TDOB08016016 1001 240 2637 3512 50 TDOB08088050 2747 240 1001 373217 TDOB08052017 3253 240 1001 4744 51 TDOB08096051 1001 240 1858 195419 TDOB08066019 1001 240 2359 2956 52 TDOB08094052 1627 240 1001 149220 TDOB08070020 2247 240 1001 2732 53 TDOB08100053 1001 240 1708 165421 TDOB08080021 1001 240 2367 2972 54 TDOB08102054 1512 240 1001 126222 TDOB08090022 1980 240 1001 2198 55 TDOB08011055 2516 240 1001 327023 TDOB08098023 1001 240 2018 2274 56 TDOB08010056 1001 240 2378 299424 TDOB08092024 1981 240 1001 2200 57 TDOB08006057 1964 240 1001 216625 TDOB08005025 2018 240 1001 2274 58 TDOB08015058 1001 240 2933 410426 TDOB08014026 1001 240 2625 3488 59 TDOB08019059 3265 240 1001 476827 TDOB08028027 2979 240 1001 4196 60 TDOB08017060 1001 240 3204 464628 TDOB08020028 1001 240 3057 4352 61 TDOB08013061 2741 240 1001 372029 TDOB08032029 3007 240 1001 4252 62 TDOB08008062 1001 240 2222 268230 TDOB08056030 1001 240 2470 3178 63 TDOB08004063 1809 240 1001 185631 TDOB08062031 2442 240 1001 3122 64 TDOB08002064 1001 240 1414 106632 TDOB08072032 1001 240 2636 3510 65 TDOB08027065 1001 240 3649 553633 TDOB08084033 2173 240 1001 2584 67 TDOB08023067 3914 240 1001 606634 TDOB08086034 1001 240 2148 2534 68 TDOB08025068 1001 240 3887 6012
69 TDOB08021069 3739 240 1001 5716

11 SEGY Header Information11.1 Header of PostStack Data
Type Start byte Description Type Start byte DescriptionI32 1 Trace number within line. I16 99 Source static correction.I32 5 Trace number within reel. I16 101 Receiver static correction.I32 9 Sequential record number. I16 103 Total static applied.I32 9 Original field record number. I16 109 Delay recording time (ms).I32 13 Trace number. I16 111 Mute time start.I32 17 Shot point number. I16 113 Mute time end.I32 21 CDP number. I16 115 No. of samples.I32 25 Trace no. within the CDP. I16 117 Sample interval in microseconds.I16 29 Trace identification code. I16 157 Year of recording.I16 31 No. of summed traces. I16 159 Julian day number (1366).I16 33 Total number of traces in CDP. I16 161 Hour of day (24 hour clock).I16 35 Data use 1=production, 2=test. I16 163 Minute of hour.I32 37 Trace offset (integer). I16 165 Second of minute.I32 41 Elevation at receiver. I16 167 Time base code 1.local,2.gmt,3.?I32 45 Elevation at source. I32 181 3D Line number.I32 61 Water depth at source. I32 185 CDP no. within 3D line.I32 65 Water depth at receiver. I32 189 2D shotpoint number (Maersk).I16 69 Scaler to be applied to elevations. I32 193 Easting of CDP.I16 71 Scaler to be applied to coordinates. I32 197 Northing of CDP.I32 73 Source easting. I16 201 Scaler to be applied to SPNO.I32 77 Source northing.I32 81 Receiver easting.I32 85 Receiver northing.I16 89 Coordinate units (m/arc).
11.2 Header of PreStack Data
Type Start byte Description Type Start byte DescriptionI32 1 Trace number within line. I16 99 Source static correction.I32 5 Trace number within reel. I16 101 Receiver static correction.I32 9 Sequential record number. I16 103 Total static applied.I32 9 Original field record number. I16 109 Delay recording time (ms).I32 13 Trace number. I16 111 Mute time start.I32 17 Shot point number. I16 113 Mute time end.I32 21 CDP number. I16 115 No. of samples.I32 25 Trace no. within the CDP. I16 117 Sample interval in microseconds.I16 29 Trace identification code. I16 157 Year of recording.I16 31 No. of summed traces. I16 159 Julian day number (1366).I16 33 Total number of traces in CDP. I16 161 Hour of day (24 hour clock).I16 35 Data use 1=production, 2=test. I16 163 Minute of hour.I32 37 Trace offset (integer). I16 165 Second of minute.I32 41 Elevation at receiver. I16 167 Time base code 1.local,2.gmt,3.?I32 45 Elevation at source. I32 181 3D Line number.I32 61 Water depth at source. I32 185 CDP no. within 3D line.I32 65 Water depth at receiver. I32 189 2D shotpoint number (Maersk).I16 69 Scaler to be applied to elevations. I32 193 Easting of CDP.I16 71 Scaler to be applied to coordinates. I32 197 Northing of CDP.I32 73 Source easting. I16 201 Scaler to be applied to SPNO.I32 77 Source northing. I16 203 Seqn record nos. (prestack only).I32 81 Receiver easting. I32 205 Source station number.I32 85 Receiver northing. I32 209 Receiver station number.I16 89 Coordinate units (m/arc).
TDOB08 2008 Processing Seismic Data Processing Report September 2008 Page 19
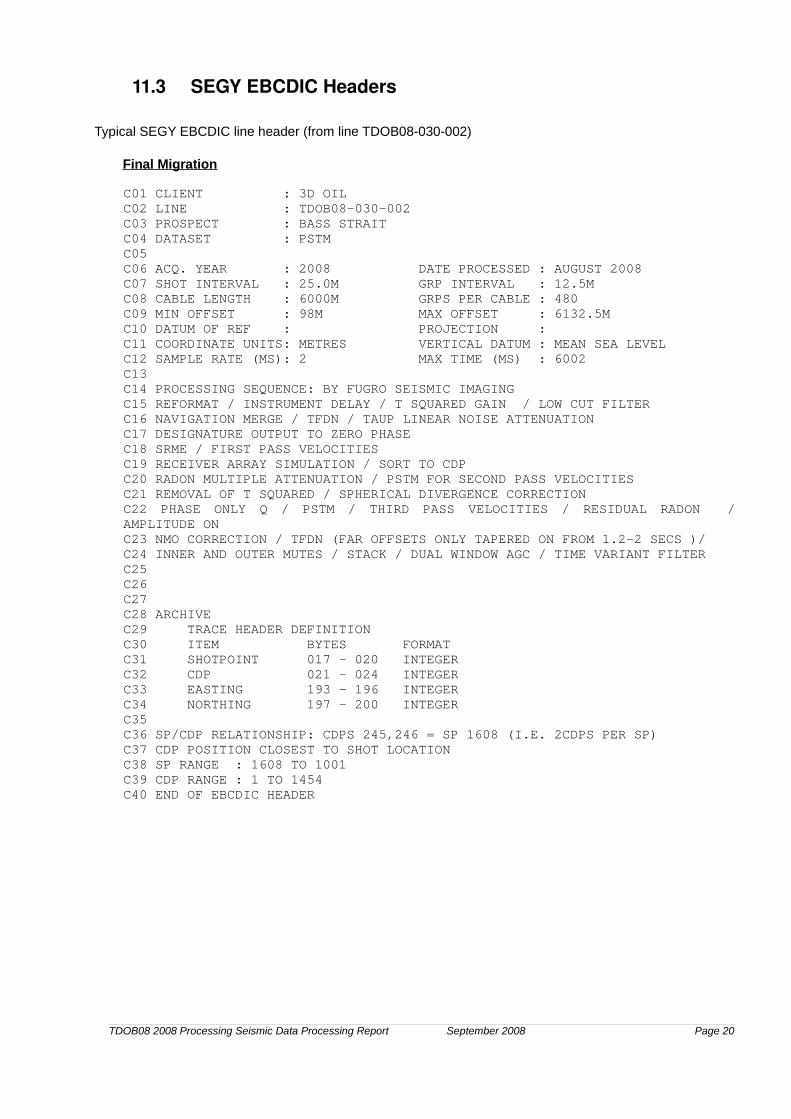
11.3 SEGY EBCDIC Headers
Typical SEGY EBCDIC line header (from line TDOB08-030-002)
Final Migration
C01 CLIENT : 3D OIL C02 LINE : TDOB08-030-002 C03 PROSPECT : BASS STRAIT C04 DATASET : PSTM C05 C06 ACQ. YEAR : 2008 DATE PROCESSED : AUGUST 2008 C07 SHOT INTERVAL : 25.0M GRP INTERVAL : 12.5M C08 CABLE LENGTH : 6000M GRPS PER CABLE : 480 C09 MIN OFFSET : 98M MAX OFFSET : 6132.5M C10 DATUM OF REF : PROJECTION : C11 COORDINATE UNITS: METRES VERTICAL DATUM : MEAN SEA LEVEL C12 SAMPLE RATE (MS): 2 MAX TIME (MS) : 6002 C13 C14 PROCESSING SEQUENCE: BY FUGRO SEISMIC IMAGING C15 REFORMAT / INSTRUMENT DELAY / T SQUARED GAIN / LOW CUT FILTER C16 NAVIGATION MERGE / TFDN / TAUP LINEAR NOISE ATTENUATION C17 DESIGNATURE OUTPUT TO ZERO PHASE C18 SRME / FIRST PASS VELOCITIES C19 RECEIVER ARRAY SIMULATION / SORT TO CDP C20 RADON MULTIPLE ATTENUATION / PSTM FOR SECOND PASS VELOCITIES C21 REMOVAL OF T SQUARED / SPHERICAL DIVERGENCE CORRECTION C22 PHASE ONLY Q / PSTM / THIRD PASS VELOCITIES / RESIDUAL RADON / AMPLITUDE ONC23 NMO CORRECTION / TFDN (FAR OFFSETS ONLY TAPERED ON FROM 1.2-2 SECS )/ C24 INNER AND OUTER MUTES / STACK / DUAL WINDOW AGC / TIME VARIANT FILTER C25 C26 C27 C28 ARCHIVE C29 TRACE HEADER DEFINITION C30 ITEM BYTES FORMAT C31 SHOTPOINT 017 - 020 INTEGER C32 CDP 021 - 024 INTEGER C33 EASTING 193 - 196 INTEGER C34 NORTHING 197 - 200 INTEGER C35 C36 SP/CDP RELATIONSHIP: CDPS 245,246 = SP 1608 (I.E. 2CDPS PER SP) C37 CDP POSITION CLOSEST TO SHOT LOCATION C38 SP RANGE : 1608 TO 1001 C39 CDP RANGE : 1 TO 1454 C40 END OF EBCDIC HEADER
TDOB08 2008 Processing Seismic Data Processing Report September 2008 Page 20

12 Data Disposition
Data Date sent
Destination
93 x 3590 cartridges containing field data. Tape # 1-93 1 x 3590 cartridge containing SOJ/EOJ Tests. tape # 94 1 x CD containing Observers/Source/Tape Logs, Timing Diagram & Shipping Proforma 1 x DVD containing P1/90 & Raw P2/94 Navigation data 1 x DVD containing QC deliverables
04/11/08
3D OilLevel 5, 164 Flinders LaneMELBOURNE VIC 3000
Attn: Tape Librarian
TDOB08 2008 Processing Seismic Data Processing Report September 2008 Page 21

13 Appendix
13.1 Far Field SignatureFar field signature with source depth of 6 m and cable depth of 8m, incorporating the fuzzy cable ghost at 8 m +/- 2m
TDOB08 2008 Processing Seismic Data Processing Report September 2008 Page 22

13.2 Far Field Signature Listing
Farfield signature was generated by Nucleus version 6.5.4 Farfield signature was generated by Marine source modelling version 5.2.4 Array name : A3040C60TT1S10 Total volume : 3040 cu.in.Source depth : 6.00 mStreamer depth : 0.00 mGroup length : 12.50 mAverage pressure : 2000 psiGhost strength : 1.00Primary amplitude : 45.57 bar mPeakpeak amplitude : 94.90 bar mP/Bratio : 17.82Bubble period (+) : 98.50 msecBubble period () : 117.50 msecSeawater temperature: 7.00 CSeawater velocity : 1517.0 m/sFilter : Lowcut frequency : 2.50 Hz Lowcut slope : 12.00 dB/oct Highcut frequency: 200.00 Hz Highcut slope : 370.00 dB/oct Instrument : Sercel SEAL mp Time of 1st sample: 64.00 msec i.e. index of time zero = 33.00Sample interval : 2.00 msecFarfield position : Distance : 9000.00 m Azimuth : 0.00 deg Angle of vertical : 0.00 deg Amplitudes are in bar mTime is increasing horizontally
0.000 0.000 0.000 0.000 0.000 0.000 0.000
0.001 0.001 0.002 0.002 0.001 0.007 0.016
0.024 0.022 0.003 0.039 0.096 0.145 0.150
0.073 0.103 0.353 0.593 0.696 0.521 0.020
0.913 2.021 3.133 4.230 8.557 44.145 29.803
12.759 8.241 47.492 31.943 9.944 7.465 0.272
5.436 4.155 0.721 2.472 0.163 1.083 0.793
0.148 0.535 0.241 0.093 0.075 0.452 0.327
0.572 0.638 0.694 0.936 1.018 1.212 1.421
1.571 1.658 1.498 1.230 1.001 0.945 1.184
1.581 1.963 2.164 2.065 1.742 1.400 1.267
1.473 1.910 2.355 2.700 2.954 3.126 3.089
2.611 1.676 0.596 0.214 0.552 0.572 0.566
0.726 1.044 1.397 1.756 2.064 2.178 2.025
1.623 1.101 0.621 0.274 0.097 0.090 0.226
TDOB08 2008 Processing Seismic Data Processing Report September 2008 Page 23

0.455 0.712 0.959 1.215 1.452 1.581 1.562
1.387 1.118 0.853 0.618 0.415 0.241 0.094
0.021 0.111 0.183 0.235 0.278 0.328 0.387
0.450 0.495 0.479 0.392 0.265 0.147 0.091
0.112 0.178 0.246 0.281 0.267 0.203 0.108
0.014 0.044 0.046 0.004 0.083 0.160 0.213
0.229 0.204 0.139 0.046 0.063 0.172 0.263
0.317 0.326 0.293 0.225 0.139 0.047 0.049
0.142 0.233 0.317 0.394 0.462 0.518 0.563
0.594 0.610 0.612 0.599 0.569 0.518 0.438
0.322 0.175 0.012 0.149 0.290 0.400 0.476
0.522 0.546 0.559 0.571 0.588 0.608 0.619
0.612 0.580 0.524 0.453 0.372 0.288 0.204
0.123 0.048 0.018 0.075 0.122 0.156 0.179
0.190 0.191 0.182 0.165 0.142 0.115 0.088
0.063 0.043 0.029 0.022 0.022 0.028 0.038
0.051 0.067 0.083 0.100 0.118 0.137 0.156
0.176 0.195 0.211 0.224 0.232 0.234 0.229
0.217 0.199 0.173 0.141 0.103 0.060 0.015
0.029 0.067 0.097 0.118 0.132 0.139 0.140
0.138 0.133 0.127 0.120 0.112 0.103 0.092
0.077 0.061 0.043 0.025 0.009 0.012 0.016
0.016 0.017 0.005 0.001 0.011 0.028 0.051
0.073 0.096 0.117 0.134 0.147 0.153 0.153
0.146 0.133 0.117 0.097 0.075 0.054 0.035
0.017 0.003 0.009 0.018 0.024 0.029 0.032
0.035 0.039 0.044 0.050 0.059 0.069 0.081
0.093 0.106 0.120 0.134 0.149 0.163 0.177
0.190 0.202 0.212 0.219 0.224 0.224 0.220
0.211 0.198 0.179 0.155 0.126 0.093 0.057
0.019 0.020 0.059 0.096 0.130 0.161 0.188
0.210 0.228 0.240 0.248 0.252 0.251 0.246
0.238 0.228 0.215 0.201 0.185 0.168 0.150
0.132 0.113 0.094 0.074 0.054 0.034 0.013
0.007 0.027 0.045 0.063 0.079 0.093 0.104
0.114 0.120 0.125 0.127 0.127 0.126 0.123
0.120 0.116 0.112 0.107 0.104 0.100 0.098
0.095 0.093 0.091 0.090 0.088 0.085 0.083
0.079 0.075 0.070 0.063 0.055 0.046 0.035
0.023 0.010 0.004 0.019 0.035 0.051 0.067
0.083 0.098 0.111 0.124 0.134 0.143 0.148
0.151 0.152 0.150 0.145 0.138 0.130 0.119
TDOB08 2008 Processing Seismic Data Processing Report September 2008 Page 24
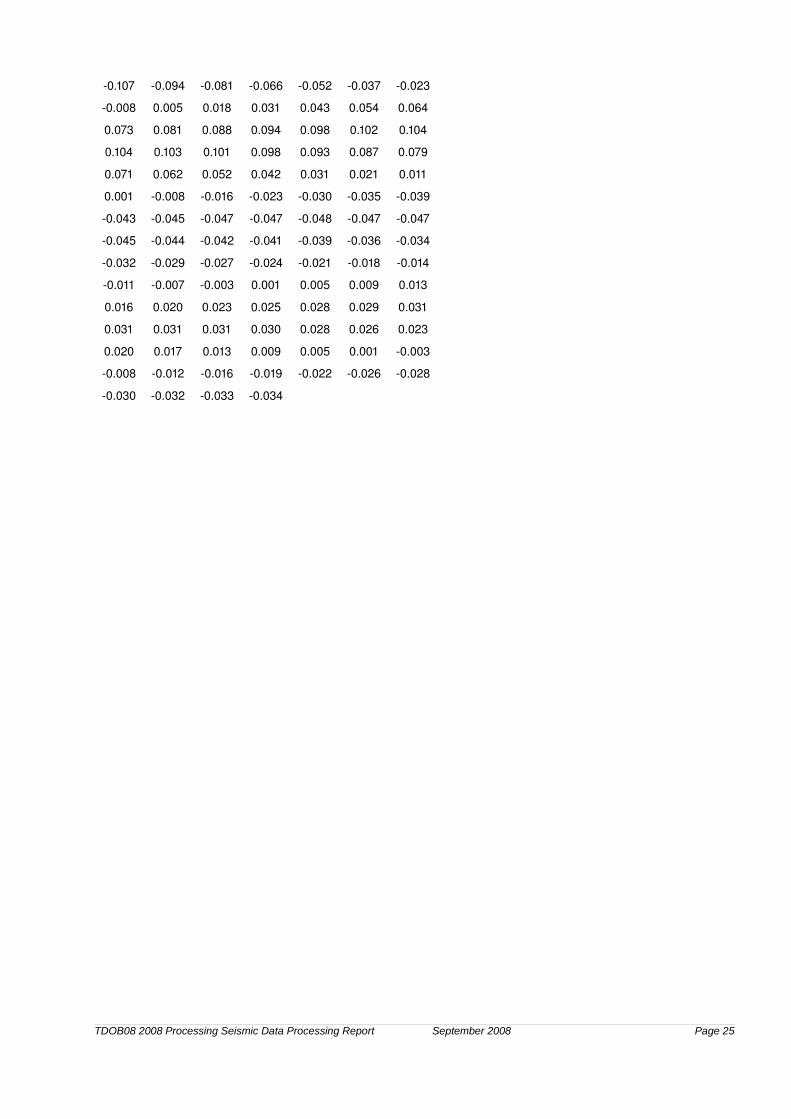
0.107 0.094 0.081 0.066 0.052 0.037 0.023
0.008 0.005 0.018 0.031 0.043 0.054 0.064
0.073 0.081 0.088 0.094 0.098 0.102 0.104
0.104 0.103 0.101 0.098 0.093 0.087 0.079
0.071 0.062 0.052 0.042 0.031 0.021 0.011
0.001 0.008 0.016 0.023 0.030 0.035 0.039
0.043 0.045 0.047 0.047 0.048 0.047 0.047
0.045 0.044 0.042 0.041 0.039 0.036 0.034
0.032 0.029 0.027 0.024 0.021 0.018 0.014
0.011 0.007 0.003 0.001 0.005 0.009 0.013
0.016 0.020 0.023 0.025 0.028 0.029 0.031
0.031 0.031 0.031 0.030 0.028 0.026 0.023
0.020 0.017 0.013 0.009 0.005 0.001 0.003
0.008 0.012 0.016 0.019 0.022 0.026 0.028
0.030 0.032 0.033 0.034
TDOB08 2008 Processing Seismic Data Processing Report September 2008 Page 25

Far field signature as supplied with no ghost applied.
TDOB08 2008 Processing Seismic Data Processing Report September 2008 Page 26

TauP transform of cdp 300 line TDOB08030002
TDOB08 2008 Processing Seismic Data Processing Report September 2008 Page 27

TauP transform of cdp 300 line TDOB08030002 mute displayed
TDOB08 2008 Processing Seismic Data Processing Report September 2008 Page 28

Line TDOB08030002 cdp 300 pre radon
TDOB08 2008 Processing Seismic Data Processing Report September 2008 Page 29

Line TDOB08030002 cdp 300 post radon
TDOB08 2008 Processing Seismic Data Processing Report September 2008 Page 30

Line TDOB08030002 cdp 300 pre radon zoomed
TDOB08 2008 Processing Seismic Data Processing Report September 2008 Page 31

Line TDOB08030002 cdp 300 post radon zoomed
TDOB08 2008 Processing Seismic Data Processing Report September 2008 Page 32
Recommended


