GE Hybrid Power Generation Systems
SECASECASolid Oxide Fuel Cell ProgramSolid Oxide Fuel Cell Program
Fourth Annual Solid State Energy Conversion Alliance MeetingApril 15-16, 2003
Seattle, WA
Copyright 2003 General Electric Company
M-4thSECA.ppt- 2
GE Hybrid Power Generation Systems
Copyright 2003 General Electric Company
Program ObjectiveProgram Objective
• Overall objective– Demonstrate a fuel-flexible, modular 3-to-10-kW solid
oxide fuel cell (SOFC) system that can be configured to create highly efficient, cost-competitive, and reliable power plants tailored to specific markets
• Development team– GE Power Systems
Torrance, CASchenectady, NYGreenville, SC
– GE Global ResearchNiskayuna, NY

M-4thSECA.ppt- 3
GE Hybrid Power Generation Systems
Copyright 2003 General Electric Company
SOFC System ConceptSOFC System Concept
M-4thSECA.ppt- 4
GE Hybrid Power Generation Systems
Copyright 2003 General Electric Company
Key System FeaturesKey System Features
• SOFC– High-performance reduced-temperature cells– Operation on light hydrocarbons– Tape calendering manufacturing process
• Fuel processor– Low-cost, fuel-flexible fuel processor design– Catalytic process– Pre-reforming function
• Other subsystems– Integrated thermal management– Flexible control subsystem

M-4thSECA.ppt- 5
GE Hybrid Power Generation Systems
Copyright 2003 General Electric Company
Program FeaturesProgram FeaturesDEMONSTRATION
OF FUEL FLEXIBLEPROTOTYPE
SYSTEM
PROTOTYPEDEMONSTRATION
TECHNOLOGY IMPROVEMENTAND COST REDUCTION
PACKAGED SYSTEMDEMONSTRATION
TECHNOLOGY ADVANCEMENTAND COST REDUCTION
FIELD TEST OFPACKAGED SYSTEM
SELECTEDAPPLICATIONFOR PHASES
II, III
DEMONSTRATIONOF PACKAGED SYSTEM
FOR SELECTEDAPPLICATION
FIELD TEST OFPACKAGED SYSTEM
FOR SELECTEDAPPLICATION
• IMPROVED PERFORMANCE, YIELDS, EFFICIENCY
• ENABLE INCREASED MANUF. AUTOMATION
• DESIGN PACKAGING
PHASE I PHASE II PHASE III
DESIGN, STACK DEVELOPMENT, FUEL PROCESSING, THERMAL MANAGEMENT, CONTROLS/SENSORS, POWER ELECTRONICS
KEY TECHNOLOGY DEVELOPMENT
• ADVANCED MATERIALS/ PROCESSES• ENABLE FULL MANUF. AUTOMATION• OPTIMIZE PACKAGING
MARKET ANALYSIS AND COST ESTIMATES
MARKET ANALYSIS AND COST ESTIMATES
COST ESTIMATES

M-4thSECA.ppt- 6
GE Hybrid Power Generation Systems
Copyright 2003 General Electric Company
Phase I Work ElementsPhase I Work Elements
• System analysis
• Cost estimate
• Stack technology development
• Fuel processing
• Thermal management
• Control and sensor development
• Power electronics
• System prototype demonstration
M-4thSECA.ppt- 7
GE Hybrid Power Generation Systems
Copyright 2003 General Electric Company
Development ApproachesDevelopment Approaches
• System approach– Design for Six Sigma
• Development focus to meet SECA targets– High performance– Low cost– Reliability– Modularity– Fuel flexibility

M-4thSECA.ppt- 8
GE Hybrid Power Generation Systems
Copyright 2003 General Electric Company
System Design and Analysis ApproachSystem Design and Analysis Approach
• Propose Conceptual Design• Steady-state Model• Assume Components &Performances• Detailed Thermal/TransientSystem Model
• DesignComponents• System Analysis• Trade Studies
• Compare to Requirements• Identify Gaps
ConceptualSystem Definition
TechnologyGaps
System Definition
TechnologyDevelopment
System RequirementsTechnology Base

M-4thSECA.ppt- 9
GE Hybrid Power Generation Systems
Copyright 2003 General Electric Company
Baseline System ConceptBaseline System Concept
Fuel Processor
Steam Generator
Natural GasDesulfurizer
P Deionizer
Fuel/AirPreheater
FUEL
WATER1 WATER2
EXHAUST
STEAM
HOTGASC
HOT GASE
ANIN
PWATER
C
AirPreheater
FCAIR
CPXAIR
AC Power
to loads
S
SOFC Stack Assembly
CAIN
C
AIR
NATGAS
Power Electronics
StartupPower
AC Power
M-4thSECA.ppt- 10
GE Hybrid Power Generation Systems
Copyright 2003 General Electric Company
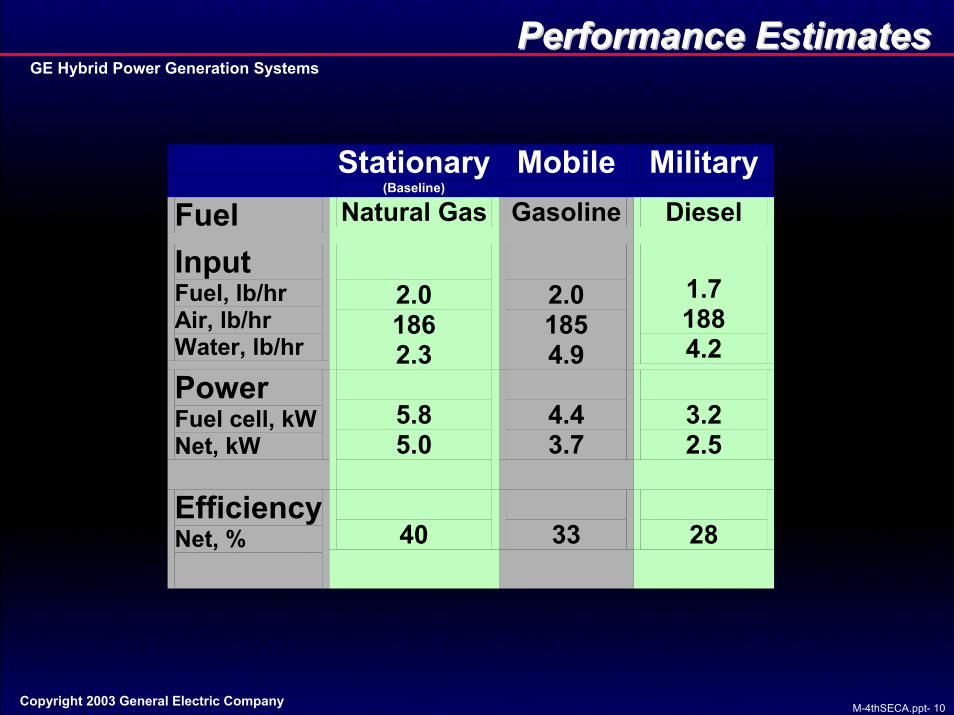
Performance EstimatesPerformance Estimates
Stationary(Baseline)
Mobile MilitaryFuel Natural Gas Gasoline Diesel
Input Fuel, lb/hr Air, lb/hr Water, lb/hr
2.0 186 2.3
2.0 185 4.9
1.7 188 4.2
Power Fuel cell, kWNet, kW
5.8 5.0
4.4 3.7
3.2 2.5
EfficiencyNet, %
40
33
28
M-4thSECA.ppt- 11
GE Hybrid Power Generation Systems
Copyright 2003 General Electric Company
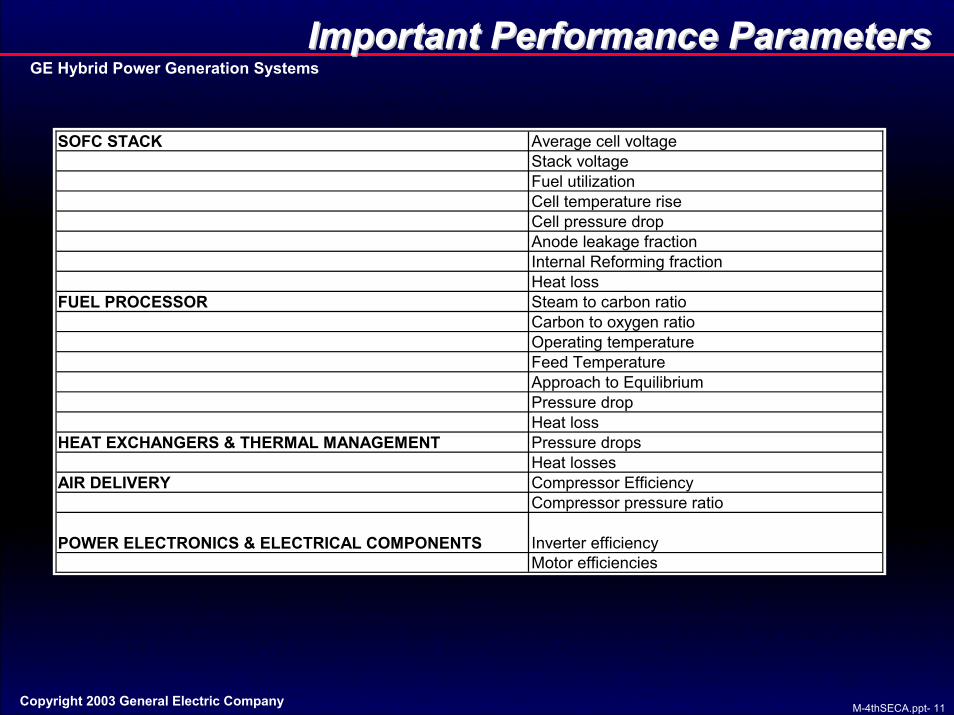
Important Performance ParametersImportant Performance Parameters
SOFC STACK Average cell voltageStack voltageFuel utilizationCell temperature riseCell pressure dropAnode leakage fractionInternal Reforming fractionHeat loss
FUEL PROCESSOR Steam to carbon ratioCarbon to oxygen ratioOperating temperatureFeed TemperatureApproach to EquilibriumPressure dropHeat loss
HEAT EXCHANGERS & THERMAL MANAGEMENT Pressure dropsHeat losses
AIR DELIVERY Compressor EfficiencyCompressor pressure ratio
POWER ELECTRONICS & ELECTRICAL COMPONENTS Inverter efficiencyMotor efficiencies
M-4thSECA.ppt- 12
GE Hybrid Power Generation Systems
Copyright 2003 General Electric Company
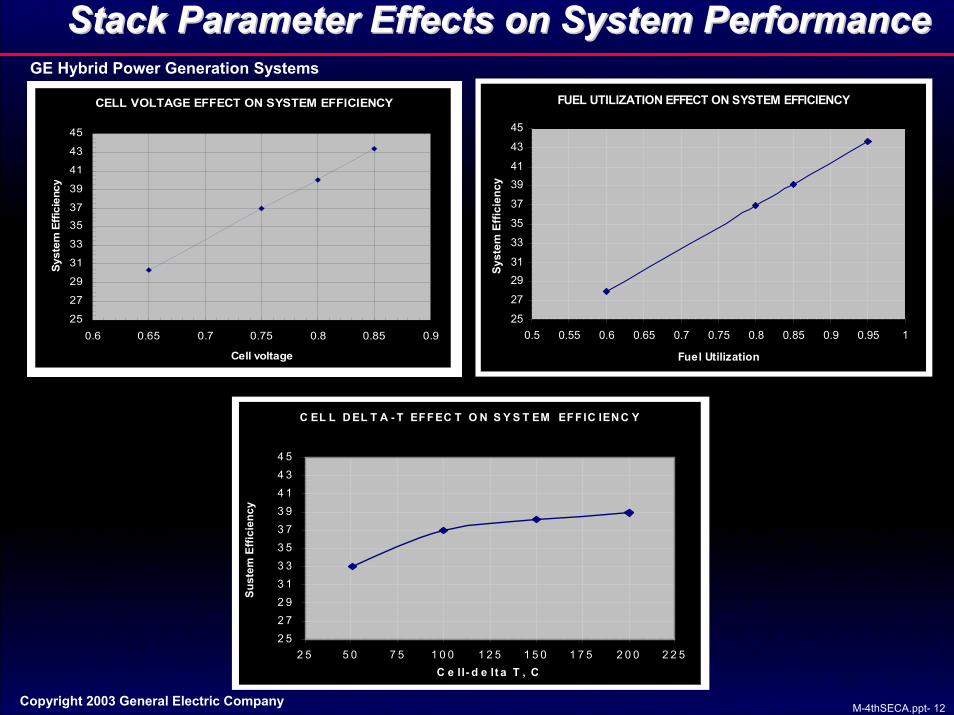
Stack Parameter Effects on System PerformanceStack Parameter Effects on System Performance
FUEL UTILIZATION EFFECT ON SYSTEM EFFICIENCY
25
27
2931
33
35
37
3941
43
45
0.5 0.55 0.6 0.65 0.7 0.75 0.8 0.85 0.9 0.95 1
Fuel Utilization
Syst
em E
ffici
ency
CELL VOLTAGE EFFECT ON SYSTEM EFFICIENCY
25
27
29
31
33
3537
39
41
43
45
0.6 0.65 0.7 0.75 0.8 0.85 0.9
Cell voltage
Syst
em E
ffici
ency
C EL L D EL T A - T EFFEC T O N S Y S T EM EFF IC IEN C Y
2 52 72 93 13 33 53 73 94 14 34 5
2 5 5 0 7 5 1 0 0 1 2 5 1 5 0 1 7 5 2 0 0 2 2 5C e ll- d e lt a T , C
Sust
em E
ffici
ency

M-4thSECA.ppt- 13
GE Hybrid Power Generation Systems
Copyright 2003 General Electric Company
Fuel Processor Effects on System PerformanceFuel Processor Effects on System Performance
0.30
0.32
0.34
0.36
0.38
0.40
0.42
0.44
0 0.5 1.0 1.5 2.0 2.5 3.0 3.5
Steam to Carbon Ratio
SYST
EM E
FFIC
IEN
CY
0.30
0.32
0.34
0.36
0.38
0.40
0.42
0.44
0 0.5 1.0 1.5 2.0 2.5 3.0 3.5
Carbon to Oxygen Ratio (C/O)SY
STEM
EFF
ICIE
NC
Y

M-4thSECA.ppt- 14
GE Hybrid Power Generation Systems
Copyright 2003 General Electric Company
Schematic of Method for Cost EstimationSchematic of Method for Cost Estimation
Define SystemIdentify Components
Establish Performance Specifications
Size Components
Identify BOP Suppliers/Manufacturers
Calculate Costs
Solicit Cost Information
Perform System Cost Estimation
Map Manufacturing Process
Design Stack, Fuel processor
SOFC Stack and Fuel ProcessorBOP Components
Determine Production Rates
Raw Materials CostEquipment CostLabor CostFacilities/Utilities Cost
Vendors
Engineering Judgment
Assembly Costs

M-4thSECA.ppt- 15
GE Hybrid Power Generation Systems
Copyright 2003 General Electric Company
Stack Material Cost EstimatesStack Material Cost Estimates
Cell Material
Costs
Cell Design
Cell Size
Number of Cells per System
Cell Cost References
CostsSystem Power
Cell Voltage
Stack Size
Polarization Curve
Number of Cells per Stack
CellMaterial
Costs
Cell Design
Cell Size
Number of Cells per System
Cell Cost References
Stack MaterialCosts
System Power
Cell Voltage
Stack Size
Polarization Curve
Number of Cells per Stack
SECA Baseline Manufacturing
Plan
Costs
Stack Equipment
Costs
SECA Baseline Manufacturing
Plan
Stack LaborCosts
StackEquipment
Costs
Stack Facility Costs
Stack FacilityCosts
Production Volume
Ancillary Parts Cost References Ancillaries
MaterialCosts
Production Volume
Ancillary Parts Cost References Ancillaries
MaterialCosts
Stack Material
Cell CompositionCell Composition
Layers Characteristics
Layers Characteristics
Manufacturing Yield
Manufacturing Yield
M-4thSECA.ppt- 16
GE Hybrid Power Generation Systems
Copyright 2003 General Electric Company
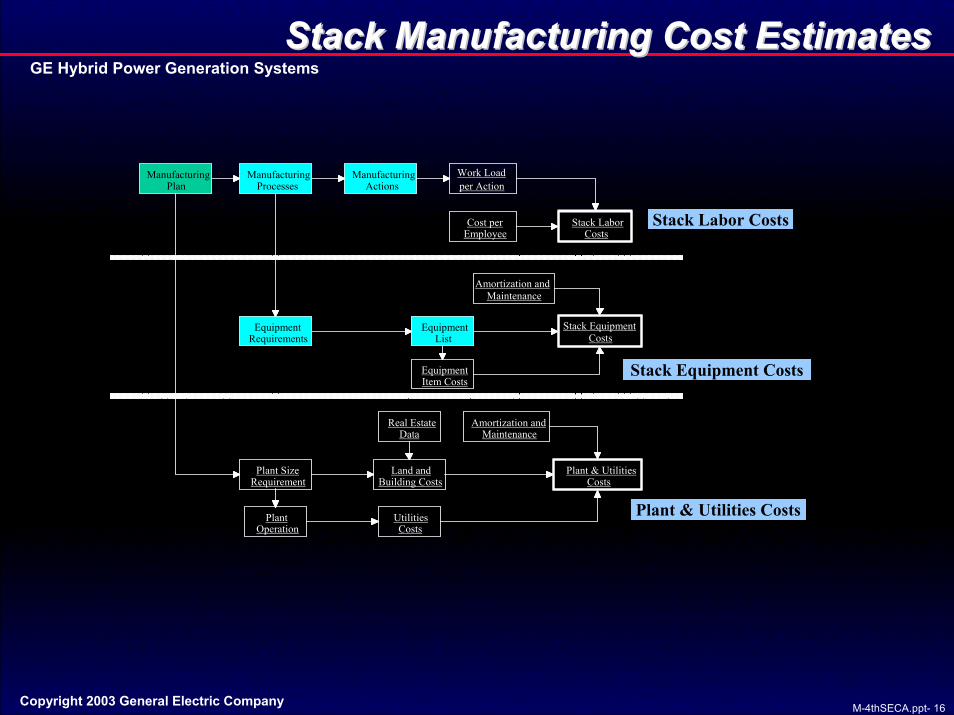
Stack Manufacturing Cost EstimatesStack Manufacturing Cost Estimates
Manufacturing Plan
Manufacturing Processes
Manufacturing Actions
Work Load per Action
Stack Equipment Costs
Stack Labor Costs
Equipment Item Costs
Equipment List
Cost per Employee
Equipment Requirements
Plant Size Requirement
Land and Building Costs
Amortization and Maintenance
Amortization and Maintenance
Plant & Utilities Costs
Utilities Costs
Plant Operation
Real Estate Data
Manufacturing Plan
Manufacturing Processes
Manufacturing Actions
Work Loadper Action
Stack EquipmentCosts
Stack LaborCosts
EquipmentItem Costs
Equipment List
Cost perEmployee
Equipment Requirements
Plant SizeRequirement
Land andBuilding Costs
Amortization andMaintenance
Amortization andMaintenance
Plant & UtilitiesCosts
UtilitiesCosts
PlantOperation
Real EstateData
Stack Labor Costs
Stack Equipment Costs
Plant & Utilities Costs
M-4thSECA.ppt- 17
GE Hybrid Power Generation Systems
Copyright 2003 General Electric Company
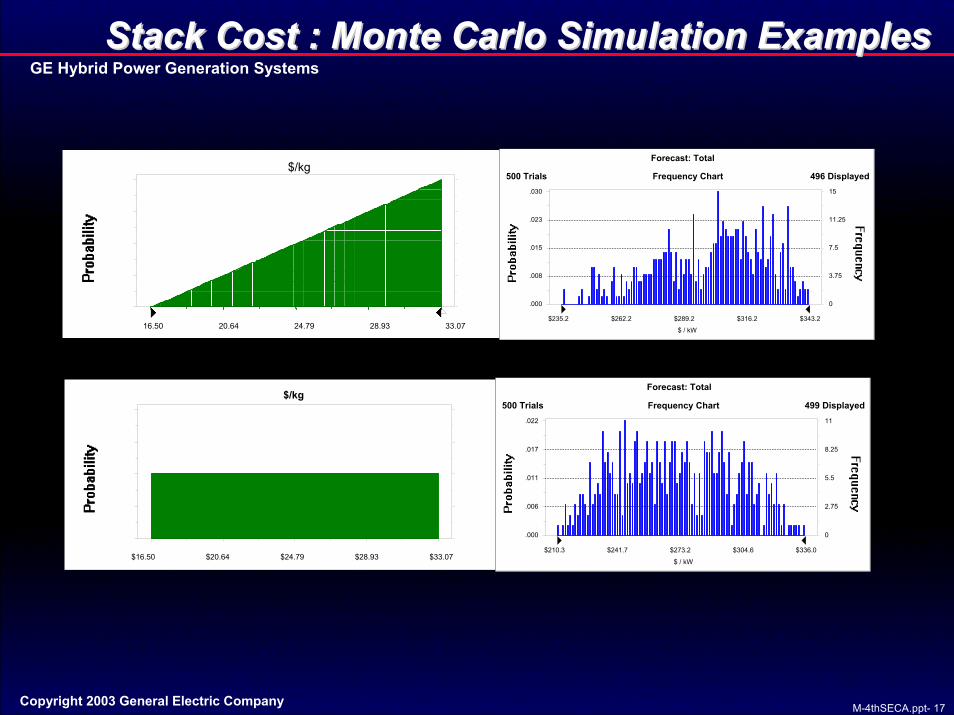
Stack Cost : Monte Carlo Simulation ExamplesStack Cost : Monte Carlo Simulation Examples
16.50 20.64 24.79 28.93 33.07
$/kgFrequency Chart
$ / kW
.000
.008
.015
.023
.030
0
3.75
7.5
11.25
15
$235.2 $262.2 $289.2 $316.2 $343.2
500 Trials 496 Displayed
Forecast: Total
$16.50 $20.64 $24.79 $28.93 $33.07
$/kgFrequency Chart
$ / kW
.000
.006
.011
.017
.022
0
2.75
5.5
8.25
11
$210.3 $241.7 $273.2 $304.6 $336.0
500 Trials 499 Displayed
Forecast: Total
M-4thSECA.ppt- 18
GE Hybrid Power Generation Systems
Copyright 2003 General Electric Company
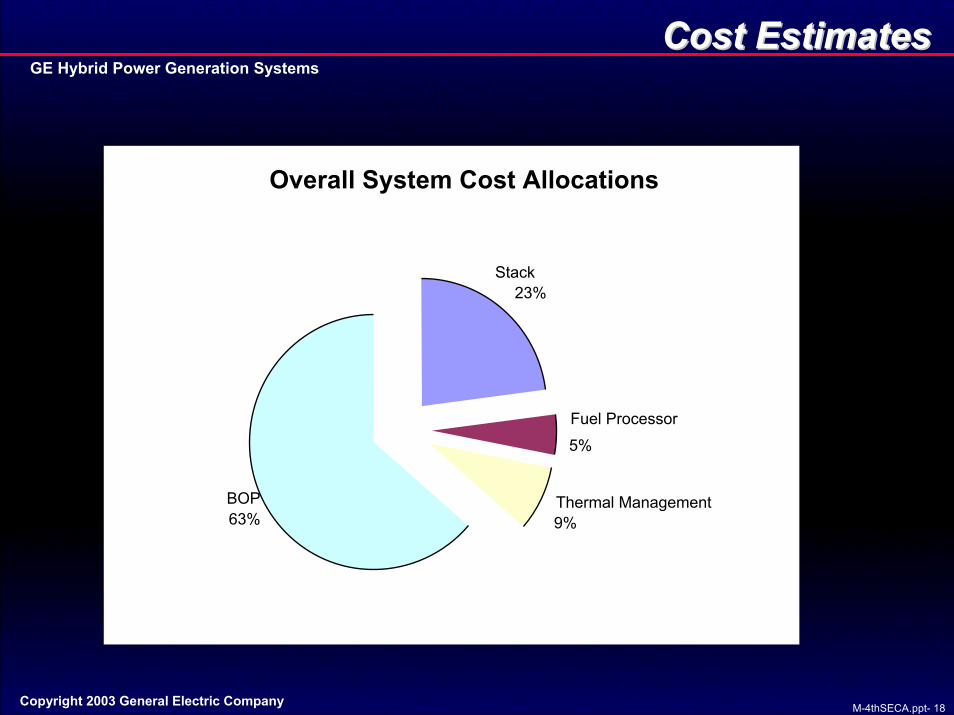
Cost EstimatesCost Estimates
Overall System Cost Allocations
BOP63%
Overall System Cost Allocations
Stack23%
Fuel Processor5%
Thermal Management9%
BOP63%
M-4thSECA.ppt- 19
GE Hybrid Power Generation Systems
Copyright 2003 General Electric Company
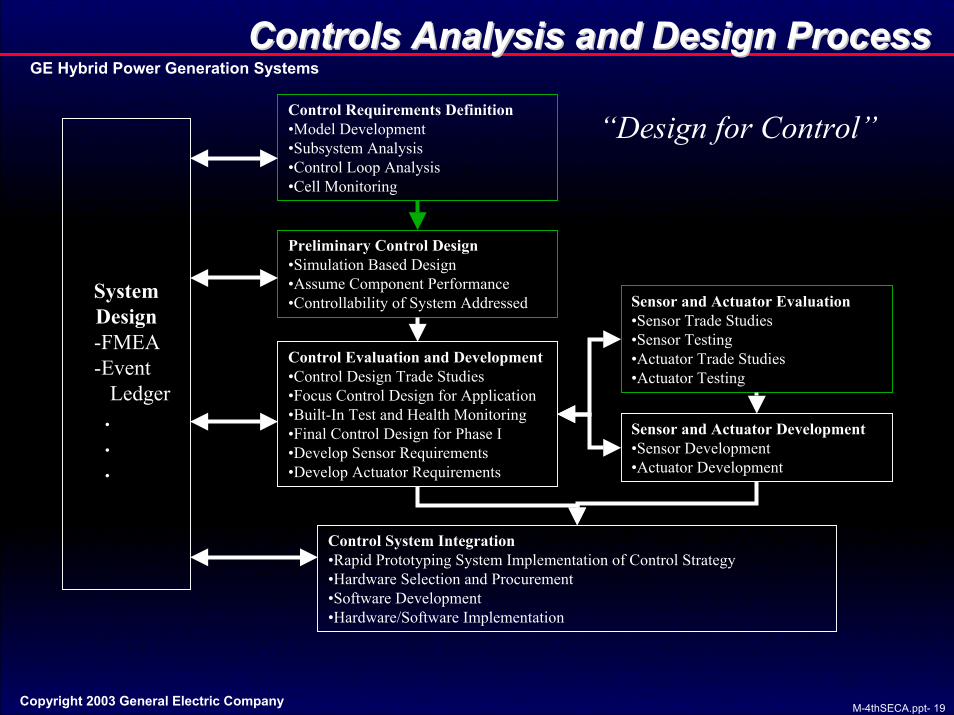
Controls Analysis and Design ProcessControls Analysis and Design Process
Control Requirements Definition•Model Development•Subsystem Analysis•Control Loop Analysis•Cell Monitoring
“Design for Control”
Preliminary Control Design•Simulation Based Design•Assume Component Performance•Controllability of System Addressed
Control Evaluation and Development•Control Design Trade Studies•Focus Control Design for Application•Built-In Test and Health Monitoring•Final Control Design for Phase I•Develop Sensor Requirements•Develop Actuator Requirements
Sensor and Actuator Evaluation•Sensor Trade Studies•Sensor Testing•Actuator Trade Studies•Actuator Testing
Sensor and Actuator Development•Sensor Development•Actuator Development
Control System Integration•Rapid Prototyping System Implementation of Control Strategy•Hardware Selection and Procurement•Software Development•Hardware/Software Implementation
System Design-FMEA-Event
Ledger...
M-4thSECA.ppt- 20
GE Hybrid Power Generation Systems
Copyright 2003 General Electric Company
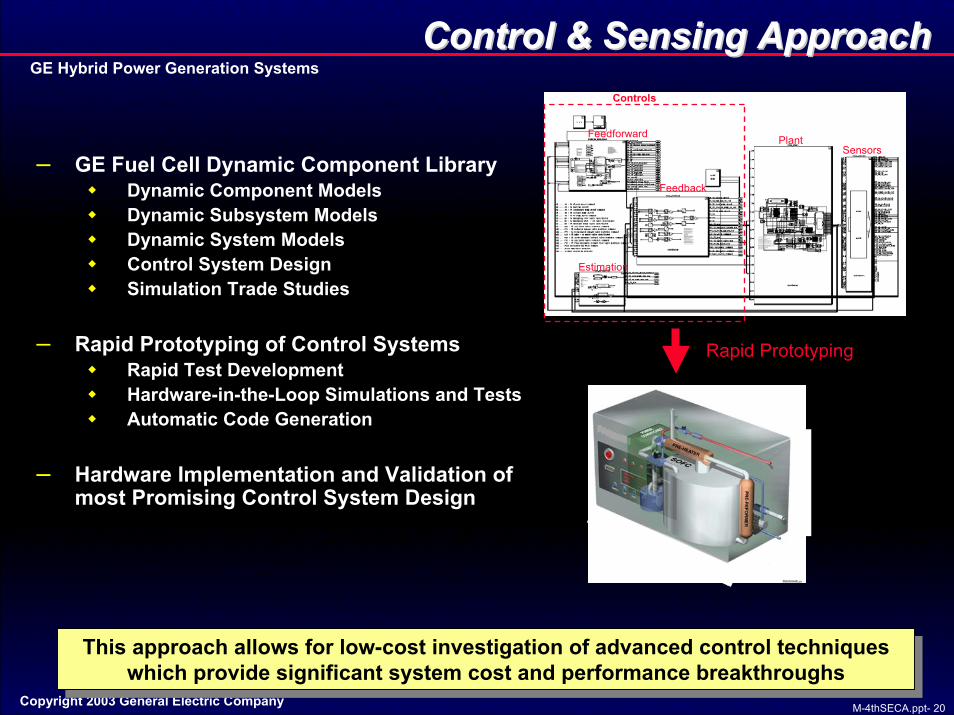
Control & Sensing ApproachControl & Sensing Approach
PlantSensors
Feedback
Feedforward
Estimation
Controls
– GE Fuel Cell Dynamic Component LibraryDynamic Component ModelsDynamic Subsystem ModelsDynamic System ModelsControl System DesignSimulation Trade Studies
– Rapid Prototyping of Control SystemsRapid Test DevelopmentHardware-in-the-Loop Simulations and TestsAutomatic Code Generation
– Hardware Implementation and Validation of most Promising Control System Design
Rapid Prototyping
This approach allows for low-cost investigation of advanced control techniques which provide significant system cost and performance breakthroughs
This approach allows for low-cost investigation of advanced control techniques which provide significant system cost and performance breakthroughs

M-4thSECA.ppt- 21
GE Hybrid Power Generation Systems
Copyright 2003 General Electric Company
StartupStartup
• Four start-up strategies have been identified
• Simulation based trade studies are currently being conducted to optimize start-up strategy
• Control Requirements– Performance– Cost– Reliability– Safety
YES
Set reactant flows to warm-upconditions
System heating
SteamAvailable?
Start Reformer
StackWarm?
Drawtest loadStand-by for service
NO
YES
NO
Start-up Desired
BrainstormStrategies
Optimized Start-up StrategyApproach Modeling
M-4thSECA.ppt- 22
GE Hybrid Power Generation Systems
Copyright 2003 General Electric Company
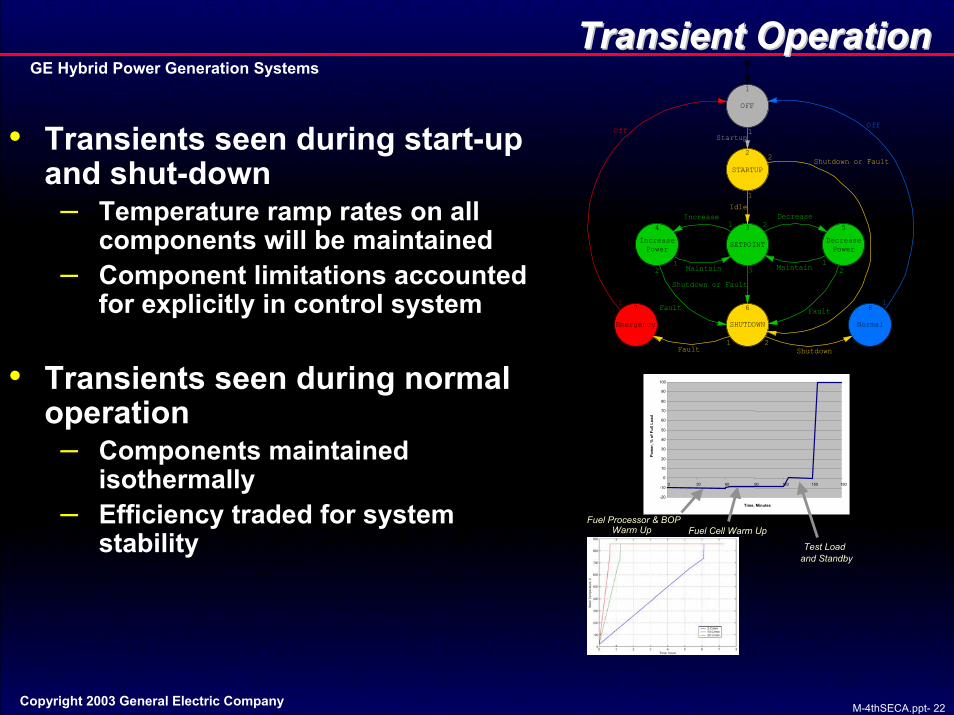
Transient OperationTransient Operation1
OFF
1
Off
1
Off
2
STARTUP
1Startup
3
SETPOINT
1
Idle
1Maintain
1Maintain
4
IncreasePower
1Increase
5
DecreasePower
2Decrease
6
SHUTDOWN
3
Shutdown or Fault
2
Fault
2
Fault
2 Shutdown or Fault
7
Emergency
1Fault
8
Normal
2Shutdown
• Transients seen during start-up and shut-down– Temperature ramp rates on all
components will be maintained– Component limitations accounted
for explicitly in control system
• Transients seen during normal operation– Components maintained
isothermally– Efficiency traded for system
stability Fuel Cell Warm Up
Test Load and Standby
-20
-10
0
10
20
30
40
50
60
70
80
90
100
0 30 60 90 120 150 180
Time, Minutes
Pow
er, %
of F
ull L
oad
Fuel Processor & BOPWarm Up
M-4thSECA.ppt- 23
GE Hybrid Power Generation Systems
Copyright 2003 General Electric Company
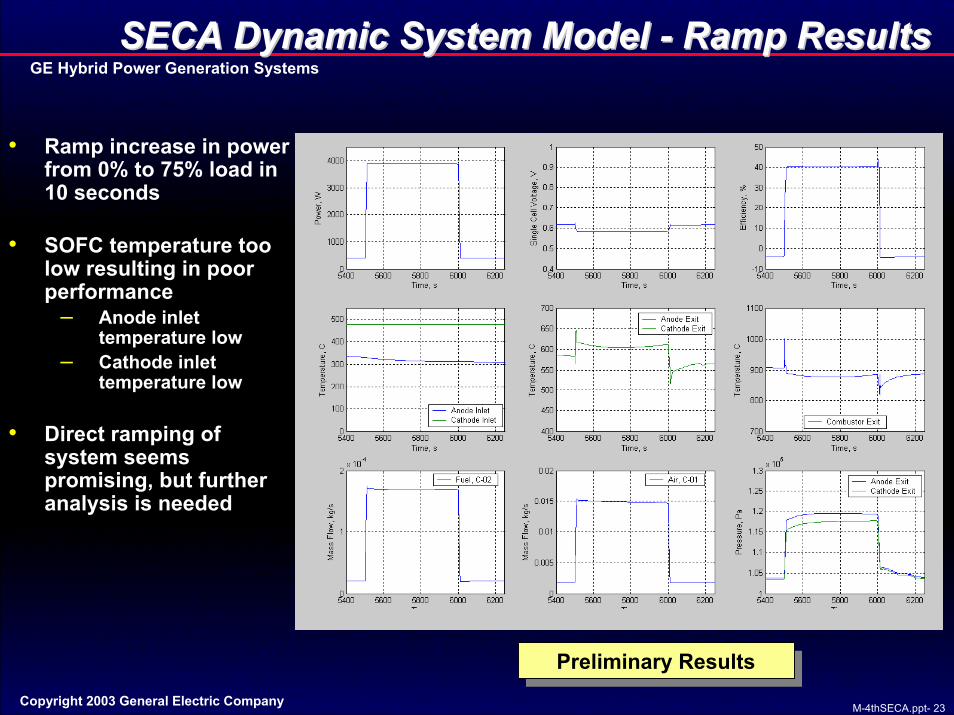
SECA Dynamic System Model SECA Dynamic System Model -- Ramp ResultsRamp Results
• Ramp increase in power from 0% to 75% load in 10 seconds
• SOFC temperature too low resulting in poor performance
– Anode inlet temperature low
– Cathode inlet temperature low
• Direct ramping of system seems promising, but further analysis is needed
Preliminary ResultsPreliminary Results
M-4thSECA.ppt- 24
GE Hybrid Power Generation Systems
Copyright 2003 General Electric Company
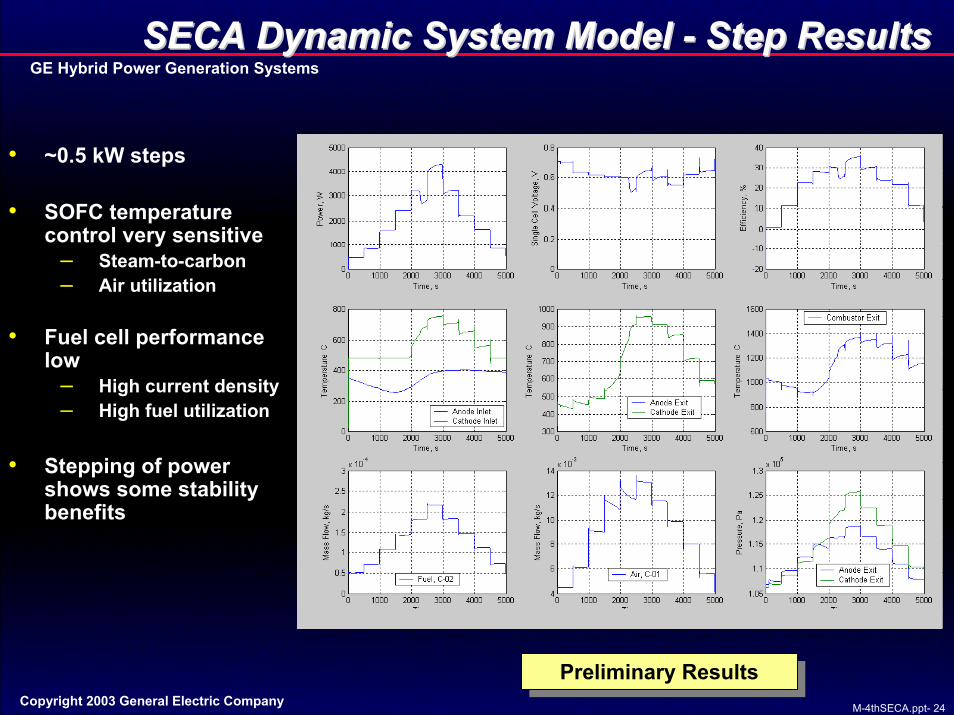
SECA Dynamic System Model SECA Dynamic System Model -- Step ResultsStep Results
• ~0.5 kW steps
• SOFC temperature control very sensitive
– Steam-to-carbon – Air utilization
• Fuel cell performance low
– High current density– High fuel utilization
• Stepping of power shows some stability benefits
Preliminary ResultsPreliminary Results

M-4thSECA.ppt- 25
GE Hybrid Power Generation Systems
Copyright 2003 General Electric Company
Tape Tape Calendering Calendering Process Process
Fracture SurfaceLaMnO3Cathode
ZrO2Electrolyte
NiO/ZrO2Anode
Tape Forming Rolling Rolling
Electrolyte
SupportElectrode
SupportElectrode
BilayerBilayer
Thin Electrolyteon SupportElectrode Layer
M-12569.ppt
ElectrodeApplication Firing Cutting

M-4thSECA.ppt- 26
GE Hybrid Power Generation Systems
Copyright 2003 General Electric Company
NDE Inspection of Green TapesNDE Inspection of Green Tapes
• X-Ray inspection of three tapes in various stages of processing, the radiographs show indications of higher and lower density regions
M-4thSECA.ppt- 27
GE Hybrid Power Generation Systems
Copyright 2003 General Electric Company
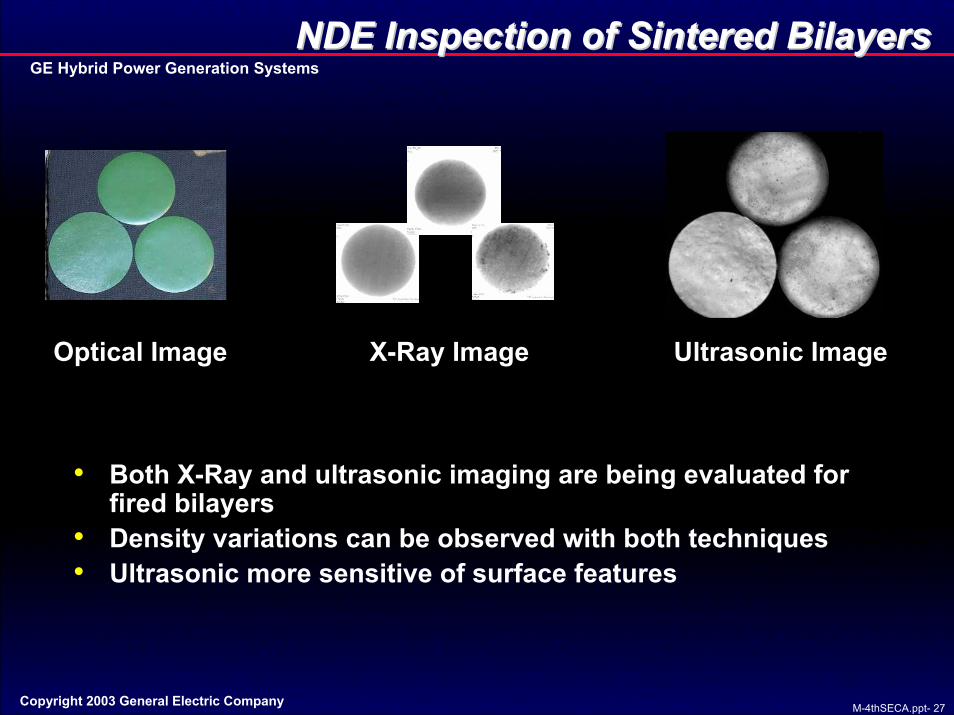
NDE Inspection of Sintered BilayersNDE Inspection of Sintered Bilayers
Ultrasonic ImageX-Ray ImageOptical Image
• Both X-Ray and ultrasonic imaging are being evaluated for fired bilayers
• Density variations can be observed with both techniques• Ultrasonic more sensitive of surface features
M-4thSECA.ppt- 28
GE Hybrid Power Generation Systems
Copyright 2003 General Electric Company
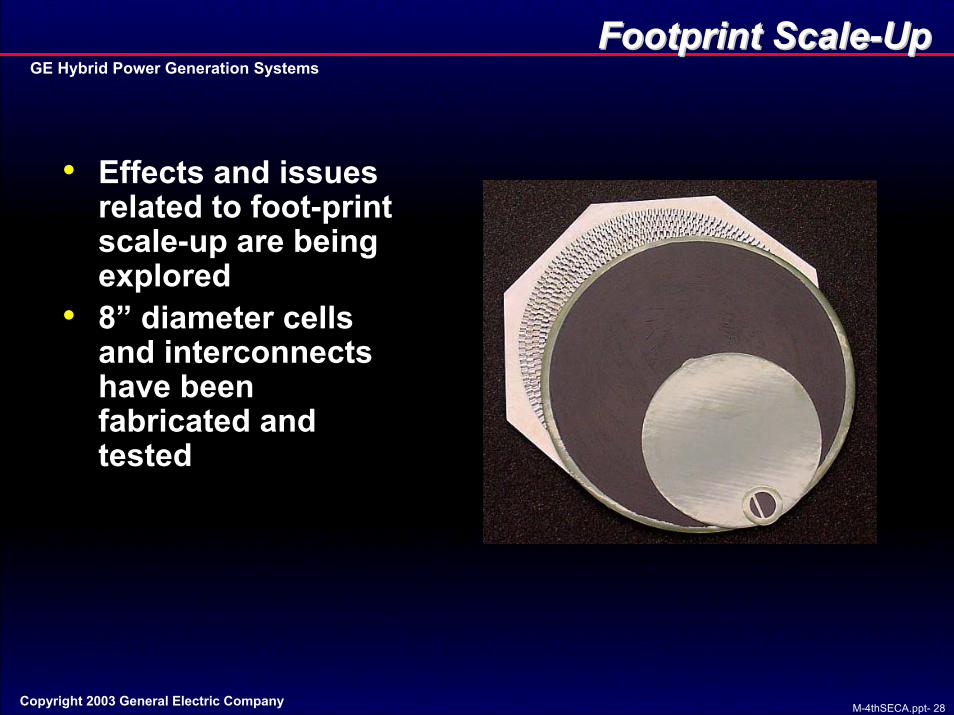
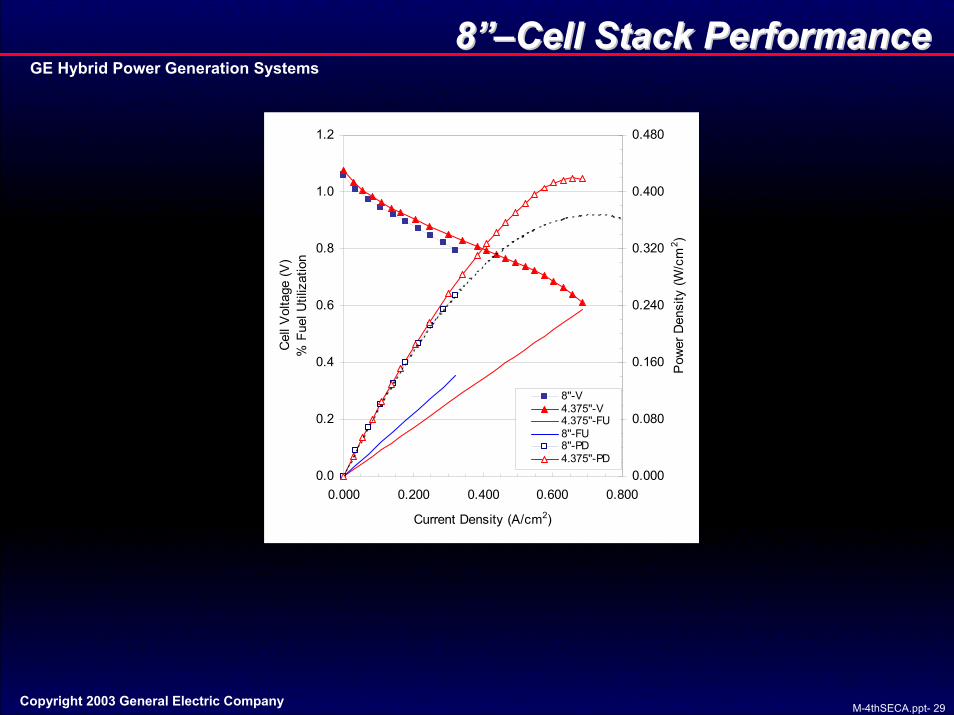
Footprint ScaleFootprint Scale--UpUp
• Effects and issues related to foot-print scale-up are being explored
• 8” diameter cells and interconnects have been fabricated and tested
M-4thSECA.ppt- 29
GE Hybrid Power Generation Systems
Copyright 2003 General Electric Company
8”8”––Cell Stack PerformanceCell Stack Performance
0.0
0.2
0.4
0.6
0.8
1.0
1.2
0.000 0.200 0.400 0.600 0.800
Current Density (A/cm2)
Cel
l Vol
tage
(V)
% F
uel U
tiliz
atio
n
0.000
0.080
0.160
0.240
0.320
0.400
0.480
Pow
er D
ensi
ty (W
/cm
2 )
8''-V4.375''-V4.375''-FU8''-FU8''-PD4.375''-PD

M-4thSECA.ppt- 30
GE Hybrid Power Generation Systems
Copyright 2003 General Electric Company
Cathode Materials and Microstructure DevelopmentCathode Materials and Microstructure Development
0
0.2
0.4
0.6
0.8
1
1.2
1.4
0 1 2 3Current Density, A/cm2
Cel
l Vol
tage
, V
0
0.2
0.4
0.6
0.8
1
1.2
1.4
Pow
er D
ensi
ty, W
/cm2800C
660C
Oxidant: airFuel: Hydrogen
0.40.50.60.70.80.9
11.11.2
0 20 40 60 80Time, Hours
Cel
l Vol
tage
, V
600
620
640
660
680
700
Tem
pera
ture
, C
take polarization
Oxidant: AirFuel: H2, 67cc/minJ=1.19A/cm2
High Performance Cathode
Engineered Structures
Engineered porosityTPB LengthInterfacial properties
High conductivityHigh catalytic activity
Compatibility-low reactivityInterlayer development
New Materials
M-4thSECA.ppt- 31
GE Hybrid Power Generation Systems
Copyright 2003 General Electric Company
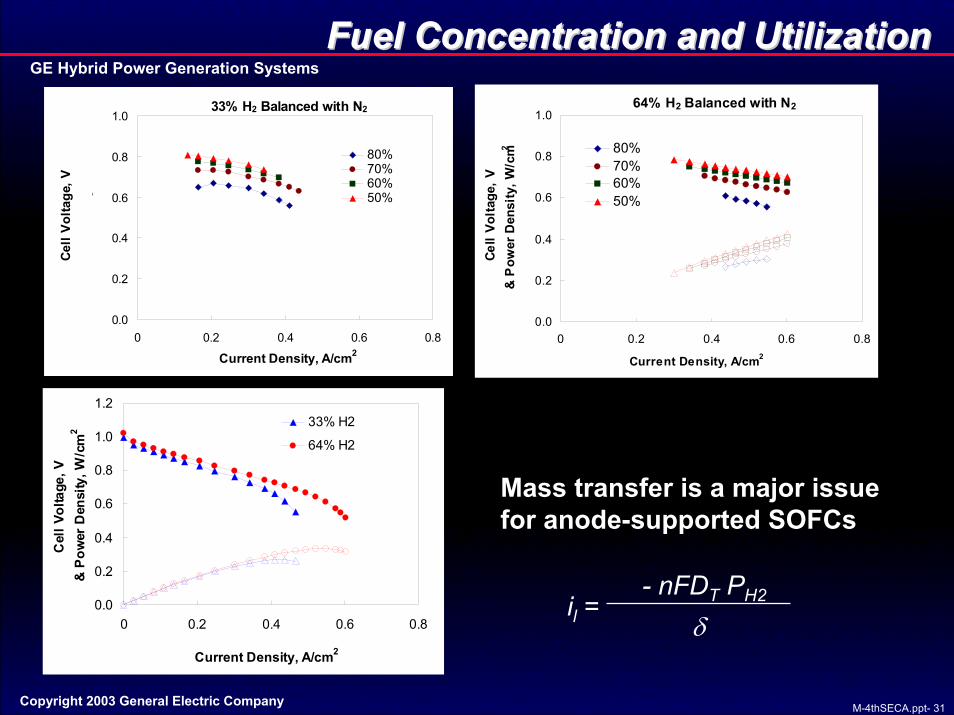
Fuel Concentration and UtilizationFuel Concentration and Utilization64% H2 Balanced with N2
0.0
0.2
0.4
0.6
0.8
1.0
0 0.2 0.4 0.6 0.8
Current Density, A/cm2
Cell
Volta
ge, V
&
Pow
er D
ensi
ty, W
/cm2 80%
70%60%50%
33% H2 Balanced with N2
0.0
0.2
0.4
0.6
0.8
1.0
0 0.2 0.4 0.6 0.8
Current Density, A/cm2
Cell
Volta
ge, V
&
Pow
er D
ensi
ty, W
/cm
2
80%70%60%50%
0.0
0.2
0.4
0.6
0.8
1.0
1.2
0 0.2 0.4 0.6 0.8
Current Density, A/cm2
Cel
l Vol
tage
, V &
Pow
er D
ensi
ty, W
/cm
2
33% H2
64% H2
Mass transfer is a major issue for anode-supported SOFCs
il = - nFDT PH2
δ

M-4thSECA.ppt- 32
GE Hybrid Power Generation Systems
Copyright 2003 General Electric Company
Anode Microstructure DevelopmentAnode Microstructure Development
Enhanced catalytic activitiesInternal reforming capability
Sulfur tolerance
Engineered PorosityReduced thickness
Low cost materialsToughed support structures
Enhanced catalytic activitiesInternal reforming capability
Sulfur tolerance
Engineered PorosityReduced thickness
Low cost materialsToughed support structures
0.5
0.6
0.7
0.8
0.9
0 0.2 0.4 0.6 0.8
Current Density, A/cm2
Cel
l Vol
tage
, VV, 50%FUV, 60% FUV, 70% FUV, 80% FU
64%H2 balance N2
SECA Target(80% Utilization, 075V)

M-4thSECA.ppt- 33
GE Hybrid Power Generation Systems
Copyright 2003 General Electric Company
LongLong--Term TestingTerm Testing
• Stacks tested up to 3000 hours• Performance degradation (much higher than
target) observed• Potential causes for performance losses being
investigated

M-4thSECA.ppt- 34
GE Hybrid Power Generation Systems
Copyright 2003 General Electric Company
SIMS Results on 3000SIMS Results on 3000--hours Stackhours Stack
78.1 micron
Cathode
Elec
troly
te
Mn red, Cr green
78.1 micron
Cathode
Elec
troly
te
Mn red, Cr green• Chromium builds up at
cathode-electrolyte interface
• Chromium is associated with manganese, not with lanthanum
• TEM underway to look at phases that are present

M-4thSECA.ppt- 35
GE Hybrid Power Generation Systems
Copyright 2003 General Electric Company
SOFC Operation on Hydrocarbon FuelsSOFC Operation on Hydrocarbon Fuels
Direct-OxidationSOFCFuel
CH4, H2, COFuel
CompleteReformer
Internal ReformingSOFC
Fuel SOFC
Pre-reformer
H2, CO

M-4thSECA.ppt- 36
GE Hybrid Power Generation Systems
Copyright 2003 General Electric Company
CPOX for Processing Hydrocarbon FuelsCPOX for Processing Hydrocarbon Fuels
• Fuels: propane, butane, octane, JP-8, and diesel
• Duration: 700 hours to date
• Thermal cycles: 10
• Sulfur tolerance: 1000 ppm dibenzothiophene in JP-8
• Fuels: propane, butane, octane, JP-8, and diesel
• Duration: 700 hours to date
• Thermal cycles: 10
• Sulfur tolerance: 1000 ppm dibenzothiophene in JP-8
0%
20%
40%
60%
80%
100%
0 40 80 120 160 200 240 280 320
Time (Hours)
Perc
ent Y
ield
%
H2
COThermal Cycle
M-4thSECA.ppt- 37
GE Hybrid Power Generation Systems
Copyright 2003 General Electric Company
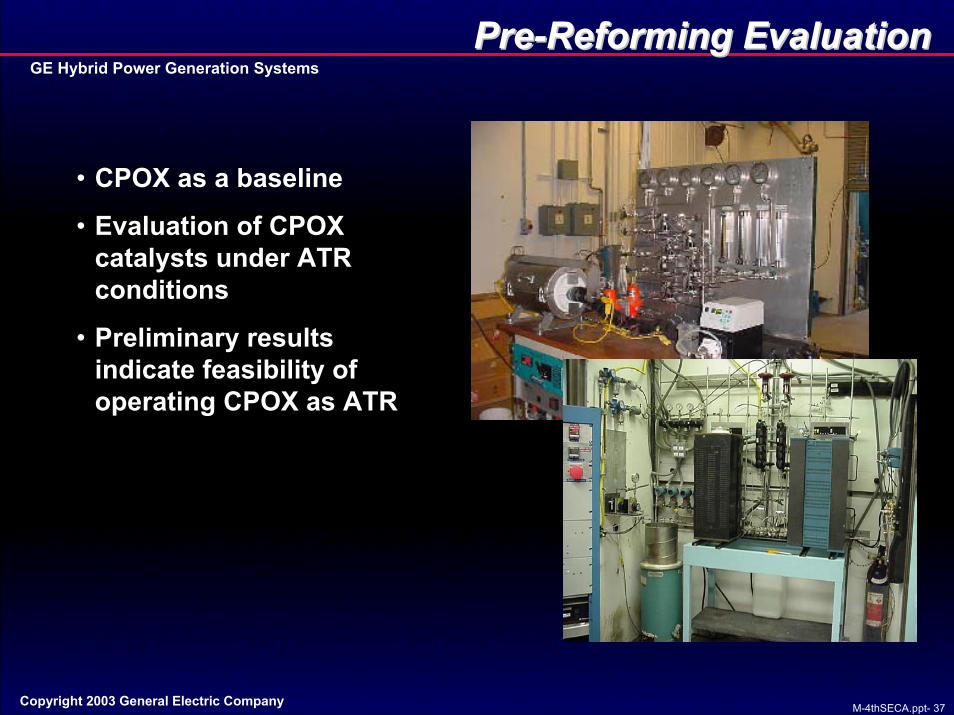
PrePre--Reforming EvaluationReforming Evaluation
• CPOX as a baseline
• Evaluation of CPOX catalysts under ATR conditions
• Preliminary results indicate feasibility of operating CPOX as ATR

M-4thSECA.ppt- 38
GE Hybrid Power Generation Systems
Copyright 2003 General Electric Company
SOFC Operation on Hydrocarbon Containing FuelsSOFC Operation on Hydrocarbon Containing Fuels
0.0
0.2
0.4
0.6
0.8
1.0
0.000 0.100 0.200 0.300 0.400 0.500
Current Density, A/cm2
Cel
l Vol
tage
, V
33% H2 + 200 ml H2O22% H2 + 200 ml H2O +4% CH413% H2 +200 ml H2O + 9% CH40% H2 + 200 ml H2O + 11% CH4

M-4thSECA.ppt- 39
GE Hybrid Power Generation Systems
Copyright 2003 General Electric Company
Concluding RemarksConcluding Remarks
• SECA system concept has been developed
• Current development efforts focus on resolving key technical issues concerning key system components
• Significant technical progress has been achieved in several technical areas
Recommended