Saudi Arabian Monetary Agency
The General Department of Insurance Control
The Saudi Insurance Market Report
2015

The Saudi Insurance Market Report (2015) SAMA – The General Department of Insurance Control– 1
Introduction 4
Insurance Market Performance - Overall
– Gross Written Premiums 6
– Insurance Penetration 7
– Insurance Density 8
– Gross Written Premiums by Line of Business 9
– Net Written Premiums by Line of Business 11
– Retention Ratio by Line of Business 13
– Gross Claims Paid by Line of Business 14
– General and Health Net Earned Premiums vs. Net Claims Incurred 15
– Market Profitability 16
– Balance Sheet - Policyholders’ Assets 17
– Balance Sheet - Shareholders’ Assets 18
– Balance Sheet - Policyholders’ Liabilities and Equity 19
– Balance Sheet - Shareholders’ Liabilities and Equity 20
Insurance Market Performance - By Line of Business
– Health Insurance 22
– Protection and Savings Insurance 23
– Motor Insurance 24
– Property/ Fire Insurance 25
Table of Contents

The Saudi Insurance Market Report (2015) SAMA – The General Department of Insurance Control– 2
Table of Contents
– Engineering Insurance 26
– A&L and Other Insurance 27
– Marine Insurance 28
– Energy Insurance 29
– Aviation Insurance 30
Other Market Indicators
– Commissions Incurred by Line of Business 32
– Employees Breakdown by Nationality 33
– Insurance Market Structure 34
– Capitalization of Insurance Companies 35
Appendix: Data Tables
– Table 1: Gross Written Premiums by Line of Business 37
– Tables 2 & 3: Insurance Penetration and Density 38
– Table 4: Net Written Premiums by Line of Business 39
– Table 5: Retention Ratio by Line of Business 40
– Table 6: Commissions Incurred by Line of Business 41
– Table 7: Gross Claims Paid by Line of Business 42

3
Introduction
The Saudi Insurance Market Report (2015) SAMA – The General Department of Insurance Control– 4
Introduction
In 2015, Gross Written Premiums (GWP) in the Saudi insurance market reached SR 36.49 Billion, up from SR 30.48 Billion in 2014.This represents an increase of 19.7%, compared to a 20.8 % growth rate in 2014:
– Health insurance GWP, which represents 52% of the insurance market, increased by 20.3% to SR 18.9 Billion in 2015 compared toSR 15.7 Billion in 2014
– General insurance GWP, which represents 45% of the insurance market, increased by 19% to SR 16.5 Billion in 2015 compared toSR 13.9 Billion in 2014. Motor insurance represented 65% of General insurance GWP, in which it has increased from SR 8 Billion in2014 up to SR 10.8 Billion in 2015
– Protection & savings (P&S) insurance GWP, which represents 3% of the insurance market, increased by 14.5% to SR 1.04 Billion in2015 compared to SR 904 Million in 2014
– Total number of insurance polices written increased to 8,123,647 policy in 2015 compared to 6,475,496 policy in 2014
This report is based on the data collected from 35 insurance and reinsurance companies
5
Insurance Market Performance - Overall
The Saudi Insurance Market Report (2015) SAMA – The General Department of Insurance Control– 6
Gross Written Premiums
Gross Written Premiums(2011 to 2015, SR Million)
% Growth 2014–15
14.5%
20.7%
19%
19.7%
7,890 9,00011,500
9,70811,285
12,895
15,720
13,857
20142012
84525,239
2013
21,174889
2011
18,504905
2015
36،496
16،494
18،967
90430,482
1،036
(1) The GWP is the total of accounted premiums. There may be double counting of reinsurance premiums accepted from other Saudi Arabian insurers or reinsurers
General
Health
P&S
The overall insurance Gross Written Premiums increased by SR 6.01Billion to reach SR 36.49 Billion(1) in 2015, compared to SR 30.48 Billionin 2014, which represents a growth rate of 19.7%.
Health insurance sustained the biggest line of business in 2015. Itscontribution to total GWP in 2015 remained the same as 2014, whichrepresents 52%, likewise General insurance’s contribution to totalbusiness volume in 2015 continued to be 45% as 2014.
Health insurance accounted for SR 3.25 Billion of the SR 6.01 Billionincrease, which represents a 54% contribution to the market’s GWPincrease.
Protection and Savings insurance remained the smallest line of businessaccounting for 3% of total GWP, with an increase in its writtenpremiums by 14.5% in 2015.
In SR Million
2011 2012 2013 2014 2015
SR (M) % Total SR (M) % Total SR (M) % Total SR (M) % Total SR (M) % Total
Protection &Savings
905 5% 889 4% 845 3% 904 3% 1,036 3%
Health 9,708 52% 11,285 53% 12,895 51% 15,721 52% 18,967 52%
General 7,890 43% 9,000 43% 11,500 46% 13,857 45% 16,494 45%
Total 18,504 100% 21,174 100% 25,239 100% 30,482 100% 36,496 100%
The Saudi Insurance Market Report (2015) SAMA – The General Department of Insurance Control– 7
Insurance Penetration
Insurance penetration of total GrossDomestic Product (GDP) is defined asGross Written Premiums divided by thetotal GDP
Over the past five years, insurancepenetration has increased at acompounded annual growth rate (CAGR)of 15%
In 2015, insurance penetration increased to1.49% up from 1.08 % in 2014
Insurance penetration of non-oil GDP isdefined as Gross Written Premiumsdivided by non-oil GDP
In 2015, Insurance penetration of non-oilGDP increased to 2.1%, up from 1.9 % in2014
Insurance penetration of non-oil GDP hasincreased at an average annual rate of 1%between 2011 and 2015
+1%
2015
2،10%
0،06%
1،09%
0،95%
2014
1.90%
0.06%0.98%
0.87%
2013
1.72%
0.06%0.88%
0.78%
2012
1.56%
0.07%0.83%
0.66%
2011
2.02%
0.10%
1.06%
0.86%
Insurance Penetration of Non-Oil GDP(2)
(2011 to 2015, % of Non-Oil GDP)
0.56%0.77%
0.33% 0.41%0.49%
0.67%
0.46%0.41%0.45%
+15%
2015
1،49%
0،04%
2014
1.08%
0،03%
2013
0.90%
0،03%
2012
0.78%
0،03%
2011
0.85%
0.04%
0.36%
(1) Total GDP of SR 2,163 SR 2,727 SR 2,795 SR 2,821 and SR 2.449 Billion in 2011, 2012, 2013, 2014 and 2015, respectively, General Authority for Statistics (2) Non-oil GDP SR 919 SR 1,353 SR 1,471, SR 1,601 and SR 1,740 Billion in 2011, 2012, 2013, 2014 and 2015 respectively, General Authority for Statistics
Insurance Penetration of Total GDP(1)
(2011 to 2015, % of Total GDP)
% Growth 2014–15
37%
32%
38%
39%
% Growth 2014-15
9.5%
5.3%
10%
11%
Total P&S Insurance
Total Health Insurance
Total General Insurance
Total P&S Insurance
Total Health Insurance
Total General Insurance

The Saudi Insurance Market Report (2015) SAMA – The General Department of Insurance Control– 8
Insurance Density
Insurance density is defined as GrossWritten Premiums per Capita. Insurancedensity increased from SR 991 per Capitain 2014 to SR 1186 per capita in 2015, whichrepresents a 19.7% increase
Expenditures per Capita on insuranceproducts have increased by an averageannual rate of 15% between 2011 and 2015
The density of Protection and Savingsinsurance remained low in absolute terms,and relative to General and Healthinsurance, at SR 34 per Capita
358 387 442511
616
291308
394
450
536
+15%
2014
991
29
2013
864
29
2012
725
30
2011
682
33
2015
1186
34
Insurance Density(1)
(2011 to 2015, SR per Capita)
(1) Saudi population of 27.1, 29.19 , 29.19 , 30.77 and 30.77 Million in 2011, 2012, 2013, 2014 and 2015, respectively, General Authority for Statistics
% Growth 2014–15
19 %
14.5%
19.7%
20.6%
Total P&S Insurance
Total Health Insurance
Total General Insurance

The Saudi Insurance Market Report (2015) SAMA – The General Department of Insurance Control– 9
Motor and Health insuranceaccounted for around 81.6% oftotal GWP in 2015
Health insurance, whichincludes both compulsory andnon-compulsory lines ofbusiness, remained the largestline of business in 2015,accounting for 52% of totalGWP
Motor compulsory and non-compulsory lines of businessstood in second place with a29.6% share of total GWP
Motor underwritten premiumsrecorded the highest growthrate in 2015 at 34.5%
Health and Energy insuranceunderwritten premiumsincreased by 20.7% and 27.1%respectively in 2015
Gross Written Premiums by Line of Business
(1) A&L stands for Accidents and Liabilities insurance throughout the document
In SR Million
2011 2012 2013 2014 2015 Growth
SR M % Total SR M % Total SR M % Total SR M % Total SR M % Total %
Aviation 272 1.5% 67 0.3% 144 0.6% 140 0.5% 147 0.4% 4.5%
Energy 361 2.0% 385 1.8% 456 1.8% 443 1.5% 563 1.5% 27.1%
Marine 634 3.4% 743 3.5% 740 2.9% 811 2.7% 726 2.0% -10.5%
P&S 905 4.9% 889 4.2% 845 3.3% 904 3.0% 1,036 2.8% 14.5%
A&L and Other 632 3.4% 691 3.3% 941 3.7% 1,079 3.5% 1,093 3.0% 1.3%
Engineering 913 4.9% 1,077 5.1% 1,200 4.8% 1,434 4.7% 1,204 3.3% -16.0%
Property/ Fire 1,157 6.3% 1,348 6.4% 1,665 6.6% 1,923 6.3% 1,962 5.4% 2.0%
Motor 3,922 21.2% 4,689 22.1% 6,355 25.2% 8,026 26.3% 10,799 29.6% 34.5%
Health 9,708 52.5% 11,285 53.3% 12,895 51.1% 15,720 51.6% 18,967 52.0% 20.7%
Total 18,504 100% 21,174 101% 25,239 100% 30,482 100% 36,496 100% 19.7%
The Saudi Insurance Market Report (2015) SAMA – The General Department of Insurance Control– 10
Gross Written Premiums by Line of Business (continued)
9,708 11,285 12,89515,720
18,967
3,9224,689
6,355
8,026
10,799
1,962
1,923
1,665
691
632
726
811
740
563
443
456
385
361
147
140
144
272
1،3481,077
743
67304
2011
18,504
2014
913905 634
+19%
1,157
2015
36،496
1،2041،093
1،036
30,482
1،4341,079
904
2013
845
889
25,239
1,200941
2012
21,174
Health
Motor
Property/ Fire
Engineering
A&L and Other
P&S
Marine
Energy
Aviation
Gross Written Premiums by Line of Business (2011 to 2015, SR Million)
The Saudi Insurance Market Report (2015) SAMA – The General Department of Insurance Control– 11
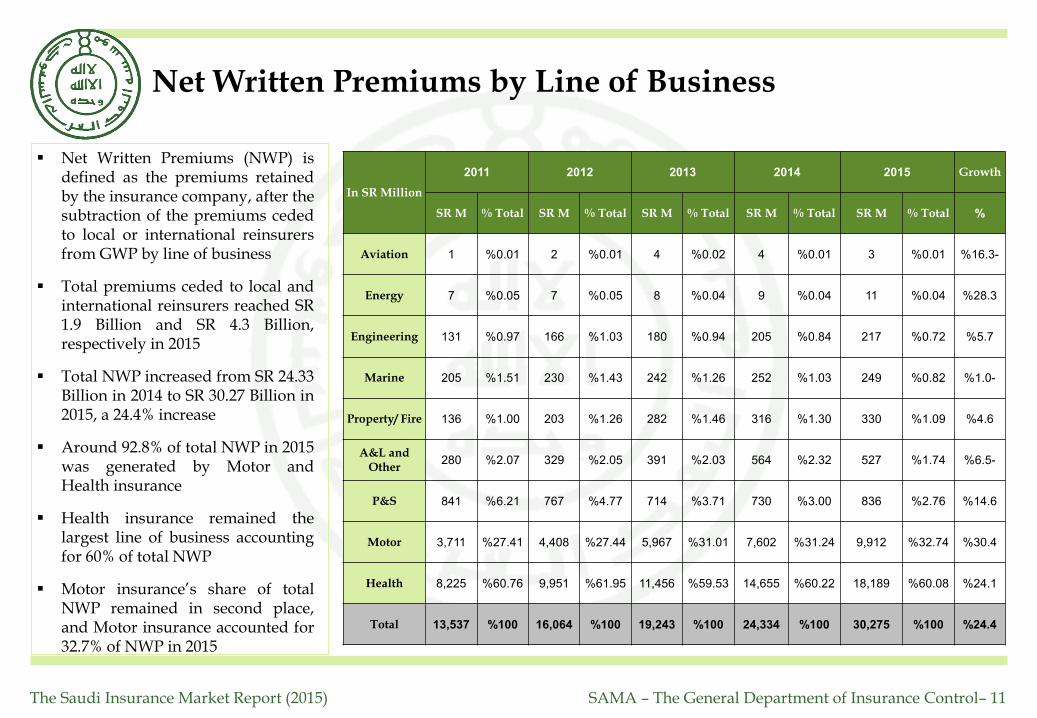
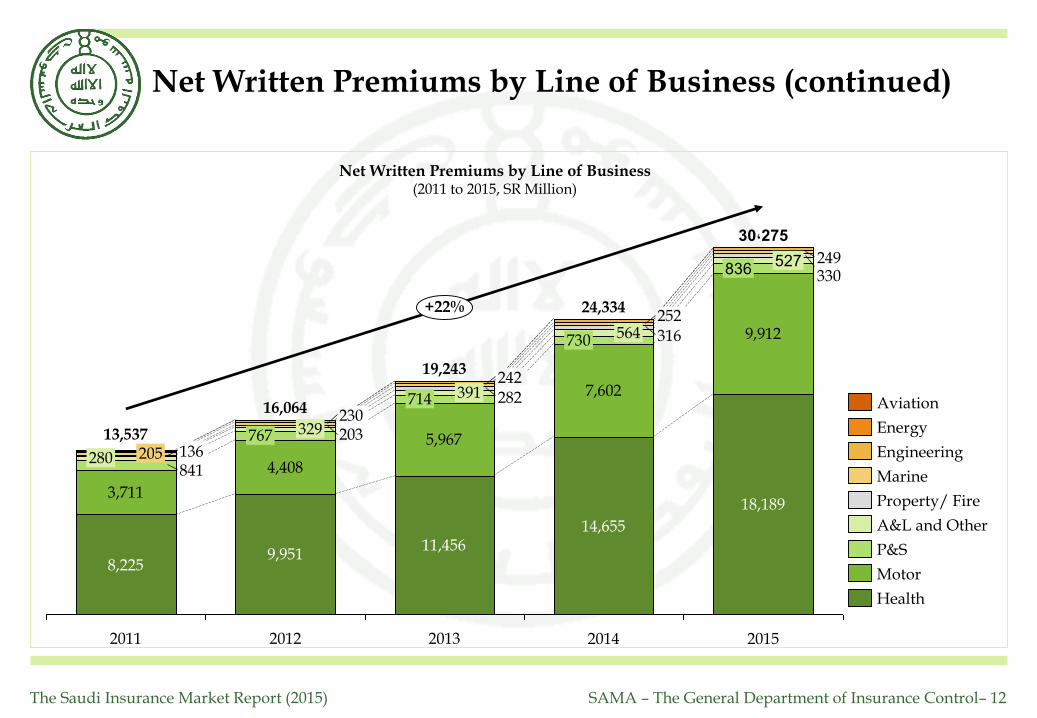
Net Written Premiums (NWP) isdefined as the premiums retainedby the insurance company, after thesubtraction of the premiums cededto local or international reinsurersfrom GWP by line of business
Total premiums ceded to local andinternational reinsurers reached SR1.9 Billion and SR 4.3 Billion,respectively in 2015
Total NWP increased from SR 24.33Billion in 2014 to SR 30.27 Billion in2015, a 24.4% increase
Around 92.8% of total NWP in 2015was generated by Motor andHealth insurance
Health insurance remained thelargest line of business accountingfor 60% of total NWP
Motor insurance’s share of totalNWP remained in second place,and Motor insurance accounted for32.7% of NWP in 2015
Net Written Premiums by Line of Business
In SR Million
2011 2012 2013 2014 2015 Growth
SR M % Total SR M % Total SR M % Total SR M % Total SR M % Total %
Aviation 1 0.01% 2 0.01% 4 0.02% 4 0.01% 3 0.01% -16.3%
Energy 7 0.05% 7 0.05% 8 0.04% 9 0.04% 11 0.04% 28.3%
Engineering 131 0.97% 166 1.03% 180 0.94% 205 0.84% 217 0.72% 5.7%
Marine 205 1.51% 230 1.43% 242 1.26% 252 1.03% 249 0.82% -1.0%
Property/ Fire 136 1.00% 203 1.26% 282 1.46% 316 1.30% 330 1.09% 4.6%
A&L and Other
280 2.07% 329 2.05% 391 2.03% 564 2.32% 527 1.74% -6.5%
P&S 841 6.21% 767 4.77% 714 3.71% 730 3.00% 836 2.76% 14.6%
Motor 3,711 27.41% 4,408 27.44% 5,967 31.01% 7,602 31.24% 9,912 32.74% 30.4%
Health 8,225 60.76% 9,951 61.95% 11,456 59.53% 14,655 60.22% 18,189 60.08% 24.1%
Total 13,537 100% 16,064 100% 19,243 100% 24,334 100% 30,275 100% 24.4%
The Saudi Insurance Market Report (2015) SAMA – The General Department of Insurance Control– 12
Net Written Premiums by Line of Business (continued)
8,2259,951
11,45614,655
18,1893,711
4,408
5,967
7,602
9,912
841
330
316
282
203136
249
252
242
230
2013
714 391
2012
+22%
16,064
2014
767 329
2011
13,537
24,334
836527
280 205
2015
30،275
730 564
19,243
Net Written Premiums by Line of Business (2011 to 2015, SR Million)
Health
Motor
P&S
A&L and Other
Property/ Fire
Marine
Engineering
Energy
Aviation

The Saudi Insurance Market Report (2015) SAMA – The General Department of Insurance Control– 13
Retention Ratio by Line of Business
The retention ratio measures the written premiumsretained by the insurance company. It is calculated bydividing the NWP by the GWP
The overall retention ratio of insurance companies inthe Saudi market increased slightly to 83% in 2015, upfrom 79.8 % in 2014. This ratio is largely skewed due tothe high retention ratio of Motor and Health insurancewhich collectively account for around 81.6% of totalGWP. In 2015, the retention ratios for Motor and Healthinsurance were 92% and 96%, respectively
The weighted average retention ratio of other insurancelines of business (i.e., excluding Motor and Healthinsurance) increased to 32% in 2015 compared to 23%in 2014
Notes:
- All licensed companies are required to adhere to aminimum retention ratio of 30% of its totalinsurance premiums (as per Article 40 of theImplementing Regulations)
- Retention ratios are not shown for Protection &Savings insurance as the savings element of thecontract must be retained in the Saudi Arabiancompany. Therefore retentions for Protection &Savings insurance are not directly comparable withother insurance lines of business
93%
95%
52%
31%
16%
96%
92%
48%
34%
18%
17%
2%
3%
17%
15%
33%
42%
94%
89%
2%
2%
2%
2%
83%
Health
Aviation
32%
Energy
A&L & Other
Motor
Engineering
Marine
Property/ Fire
14%
Retention Ratios by Line of Business(2013 to 2015, % of GWP)
2013
2015
2014
Weighted average excluding Motor and Health insurance
Weighted average including all lines of business

The Saudi Insurance Market Report (2015) SAMA – The General Department of Insurance Control– 14
Total gross claims paidincreased by 20.7% fromSR 20.3 Billion in 2014 toSR 24.5 Billion in 2015
In 2015, Health andMotor gross claims paidgrew by 13.3% and24.5%, respectivelycompared to 2014figures
In 2015, Aviationinsurance recorded thehighest growth rate ingross claims paid, afterincreasing by 621.7%from SR 7 Million to SR51 Million
Table 7 in the appendixcontains all the grossclaims data by line ofbusiness from 2011 to2015
Gross Claims Paid by Line of Business
Gross Claims Paid by Line of Business(2011 to 2015, SR Million)
7,2978,511
10,40511,567
13,106
2,730
3,465
4,720
6,069
7,555
2,367
1,312 559
213
390
329
10515
2015
24،518
631
2014
20,314
2013
16,996374
2012
13,615
240
2011
11,485
22631
+21%
% Growth 2014-2015
Total
Health
Motor
Property/ Fire
Engineering
P&S
Marine
A&L and Other
Aviation
Energy
20.7%
0%
621.7%
--3.3%
--17.2%
18.3%
12.8%
80.4%
24.5%
13.3%

The Saudi Insurance Market Report (2015) SAMA – The General Department of Insurance Control– 15
General and Health Net Earned Premiums vs. Net Claims Incurred
Net Earned Premiums Vs. Net Claims Incurred(2011 to 2015, SR Million)
Net Earned Premiums(NEP) is equal to NWPminus the change in netunearned premiumsreserve
The insurance market’sGeneral and Health NEPtotaled SR 26.79 Billion in2015, up from SR 21.34Billion in 2014, whichrepresents 25.5% increase
General and Health NetClaims Incurred (NCI),i.e., the total of net claimspaid plus the change inoutstanding and IBNRclaims reserve, increasedby 22.4% in 2015 to reachSR 21.29 Billion
For 2015 General andHealth net claims ratio,i.e., the loss ratio, whichis equal to NCI dividedby NEP, decreased toreach 79.5% compared to81.5 % in 2014
26,794
21,337
17,146
14,077
11,668
21,295
17,38615,931
10,926
8,382
2014201320122011 2015
NCI
NEP
Loss Ratio(% NEP)
79.5%81.5%92.9 %77.6 %71.8%
+ 22.4%+ 25.5%

The Saudi Insurance Market Report (2015) SAMA – The General Department of Insurance Control– 16
735
323
651
810
-9
963
Investment Result Net Result
-103%
Underwriting Result
2014
2015
Insurance Market Profitability(2014-2015, SR Million)
Insurance Market ROA/ ROE(2015, % of Net Result to Assets/ Equity)
6.5%
1.5%
ROEROA
Insurance underwriting result is the outcomeof subtracting all insurance related expensesfrom insurance revenues
The net result is equal to the sum of revenuesminus the sum of expenses
Investment income is the total investmentincome minus total investment expense
In 2015, the insurance underwriting resulttotaled SR 963 Million, compared to 651Million in 2014
Investment income decreased affectedly to SR-9 Million in 2015, compared to SR 323 Millionin 2014
The insurance market’s net result totaled 810Million in 2015, compared to SR 735 Million in2014
Return on Assets (ROA) is the ratio of netresult to total assets. In 2015, insurancemarket’s ROA was 1.5%
Return on Equity (ROE) is the ratio of netresult to total equity. In 2015, Insurancemarket’s ROE was 6.5%
Market Profitability
2015

The Saudi Insurance Market Report (2015) SAMA – The General Department of Insurance Control– 17
Balance Sheet - Policyholders’ Assets
At the end of 2015insurance companiesheld SR 5.62 Billion incash and cashequivalents in theirpolicyholders’ accountscompared to SR 6.26Billion in 2014
Investments accountedfor the biggest share ofpolicyholders’ assets,with a value of SR 12.24Billion in 2015 comparedto SR 9.1 Billion in 2014
Policyholders’(operational) assets amounted to SR39.44 Billion in 2015compared to SR 35.2Billion in 2014
Policyholders’ Assets(2015, SR Thousand)
* Other investments consists mainly of investments in funds related to saving products
Item NameGeneral and
Health Insurance
Protection and Saving
InsuranceTotal Insurance
Cash and cash equivalents 5,458,353 166,439 5,624,792
Receivables, net 8,571,976 141,748 8,713,723
Reinsurance recoverable 8,655,539 336,398 8,991,937
Deferred policy acquisition cost 1,037,163 3,792 1,040,955
Prepaid expenses 984,940 1,453 986,393
Investments 9,368,753 2,872,173 12,240,926
Deposits at financial institutions 7,633,920 83,977 7,717,897
Loans - - -
Debt securities and fixed income 1,323,376 - 1,323,376
Shares (common, preferred) 97,076 - 97,076
Real estate 9,861 - 9,861
Investment in subsidiaries and affiliates - 37,105 37,105
Other 304,521 2,751,091 3,055,612
Tangible assets 480,566 8,006 488,572
Intangible assets 17,946 103 18,049
Other policyholders assets 1,348,788 (11,339) 1,337,449Total policyholders assets
35,924,025 3,518,771 39,442,796

The Saudi Insurance Market Report (2015) SAMA – The General Department of Insurance Control– 18
Balance Sheet - Shareholders’ Assets
At the end of 2015,insurance companies’shareholders held SR2.34 Billion in cash andcash equivalentscompared to SR 2.33Billion in 2014
Investments accountedfor the biggest share ofshareholders’ assets,with a value of SR 10.86Billion in 2015 comparedto SR 8.31 Billion in 2014
Shareholders’ assetsamounted to SR 14.69Billion in 2015 comparedto SR 12.11 Billion in 2014
Insurance companies’total assets amounted toSR 54.12 Billion in 2015compared to SR 47.3Billion in 2014
Shareholders’ Assets(2015, SR Thousand)
Item NameGeneral and
Health Insurance
Protection and Saving
InsuranceTotal Insurance
Cash and cash equivalents 2,343,990
Receivables, net8,989
Investments 10,859,315
Deposits at financial institutions 6,447,954
Loans 1,923
Debt securities and fixed income 2,222,241
Shares (common, preferred) 1,006,884
Real estate 25,000
Investment in subsidiaries and affiliates 126,073
Other 1,029,240
Accrued interest, rent, income 38,376
Tangible assets 150,988
Intangible assets 852,018
Distributions due from policyholders account 301,221
Other shareholders assets 130,329
Total shareholders assets 14,685,226
Total Assets 54,128,022
The Saudi Insurance Market Report (2015) SAMA – The General Department of Insurance Control– 19
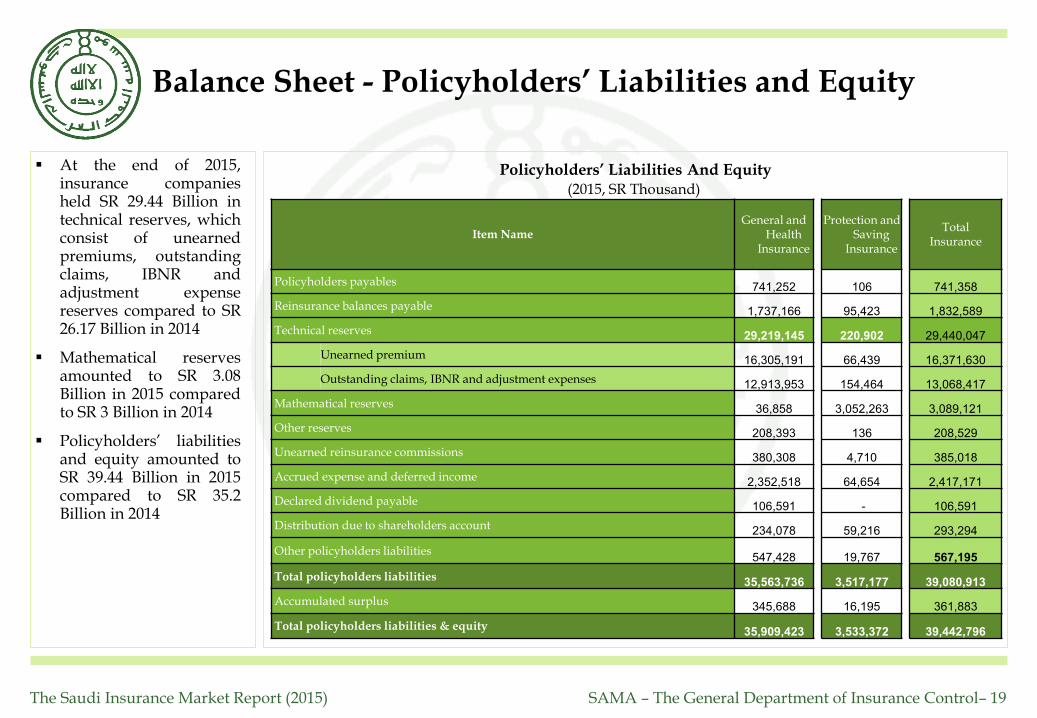
Balance Sheet - Policyholders’ Liabilities and Equity
At the end of 2015,insurance companiesheld SR 29.44 Billion intechnical reserves, whichconsist of unearnedpremiums, outstandingclaims, IBNR andadjustment expensereserves compared to SR26.17 Billion in 2014
Mathematical reservesamounted to SR 3.08Billion in 2015 comparedto SR 3 Billion in 2014
Policyholders’ liabilitiesand equity amounted toSR 39.44 Billion in 2015compared to SR 35.2Billion in 2014
Policyholders’ Liabilities And Equity(2015, SR Thousand)
Item NameGeneral and
Health Insurance
Protection and Saving
Insurance
Total Insurance
Policyholders payables 741,252 106 741,358
Reinsurance balances payable 1,737,166 95,423 1,832,589
Technical reserves 29,219,145 220,902 29,440,047
Unearned premium 16,305,191 66,439 16,371,630
Outstanding claims, IBNR and adjustment expenses 12,913,953 154,464 13,068,417
Mathematical reserves 36,858 3,052,263 3,089,121
Other reserves 208,393 136 208,529
Unearned reinsurance commissions 380,308 4,710 385,018
Accrued expense and deferred income 2,352,518 64,654 2,417,171
Declared dividend payable 106,591 - 106,591
Distribution due to shareholders account 234,078 59,216 293,294
Other policyholders liabilities547,428 19,767 567,195
Total policyholders liabilities35,563,736 3,517,177 39,080,913
Accumulated surplus 345,688 16,195 361,883
Total policyholders liabilities & equity35,909,423 3,533,372 39,442,796

The Saudi Insurance Market Report (2015) SAMA – The General Department of Insurance Control– 20
Balance Sheet - Shareholders’ Liabilities and Equity
At the end of 2015,shareholders’ liabilitiesincreased to SR 2.26Billion from SR 2.1Billion in 2014 whileshareholders’ equitytotaled SR 12.42 Billion in2015 compared to SR10.06 Billion in 2014
Share capital constitutedthe biggest share ofshareholders’ equity witha value of SR 12.61Billion in 2015 comparedto SR 10.25 Billion in 2014
Shareholders’ liabilitiesand equity registered SR14.69 Billion in 2015compared to SR 21.11Billion in 2014
Insurance companies’total liabilities and equityamounted to SR 54.12Billion in 2015 comparedto SR 47.3 Billion in 2014
Shareholders’ Liabilities And Equity(2015, SR Thousand)
Item NameGeneral and
Health Insurance
Protection and Saving
InsuranceTotal Insurance
Shareholders payables491,536
Zakat533,665
Accrued expenses and deferred income139,790
Other shareholders liabilities 1,095,454
Total shareholders liability2,260,444
Share capital12,616,667
Statutory reserves1,487,186
Retained earnings(1,608,330)
Other shareholders equity(70,741)
Total shareholders equity12,424,782
Total shareholders liabilities & equity 14,685,226
Total Liabilities and Equity 54,128,022

21
Insurance Market Performance - By Line of Business
The Saudi Insurance Market Report (2015) SAMA – The General Department of Insurance Control– 22
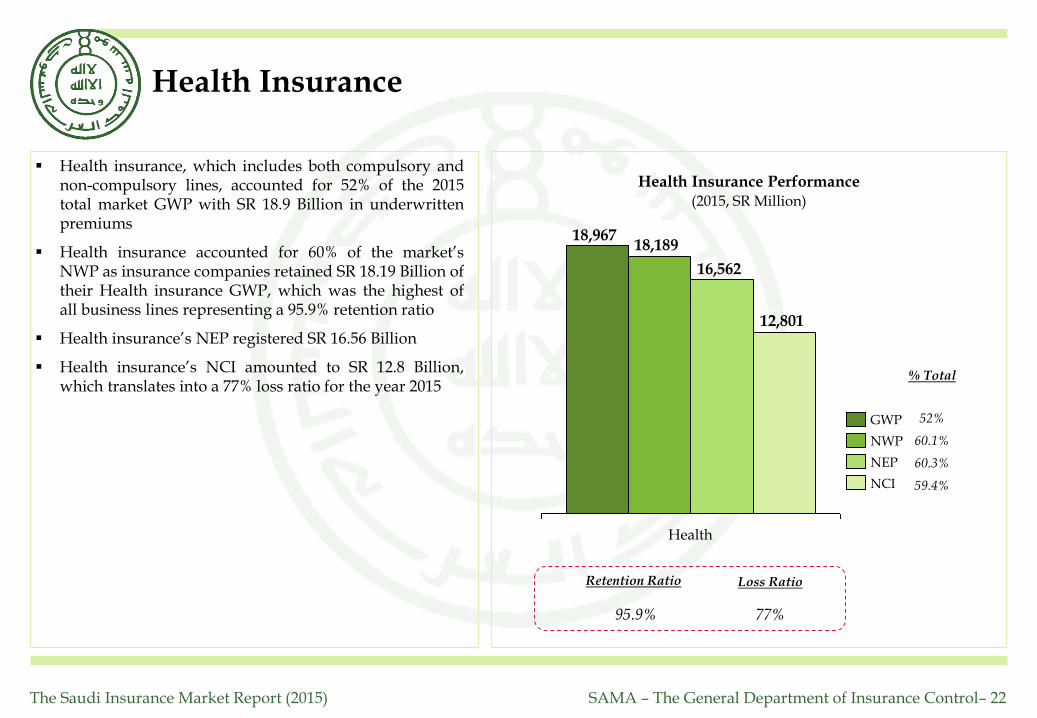
Health Insurance
18,96718,189
16,562
12,801
Health
NEP
NWP
GWP
NCI 59.4%
60.3%
60.1%
52%
% Total
Retention Ratio Loss Ratio
95.9% 77%
Health Insurance Performance(2015, SR Million)
Health insurance, which includes both compulsory andnon-compulsory lines, accounted for 52% of the 2015total market GWP with SR 18.9 Billion in underwrittenpremiums
Health insurance accounted for 60% of the market’sNWP as insurance companies retained SR 18.19 Billion oftheir Health insurance GWP, which was the highest ofall business lines representing a 95.9% retention ratio
Health insurance’s NEP registered SR 16.56 Billion
Health insurance’s NCI amounted to SR 12.8 Billion,which translates into a 77% loss ratio for the year 2015

The Saudi Insurance Market Report (2015) SAMA – The General Department of Insurance Control– 23
Retention ratio and loss ratio are not shown due to the savings part of the premium which distorts the ratios
Protection and Savings Insurance
1,036
836
672
262
P&S
NCI
NEP
NWP
GWP
1.2%
2.4%
2.8%
2.8%
% Total
Protection and Savings Insurance Performance
(2015, SR Million)
Protection and Savings insurance’s GWP totaled SR 1.036Million in 2015, which represents a 2.8% contribution tothe market’s total business volume
Protection and Savings insurance accounted for 2.8% ofthe market’s NWP, as insurance companies retained SR836 Million of GWP
Protection and Savings insurance’s NEP registered SR672 Million, which represents a share of 2.4% of totalNEP
Protection and Savings insurance’s NCI amounted to SR262 Million
The Saudi Insurance Market Report (2015) SAMA – The General Department of Insurance Control– 24
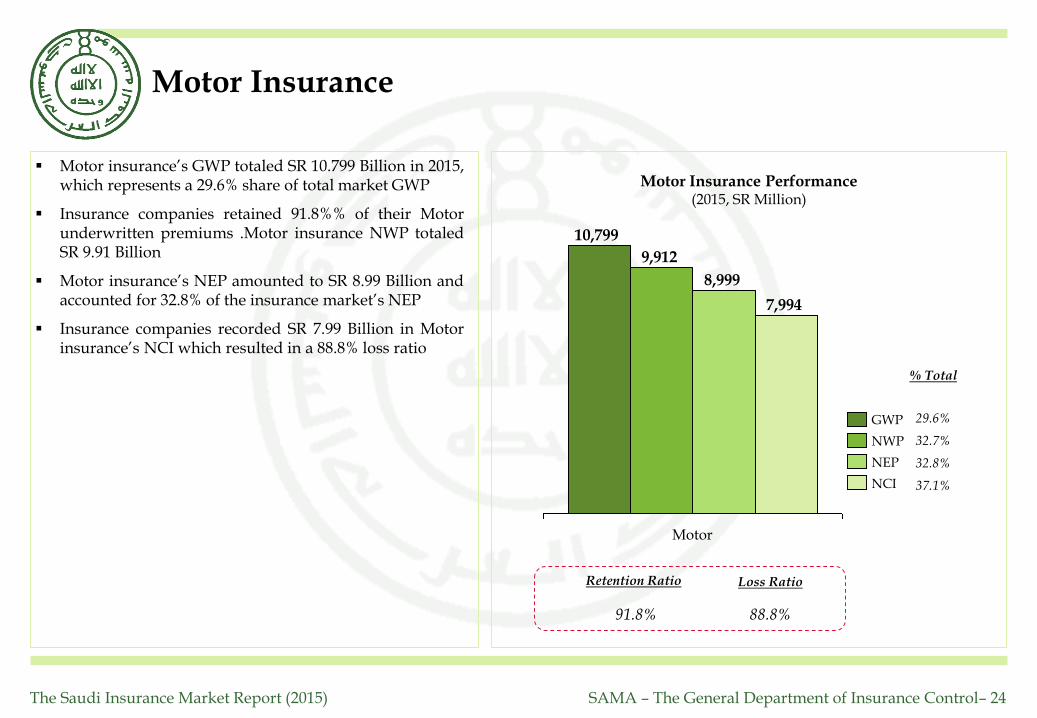
Motor Insurance
10,799
9,912
8,999
7,994
Motor
NCI
NEP
NWP
GWP
37.1%
32.8%
32.7%
29.6%
% Total
Retention Ratio Loss Ratio
91.8% 88.8%
Motor Insurance Performance(2015, SR Million)
Motor insurance’s GWP totaled SR 10.799 Billion in 2015,which represents a 29.6% share of total market GWP
Insurance companies retained 91.8%% of their Motorunderwritten premiums .Motor insurance NWP totaledSR 9.91 Billion
Motor insurance’s NEP amounted to SR 8.99 Billion andaccounted for 32.8% of the insurance market’s NEP
Insurance companies recorded SR 7.99 Billion in Motorinsurance’s NCI which resulted in a 88.8% loss ratio
The Saudi Insurance Market Report (2015) SAMA – The General Department of Insurance Control– 25
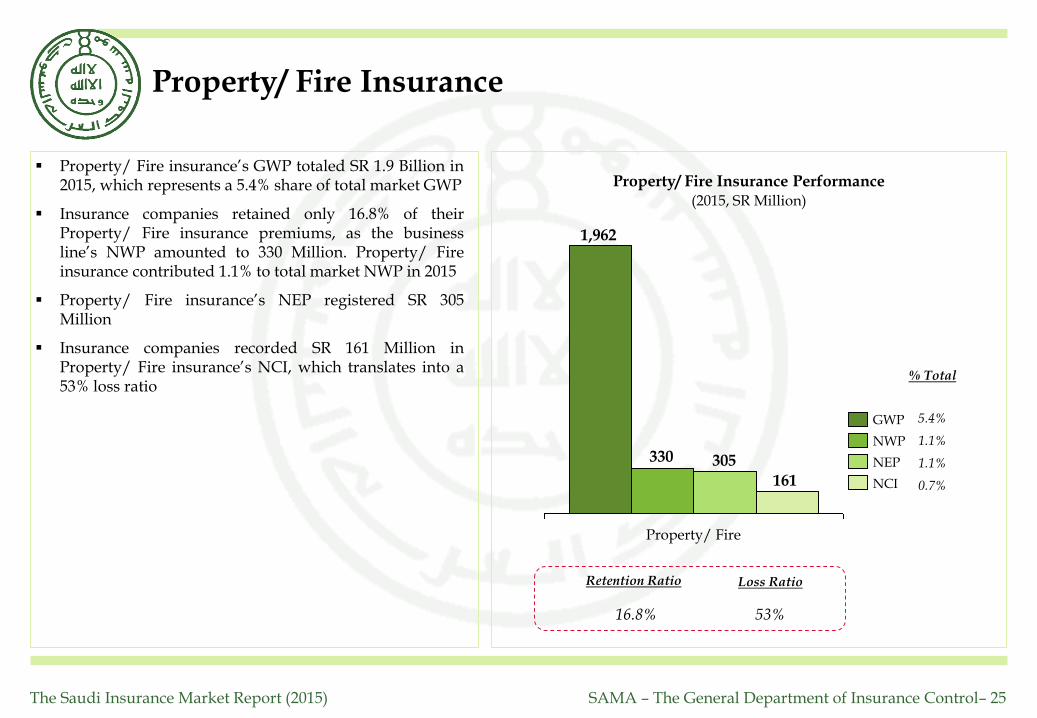
Property/ Fire Insurance
1,962
330 305
161
Property/ Fire
NCI
NEP
NWP
GWP
0.7%
1.1%
1.1%
5.4%
% Total
Retention Ratio Loss Ratio
16.8% 53%
Property/ Fire Insurance Performance(2015, SR Million)
Property/ Fire insurance’s GWP totaled SR 1.9 Billion in2015, which represents a 5.4% share of total market GWP
Insurance companies retained only 16.8% of theirProperty/ Fire insurance premiums, as the businessline’s NWP amounted to 330 Million. Property/ Fireinsurance contributed 1.1% to total market NWP in 2015
Property/ Fire insurance’s NEP registered SR 305Million
Insurance companies recorded SR 161 Million inProperty/ Fire insurance’s NCI, which translates into a53% loss ratio
The Saudi Insurance Market Report (2015) SAMA – The General Department of Insurance Control– 26
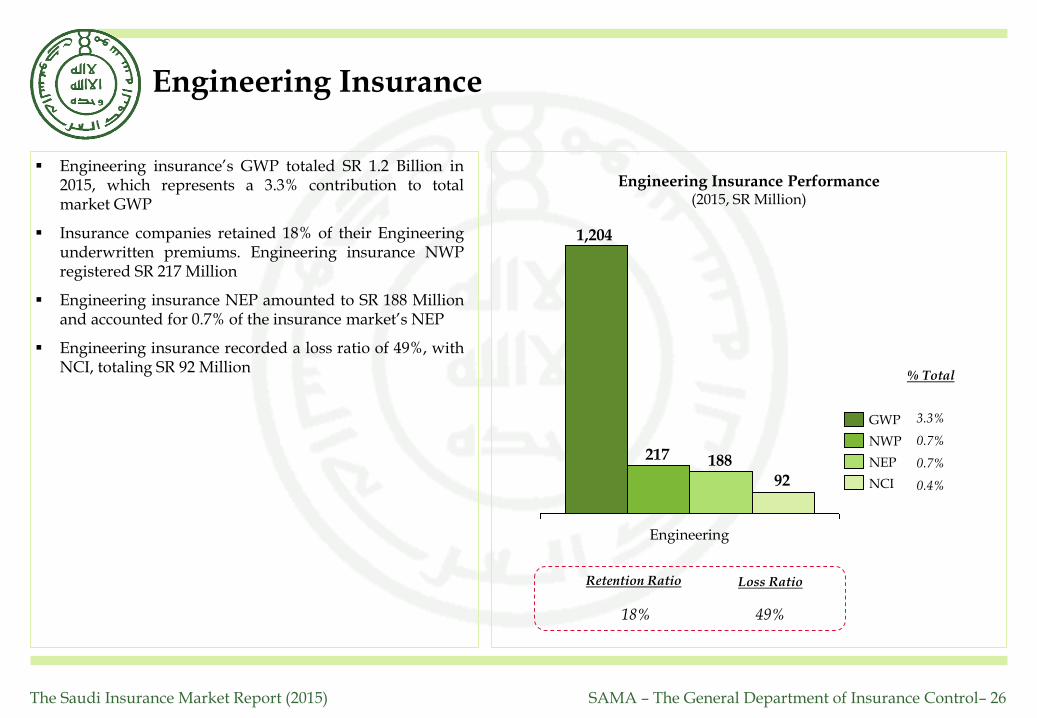
Engineering Insurance
1,204
217 188
92
Engineering
NCI
NEP
NWP
GWP
0.4%
0.7%
0.7%
3.3%
% Total
Retention Ratio Loss Ratio
18% 49%
Engineering Insurance Performance(2015, SR Million)
Engineering insurance’s GWP totaled SR 1.2 Billion in2015, which represents a 3.3% contribution to totalmarket GWP
Insurance companies retained 18% of their Engineeringunderwritten premiums. Engineering insurance NWPregistered SR 217 Million
Engineering insurance NEP amounted to SR 188 Millionand accounted for 0.7% of the insurance market’s NEP
Engineering insurance recorded a loss ratio of 49%, withNCI, totaling SR 92 Million
The Saudi Insurance Market Report (2015) SAMA – The General Department of Insurance Control– 27
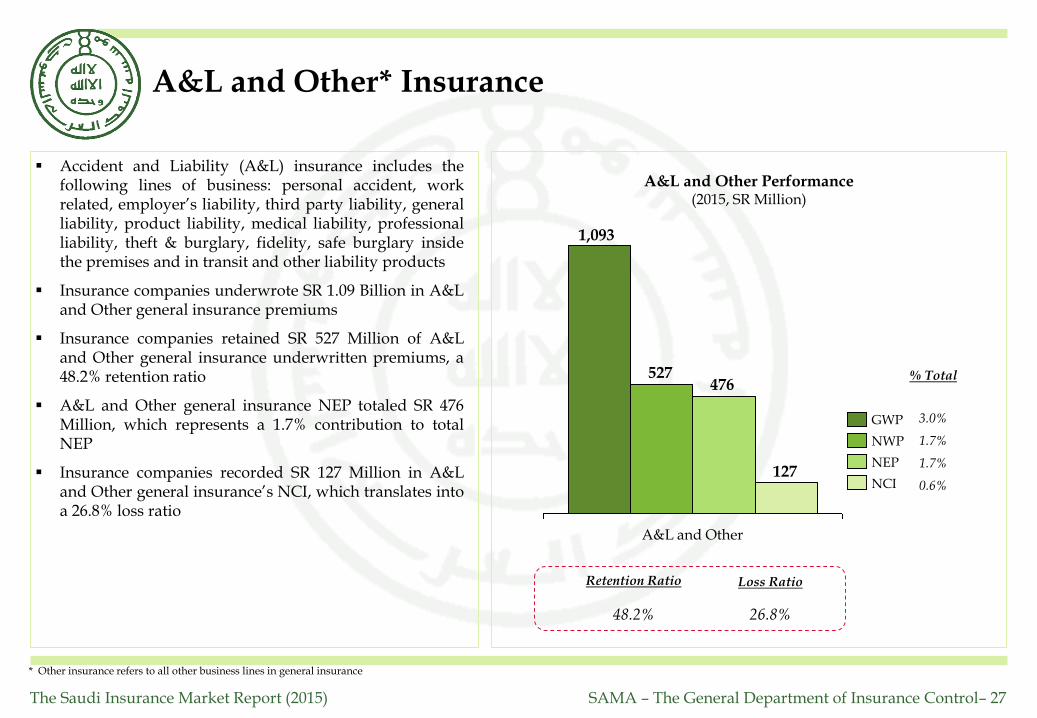
A&L and Other* Insurance
1,093
527476
127
A&L and Other
NCI
NEP
NWP
GWP
0.6%
1.7%
1.7%
3.0%
% Total
Retention Ratio Loss Ratio
48.2% 26.8%
A&L and Other Performance(2015, SR Million)
Accident and Liability (A&L) insurance includes thefollowing lines of business: personal accident, workrelated, employer’s liability, third party liability, generalliability, product liability, medical liability, professionalliability, theft & burglary, fidelity, safe burglary insidethe premises and in transit and other liability products
Insurance companies underwrote SR 1.09 Billion in A&Land Other general insurance premiums
Insurance companies retained SR 527 Million of A&Land Other general insurance underwritten premiums, a48.2% retention ratio
A&L and Other general insurance NEP totaled SR 476Million, which represents a 1.7% contribution to totalNEP
Insurance companies recorded SR 127 Million in A&Land Other general insurance’s NCI, which translates intoa 26.8% loss ratio
* Other insurance refers to all other business lines in general insurance

The Saudi Insurance Market Report (2015) SAMA – The General Department of Insurance Control– 28
Marine Insurance
726
249 251
118
Marine
NCI
NEP
NWP
GWP
0.5
0.9
0.8
2.0
% Total
Retention Ratio Loss Ratio
34.4% 46.9%
Marine Insurance Performance(2015, SR Million)
The Marine insurance line of business includes bothmarine cargo and marine hull insurance
Marine insurance GWP totaled SR 726 Million in 2015,which represents a 2.0% contribution to total marketGWP
Insurance companies retained 34.3% of their Marineinsurance underwritten premiums, as the business line’sNWP amounted to SR 249 Million
Marine insurance’s NEP recorded SR 251 Million, whichrepresents a 0.9% share of total NEP for 2015
Marine insurance’s NCI amounted to SR 118 Million.This resulted in a loss ratio of 46.9%
The Saudi Insurance Market Report (2015) SAMA – The General Department of Insurance Control– 29
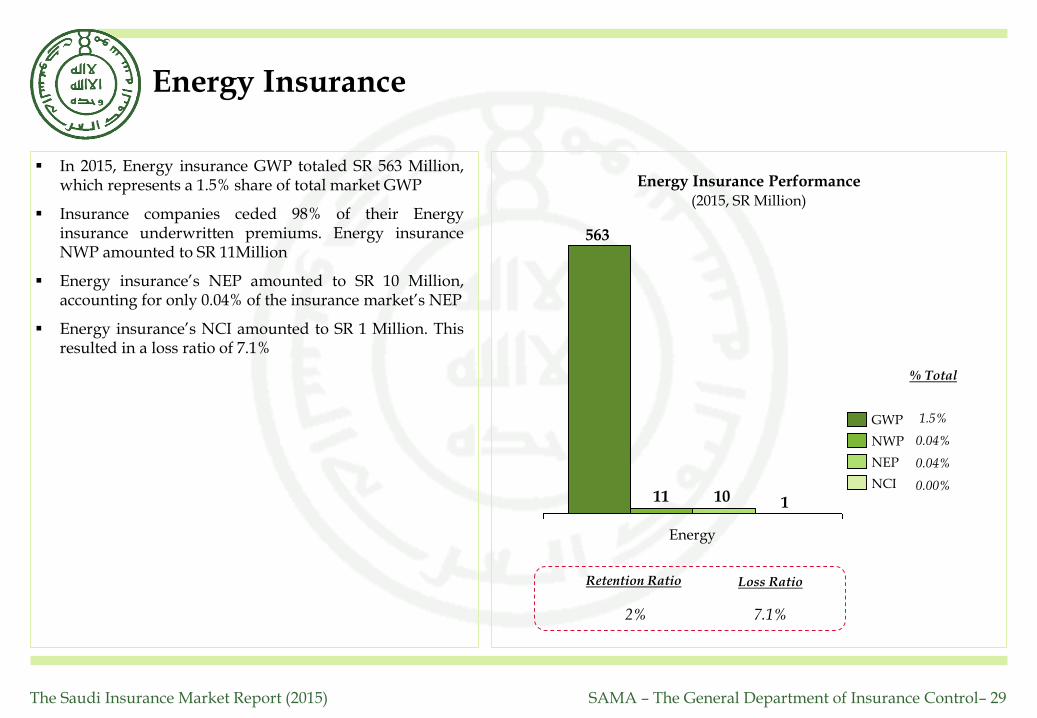
Energy Insurance
563
11 10 1
Energy
NEP
NWP
NCI
GWP
0.00%
0.04%
0.04%
1.5%
% Total
Retention Ratio Loss Ratio
2% 7.1%
Energy Insurance Performance(2015, SR Million)
In 2015, Energy insurance GWP totaled SR 563 Million,which represents a 1.5% share of total market GWP
Insurance companies ceded 98% of their Energyinsurance underwritten premiums. Energy insuranceNWP amounted to SR 11Million
Energy insurance’s NEP amounted to SR 10 Million,accounting for only 0.04% of the insurance market’s NEP
Energy insurance’s NCI amounted to SR 1 Million. Thisresulted in a loss ratio of 7.1%

The Saudi Insurance Market Report (2015) SAMA – The General Department of Insurance Control– 30
Aviation Insurance
147
3 3 1
Aviation
NCI
NEP
NWP
GWP
0.00%
0.01%
0.01%
0.40%
% Total
Retention Ratio Loss Ratio
2% 26.8%
Aviation Insurance Performance(2015, SR Million)
Aviation insurance GWP reached SR 147 Million in 2015,a 0.40% contribution to total market GWP
NWP for Aviation insurance reached SR 3 Million,resulting in a retention ratio of 1%
Aviation insurance’s NEP totaled SR 3 Million,accounting for only 0.01% of the insurance market’s NEP
Aviation insurance’s NCI amounted to SR 1 Million.This resulted in a loss ratio of 26.8%

31
Other Market Indicators
The Saudi Insurance Market Report (2015) SAMA – The General Department of Insurance Control– 32
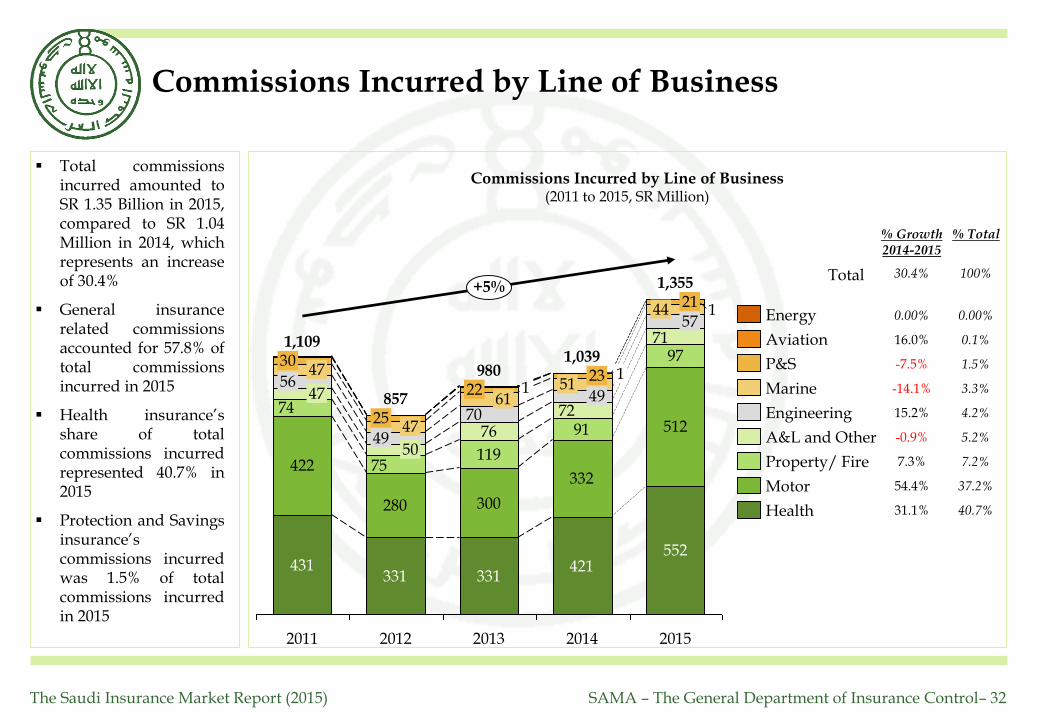
Commissions Incurred by Line of Business
Commissions Incurred by Line of Business(2011 to 2015, SR Million)
Total commissionsincurred amounted toSR 1.35 Billion in 2015,compared to SR 1.04Million in 2014, whichrepresents an increaseof 30.4%
General insurancerelated commissionsaccounted for 57.8% oftotal commissionsincurred in 2015
Health insurance’sshare of totalcommissions incurredrepresented 40.7% in2015
Protection and Savingsinsurance’scommissions incurredwas 1.5% of totalcommissions incurredin 2015
431331 331
421552
422
280 300
332
512
119
91
97
76
75
74
71
7270
1
11
2015
1,355
5744 21
2014
1,039
+5%
4951
23
2013
980
6122
2012
857
5049
4725
2011
1,109
4756
4730
% Growth 2014-2015
0.00%
-7.5%
-0.9%
16.0%
-14.1%
15.2%
7.3%
54.4%
31.1%Health
Motor
Property/ Fire
A&L and Other
Engineering
Marine
P&S
Aviation
Energy
40.7%
37.2%
7.2%
5.2%
4.2%
3.3%
1.5%
0.1%
0.00%
% Total
Total 30.4% 100%

The Saudi Insurance Market Report (2015) SAMA – The General Department of Insurance Control– 33
The total number of insurance companies’ employees inSaudi Arabia reached 9,607 in 2015, up from 9,559 in 2014
The ratio of Saudi nationals employed by insurancecompanies in 2015 increased, representing 59% of the totalworkforce
the Saudization ratio for non-managerial positionsincreased to 62%, while the Saudization ratio formanagerial positions decreased to 42%, down from 44% in2014
Note: A newly licensed insurance company is required toadhere to a Saudization ratio of 30% at the end of its firstyear of operation and shall increase the ratio annually,according to its Saudization plan (as per Article 79 of theImplementing Regulations)
Employees Breakdown by Nationality
Number of Employees vs. Saudization Ratio (2015)
0
100
200
300
400
500
600
700
800
900
1,000
1,100
1,200
1,300
1,400
1,500
0 5 10 15 20 25 30 35 40 45 50 55 60 65 70 75 80 85
Number of Employees
Saudization Ratio
Minimum Saudization ratio
Nationality
No. of Managerial Employees
Total No. of Employees
No. of Non–managerial Employees
2014 2015 2014 2015 2014 2015
Other Arab
Other Non–Arab
Saudi
Saudization Ratio
Total
1,379 443 512 1,822 1,770
1,954 1,733 383 473 2,328 2206
4,765 4.974 644 732 5,409 5,706
59% 62% 44% 42% 57% 59%
8,089 7,965 1,470 1,717 9,559 9,682
1,258
The Saudi Insurance Market Report (2015) SAMA – The General Department of Insurance Control– 34
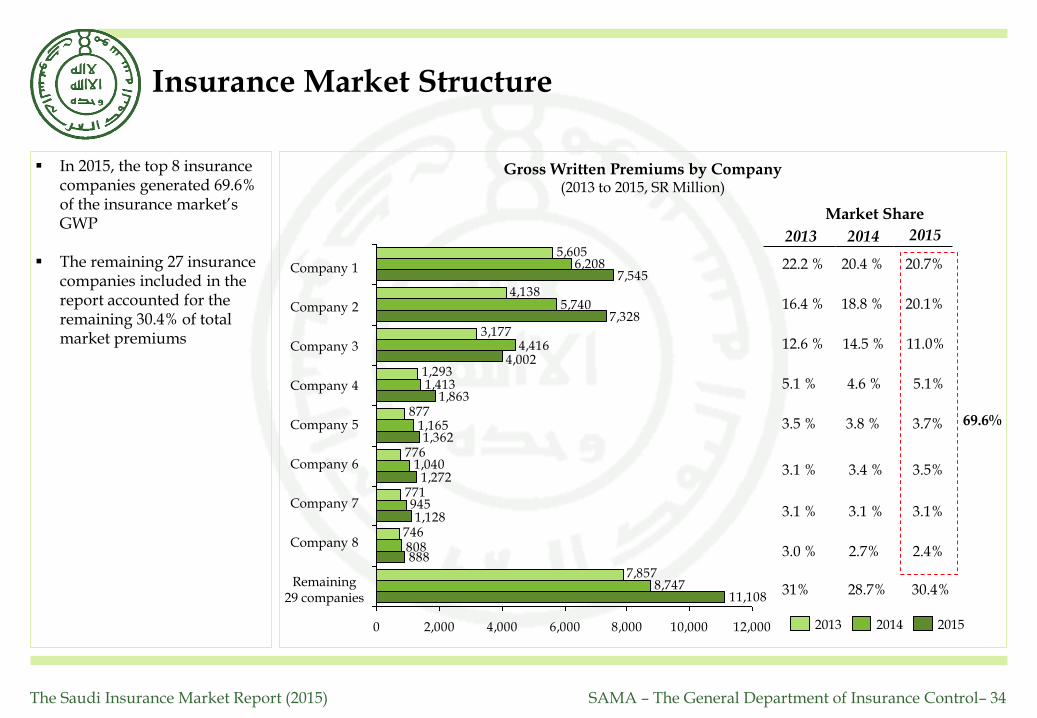
Insurance Market Structure
In 2015, the top 8 insurance companies generated 69.6% of the insurance market’s GWP
The remaining 27 insurance companies included in the report accounted for the remaining 30.4% of total market premiums
Gross Written Premiums by Company (2013 to 2015, SR Million)
4,138
945
8,7477,857
746
771
776
877
1,293
3,177
5,605
808
1,040
1,165
1,413
4,416
5,740
6,208
11,108
888
1,128
1,272
1,362
1,863
4,002
7,328
7,545
0 2,000 4,000 6,000 8,000 10,000 12,000 2013 2014 2015
Remaining 29 companies
Market Share
69.6%
2013 2014 2015
Company 8
Company 7
Company 6
Company 5
Company 4
Company 3
Company 2
Company 1 22.2 %
16.4 %
12.6 %
5.1 %
3.5 %
3.1 %
3.1 %
3.0 %
31%
20.4 %
18.8 %
14.5 %
4.6 %
3.8 %
3.4 %
3.1 %
2.7%
28.7%
20.7%
20.1%
11.0%
5.1%
3.7%
3.5%
3.1%
2.4%
30.4%
The Saudi Insurance Market Report (2015) SAMA – The General Department of Insurance Control– 35
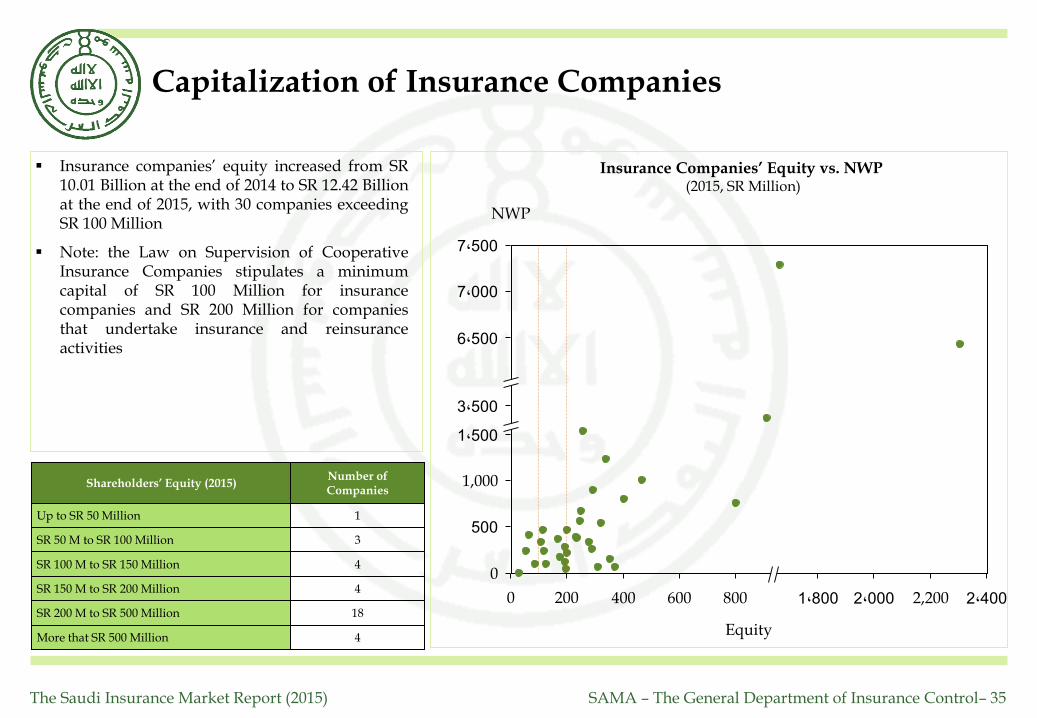
Capitalization of Insurance Companies
Insurance companies’ equity increased from SR10.01 Billion at the end of 2014 to SR 12.42 Billionat the end of 2015, with 30 companies exceedingSR 100 Million
Note: the Law on Supervision of CooperativeInsurance Companies stipulates a minimumcapital of SR 100 Million for insurancecompanies and SR 200 Million for companiesthat undertake insurance and reinsuranceactivities
Insurance Companies’ Equity vs. NWP (2015, SR Million)
1،8008006004002000
7،500
7،000
6،500
3،500
1،500
1,000
500
0
2،4002,2002،000
NWP
Equity
Number of Companies
Shareholders’ Equity (2015)
Up to SR 50 Million 1
SR 50 M to SR 100 Million 3
SR 100 M to SR 150 Million 4
SR 150 M to SR 200 Million 4
SR 200 M to SR 500 Million 18
More that SR 500 Million 4

36
Appendix: Data Tables
The Saudi Insurance Market Report (2015) SAMA – The General Department of Insurance Control– 37
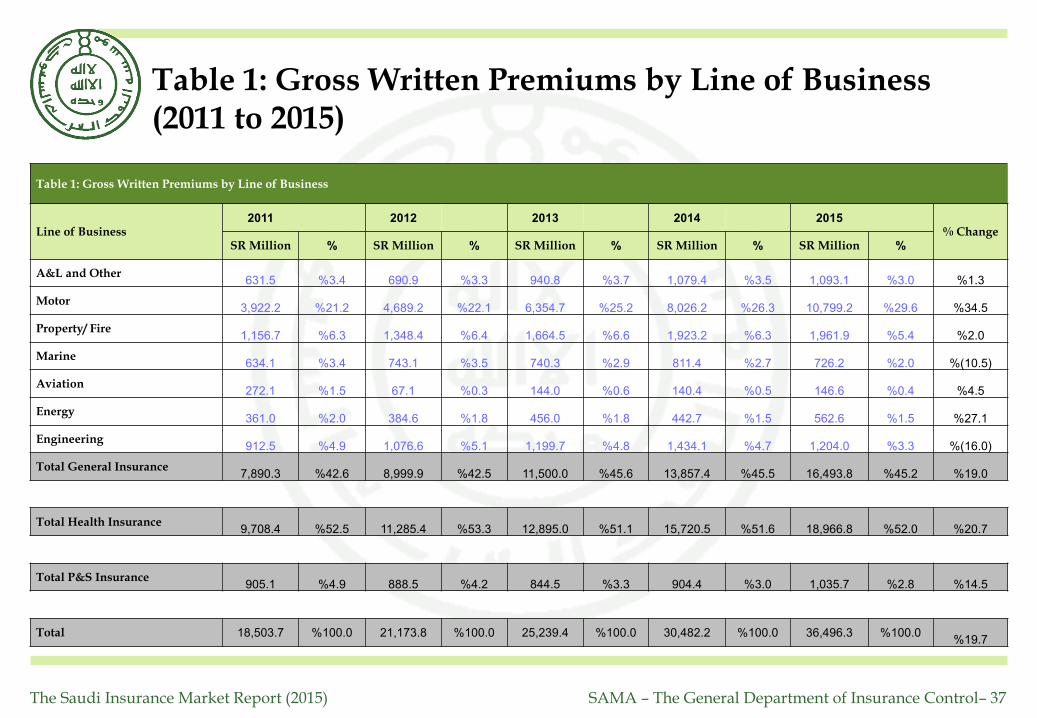
Table 1: Gross Written Premiums by Line of Business (2011 to 2015)
Table 1: Gross Written Premiums by Line of Business
Line of Business2011 2012 2013 2014 2015
% ChangeSR Million % SR Million % SR Million % SR Million % SR Million %
A&L and Other631.5 3.4% 690.9 3.3% 940.8 3.7% 1,079.4 3.5% 1,093.1 3.0% 1.3%
Motor3,922.2 21.2% 4,689.2 22.1% 6,354.7 25.2% 8,026.2 26.3% 10,799.2 29.6% 34.5%
Property/ Fire1,156.7 6.3% 1,348.4 6.4% 1,664.5 6.6% 1,923.2 6.3% 1,961.9 5.4% 2.0%
Marine634.1 3.4% 743.1 3.5% 740.3 2.9% 811.4 2.7% 726.2 2.0% (10.5%)
Aviation272.1 1.5% 67.1 0.3% 144.0 0.6% 140.4 0.5% 146.6 0.4% 4.5%
Energy361.0 2.0% 384.6 1.8% 456.0 1.8% 442.7 1.5% 562.6 1.5% 27.1%
Engineering912.5 4.9% 1,076.6 5.1% 1,199.7 4.8% 1,434.1 4.7% 1,204.0 3.3% (16.0%)
Total General Insurance7,890.3 42.6% 8,999.9 42.5% 11,500.0 45.6% 13,857.4 45.5% 16,493.8 45.2% 19.0%
Total Health Insurance9,708.4 52.5% 11,285.4 53.3% 12,895.0 51.1% 15,720.5 51.6% 18,966.8 52.0% 20.7%
Total P&S Insurance905.1 4.9% 888.5 4.2% 844.5 3.3% 904.4 3.0% 1,035.7 2.8% 14.5%
Total 18,503.7 100.0% 21,173.8 100.0% 25,239.4 100.0% 30,482.2 100.0% 36,496.3 100.0%19.7%

The Saudi Insurance Market Report (2015) SAMA – The General Department of Insurance Control– 38
Tables 2 & 3: Insurance Penetration and Density (2011 to 2015)
Table 2: Insurance Penetration
Line of Business2011 2012 2013 2014 2015
% Change
% % % % %
Total General Insurance0.36% 0.33% 0.41% 0.49% 0.67% 37.1%
Total Health Insurance0.45% 0.41% 0.46% 0.56% 0.77% 39.0%
Total P&S Insurance0.04% 0.03% 0.03% 0.03% 0.04% 31.9%
Total0.85% 0.78% 0.90% 1.08% 1.49% 37.9%
Table 3: Insurance Density
Line of Business2011 2012 2013 2014 2015
% Change
SR SR SR SR SR
Total General Insurance290.8 308.3 393.9 450.4 536.0 19.0%
Total Health Insurance357.8 386.5 441.7 510.9 616.4 20.6%
Total P&S Insurance33.4 30.4 28.9 29.4 33.7 14.5%
Total682.0 725.2 864.5 990.6 1186.1 19.7%
The Saudi Insurance Market Report (2015) SAMA – The General Department of Insurance Control– 39
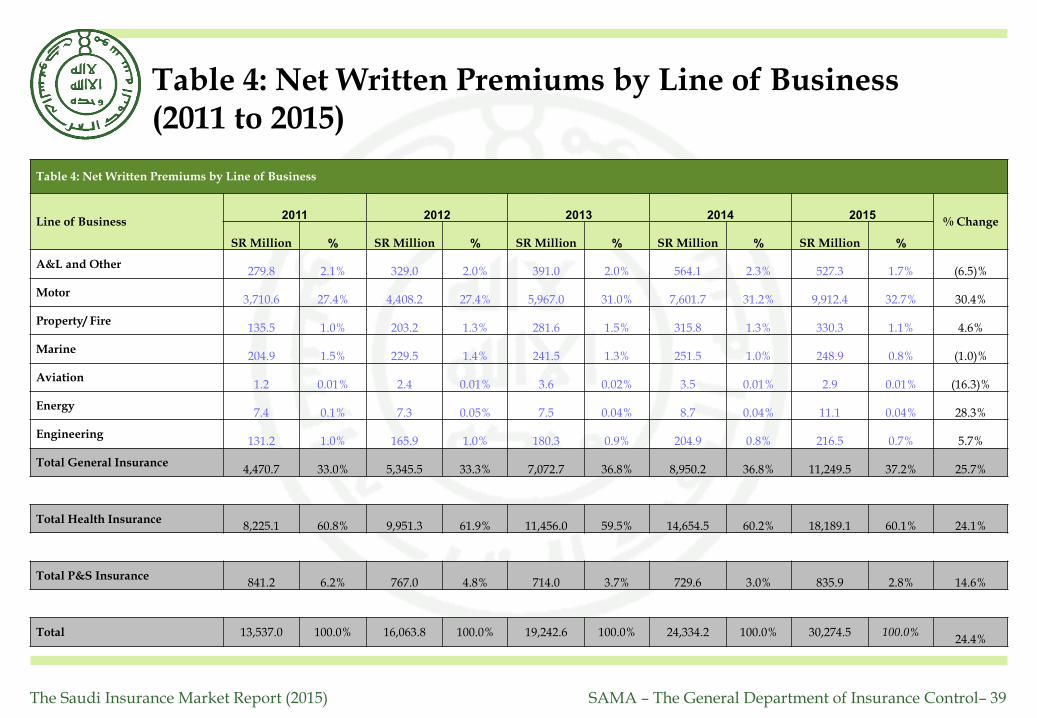
Table 4: Net Written Premiums by Line of Business(2011 to 2015)
Table 4: Net Written Premiums by Line of Business
Line of Business2011 2012 2013 2014 2015
% Change
SR Million % SR Million % SR Million % SR Million % SR Million %
A&L and Other279.8 2.1% 329.0 2.0% 391.0 2.0% 564.1 2.3% 527.3 1.7% (6.5)%
Motor3,710.6 27.4% 4,408.2 27.4% 5,967.0 31.0% 7,601.7 31.2% 9,912.4 32.7% 30.4%
Property/ Fire135.5 1.0% 203.2 1.3% 281.6 1.5% 315.8 1.3% 330.3 1.1% 4.6%
Marine204.9 1.5% 229.5 1.4% 241.5 1.3% 251.5 1.0% 248.9 0.8% (1.0)%
Aviation1.2 0.01% 2.4 0.01% 3.6 0.02% 3.5 0.01% 2.9 0.01% (16.3)%
Energy7.4 0.1% 7.3 0.05% 7.5 0.04% 8.7 0.04% 11.1 0.04% 28.3%
Engineering131.2 1.0% 165.9 1.0% 180.3 0.9% 204.9 0.8% 216.5 0.7% 5.7%
Total General Insurance4,470.7 33.0% 5,345.5 33.3% 7,072.7 36.8% 8,950.2 36.8% 11,249.5 37.2% 25.7%
Total Health Insurance8,225.1 60.8% 9,951.3 61.9% 11,456.0 59.5% 14,654.5 60.2% 18,189.1 60.1% 24.1%
Total P&S Insurance841.2 6.2% 767.0 4.8% 714.0 3.7% 729.6 3.0% 835.9 2.8% 14.6%
Total 13,537.0 100.0% 16,063.8 100.0% 19,242.6 100.0% 24,334.2 100.0% 30,274.5 100.0%24.4%
The Saudi Insurance Market Report (2015) SAMA – The General Department of Insurance Control– 40
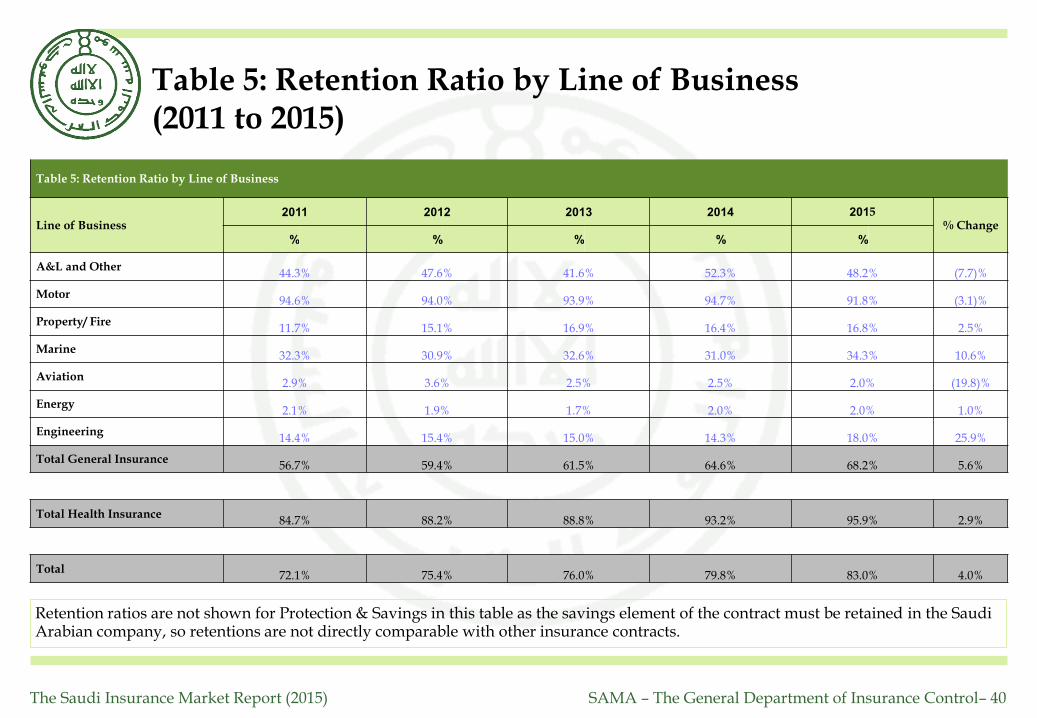
Table 5: Retention Ratio by Line of Business(2011 to 2015)
Retention ratios are not shown for Protection & Savings in this table as the savings element of the contract must be retained in the Saudi Arabian company, so retentions are not directly comparable with other insurance contracts.
Table 5: Retention Ratio by Line of Business
Line of Business2011 2012 2013 2014 2015
% Change% % % % %
A&L and Other44.3% 47.6% 41.6% 52.3% 48.2% (7.7)%
Motor94.6% 94.0% 93.9% 94.7% 91.8% (3.1)%
Property/ Fire11.7% 15.1% 16.9% 16.4% 16.8% 2.5%
Marine32.3% 30.9% 32.6% 31.0% 34.3% 10.6%
Aviation2.9% 3.6% 2.5% 2.5% 2.0% (19.8)%
Energy2.1% 1.9% 1.7% 2.0% 2.0% 1.0%
Engineering14.4% 15.4% 15.0% 14.3% 18.0% 25.9%
Total General Insurance56.7% 59.4% 61.5% 64.6% 68.2% 5.6%
Total Health Insurance84.7% 88.2% 88.8% 93.2% 95.9% 2.9%
Total72.1% 75.4% 76.0% 79.8% 83.0% 4.0%
The Saudi Insurance Market Report (2015) SAMA – The General Department of Insurance Control– 41
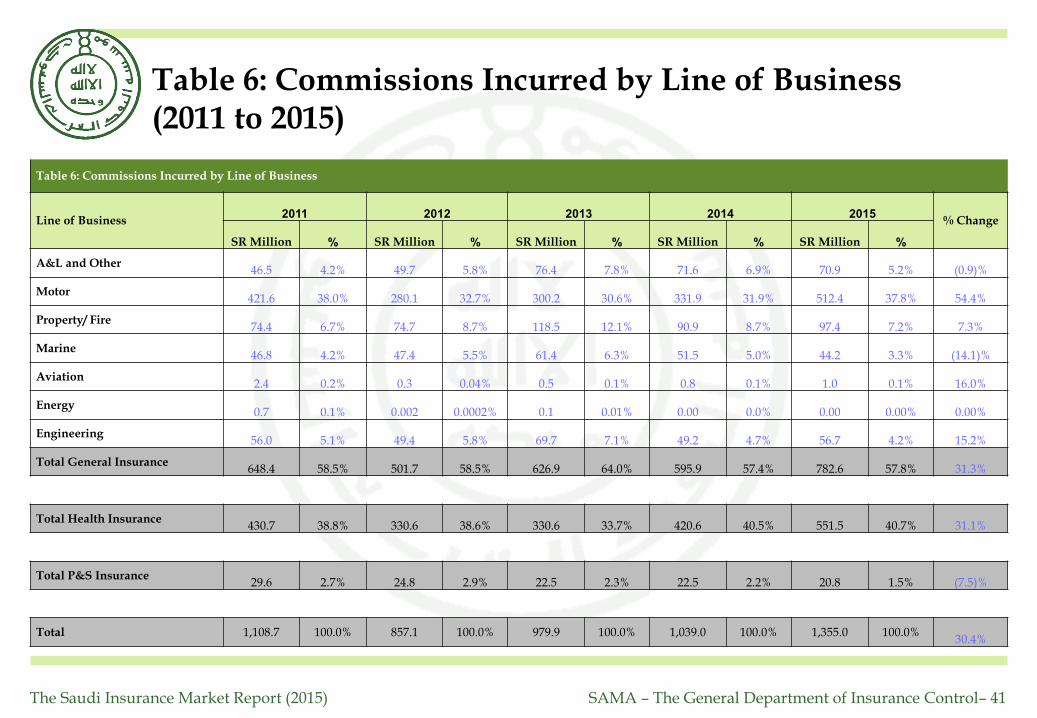
Table 6: Commissions Incurred by Line of Business(2011 to 2015)
Table 6: Commissions Incurred by Line of Business
Line of Business2011 2012 2013 2014 2015
% Change
SR Million % SR Million % SR Million % SR Million % SR Million %
A&L and Other46.5 4.2% 49.7 5.8% 76.4 7.8% 71.6 6.9% 70.9 5.2% (0.9)%
Motor421.6 38.0% 280.1 32.7% 300.2 30.6% 331.9 31.9% 512.4 37.8% 54.4%
Property/ Fire74.4 6.7% 74.7 8.7% 118.5 12.1% 90.9 8.7% 97.4 7.2% 7.3%
Marine46.8 4.2% 47.4 5.5% 61.4 6.3% 51.5 5.0% 44.2 3.3% (14.1)%
Aviation2.4 0.2% 0.3 0.04% 0.5 0.1% 0.8 0.1% 1.0 0.1% 16.0%
Energy0.7 0.1% 0.002 0.0002% 0.1 0.01% 0.00 0.0% 0.00 0.00% 0.00%
Engineering56.0 5.1% 49.4 5.8% 69.7 7.1% 49.2 4.7% 56.7 4.2% 15.2%
Total General Insurance648.4 58.5% 501.7 58.5% 626.9 64.0% 595.9 57.4% 782.6 57.8% 31.3%
Total Health Insurance430.7 38.8% 330.6 38.6% 330.6 33.7% 420.6 40.5% 551.5 40.7% 31.1%
Total P&S Insurance29.6 2.7% 24.8 2.9% 22.5 2.3% 22.5 2.2% 20.8 1.5% (7.5)%
Total 1,108.7 100.0% 857.1 100.0% 979.9 100.0% 1,039.0 100.0% 1,355.0 100.0%30.4%
The Saudi Insurance Market Report (2015) SAMA – The General Department of Insurance Control– 42
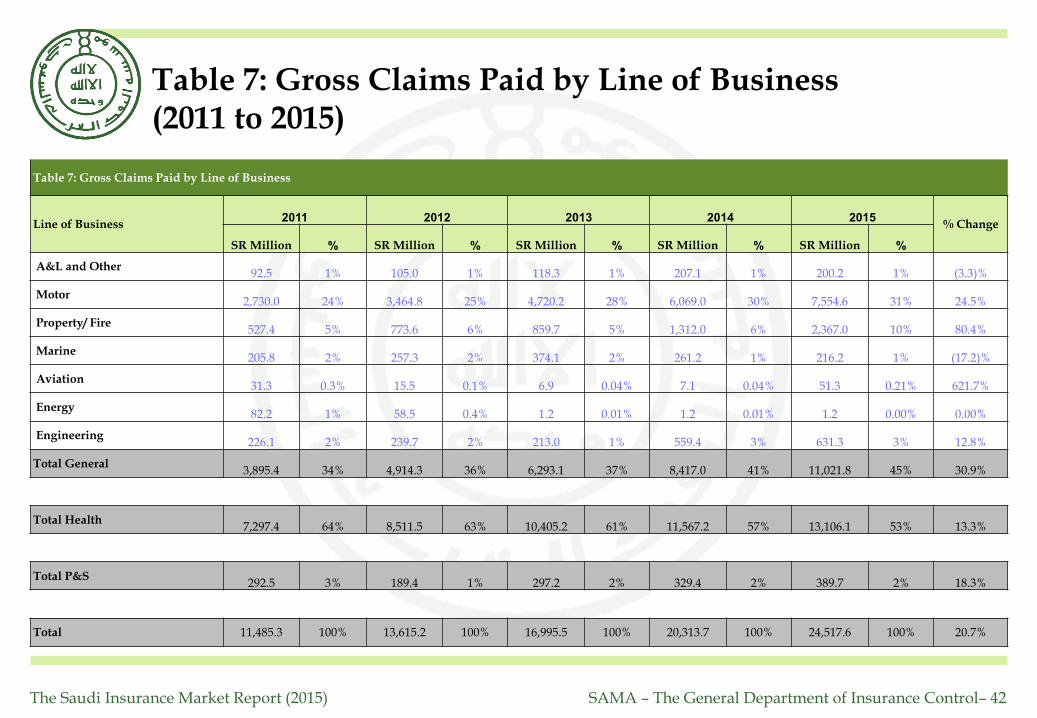
Table 7: Gross Claims Paid by Line of Business(2011 to 2015)
Table 7: Gross Claims Paid by Line of Business
Line of Business2011 2012 2013 2014 2015
% Change
SR Million % SR Million % SR Million % SR Million % SR Million %
A&L and Other92.5 1% 105.0 1% 118.3 1% 207.1 1% 200.2 1% (3.3)%
Motor2,730.0 24% 3,464.8 25% 4,720.2 28% 6,069.0 30% 7,554.6 31% 24.5%
Property/ Fire527.4 5% 773.6 6% 859.7 5% 1,312.0 6% 2,367.0 10% 80.4%
Marine205.8 2% 257.3 2% 374.1 2% 261.2 1% 216.2 1% (17.2)%
Aviation31.3 0.3% 15.5 0.1% 6.9 0.04% 7.1 0.04% 51.3 0.21% 621.7%
Energy82.2 1% 58.5 0.4% 1.2 0.01% 1.2 0.01% 1.2 0.00% 0.00%
Engineering226.1 2% 239.7 2% 213.0 1% 559.4 3% 631.3 3% 12.8%
Total General3,895.4 34% 4,914.3 36% 6,293.1 37% 8,417.0 41% 11,021.8 45% 30.9%
Total Health7,297.4 64% 8,511.5 63% 10,405.2 61% 11,567.2 57% 13,106.1 53% 13.3%
Total P&S292.5 3% 189.4 1% 297.2 2% 329.4 2% 389.7 2% 18.3%
Total 11,485.3 100% 13,615.2 100% 16,995.5 100% 20,313.7 100% 24,517.6 100% 20.7%
Recommended