Saturated Hydraulic Conductivity at Shale Hills CZOAUTHORS: ANNA SCHWYTER, MEAGAN REDMON, HENRY LIN, NEIL XU, NATIONAL SCIENCE FOUNDATION, PENNSYLVANIA STATE UNIVERSITY

Overview•The purpose of this study is two-fold:
◦ To determine in-situ hydraulic conductivity throughout Shale Hills.
◦ To find the spatial variability of soil hydraulic conductivity and its relationship with hillslope position and aspect.
•This is a continuation of work to create a dataset to characterize hydraulic conductivity of Shale Hills.
•Double-ring infiltrometers were used at fifteen sites across the Shale Hills catchment with three replications at each site to determine saturated hydraulic conductivity. Sites were located along five transects including ridge top, midslope and valley floor slope positions on both the north- and south-facing slopes.
I Transect Name
III
III
VIV

Questions Addressed•How does hydraulic conductivity differ between slope positions compared between different transects and on opposing slopes?
•Is there a significant difference among the same hill slope position sites on opposing slopes?
•Does saturated hydraulic conductivity measure consistently enough in a 1 m triangle to find an accurate Ks reading for a single site?
•Does saturated hydraulic conductivity relate to initial soil moisture content measured prior to the infiltration test?

Background Information•Sites are an addition to data collected by Dr. Henry Lin and Dr. Jainbin Lai to represent the Shale Hills catchment.
•15 of 30 “new sites” were tested with double-ring infiltrometers to find infiltration rate.o Sites 1 and 5 had invalid data and are considered
outliers.
•Initial soil moisture content measurements were taken with a Theta Probe.
•Turf Tec Double Ring Infiltrometers were used to measure infiltration rate.o Each site included three replications set up in a
1x1x1 meter triangle.o Infiltrometers must be level, as well as flush with
the ground.
Infiltrometer set up with three replications in a 1 m triangle.
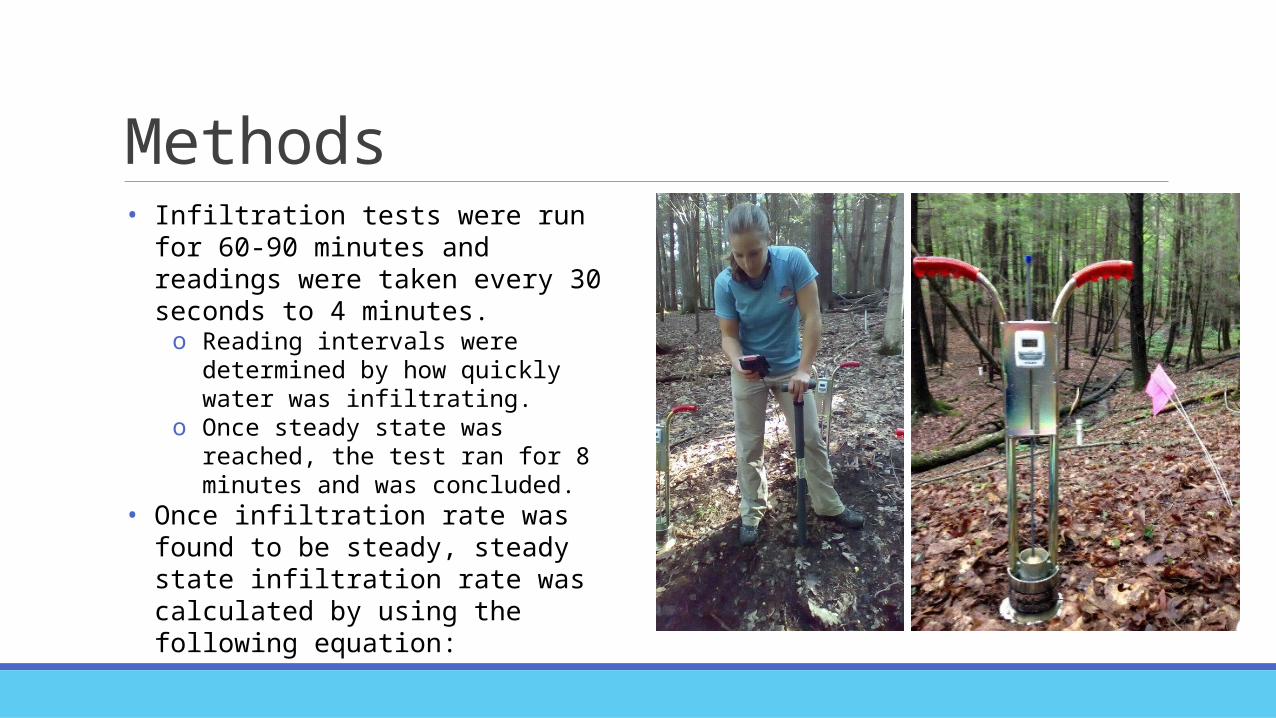
Methods• Infiltration tests were run for 60-90
minutes and readings were taken every 30 seconds to 4 minutes.o Reading intervals were determined by
how quickly water was infiltrating.o Once steady state was reached, the test
ran for 8 minutes and was concluded.• Once infiltration rate was found to be
steady, steady state infiltration rate was calculated by using the following equation:
• This value is equated to Ks
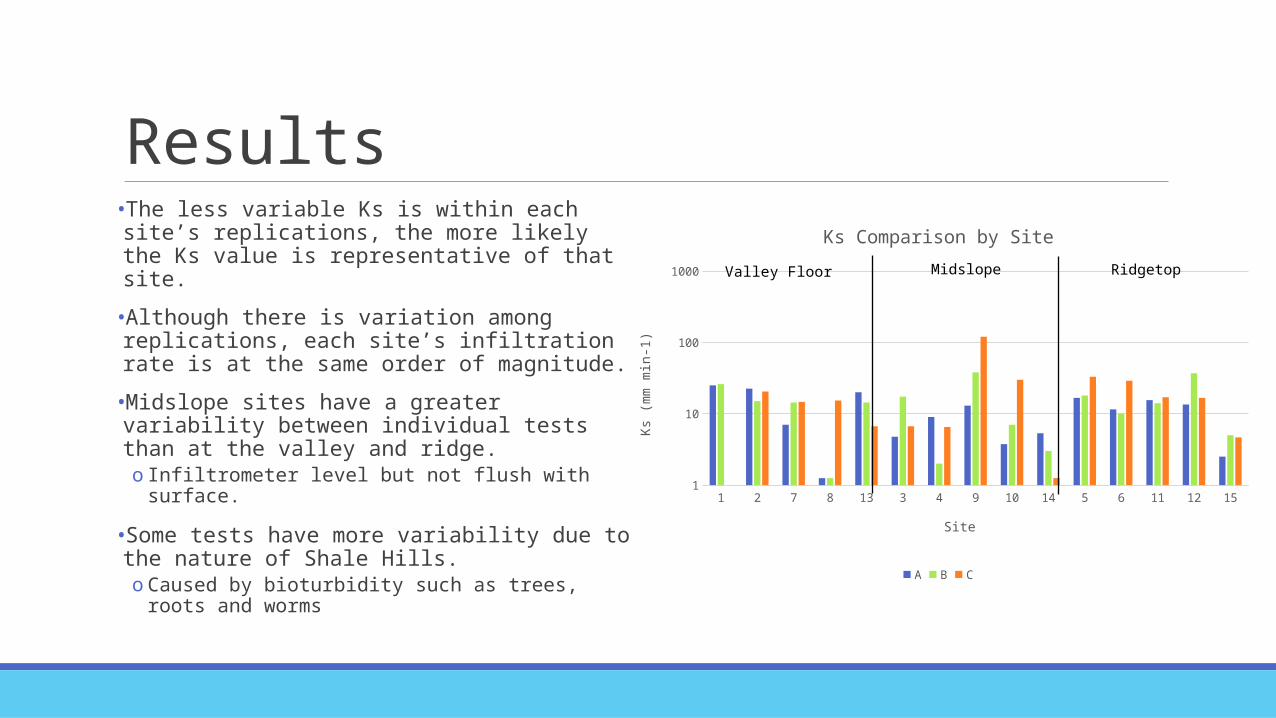
Results•The less variable Ks is within each site’s replications, the more likely the Ks value is representative of that site.
•Although there is variation among replications, each site’s infiltration rate is at the same order of magnitude.
•Midslope sites have a greater variability between individual tests than at the valley and ridge.o Infiltrometer level but not flush with surface.
•Some tests have more variability due to the nature of Shale Hills.o Caused by bioturbidity such as trees, roots and
worms
1 2 7 8 13 3 4 9 10 14 5 6 11 12 151
10
100
1000
Ks Comparison by Site
A B C
Site
Ks (m
m m
in-1
)
Valley Floor Midslope Ridgetop

Discussion•The predicted trend for hillslope positions is that Ks would be the highest at valley floor, lowest at the midslope and moderate at the ridgetop.
•Midslope soils likely have higher preferential flow since there was observed to be more vegetation present.
•However not all values follow this trend.o Transect V follows the predicted trend, and low Ks values can
be attributed to the extreme slope of that transect.o Both transects on the South-Facing Slope follow the
predicted trend. Does aspect determine the trend of Ks observed? North- and South-facing slopes have different slopes and
vegetation, affecting infiltration rates.
Valley Midslope Ridge0
5
10
15
20
25
30
35
40
South Facing Slope
III
Ks (m
m m
in-1
)
Valley Midslope Ridge0
10
20
30
40
50
60North Facing Slope
IIIIVV
Ks (m
m m
in-1
)

North-Facing Slope, Valley vs Ridgetop•Valley floor and ridgetop have inconsistent infiltration rates because of the differences in soil structure.
1 4 7 10 13 16 190
5
10
15
20
25
30
35
Sites 7 (Valley Floor) vs 11 (Ridgetop)
7.A7.B7.C11.A11.B11.C
Time (min)
Infil
trati
on R
ate
(mm
/min
)
3 6 9 12 15 18 21 24 27 30 33 36 39 42 45 48 51 54 57 600
2
4
6
8
10
12
Sites 13 (Valley floor) and 15 (Ridgetop)
13.A13.B13.B15.A15.B15.C
Time (min)
Infil
trati
on R
ate
(mm
/min
)
• A lower infiltration rate at the ridgetop position might be explained by fewer trees, so less root holes and fewer macropores exist.
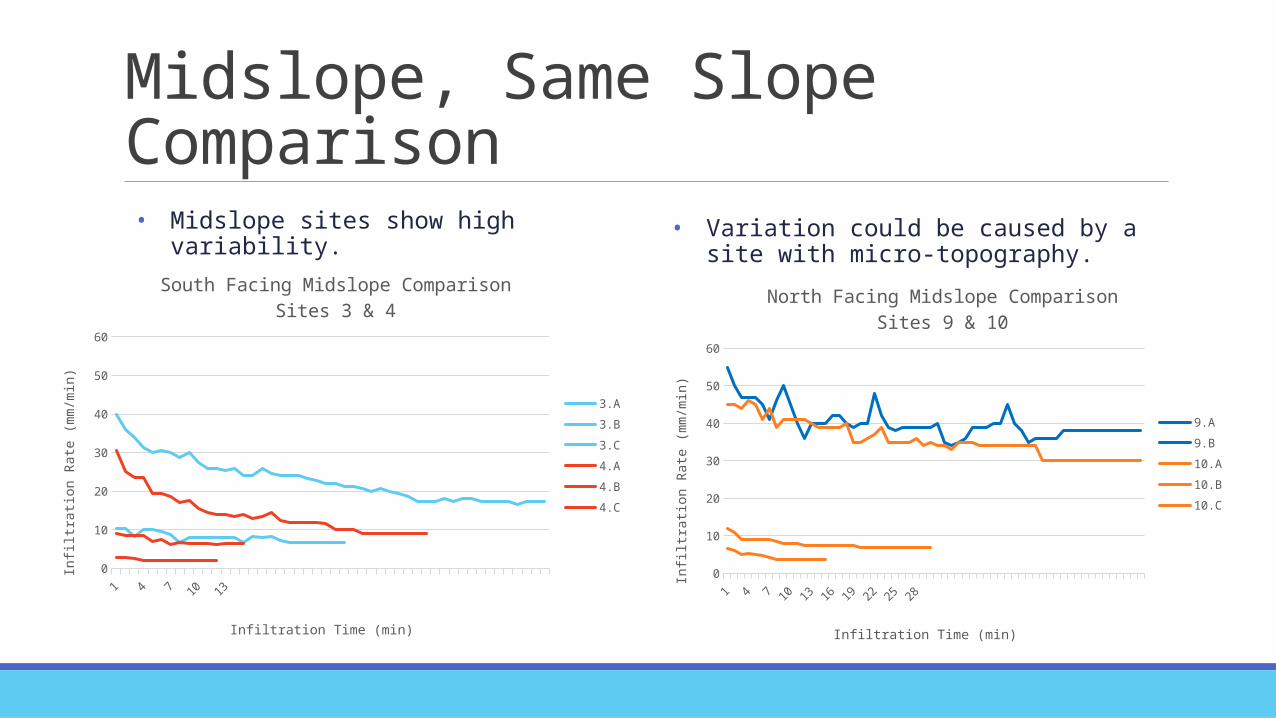
Midslope, Same Slope Comparison
• Variation could be caused by a site with micro-topography.
1 3 5 7 9 11 13 150
10
20
30
40
50
60
South Facing Midslope ComparisonSites 3 & 4
3.A3.B3.C4.A4.B4.C
Infiltration Time (min)
Infil
trati
on R
ate
(mm
/min
)
• Midslope sites show high variability.
1 4 7 10 13 16 19 22 25 280
10
20
30
40
50
60
North Facing Midslope ComparisonSites 9 & 10
9.A9.B10.A10.B10.C
Infiltration Time (min)
Infil
trati
on R
ate
(mm
/min
)
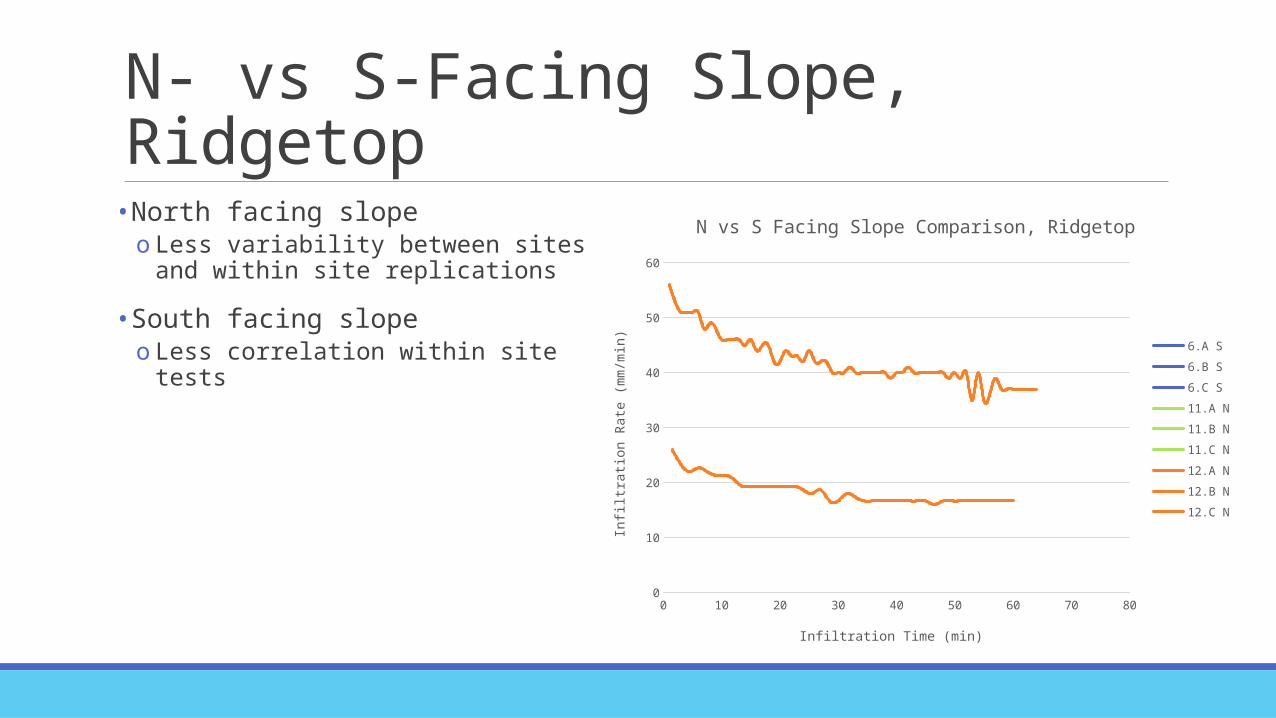
N- vs S-Facing Slope, Ridgetop•North facing slopeo Less variability between sites and within site
replications
•South facing slopeo Less correlation within site tests
0 10 20 30 40 50 60 70 800
10
20
30
40
50
60
N vs S Facing Slope Comparison, Ridgetop
6.A S6.B S6.C S11.A N11.B N11.C N12.A N12.B N12.C N
Infiltration Time (min)
Infil
trati
on R
ate
(mm
/min
)

N- vs S-Facing Slope, Midslope•Midslopes are especially variable due to preferential flow patterns not allowing water to infiltrate directly down.
•North-facing slopeo Sites have little correlation within replications.o Site 10 is north-facing yet shows similar rates to
the south-facing slopes of the same hillslope position.
•South-facing slopeo Infiltration rates are lower compared to the
north-facing slope sites.
0 10 20 30 40 50 60 70 800
10
20
30
40
50
60
N vs S Facing Slope, Midslope
3.A S3.B S3.C S4.A S4.B S4.C S9.A N9.B N10.A N10.B N10.C N
Infiltration Time (min)In
filtr
ation
Rat
e (m
m/m
in)

N- vs S-Facing Slope, Valley Floor•Valley floor soil has less structure, since it is colluvium.• Less ability to form macropores.
•These sites were in close proximity to the stream, which could affect infiltration rates.
•Sites on valley floor have more human impact from the instrument installment at the CZO.•Soils may be compacted. 0 10 20 30 40 50 60 70
0
5
10
15
20
25
30
N vs S Facing Slope, Valley Floor
2.A S
2.B S
2.C S
7.A N
7.B N
7.C N
8.A N
8.B N
8.C N
Infiltration Time (min)
Infil
trati
on R
ate
(mm
/min
)
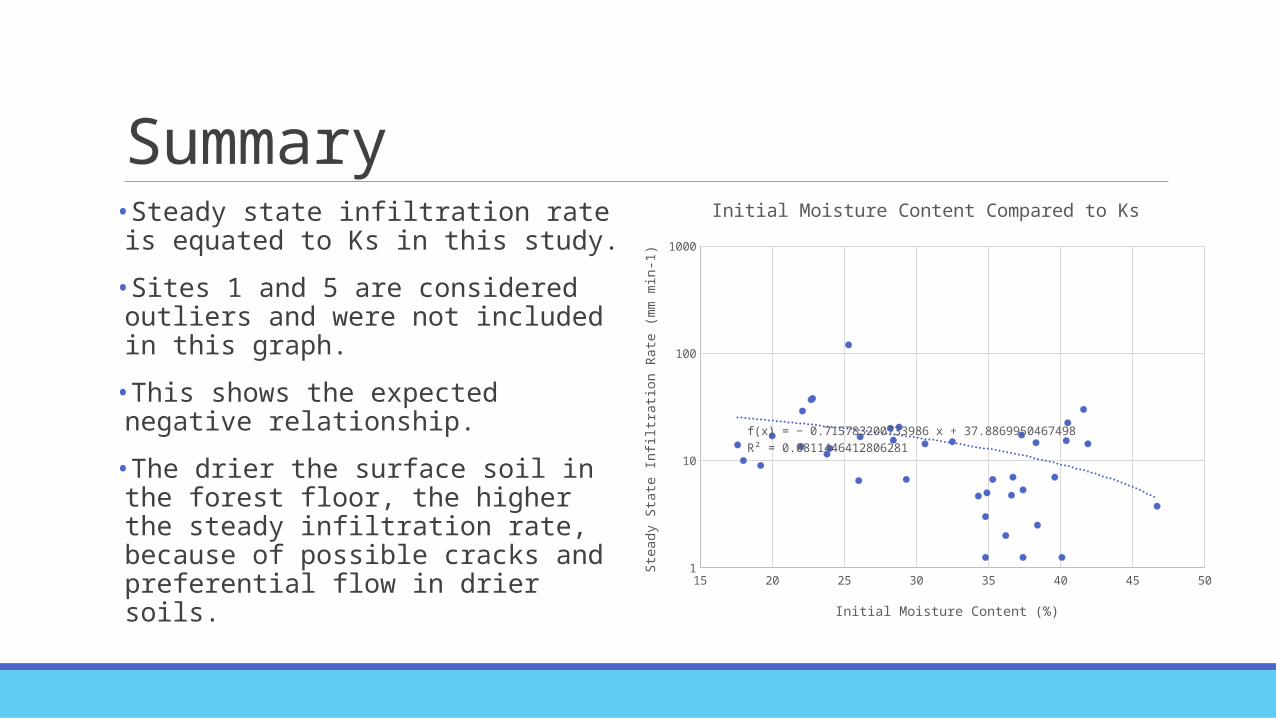
Summary•Steady state infiltration rate is equated to Ks in this study.
•Sites 1 and 5 are considered outliers and were not included in this graph.
•This shows the expected negative relationship.
•The drier the surface soil in the forest floor, the higher the steady infiltration rate, because of possible cracks and preferential flow in drier soils.
15 20 25 30 35 40 45 501
10
100
1000
f(x) = − 0.715783200733986 x + 37.8869950467498R² = 0.0811446412806281
Initial Moisture Content Compared to Ks
Initial Moisture Content (%)
Ste
ady
Stat
e In
filtr
ation
Rat
e (m
m m
in-1
)

Conclusions•There is a great deal of variability in saturated hydraulic conductivity even at a micro-scale of 1 meter.
•No specific trend was outstanding when comparing hill slope positions on same and opposite slope aspects.
•This data has potential to be built upon to create a picture of Ks of the entire catchment.
•Future experiments should be sure to use infiltrometers level and flush to the ground to avoid compromising the seal of the double ring.
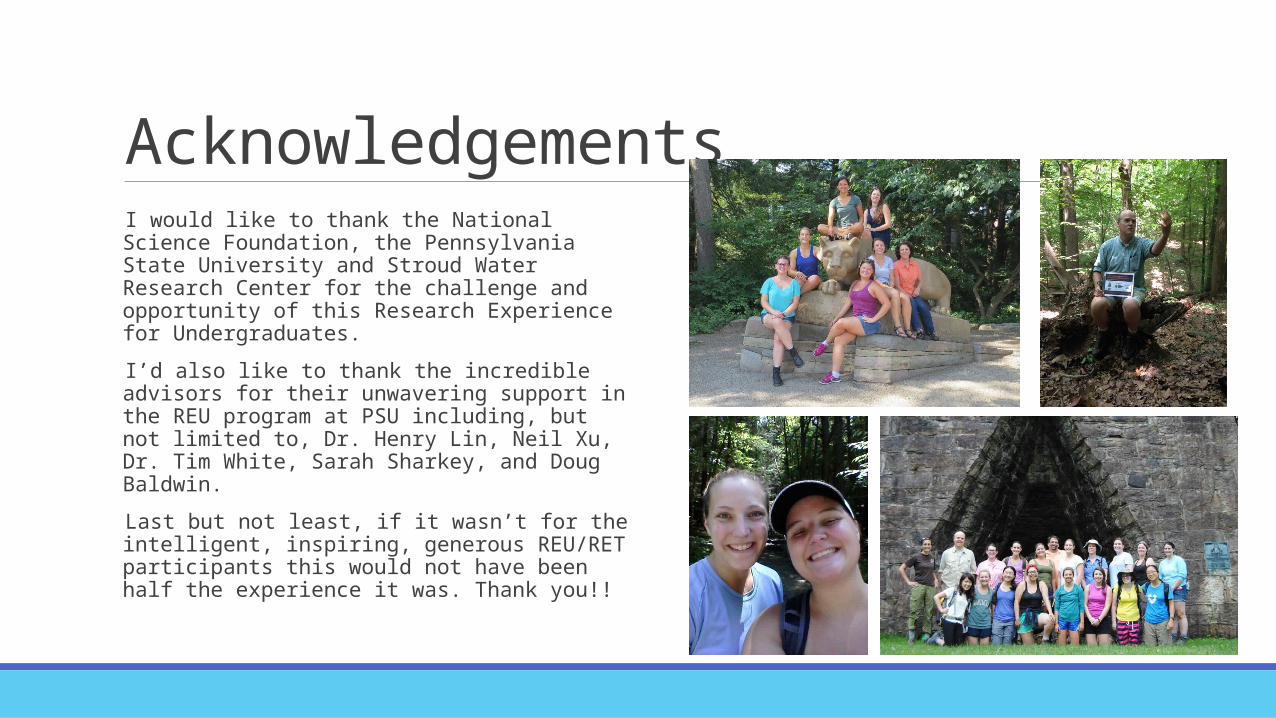
Acknowledgements I would like to thank the National Science Foundation, the Pennsylvania State University and Stroud Water Research Center for the challenge and opportunity of this Research Experience for Undergraduates.
I’d also like to thank the incredible advisors for their unwavering support in the REU program at PSU including, but not limited to, Dr. Henry Lin, Neil Xu, Dr. Tim White, Sarah Sharkey, and Doug Baldwin.
Last but not least, if it wasn’t for the intelligent, inspiring, generous REU/RET participants this would not have been half the experience it was. Thank you!!
Recommended