www.nasa.gov
National Aeronautics and Space Administration
ARSET Applied Remote Sensing Training http://arset.gsfc.nasa.gov @NASAARSET
Satellite Imagery Access, Interpretation, and Tools for Dust, Smoke, and Pollution Monitoring NASA ARSET Workshop: NASA Earth Observations, Data and Tools for Air Quality Applications Sunday, August 28, 2016 to Monday, August 29, 2016 17th IUAPPA World Clean Air Congress and 9th CAA Better Air Quality (BAQ) Conference Pusan National University, Busan, South Korea

National Aeronautics and Space Administration 2 Applied Remote Sensing Training Program
1. Learn about satellite data formats and levels
2. Learn about visible satellite imagery, feature detection, and applications
3. Provide a live demonstration and hands-on exercise on accessing and analyzing satellite imagery
Objectives

National Aeronautics and Space Administration 3 Applied Remote Sensing Training Program
L0: Raw Instrument Data
Data Processing Levels
L1: Geolocated & calibrated
L2: Products derived from L1B
L3: Gridded
L4: Model output: derived variables
Harder to Use
Easier to Use

National Aeronautics and Space Administration 4 Applied Remote Sensing Training Program
Orbital Data (Levels 0, 1, 2) • More user control • Highest spatial/temporal resolution
• Harder to use
Gridded Data Products (Levels 3, 4) • Less user control • Lower spatial/temporal resolution, but gridded
• May be available at multiple spatial/temporal resolutions
• More web tools available for analysis and access
• Easier to use
Data Levels

National Aeronautics and Space Administration 5 Applied Remote Sensing Training Program
Text/ASCII • Pros: easy to read and examine right away
• Cons: large data files, not always available
Binary: HDF, NetCDF, OpenDAP • Pros: less space, more information (metadata, SDS)
• Cons: Needs specific tools or code to read the data
KML or KMZ (zipped KML) • Pros: easy 2D & 3D visualization of data through free tools; data files are similar in size and easier to download
Shapefile/Geotiff • GIS applications • May or may not work with open source
Data Formats
National Aeronautics and Space Administration 6 Applied Remote Sensing Training Program
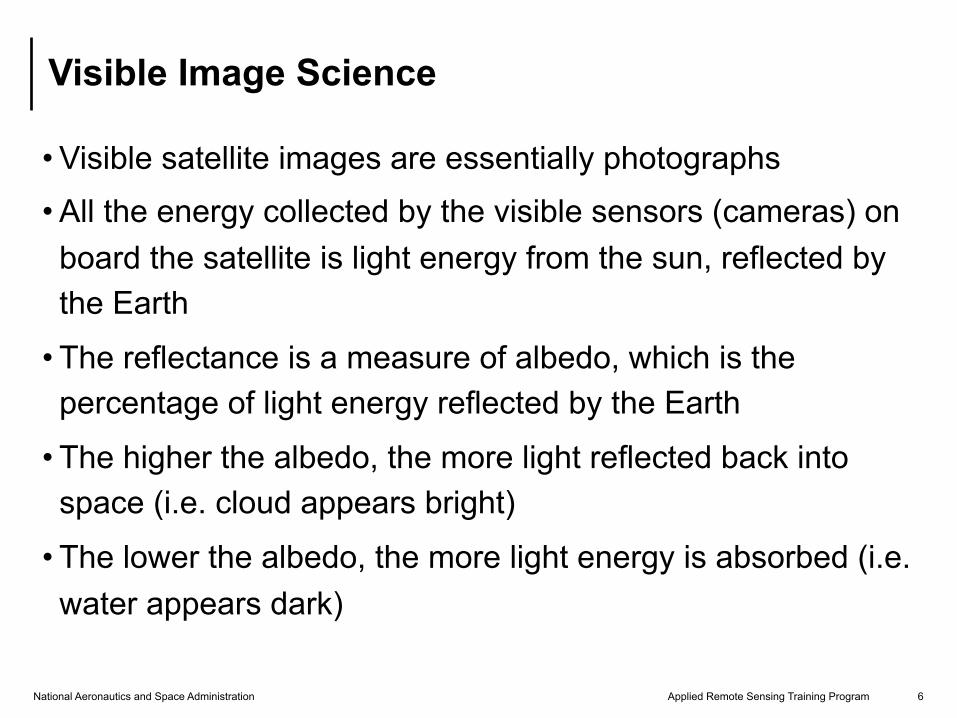
• Visible satellite images are essentially photographs
• All the energy collected by the visible sensors (cameras) on board the satellite is light energy from the sun, reflected by the Earth
• The reflectance is a measure of albedo, which is the percentage of light energy reflected by the Earth
• The higher the albedo, the more light reflected back into space (i.e. cloud appears bright)
• The lower the albedo, the more light energy is absorbed (i.e. water appears dark)
Visible Image Science
National Aeronautics and Space Administration 7 Applied Remote Sensing Training Program
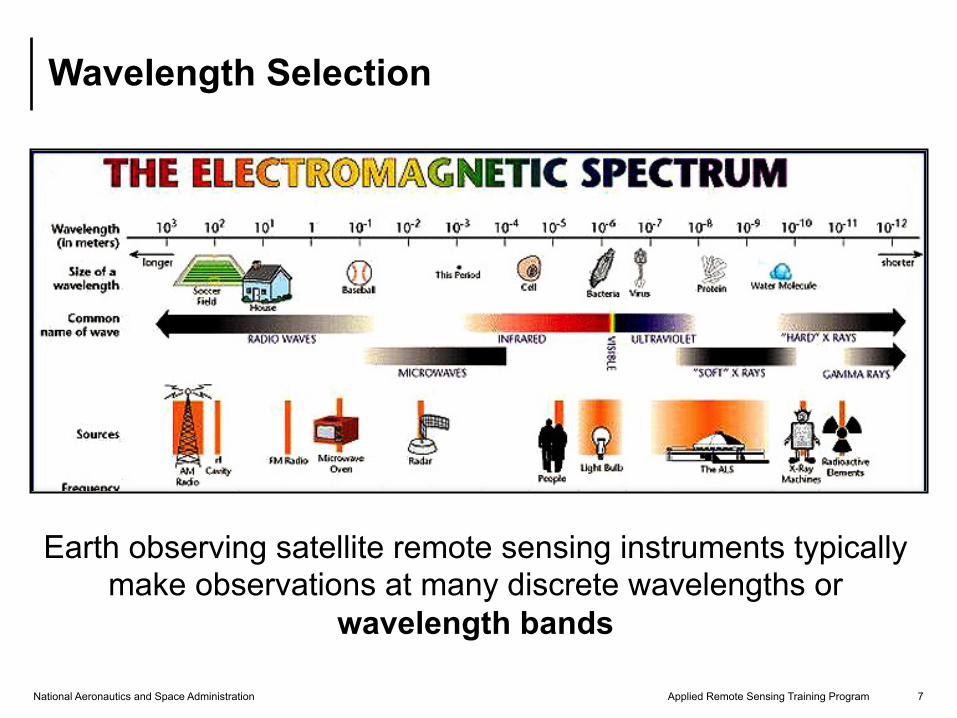
Earth observing satellite remote sensing instruments typically make observations at many discrete wavelengths or
wavelength bands
Wavelength Selection

National Aeronautics and Space Administration 8 Applied Remote Sensing Training Program
• Create an image using any 3 bands
• Load red, green, and blue satellite bands into corresponding display channels
• Simulates what the human eye sees
RGB Imagery
National Aeronautics and Space Administration 9 Applied Remote Sensing Training Program
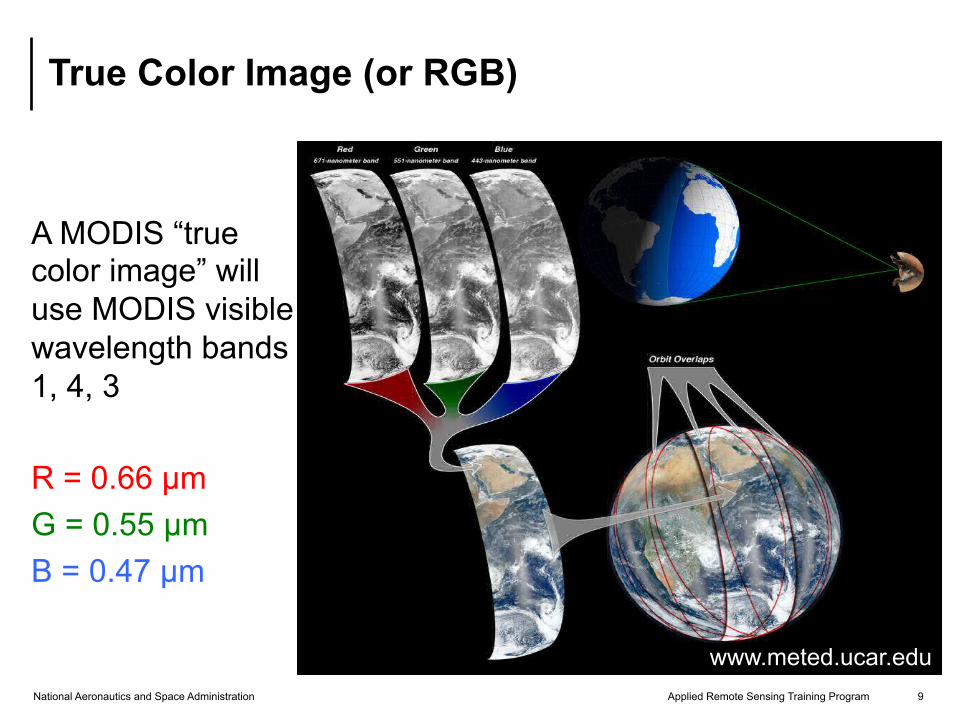
A MODIS “true color image” will use MODIS visible wavelength bands 1, 4, 3 R = 0.66 µm G = 0.55 µm B = 0.47 µm
True Color Image (or RGB)
www.meted.ucar.edu

National Aeronautics and Space Administration 10 Applied Remote Sensing Training Program
Moderate Resolution Imaging Spectroradiometer
• Spatial Resolution – 250m, 500m, 1km
• Platform – Terra & Aqua
• Temporal Resolution – 2000-present – Daily, 8-day, 16-day, monthly, quarterly, yearly
• Data Format – Hierarchal Data Format – Earth Observing System Format (HDF-EOS)
• Spectral Coverage – 36 bands (major bands include red, blue, IR, NIR, MIR)
• Bands 1-2: 250m • Bands 3-7: 500m • Bands 8-36: 1,000m
MODIS

National Aeronautics and Space Administration 11 Applied Remote Sensing Training Program
MODIS Reflected Solar Bands
250m
500m

National Aeronautics and Space Administration 12 Applied Remote Sensing Training Program
VIIRS Image
National Aeronautics and Space Administration 13 Applied Remote Sensing Training Program
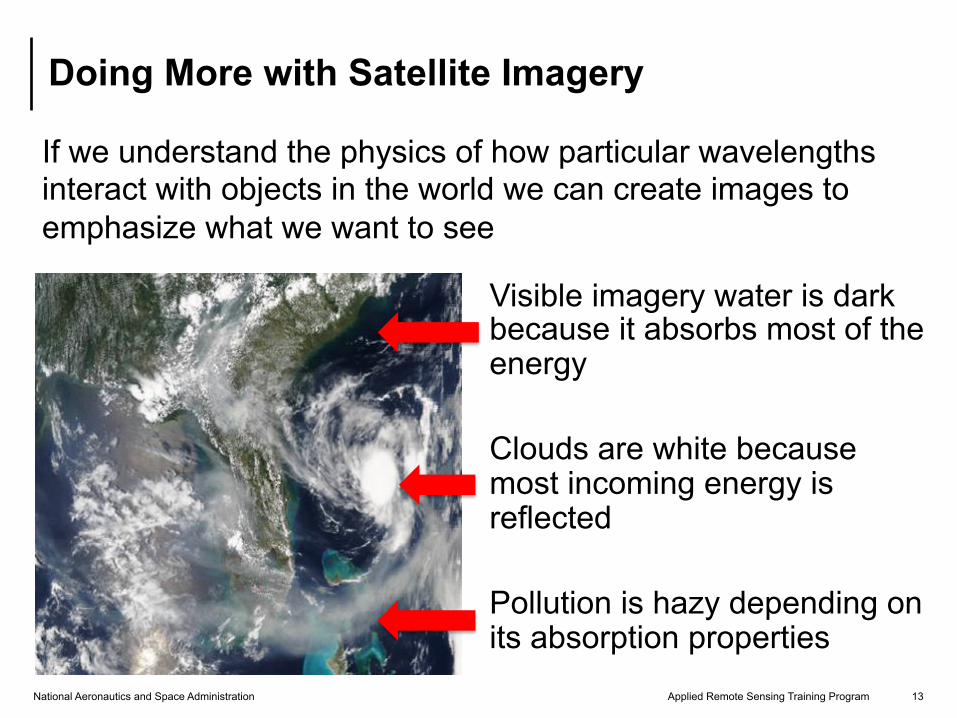
If we understand the physics of how particular wavelengths interact with objects in the world we can create images to emphasize what we want to see
Doing More with Satellite Imagery
Visible imagery water is dark because it absorbs most of the energy Clouds are white because most incoming energy is reflected Pollution is hazy depending on its absorption properties

National Aeronautics and Space Administration 14 Applied Remote Sensing Training Program
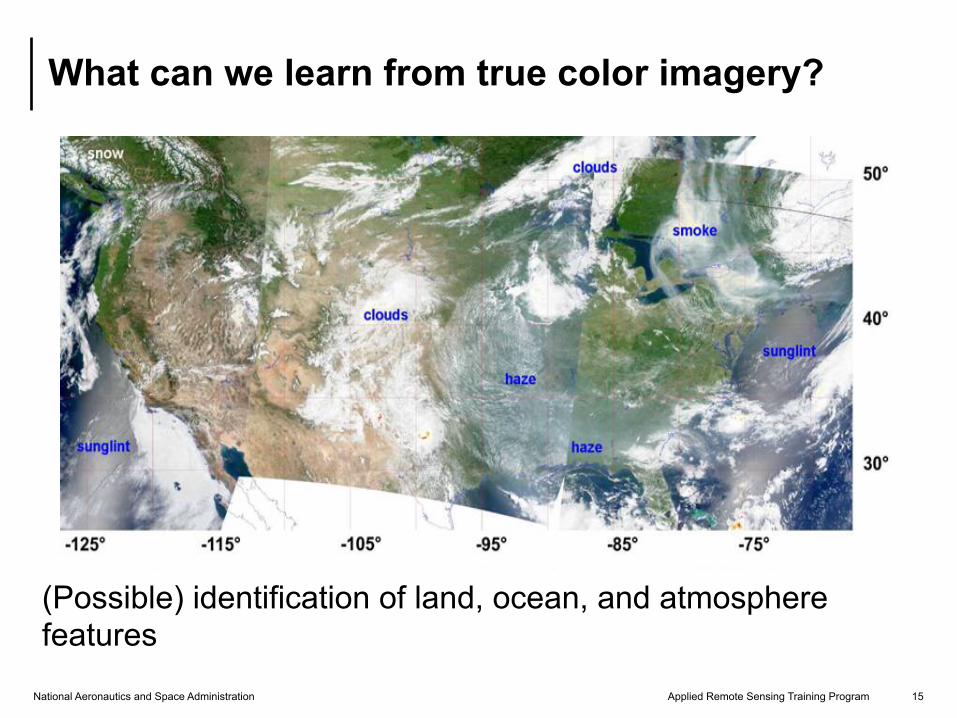
(Possible) identification of land, ocean, and atmosphere features
What can we learn from true color imagery?
1
2
3
4
5
6
8
7
National Aeronautics and Space Administration 15 Applied Remote Sensing Training Program
What can we learn from true color imagery?
(Possible) identification of land, ocean, and atmosphere features

National Aeronautics and Space Administration 16 Applied Remote Sensing Training Program
Features in True Color (Atmosphere)

National Aeronautics and Space Administration 17 Applied Remote Sensing Training Program
Glint
National Aeronautics and Space Administration 18 Applied Remote Sensing Training Program
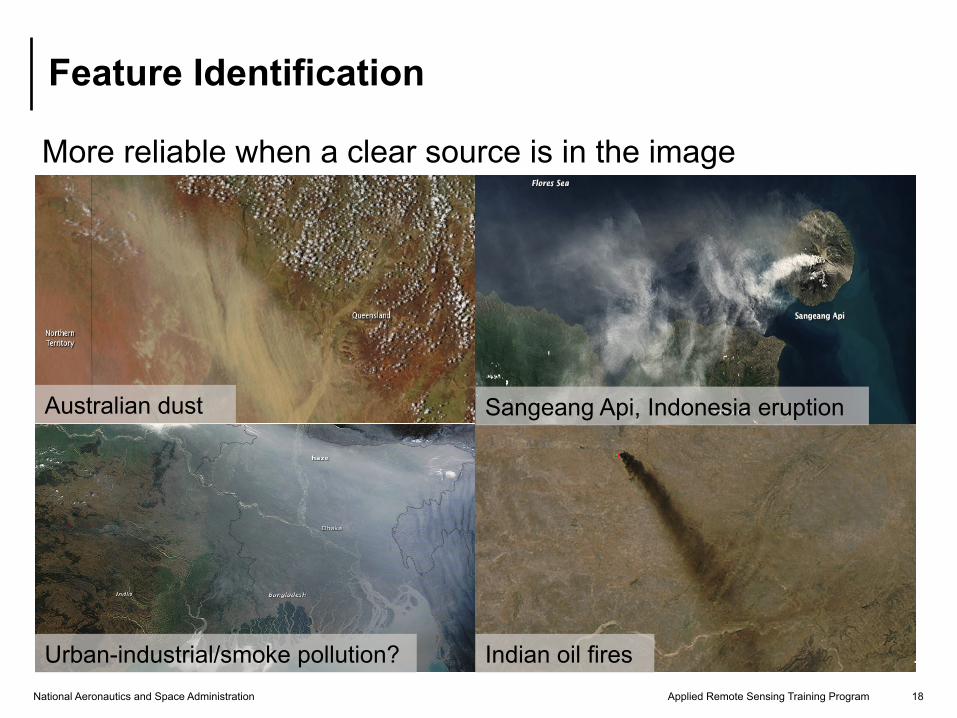
More reliable when a clear source is in the image
Feature Identification
Australian dust
Urban-industrial/smoke pollution?
Sangeang Api, Indonesia eruption
Indian oil fires

National Aeronautics and Space Administration 19 Applied Remote Sensing Training Program
More reliable when a clear source is in the image
Feature Identification
Sahara dust
Urban-industrial/smoke pollution?
Wildfire smoke
Smoke from Alaskan wildfires (2004)
National Aeronautics and Space Administration 20 Applied Remote Sensing Training Program
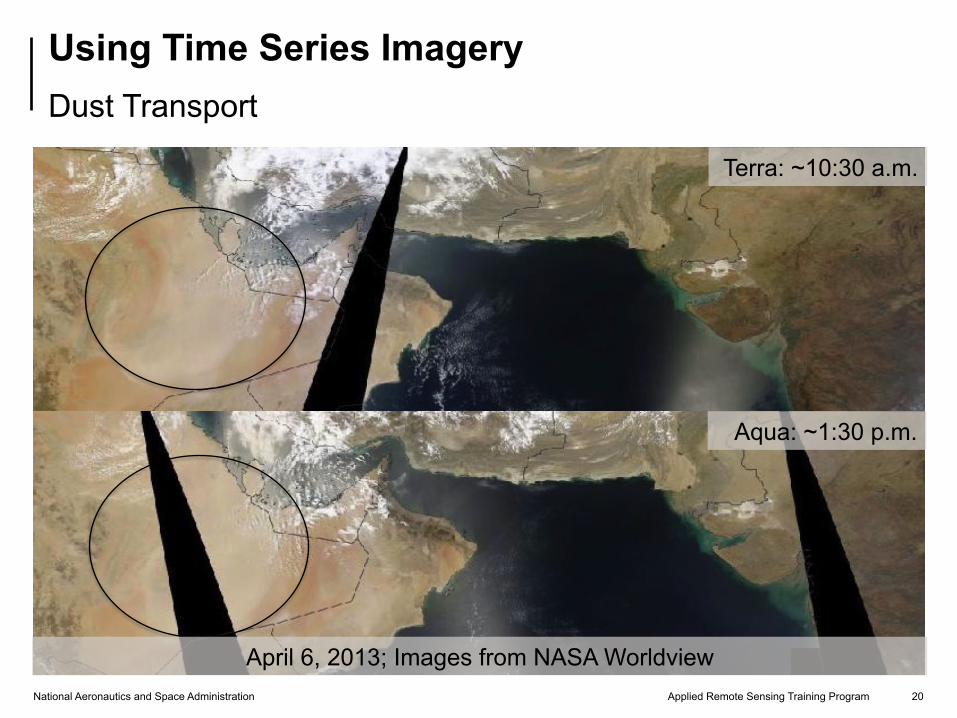
Using Time Series Imagery Dust Transport
Terra: ~10:30 a.m.
Aqua: ~1:30 p.m.
April 6, 2013; Images from NASA Worldview

National Aeronautics and Space Administration 21 Applied Remote Sensing Training Program
Terra: ~10:30 a.m.
Aqua: ~1:30 p.m.
April 7, 2013; Images from NASA Worldview

National Aeronautics and Space Administration 22 Applied Remote Sensing Training Program
Terra: ~10:30 a.m.
Aqua: ~1:30 p.m.
April 8, 2013; Images from NASA Worldview

National Aeronautics and Space Administration 23 Applied Remote Sensing Training Program
• Load bands into the red, green, and blue display channels
• Do not correspond to the visible red, green, and blue wavelengths
R = 1.6 µm G = 1.2 µm B = 2.1 µm
False Color Images

National Aeronautics and Space Administration 24 Applied Remote Sensing Training Program
True vs. False Color Images
R = 0.66 µm G = 0.55 µm B = 0.47 µm
R = 1.6 µm G = 1.2 µm B = 2.1 µm

National Aeronautics and Space Administration 25 Applied Remote Sensing Training Program
Change in Vegetation Color from Space
National Aeronautics and Space Administration 26 Applied Remote Sensing Training Program
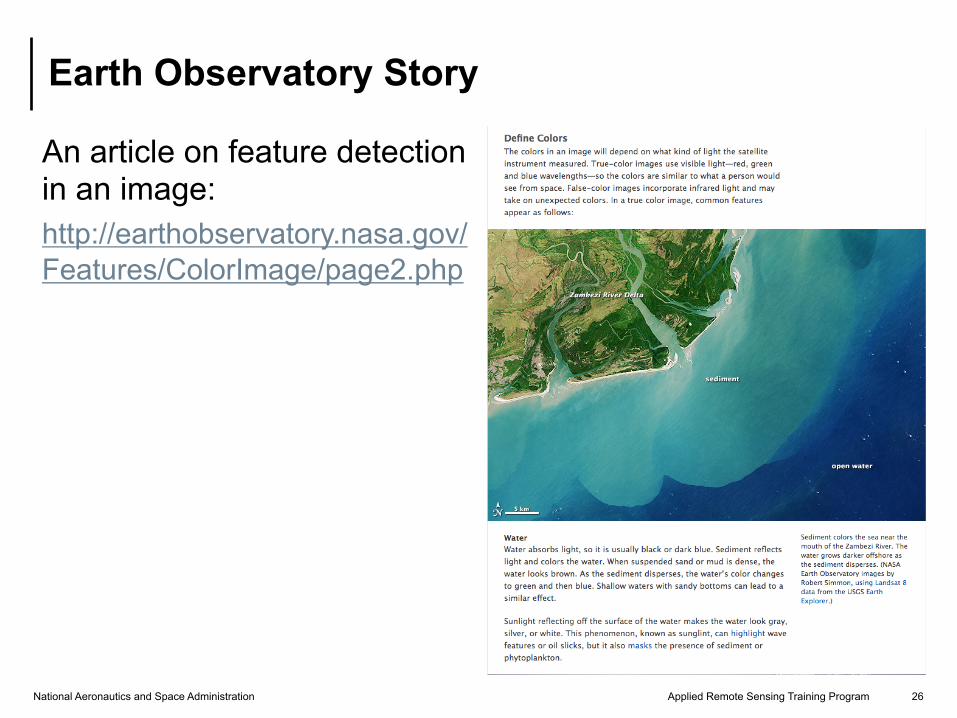
An article on feature detection in an image: http://earthobservatory.nasa.gov/Features/ColorImage/page2.php
Earth Observatory Story

National Aeronautics and Space Administration 27 Applied Remote Sensing Training Program
• ARSET Satellite Imagery Overview and links – http://airquality.gsfc.nasa.gov/index.php?section=64
• MODIS Rapid Response Site – http://earthdata.nasa.gov/data/near-real-time-data/rapid-response
• NASA’s Visible Earth – http://visibleearth.nasa.gov
• NASA’s Earth Observatory – http://earthobservatory.nasa.gov
• NASA’s Earth Observations (NEO) – http://neo.sci.gsfc.nasa.gov
• MODIS-Atmos (MODIS Atmosphere Product Reference Site) – http://modis-atmos.gsfc.nasa.gov/IMAGES/index.html
• GLIDER Tool – http://www.ssec.wisc.edu/hydra
Image Archive and Gallery Links

National Aeronautics and Space Administration 28 Applied Remote Sensing Training Program
• Earth Observatory: Events & More – http://earthobservatory.nasa.gov
• Worldview: Near Real-Time – http://earthdata.nasa.gov/labs/worldview
Tour of Some Useful Image Archives

National Aeronautics and Space Administration 29 Applied Remote Sensing Training Program
• What is difference between true color and false color image ?
• List three applications of true color images for air quality monitoring
• Does access of near real time true color image provide any useful information to air quality forecasters ?
Questions and Discussion
Questions
Recommended