SaleS and MarketingManagerS
g e r t H . n . L au r s e n
BuSineSS analyticS for How to Compete in
tHe information age

v
Contents
Preface vii
Acknowledgments xiii
Chapter 1: Introduction .....................................................................1
Chapter 2: Identify What You Want to Achieve: The Menu on a Strategic Level ......................................................19
Chapter 3: Lead Information for Identifying Valuable Customers: The Recipe .................................................41
Chapter 4: Lead Information: What You Need to Know before Launching New Acquisition Activities .............67
Chapter 5: Lead Information: What You Need to Know before Launching New Sales Activities .....................107
Chapter 6: Lead Information for Customer Retention ................143
Chapter 7: Working with Lag Information ...................................179
Chapter 8: Working with Learning Information: The Recipe ......199
Chapter 9: Case Study of a Retention Strategy ..........................215
About the Author 235
Index 236
Laursen, Gert. Business Analytics for Sales and Marketing Managers. Copyright © 2010, SAS Institute Inc., Cary, NC, USA. ALL RIGHTS RESERVED.
Laursen, Gert. Business Analytics for Sales and Marketing Managers. Copyright © 2010, SAS Institute Inc., Cary, NC, USA. ALL RIGHTS RESERVED. For additional SAS resources, visit support.sas.com/bookstore.

1
C H A P T E R 1
Introduction
This fi rst chapter provides guidance about the opportunities of
customer analytics, given the strategic objectives and the matu-
rity of the information systems in your organization. It also
introduces the basic terms used in the rest of this book, including the
term “ customer analytics, ” and how it deviates from terms such as
“ business intelligence ” (BI) and “ customer intelligence. ” Like business
intelligence and business analytics (BA), however, customer analytics
is part of the same discipline called information management, a term
that also is investigated further.
This chapter also discusses different types of information, which
are grouped from a process perspective. There is also a section intro-
ducing process management. Finally, the chapter discusses what seg-
mentation is, including the strengths and weaknesses of segmentation
based on input from data warehouse (DW), questionnaire, and subject
matter experts.
DEFINITION OF CENTRAL CONCEPTS USED IN THIS BOOK
In my previous book, Business Analytics for Managers: Taking Business
Intelligence beyond Reporting , 1 I defi ned “ business analytics ” as:
Laursen, Gert. Business Analytics for Sales and Marketing Managers. Copyright © 2010, SAS Institute Inc., Cary, NC, USA. ALL RIGHTS RESERVED.
Laursen, Gert. Business Analytics for Sales and Marketing Managers. Copyright © 2010, SAS Institute Inc., Cary, NC, USA. ALL RIGHTS RESERVED. For additional SAS resources, visit support.sas.com/bookstore.

2 ▸ I N T R O D U C T I O N
Delivering the right decision support to the right people at the right time.
This defi nition points out some key points to those working with
BI (decision support based on simple reports) or BA (decision support
based on complex analytical skills) for the fi rst time:
� The purpose of all the data, technical expressions, servers,
architectural strategies, master data management, and so on is
to create decision support — that is all. The value from a DW is
enabled via increased organization - wide ability to make better
decisions.
� The creation of decision support based on electronically stored
data involves various technical departments, analysts, and end
users spread around the organization. Some clear processes
must be in place for the organization to reap the full benefi ts
of its BI investment.
Business intelligence has the potential to provide decision support
to all of the functions in an organization. Using BI, the human
resources department can learn which individuals in an organization
are high performers and then hire, train, and reward other employees
to become similar high performers. BI enables inventory managers to
minimize the amount of capital in stored goods while being able to
deliver what is needed. Production can minimize its costs by setting
up activity - based costing programs, and so on.
The purpose for all the functions mentioned is: to optimize per-
formance within the area for which they are responsible. The same is
the case with customer analytics; it is decision support with the overall
purpose of optimizing the lifetime of your customer base. Hence we
defi ne customer analytics as:
Delivering customer - centric decision support to the right people at the right time.
Typically, three types of decision makers in an organization are
involved in customer analytics, developing a company strategy, a
marketing strategy, and an operational - level strategy:
1. Strategic decision makers . These are the individuals who
make the overall company strategy. To do so, they need
Laursen, Gert. Business Analytics for Sales and Marketing Managers. Copyright © 2010, SAS Institute Inc., Cary, NC, USA. ALL RIGHTS RESERVED.
Laursen, Gert. Business Analytics for Sales and Marketing Managers. Copyright © 2010, SAS Institute Inc., Cary, NC, USA. ALL RIGHTS RESERVED. For additional SAS resources, visit support.sas.com/bookstore.

D E F I N I T I O N O F C E N T R A L C O N C E P T S U S E D I N T H I S B O O K ◂ 3
customer - centric information to make the best possible plan for
how to run the company in the future. They also need informa-
tion about whether the overall strategy is being executed suc-
cessfully or whether corrective action needs to be taken.
2. Sales and marketing decision makers . These are the indi-
viduals who make the sales and the customer relationship man-
agement (CRM) strategy. The sales strategy deals with getting
new customers, and the CRM strategy deals with handling the
existing customer base. Just like the strategic decision makers,
they need information to create business activities and to
monitor their execution. The difference is the level of details:
The sales and marketing department wants the information on
a short - term, campaign/market activity level; the strategy team
typically requires information on an overall level, to spot trends
and long - term business opportunities.
3. Operation decision makers . These are the people who
implement the campaigns and market activities, typically in
sales and call centers. The decision support they require is
in terms of whom to call, when and what to offer, or what to
say in order to retain dissatisfi ed customers. These decision
makers are the users of operational information, which could
include call lists and pop - ups when customers call in, along
with performance management reports.
There is, however, one very important distinction between the
BA/BI and customer analytics/customer intelligence that has to do
with the process value chain. The BI/BA process is fed, more or less
exclusively, by DW data. My earlier book on BA showed the various
kinds of decision support that is enabled via a DW and how this process
should be managed. This book has less to do with where the data are
coming from and more to do with how you can make the right
customer - centric decisions. Therefore, the focus is not on whether the
data are sourced from a DW, questionnaire data, or the insights gained
from subject matter experts, as long as the decision support is customer -
centric and some analytics are used in the process. The various data
and knowledge sources should not be seen as competing sources but
rather as supplementary elements that generate signifi cant synergies.
Laursen, Gert. Business Analytics for Sales and Marketing Managers. Copyright © 2010, SAS Institute Inc., Cary, NC, USA. ALL RIGHTS RESERVED.
Laursen, Gert. Business Analytics for Sales and Marketing Managers. Copyright © 2010, SAS Institute Inc., Cary, NC, USA. ALL RIGHTS RESERVED. For additional SAS resources, visit support.sas.com/bookstore.

4 ▸ I N T R O D U C T I O N
As you learn in this book, the synergies vary, depending on the matu-
rity of your processes, the degree of existing customer understanding
in your organization, and the quality of the various data sources.
MORE THAN JUST TECHNICAL SOLUTIONS
As mentioned earlier, if you only see customer analytics and BI as tech-
nical solutions, you will fail, since they are about helping people make
better decisions. Once I was part of an implementation of a customer
scorecard (a tool that lists what the company had delivered to custom-
ers, including whether it was meeting service - level agreements). We
learned that even though it is obvious that the sales staff should use
such a tool in order to conduct fact - based negotiations with their coun-
terparts, only one - third of them used it. Some did not know about this
new tool; others preferred to do it the old way, even though the new
method provided a wide - range of process improvements to customers.
Of the one - third who used the scorecard, we estimated that they got
only one - third of the potential value out of it because they did not apply
that information in an optimal way. In other words, if you see customer
analytics or any other information system as only a technical discipline,
you will realize only a fraction of its potential value — just the tip of the
iceberg.
The obvious shortcoming was that the makers of the scorecard
had implemented only a technical solution, since they did not consider
business processes and the users. The change management element
was missing.
We mentioned earlier that there are three types of decision makers.
Since the one - third of the one - third rule does not apply to them all,
we will go through them one by one.
� Strategic decision makers . As mentioned earlier, they basi-
cally do two things: They make strategies and follow up on
them. When you make strategy, you focus on two things: lever-
ing short - term issues and seeking to gain long - term competitive
advantages. Research has shown that most organizations do not
understand the full potential of information, including cus-
tomer analytics, during the strategy - making process. One reason
Laursen, Gert. Business Analytics for Sales and Marketing Managers. Copyright © 2010, SAS Institute Inc., Cary, NC, USA. ALL RIGHTS RESERVED.
Laursen, Gert. Business Analytics for Sales and Marketing Managers. Copyright © 2010, SAS Institute Inc., Cary, NC, USA. ALL RIGHTS RESERVED. For additional SAS resources, visit support.sas.com/bookstore.

M O R E T H A N J U S T T E C H N I C A L S O L U T I O N S ◂ 5
for this could be that most chief information offi cers do not
have an analytical and strategic background.
� Sales and marketing decision makers . If the person respon-
sible for making the sales and CRM strategy is not aware of the
potential of customer analytics, how can they be expected to
opt for it? This is also why we have made this book a menu
that shows the relationship between some universal key per-
formance indicators and individual methodologies. At the same
time, the analyst has to be able to deliver. That is what we call
the recipe, which contains input about what information and
knowledge should be delivered before a new business activity
is started and how to monitor it.
� Operation decision makers . As mentioned, you cannot just
make some pop - up window in a call center and expect to realize
the full effect of whatever intentions were behind it. If you
want the full effect of an information system, you must go
through three steps during the implementation phase:
1. Make process maps that clearly defi ne how you wish people to work . For example, when a customer calls in,
what do you want staff to say in order to clarify the customer
requirements? If you do not already have a clear idea about
how to identify what the customer wants, then go out and
fi nd some best practices. The use of best practices also means
that you already have identifi ed a process improvement at
this early step.
2. Design a technical system that supports this best prac-tice . For example, when people call in, a pop - up with rel-
evant customer details is shown, so that the agent does not
have to ask the customer about what you as a company
already know. If the customer issue is resolved positively, a
pop - up informing the call center agent about potential cross -
selling opportunities could occur. A bonus system rewarding
call center agents for their selling efforts (and ability to solve
issues) also could be established.
3. Train the call center agents to follow the new pro-cedures that you wish to implement, including the
Laursen, Gert. Business Analytics for Sales and Marketing Managers. Copyright © 2010, SAS Institute Inc., Cary, NC, USA. ALL RIGHTS RESERVED.
Laursen, Gert. Business Analytics for Sales and Marketing Managers. Copyright © 2010, SAS Institute Inc., Cary, NC, USA. ALL RIGHTS RESERVED. For additional SAS resources, visit support.sas.com/bookstore.

6 ▸ I N T R O D U C T I O N
technical solution and the bonus system . The process
and training elements are also known as change manage-
ment elements; they are ways to lead people into following
new ways of working and keeping them doing so after you
have left the building.
WHAT IS AN INFORMATION STRATEGY?
In this section we take a closer look at what an information strategy
is in order to make the link between the company strategy and what
decision support has to be produced. We also introduce different kinds
of information, based on which kind of decision support this informa-
tion is made to support. Finally, this section also gives insights on why
so many customer analytics projects that are driven by the DW fail.
Since customer analytics often sources its data from one or more DWs,
this section is explicitly from a BI perspective. As you will learn, BI
based on DW data is a very complex process, and there are important
lessons to be learned.
First of all, we take a closer look at what an information strategy
is. In the simplest form, an information strategy can be described as a
list of all the knowledge and information that is required in order for
a business strategy to be successful, including a plan of how to create
this decision support or operational data. Adding a little complexity
to this defi nition, an information strategy consists of three domains
that have to be managed and aligned in order to use DW information
successfully:
1. Business requirements . Without clear business requirements
on the overall objectives of your company strategy or marketing
plan, over time your business activities will end up as a patch-
work based on what you used to do with no clear strategic
direction. After all, there is no point in making a plan that has
no purpose, so the fi rst requirement is clear objectives.
2. Analytical competencies . Without knowing which analyti-
cal competencies are available and needed at certain times, you
will end up continuously reusing the same analytical skills
you have always used, which is the same as degenerating your
Laursen, Gert. Business Analytics for Sales and Marketing Managers. Copyright © 2010, SAS Institute Inc., Cary, NC, USA. ALL RIGHTS RESERVED.
Laursen, Gert. Business Analytics for Sales and Marketing Managers. Copyright © 2010, SAS Institute Inc., Cary, NC, USA. ALL RIGHTS RESERVED. For additional SAS resources, visit support.sas.com/bookstore.

W H A T I S A N I N F O R M A T I O N S T R A T E G Y ? ◂ 7
decision support. As they say, if you have a hammer in the
hand, everything looks like a nail. Therefore, you need a full
analytical tool box and the knowledge of how to use it. This is
business critical in the information age where “ survival of the
smartest ” is the winning and constantly changing formula.
3. Data foundation . Customer analytics, like all other types of
BI, is based on making the most out of data stored in different
data repositories. If for various reasons you cannot get access
to data or understand, trust, and manipulate the data you are
receiving, your analytical efforts all stop here. In other words,
you should work together with the DW team and the technical
side of the organization, but in case of confl icts, you have to
make it clear to them that the technical side of the organization
is there to support the commercial. It can never be the other
way around.
If this is all there is to it, then why do 50% to 70% of all customer
analytics projects fail or end up being challenged because they do
not deliver the expected returns? Why is it that if you start a new
customer analytics activity with an average customer analytics team,
you should expect to fail? Many reasons for this primarily have to
do with the fact that these are cross - functional activities that require
top specialist skills from everyone in the process. Therefore, even if
only one individual, step, or function in the process fails, the whole
process will fail. In my previous book, Business Analytics for Managers
( www.basm - support.com ), I explained this process in great detail. In
this section, I just present the overall model, the information wheel
(see Exhibit 1.1 ).
The information wheel shows that information management starts
with a business strategy: Strategy is king. Based on the overall business
strategy, each of the functions (human resources, sales, fi nance, etc.)
will make its own functional strategies in alignment with each other
to deliver the functional specifi c objectives (e.g., to reduce employee
turnover to 5% per year, increase sales by 20%, or minimize outstand-
ing to 14 days in average). Because this book is about customer
analytics, we focus only on the sales and marketing strategies. In
general, their objectives can be described as optimizing customer
Laursen, Gert. Business Analytics for Sales and Marketing Managers. Copyright © 2010, SAS Institute Inc., Cary, NC, USA. ALL RIGHTS RESERVED.
Laursen, Gert. Business Analytics for Sales and Marketing Managers. Copyright © 2010, SAS Institute Inc., Cary, NC, USA. ALL RIGHTS RESERVED. For additional SAS resources, visit support.sas.com/bookstore.

8 ▸ I N T R O D U C T I O N
acquisitions processes, cross - selling and up - selling processes, and
retention processes. In other words, their aim is to get, to increase,
and to keep customers.
Sales and marketing processes are very often referred to as CRM
processes because, overall, this is what they are about: managing how
we treat our customers. In many organizations, the sales process is
separated out into a sales department for various reasons. From a
process perspective, however, the sales and the CRM department are
closely linked. This is because if the sales department acquires disloyal
and low - spending customers, the CRM department will be set up for
failure, with its members spending their time trying to cultivate cus-
tomers with a low preference for the company, brand, service, or
product, or low spending.
For both the sales and the CRM strategy or all major activities,
strategy creators identify the critical success factors (usually about four
to six factors). All of these factors must go correctly in order for the
strategy to be successful as a whole. For example, imagine a marketing
department strategic objective that states that the customer base
should be increased by 5% at the end of the year. The marketing
department now has the option of acquiring more customers or
Exhibit 1.1 Information Wheel from an Organizational Perspective
Functionalstrategies
Identificationof critical
success factors
Derivedinformation need
Deriveddata need
Datasourcing
Informationcreation
Creation of business knowledge
Creation of functionalexperience/wisdom
Company objectives based on overall business strategy
Info
rmatio
n an
d kn
ow
ledg
e characteristics
Businessskills
Analyticalskills
ITskills
BIC
C
Dem
and S
upplyLearning
Lead
Lag
Laursen, Gert. Business Analytics for Sales and Marketing Managers. Copyright © 2010, SAS Institute Inc., Cary, NC, USA. ALL RIGHTS RESERVED.
Laursen, Gert. Business Analytics for Sales and Marketing Managers. Copyright © 2010, SAS Institute Inc., Cary, NC, USA. ALL RIGHTS RESERVED. For additional SAS resources, visit support.sas.com/bookstore.

W H A T I S A N I N F O R M A T I O N S T R A T E G Y ? ◂ 9
retaining more customers. Either way or a combination of the two
ways will meet the objective.
If the CRM department chooses to embark on a pure retention
strategy, to be successful, it is critical that it launches the right activi-
ties, toward the right customers, with the right retention offers, at the
right time. Also, the CRM department will require some performance
statistics to evaluate the campaigns continuously and to what degree
they are meeting their overall strategic objectives.
We have now defi ned the critical success factors, which in turn
defi ne the derived information need, which can be formulated to
analysts in this way: Tell us which customers will leave us, when, and
why. Then the business must fi gure out what to do about it (i.e.,
develop the retention offers). The business also would like to get data
that indicates how well the activities perform on a running basis.
Based on the derived information need, business analysts will start
searching for data that can provide input to their data - mining models
and statistical efforts. Perhaps the data already exist; alternatively, they
will have to be sourced in the future or perhaps the company will
have to continue without it.
When this is done, the analysts create the data. This needed infor-
mation can be:
� Lead information . Information used for innovating new pro-
cesses (before your new campaigns).
� Lag information . Performance data used for monitoring the
performance of the existing processes (used during the cam-
paign execution phase).
� Learning information . Feedback to the strategy function and
other parallel sales departments allowing them to see new
opportunities and threats based on the overall learning from
the historical marketing activities (created after a campaign).
As can be seen, creation of the needed information and knowledge
is a complex process where there is no room for mistakes. Most busi-
ness analysts are specialists (although sometimes they may lack skills
or simply be generalists in disguise), and typically no process owner
is in place. In some organizations, BI competence centers formalize
Laursen, Gert. Business Analytics for Sales and Marketing Managers. Copyright © 2010, SAS Institute Inc., Cary, NC, USA. ALL RIGHTS RESERVED.
Laursen, Gert. Business Analytics for Sales and Marketing Managers. Copyright © 2010, SAS Institute Inc., Cary, NC, USA. ALL RIGHTS RESERVED. For additional SAS resources, visit support.sas.com/bookstore.

10 ▸ I N T R O D U C T I O N
some of the contacts; however, most organizations rely on the general-
ist skills of project managers to make all ends meet.
In addition, the change management program of training the call
centers must be undertaken. Agents must be trained in outbound calls
or receiving campaign replies, and internal procedures must be in
place. Potentially, technical solutions may have to be in place before
kickoff, and external partners may have to perform in alignment.
Due to their complexity, it is no wonder that customer analytics
activities typically fail. In fact, one might wonder why things occasion-
ally go well. It is important to understand that customer analytics
activities that are partly or fully based on DW data are a complex
endeavor since they require specialist skills and you will rely on many
other functions in the organization. For these reasons your analysts
should have business, analytical, and data skills, plus people and
project skills. A limited number of these people are available, and they
are hard to keep, but if you do: They are worth their salaries.
REVOLUTIONARY VERSUS EVOLUTIONARY PROCESS CHANGES
This section adds a process perspective on how to make customer
analytics, in order to explain the different kinds of information, such
as lead, lag, and learning information. In this context, we defi ne a
process as a series of coordinated actions with a common goal in mind.
The goal could be to sell a pair of shoes to a customer, and the process
could be to pull a list of customers who have not purchased any shoes
from our Web site lately, identify which kinds of shoes that each would
be most likely to buy, and then send the offer to the customer by email.
If you are the process owner, there are two ways you can improve
this process: through evolutionary or revolutionary changes. The cor-
responding information types and the way that you typically work
with them can be divided into two categories: lead and lag informa-
tion. The two ways of optimizing a process are:
1. Evolutionary business process changes have to do with optimizing already existing processes within their exist-ing framework . Typically these changes are triggered by the
Laursen, Gert. Business Analytics for Sales and Marketing Managers. Copyright © 2010, SAS Institute Inc., Cary, NC, USA. ALL RIGHTS RESERVED.
Laursen, Gert. Business Analytics for Sales and Marketing Managers. Copyright © 2010, SAS Institute Inc., Cary, NC, USA. ALL RIGHTS RESERVED. For additional SAS resources, visit support.sas.com/bookstore.

R E V O L U T I O N A R Y V E R S U S E V O L U T I O N A R Y P R O C E S S C H A N G E S ◂ 11
people who operate them based on such information as control
charts and reports, which document the historical performance
of the process in play, or simply by clever and engaged
employees.
2. Revolutionary business changes have to do with recon-fi guring a process by abandoning existing ones or devel-oping new ones where needed . Typically these changes are
triggered by the functional strategy team because the existing
processes are no longer up to market standards or because the
organizational strategy has changed, which of course is refl ected
in how things are done: the processes. The information required
for revolutionary business changes typically is derived via the
use of analytical procedures and techniques.
In other words, a process performs in an acceptable way according
to market standards and business ambition. Hence we will monitor it
via reports and the like. Alternatively, we fi nd that the process (e.g.,
the way we sell or what we sell) does not live up to market standards,
and we need to generate knowledge about what customers want and
need. This information can come from many places, such as subject
matter experts, questionnaires, or DW data. This process perspective
is outlined in Exhibit 1.2 , where the fl at line depicts ever - increasing
market standards that continuously require the organization to
Exhibit 1.2 Stairway Model Illustrating One Process
RE
VO
LU
TIO
N
Perform
ance of sales processes
Time
Market standardsOut
put
Loss
Loss
Loss
EVOLUTION
Laursen, Gert. Business Analytics for Sales and Marketing Managers. Copyright © 2010, SAS Institute Inc., Cary, NC, USA. ALL RIGHTS RESERVED.
Laursen, Gert. Business Analytics for Sales and Marketing Managers. Copyright © 2010, SAS Institute Inc., Cary, NC, USA. ALL RIGHTS RESERVED. For additional SAS resources, visit support.sas.com/bookstore.

12 ▸ I N T R O D U C T I O N
produce at lower costs and create offers that give higher user
satisfaction.
The lower zigzag line represents the nature of a typical business
process or product that has to satisfy ever - increasing market demands.
The zigzag shape is a result of the nature of processes. When processes
are implemented, they typically do live up to the market require-
ments; however, they do not improve with the speed of the market.
Typically the same product will come in new versions, which would
be evolutionary change, but at some point in time the product simply
does not live up to market standards and new product lines must
replace the old ones. The way we optimally price things changes over
time, the optimal customer service changes, the optimal way of brand-
ing changes; the same is true with our commercials, the way we get
customers, and the way we keep our customers: The requirements all
change over time. Sometimes evolutionary versions will do, but some-
times nothing less than new innovative products and services are
needed.
For example, try to imagine a society where there is no innovation
because all of the inhabitants do not like risk taking, innovation, or
new ideas, or simply are so focused on getting their daily bread that
they do not have time to think beyond what they do today. What you
would get is a society where everyone would ride in horse carts
instead of automobiles; however, no doubt, they would use the horses
in the most effi cient manner. The problem is that all you have done
is change an ineffi cient process and turn it into to an optimized inef-
fi cient process. You also often see this in high - performance organiza-
tions with mediocre management. People have to run faster and faster
in order to keep up with the competition simply because they did not
work smarter — they do not innovate. This method will work for a
while, but only for a while. This model also illustrates this via the
“ loss ” areas, which show the consequences of the specifi c process not
being up to date. The loss is generated via an ineffi cient process that
is too costly or missed market potential because the process does not
satisfy the customer needs in one way or another.
All the sales and marketing processes for a company also could
be illustrated by a line rather than steps, where the line shows
the average distance of all the marketing processes from the market
Laursen, Gert. Business Analytics for Sales and Marketing Managers. Copyright © 2010, SAS Institute Inc., Cary, NC, USA. ALL RIGHTS RESERVED.
Laursen, Gert. Business Analytics for Sales and Marketing Managers. Copyright © 2010, SAS Institute Inc., Cary, NC, USA. ALL RIGHTS RESERVED. For additional SAS resources, visit support.sas.com/bookstore.
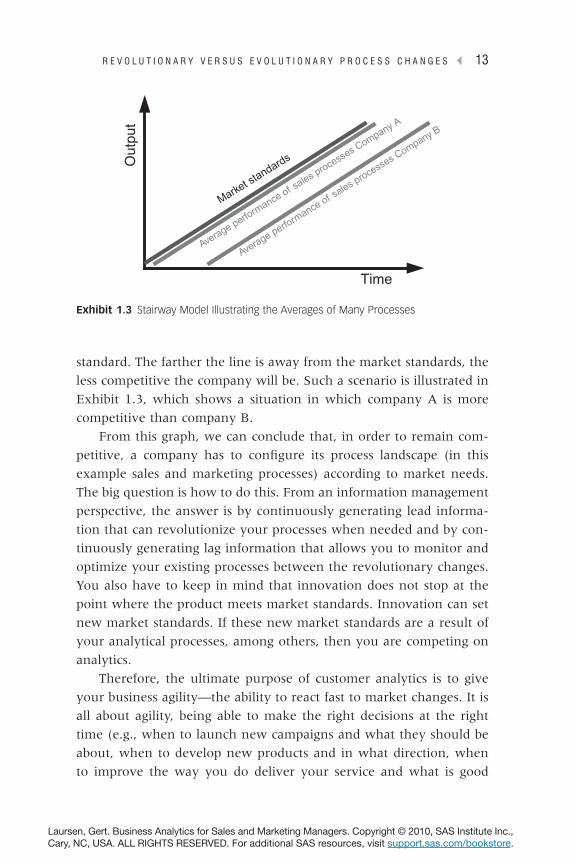
R E V O L U T I O N A R Y V E R S U S E V O L U T I O N A R Y P R O C E S S C H A N G E S ◂ 13
standard. The farther the line is away from the market standards, the
less competitive the company will be. Such a scenario is illustrated in
Exhibit 1.3 , which shows a situation in which company A is more
competitive than company B.
From this graph, we can conclude that, in order to remain com-
petitive, a company has to confi gure its process landscape (in this
example sales and marketing processes) according to market needs.
The big question is how to do this. From an information management
perspective, the answer is by continuously generating lead informa-
tion that can revolutionize your processes when needed and by con-
tinuously generating lag information that allows you to monitor and
optimize your existing processes between the revolutionary changes.
You also have to keep in mind that innovation does not stop at the
point where the product meets market standards. Innovation can set
new market standards. If these new market standards are a result of
your analytical processes, among others, then you are competing on
analytics.
Therefore, the ultimate purpose of customer analytics is to give
your business agility — the ability to react fast to market changes. It is
all about agility, being able to make the right decisions at the right
time (e.g., when to launch new campaigns and what they should be
about, when to develop new products and in what direction, when
to improve the way you do deliver your service and what is good
Exhibit 1.3 Stairway Model Illustrating the Averages of Many Processes
Average perform
ance of sales processes Company B
Time
Market standardsO
utpu
t
Average perform
ance of sales processes Company A
Laursen, Gert. Business Analytics for Sales and Marketing Managers. Copyright © 2010, SAS Institute Inc., Cary, NC, USA. ALL RIGHTS RESERVED.
Laursen, Gert. Business Analytics for Sales and Marketing Managers. Copyright © 2010, SAS Institute Inc., Cary, NC, USA. ALL RIGHTS RESERVED. For additional SAS resources, visit support.sas.com/bookstore.

14 ▸ I N T R O D U C T I O N
enough, when to react on competitive moves and what to do about
it, etc.).
SEGMENTATION AND DATA WAREHOUSING
This section discusses what segmentation is as well as how to imple-
ment a segmentation model. The way you can use a segmentation
model is closely linked to whether it is also present in a DW or another
organization - wide data repository or whether this segmentation is an
abstract idea existing only on a PowerPoint level.
The basic idea behind segmentation is that customers have differ-
ent needs, wants, values, behaviors, and so on. In an ideal world, we
would of course like to treat every customer individually and accord-
ing to his or her specifi c needs and values. Practically, however, very
often this will not work because we simply do not have information
about the individual customers ’ needs and wants, and acquiring this
information would be too costly, if the customer was willing to give
it to us in the fi rst place. In cases where we have this information on
a customer level, customers might not be willing to pay us what it
costs to deliver and produce tailor - made goods according to their
individual requirements. There are, of course, many examples of
customer - made production that is successful. However, there are also
many where it is not — just think about the whole historical shift from
carpenters to mass - produced IKEA furniture. Therefore, the optimal
number of segments is a matter of balancing between the costs of
individualization versus to what extent customers are willing to pay
for this customization.
In this book, we categorize customers in many ways: whom you
should sell more to and who is valuable to us according to different
customer needs, and so on. One central lesson here is that you should
stop thinking about segmentation as if there is only one dimension to
see customers through and start talking about needs - based segmenta-
tion, value - based segmentation, segments ready for different kinds of
up - selling, cross - selling based segmentation, communication - based
segmentation, churn - based segmentation, segmentation based on
dunning procedures, risk - based segmentation, and more. This might
sound confusing, but you also learn that customers vary in many
Laursen, Gert. Business Analytics for Sales and Marketing Managers. Copyright © 2010, SAS Institute Inc., Cary, NC, USA. ALL RIGHTS RESERVED.
Laursen, Gert. Business Analytics for Sales and Marketing Managers. Copyright © 2010, SAS Institute Inc., Cary, NC, USA. ALL RIGHTS RESERVED. For additional SAS resources, visit support.sas.com/bookstore.

S E G M E N T A T I O N B A S E D O N D A T A W A R E H O U S E I N F O R M A T I O N ◂ 15
ways, and each way can form a basis for segmentation. After all,
segmentation is just grouping customers as a result of some sort of
similarity.
SEGMENTATION BASED ON DATA WAREHOUSE INFORMATION
Throughout this book, there is an ongoing discussion about two ways
of doing needs - based segmentation depending on whether it is gener-
ated from a DW or from questionnaire data, where needs - based seg-
mentation is defi ned as a categorization of customers with similar
buying criteria, which could be based on prize or different product
features like the safety of a car, the comfort of a car, the carbon foot-
print of a car.
If your needs - based segmentation is based on DW data, to a certain
extent, the segmentation must have been created based on your own
organization ’ s customer information through the use of analytic tech-
niques. The benefi t of this sort of analysis is that it is relatively easy
to make segmentations of your full customer base (depending on your
data quality). That is, you know on a one - to - one basis which custom-
ers belong to which segment. This is in contrast to a situation where
you have fi ve segments based on an abstract segmentation model,
but you do not know which customers fall into which of the fi ve
categories.
Internet - based companies are an interesting example of stores that
naturally could focus on a one - to - one relationship with their custom-
ers since they have vast amounts of transactional data from the web
logs and eventual transactions. These web logs can inform companies
about how the customers came to their homepage, how they click
around, who purchases what and how often, what typically is pur-
chased together, and the home addresses of those who made physical
purchases. Pop - up surveys are easy to include in this media. Other
types of organizations that typically have very detailed customer infor-
mation are banks, telecom operators, and insurance companies, since
their services typically are subscription based, they know their
customers on a one - to - one basis, and the interactions can be elec-
tronically stored and used for later analysis.
Laursen, Gert. Business Analytics for Sales and Marketing Managers. Copyright © 2010, SAS Institute Inc., Cary, NC, USA. ALL RIGHTS RESERVED.
Laursen, Gert. Business Analytics for Sales and Marketing Managers. Copyright © 2010, SAS Institute Inc., Cary, NC, USA. ALL RIGHTS RESERVED. For additional SAS resources, visit support.sas.com/bookstore.

16 ▸ I N T R O D U C T I O N
SEGMENTATION BASED ON NON – DATA WAREHOUSE INFORMATION
If you have no customer base or available data about it or if the DW
data simply do not give you some actionable segments, you can be
forced to go for non – DW segmentation. You can segment your cus-
tomers based on many sources as well as combined sources. Typically,
however, your segmentation logic will be based on input from subject
matter experts or simply will be dictated by your organization or
external business partners. If your segmentation logic is based on
questionnaires, the types of segmentation can be the same as with
DW - based segmentations, such as needs - based or value - based seg-
mentation; however, often this methodology allows you to segment
only those customers in your customer base who replied to your
questionnaire, since for obvious reasons you do not know anything
about the needs of the nonrespondents. The benefi t of segmentation
based on non – DW data is that you can base it on a wider set of infor-
mation, since in questionnaires you can ask about whatever you want,
as opposed to segmentations based on the DW, where the customer
attributes that your segmentation is based on is limited to the data
currently stored by your organization.
Often larger companies with subscription - based funding need
both DW – and non – DW – based segmentation, since they wish to run
campaigns through the mass media and at the same time have CRM
activities below the media line, such as emails and direct mail. Often
there is no alignment between the media - relevant and the CRM -
relevant segmentation models. One way of aligning these two is to
make a series of customers, categorize which segment they belong
to via a questionnaire, then identify the characteristics of the same
customers based on DW data, and fi nally categorize the rest of
the customers in the DW according to these characteristics.
As mentioned earlier, there are many ways to develop a segmenta-
tion model. The best one is probably defi ned by looking at what you
want to achieve, the costs and the benefi ts of the different approaches,
the usefulness of your DW, and the long - term strategic objectives and
key stakeholders. There are, however, some elementary points that
can serve as a strong indicator of which direction you should pursue.
Laursen, Gert. Business Analytics for Sales and Marketing Managers. Copyright © 2010, SAS Institute Inc., Cary, NC, USA. ALL RIGHTS RESERVED.
Laursen, Gert. Business Analytics for Sales and Marketing Managers. Copyright © 2010, SAS Institute Inc., Cary, NC, USA. ALL RIGHTS RESERVED. For additional SAS resources, visit support.sas.com/bookstore.

O T H E R C O N S I D E R A T I O N S ◂ 17
First of all, the DW – based segmentation model is very powerful
for companies that are focused on CRM activities executed via below
the media line through email activities, personal calls, and written
mail. Such companies know their customers on a one - to - one level.
Alternatively, externally based segmentation (based on subject matter
experts or questionnaires) is a very natural tool for companies that do
not know their customers by name or are focused on acquisition
through mass media activities. Examples of such companies are tradi-
tional stores where there is no registration of who purchased what or
how many times a customer visited a store.
Regardless of how you get to your DW – based segmentation, there
needs to be an alignment between your acquisition processes and the
way you treat your existing customer base. From a customer experi-
ence perspective, there should be a sense of continuity from what you
expect to get when you become a customer to what you get when
you have become a customer. From an organizational perspective,
confusion and lack of engagement from the rest of the organization
can result if the market intelligence department promotes one version
of the truth used for acquisition activities, while the customer analyt-
ics department promotes another customer view for CRM purposes.
In such cases, the rest of the organization will not know what it should
deliver in order satisfy the customers.
OTHER CONSIDERATIONS
In general, a segmentation model, like most other tools, is only as good
as those who use it. Therefore, if you are responsible for developing a
segmentation model, the fi rst thing you should consider is who could
potentially use it. The exercise is relatively simple. First, sit down with
an organization map and identify all the different functional areas and
processes. For each of these potential users, brainstorm how customer
segmentation could add value to each individual functional area or
process. After you fi nish this homework, start setting up meetings
with existing and potential stakeholders, and agree on what they
really want. One stakeholder that should be of particular interest is the
strategic department; if it adapts your way of doing segmentation,
your organization will become increasingly customer centric in its
Laursen, Gert. Business Analytics for Sales and Marketing Managers. Copyright © 2010, SAS Institute Inc., Cary, NC, USA. ALL RIGHTS RESERVED.
Laursen, Gert. Business Analytics for Sales and Marketing Managers. Copyright © 2010, SAS Institute Inc., Cary, NC, USA. ALL RIGHTS RESERVED. For additional SAS resources, visit support.sas.com/bookstore.

18 ▸ I N T R O D U C T I O N
future method of going to market. The strength of a top - down imple-
mentation is that since a company strategy is signed off by top man-
agement, you will automatically get their buy - in. Thus, you have
taken a fi rst step into treating your customers consistently across all
channels (which is an absolute basic in marketing). If your segmenta-
tion is based on DW information, you will also be able to report
monthly on each segment in terms of how many new customers you
get, turnover, complaints, how many leave you; this is essential feed-
back to the strategy department. The saying “ You can ’ t manage what
you can ’ t measure ” therefore becomes very relevant here, since a
strategy department will only develop a strategy plan based on orga-
nization objectives that can be factually measured.
NOTE
1. Gert Laursen and Jesper Thorlund , Business Analytics for Managers:
Taking Business Intelligence beyond Reporting ( Hoboken, NJ : John Wiley
& Sons , 2010 ).
Laursen, Gert. Business Analytics for Sales and Marketing Managers. Copyright © 2010, SAS Institute Inc., Cary, NC, USA. ALL RIGHTS RESERVED.
Laursen, Gert. Business Analytics for Sales and Marketing Managers. Copyright © 2010, SAS Institute Inc., Cary, NC, USA. ALL RIGHTS RESERVED. For additional SAS resources, visit support.sas.com/bookstore.
Recommended