Metrolinx Board of Directors
June 2019
SAFETY STRATEGIC PRIORITIES
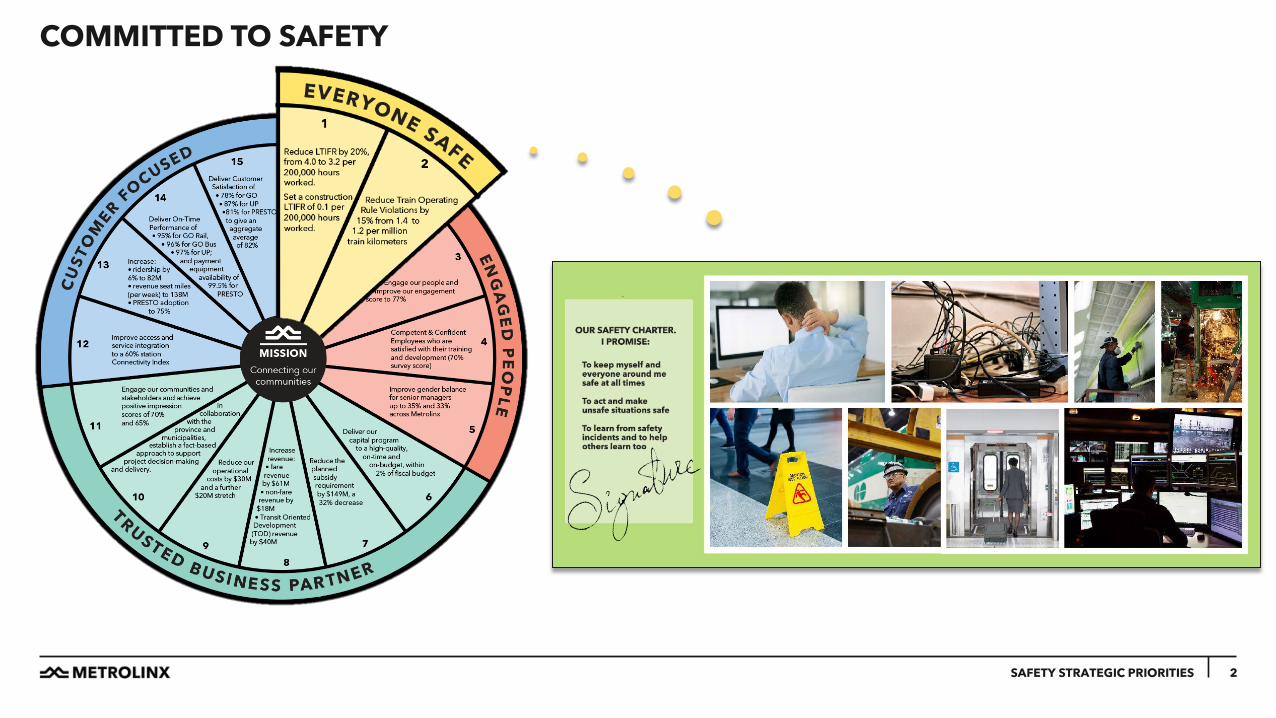
COMMITTED TO SAFETY
2 SAFETY STRATEGIC PRIORITIES

EXECUTIVE SUMMARY
3
• Safety has always been our top priority here at Metrolinx, but our renewed focus on safety is changing
things for the better.
• Employee injury reduction remains a key area of focus, and we are seeing injuries trending down in most
areas.
• We are outperforming our targets on Railway Rule Violations.
• We have recently brought Construction Safety into the Safety and Security division and are currently
developing KPIs to monitor and improve upon the safe behaviour of our construction contractors.
• We are focused on building safety culture through systematic improvement of safety performance and
employee engagement.
• We are committed to continuously improve the safety of our Operation for our employees, customers,
contractors and the communities in which we operate.
SAFETY STRATEGIC PRIORITIES

LOST TIME INJURY FREQUENCY REPORTED & TRAIN OPERATING RULE VIOLATIONS
4 SAFETY STRATEGIC PRIORITIES
6
14
1011 10
1415
4
20
8
14
11
4.5 4.6 4.6 4.6 4.3 4.3 4.0 3.9 4.0 3.9 4.1 4.0
0
5
10
15
20
25
May-18 Jun-18 Jul-18 Aug-18 Sep-18 Oct-18 Nov-18 Dec-18 Jan-19 Feb-19 Mar-19 Apr-19
LTIFR, Work Hours and Injuries - Twelve Month Rolling Trend
LTIs LTIFR (12 month rolling)
Our twelve month rolling average for the Metrolinx Train Operating Rule Violations is 1.0, which is under the 1.4 target for 2018-2019. There were no violations between November 2018 and April 2019. We have set a new target for 2019-2020 of 1.2 per million train kilometers.
Chart depicts the number of Lost Time Injuries on a monthly basis, along with the 12 month rolling Lost Time Injury Frequency Rate.

5
Awareness
Basic Understanding
Buy-in
Safety Culture
Adoption
Personal Understanding
Co
mm
itmen
t
Time
Low
High
Status Quo Vision
• Discuss safety scope & expectations
• Business units work together to create safety standards & KPIs
• Safety standards and messaging conveyed to all employees to improve safety culture
• Review data • Create short and long
term action plans to mitigate risks
• Implement best practices to reduce incidents & unsafe behaviour
• Improved Contractor KPI reporting
• Work towards reducing incident rates
• Employees are fully living the change and are making it their own
• Metrolinx as a leader and influencer in Construction Safety
• Everyone home safe. Every day
Safety Culture at Metrolinx
Where we were Current State Ideal target
WHERE WE ARE WITH SAFETY CULTURE
SAFETY STRATEGIC PRIORITIES

SAFETY LEADERSHIP
6 SAFETY STRATEGIC PRIORITIES

SAFETY ORIENTATION TRAINING
7
HSE Policy Commitments
Workplace Hazard Recognition
Training
Occ Health & Safety Act
Internal Responsibility System (IRS)
Safety Reporting Procedures
• Extended safety specific orientation training
• Detailed focus on legal responsibilities, hazard recognition and accident/incident reporting
SAFETY STRATEGIC PRIORITIES
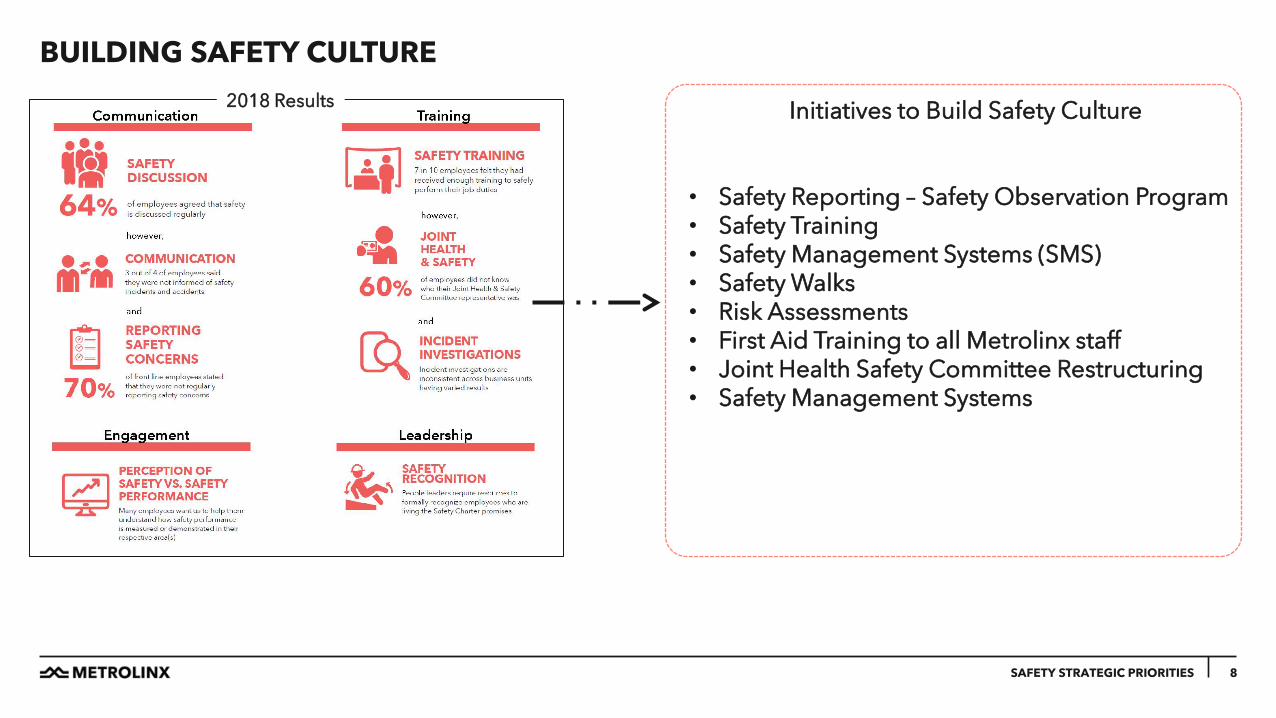
BUILDING SAFETY CULTURE
8
2018 Results
SAFETY STRATEGIC PRIORITIES
Initiatives to Build Safety Culture
• Safety Reporting – Safety Observation Program • Safety Training • Safety Management Systems (SMS) • Safety Walks • Risk Assessments • First Aid Training to all Metrolinx staff • Joint Health Safety Committee Restructuring • Safety Management Systems
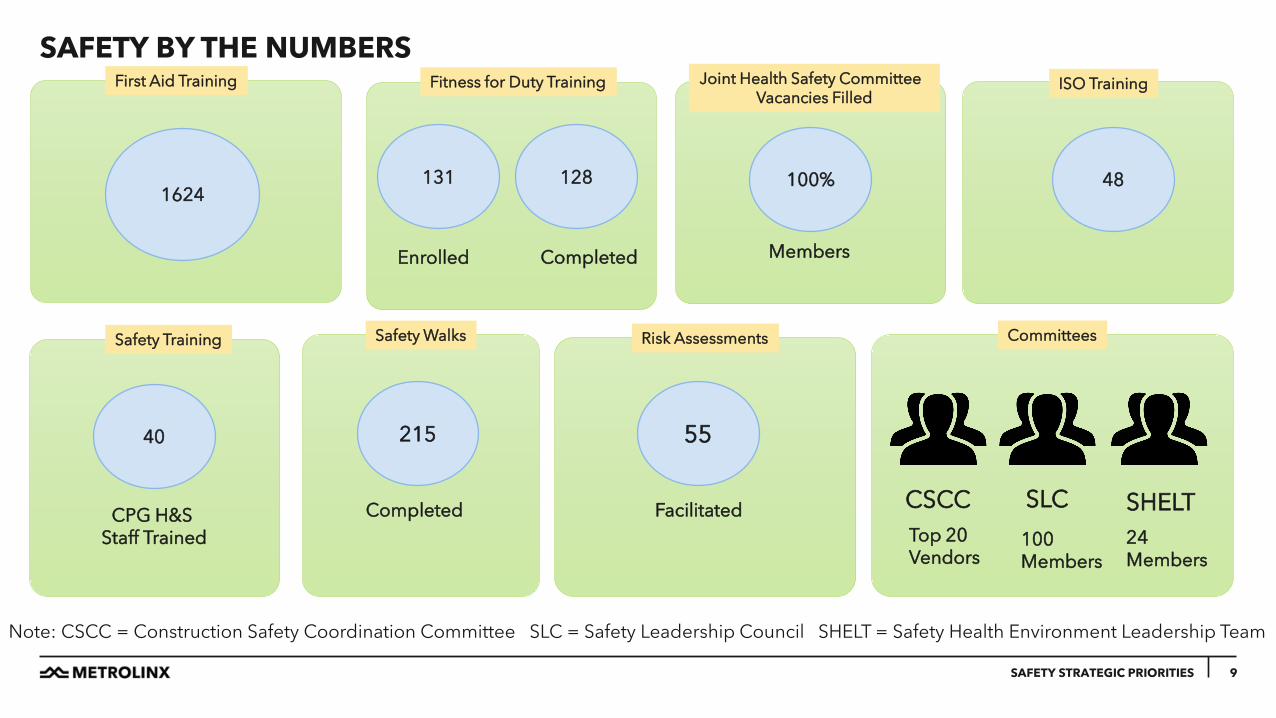
SAFETY BY THE NUMBERS
9
Risk Assessments
First Aid Training
Fitness for Duty Training Joint Health Safety Committee Vacancies Filled
ISO Training
Safety Training Safety Walks Committees
1624 131 128
Enrolled Completed
100% 48
40
CPG H&S Staff Trained
215 55
CSCC SHELT SLC Top 20 Vendors
100 Members
24 Members
Completed Facilitated
Members
Note: CSCC = Construction Safety Coordination Committee SLC = Safety Leadership Council SHELT = Safety Health Environment Leadership Team
SAFETY STRATEGIC PRIORITIES

CONSTRUCTION SAFETY
10
The Future of Construction Safety Management
SAFETY STRATEGIC PRIORITIES
Address gaps in Construction Safety Management Review organizational capabilities Work Planning & Safe Systems of Work Improve Construction safety oversight & Governance Develop Standards & Guidance Ensure accountability & due diligence in reporting Enhance current tools & systems used Raise competences requirements Reward Safety Excellence Drive safety culture Acquire new technologies for innovative solutions

Contractor Workers Attended
2346
CONSTRUCTION SAFETY: SAFER EXPECTATIONS
11
Site Visit Expectations
Position Frequency of Engagements During Design Stage
Frequency of Engagements During Construction Stage
Project Coordinator Once every 2 weeks Once a week
Project manager Once every 4 weeks Once every 2 week
Manager Once every 6 weeks Once every 3 weeks
Senior Manager Once every 6-7 weeks Once every 4-5 weeks
Director Once every 6-7 weeks Once every 4-5 weeks
VP Once every 7-8 weeks Once every 5-6 weeks
SAFETY STRATEGIC PRIORITIES
Safety Stand Down KPIs
Sessions Performed
70
Contractors Engaged
37
Projects that Performed SSDs
36
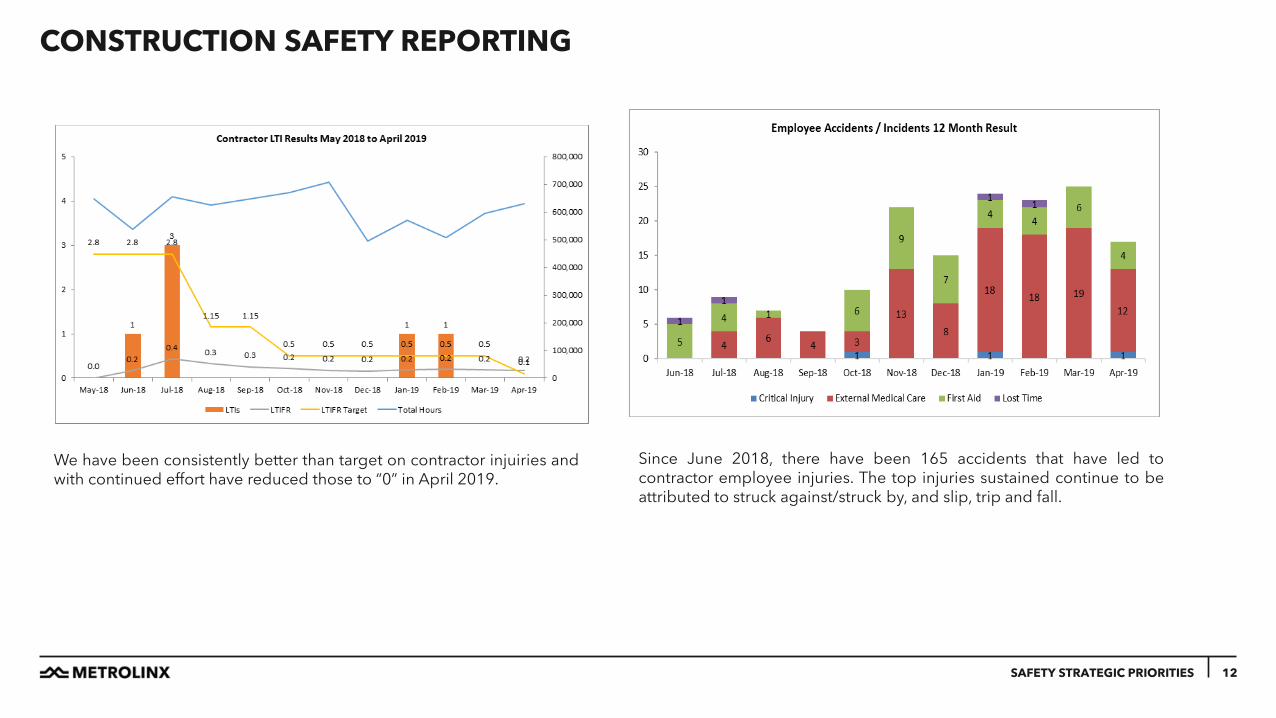
CONSTRUCTION SAFETY REPORTING
12 SAFETY STRATEGIC PRIORITIES
We have been consistently better than target on contractor injuiries and with continued effort have reduced those to “0” in April 2019.
Since June 2018, there have been 165 accidents that have led to contractor employee injuries. The top injuries sustained continue to be attributed to struck against/struck by, and slip, trip and fall.

CONSTRUCTION SAFETY REPORTING
13 SAFETY STRATEGIC PRIORITIES
• Serious Injury or Fatality precursors (SIFp) is defined as a high risk situation that could have resulted in a serious or fatal injury if not for certain barriers or countermeasures.
• Since May 2018, there have been 104 incidents that were identified as SIFp.
Of the 104 SIFp incidents the most frequent occurrences were due to the following root causes; • 25% of SIFs (18) were due to Procedural Non-Compliance • 19% of SIFs (14) were result of unsafe site conditions or poor housekeeping • 18% of SIFs (13) were caused due to Environmental Conditions • 14% of SIFs (10) were Equipment Related • 13% of SIFs (9) were vehicle related
14
EVERYONE HOME SAFE EVERY DAY
SAFETY STRATEGIC PRIORITIES

Recommended