SA HEALTHCARE INDUSTRY
LANDSCAPE REPORT
COMPILED: JUNE/JULY 2017

REPORT OVERVIEW
For the South African Population Demographics Section:
What is the South African population’s age, race and gender distribution in 2017?
For the Global and South African Burden of Disease Section:
What is the burden of disease globally and in South Africa?
What are the key underlying natural causes of death in South Africa?
What are the Global and South African health indicators (mortality, life expectancy and fertility rates)?
What are some of the major chronic diseases affecting us at both a global and a South African level?
For the Department of Health and Healthcare Policy Section:
What is South Africa’s National Development Plan for 2030?
What is the National Strategic Plan on HIV, STI’s and TB for 2017-2022?
What is the latest on the National Health Insurance (per government gazette 30 June 2017)?
SOME KEY QUESTIONS THE REPORT WILL HELP YOU TO ANSWER:
The South African Healthcare Industry Landscape Report (137 pages) provides a dynamic synthesis of
industry research, examining South African Population Demographics, Global and SA Burden of Disease,
Medical advancements in major chronic diseases, Healthcare Policy (NDP 2030, Strategic Plan 2017-2022,
NHI as per government gazette), Healthcare Practitioner Stats, Hospitals and Clinics, Medical Aids, and the
Pharmaceutical Services Sector.
2
REPORT OVERVIEW
For the Healthcare Practitioner Overview section:
What is the distribution of South African healthcare practitioners provincially?
What are the distribution of healthcare practitioners in the public versus the private sector of South Africa?
For the Hospitals and Clinics section:
What is the provincial distribution of private hospitals and clinics in South Africa?
What is the provincial distribution of public hospitals and clinics in South Africa?
What is the market share of private hospital beds, by hospital network?
For the Medical Aid section:
What is the proportion of population covered by medical aid schemes in South Africa?
What are the top 3 South African medical aid administrators’ share in the market?
What is the age and gender distribution of medical aid beneficiaries?
For the Pharmaceutical Services Sector section:
What is the provincial breakdown of pharmaceutical services in South Africa?
What is the total number of retail pharmacies in South Africa, by pharmacy group?
Who are the key retail players in the SA pharmaceutical industry?
What are the strengths, weaknesses, opportunities and threats within the pharmaceutical market?
3

SCREENSHOTS FROM REPORT
137 page report filled with detailed charts, graphs, tables and insights
4

SAMPLE FROM REPORT:SOUTH AFRICAN NON-COMMUNICABLE DISEASES
Noncommunicable diseases (i.e. chronic
diseases) continue their rise in the
rankings of the top 10 leading causes of
disease and death in South Africa with
Diabetes mellitus having moved into 2nd
position in 2015.
Noncommunicable diseases currently account
for 60% of the ten leading underlying causes
of death in South Africa. The leading
noncommunicable cause of death in South
Africa is Diabetes mellitus accounting for
25,070 deaths in 2015, followed by
cerebrovascular diseases (22,879) and other
forms of heart disease (22,215) as illustrated
by the adjacent graph.
The continued rise in noncommunicable
diseases has been fueled by the ageing
population group of 65 years and above.
Diabetes mellitus was the leading cause of
death for those aged 65 and older, accounting
for 9.1% of deaths among people within this
age group.
Ischaemic heart diseases, which is the
leading underlying cause of death globally,
was the 10th leading underlying cause of
death in South Africa in 2015. 5
Source: Statssa Image Source: Indianexpress
0
12,384
17,104
22,189
23,158
23,133
0
12,690
18,319
22,928
24,131
23,966
12,239
12,667
19,443
22,215
22,879
25,070
0 10,000 20,000 30,000
Ischaemic heart diseases (I20-I25)
Chronic lower respiratorydiseases (J40-J47)
Hypertensive diseases (I10-I15)
Other forms of heart disease(I30-I52)
Cerebrovascular diseases(I60-I69)
Diabetes mellitus (E10-E14)
TOP NONCOMMUNICABLE CAUSES OF DEATH IN SOUTH AFRICA: 2013-2015
2015 2014 2013

Source: fin24; biznews; ewn; Old Mutual; SA Commercial Prop News , Image Source: biznews; Daily Maverick
SAMPLE FROM REPORT:NATIONAL BUDGET SPEECH 2017
6
National Health Insurance Implications
Government is committed to achieving
universal health coverage.
National Health Insurance, which has not
been given much attention in recent policy
announcements, will be moving to a new
phase, funded by a National Health
Insurance Fund.
Discussions and preparation for this will take
place this year, and policy proposals could
include an adjustment to medical aid tax
credits. More details will be published in the
MTBPS in October 2017.
Budget 2017: Health Highlights
The Department of Health has been
allocated R187.5 billion.
An additional R885 million has been added to
support the implementation of the universal
test-and-treat policy for HIV.
R600 million has been set aside for the
commissioning of the new Nelson Mandela
Children’s Hospital.
Provincial hospital services will be R32.3
billion of the overall health budget.
Negotiations continue on the Sugar Tax,
which will be implemented later this year.
Over the next three years, R606bn will be
spent on health, with R59.5bn to be spent on
the HIV/AIDS conditional grant.
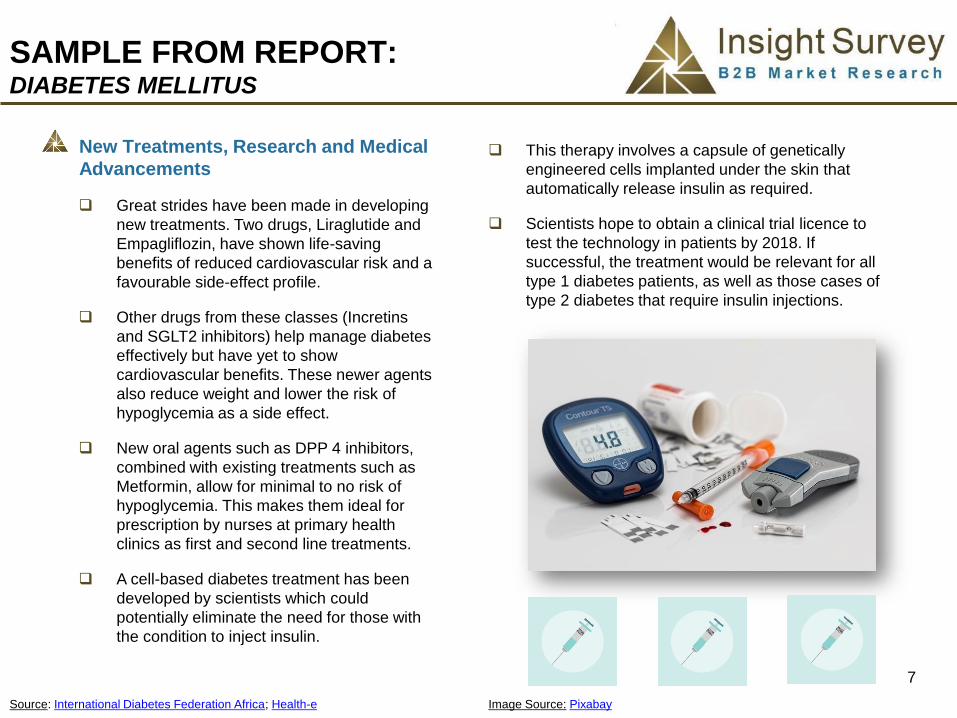
Source: International Diabetes Federation Africa; Health-e Image Source: Pixabay
7
This therapy involves a capsule of genetically
engineered cells implanted under the skin that
automatically release insulin as required.
Scientists hope to obtain a clinical trial licence to
test the technology in patients by 2018. If
successful, the treatment would be relevant for all
type 1 diabetes patients, as well as those cases of
type 2 diabetes that require insulin injections.
New Treatments, Research and Medical
Advancements
Great strides have been made in developing
new treatments. Two drugs, Liraglutide and
Empagliflozin, have shown life-saving
benefits of reduced cardiovascular risk and a
favourable side-effect profile.
Other drugs from these classes (Incretins
and SGLT2 inhibitors) help manage diabetes
effectively but have yet to show
cardiovascular benefits. These newer agents
also reduce weight and lower the risk of
hypoglycemia as a side effect.
New oral agents such as DPP 4 inhibitors,
combined with existing treatments such as
Metformin, allow for minimal to no risk of
hypoglycemia. This makes them ideal for
prescription by nurses at primary health
clinics as first and second line treatments.
A cell-based diabetes treatment has been
developed by scientists which could
potentially eliminate the need for those with
the condition to inject insulin.
SAMPLE FROM REPORT:DIABETES MELLITUS

In 2017, the greatest proportion of Medical Practitioners (56%) were General Practitioners.
Of all Medical Practitioners, 6% are Anaesthetists, while 4% are Gynaecologists and Obstetricians.
SAMPLE FROM REPORT: MEDICAL PRACTITIONER SERVICES: 2017
8
Service GPAnaesthe
-tist
Gynae &
Obs Physician
Ortho
Surgeon
Paedia-
trician
Psychia-
tristSurgeon
Family
Physician
Radiologi
st
Other
Practition
ers
Med Serv
Total
Frequency 14,446 1,465 990 786 777 768 683 664 581 544 3,974 25,678
Percentage 56% 6% 4% 3% 3% 3% 3% 3% 2% 2% 15% 100%
56%
6% 4% 3% 3% 3% 3% 3% 2% 2%
15%
0%
20%
40%
60%
80%
100%
MEDICAL PRACTITIONERS IN SOUTH AFRICA BY SERVICE: 2017
Source: Medpages (Access Date 25 June 2017) Image Source: Pixabay
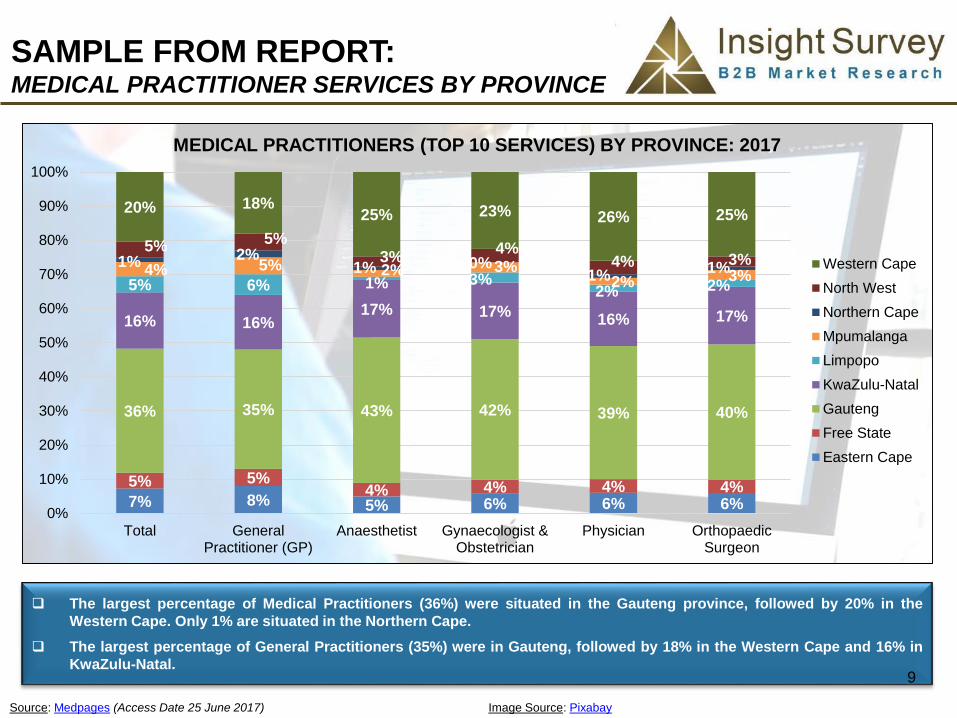
The largest percentage of Medical Practitioners (36%) were situated in the Gauteng province, followed by 20% in the
Western Cape. Only 1% are situated in the Northern Cape.
The largest percentage of General Practitioners (35%) were in Gauteng, followed by 18% in the Western Cape and 16% in
KwaZulu-Natal.
SAMPLE FROM REPORT: MEDICAL PRACTITIONER SERVICES BY PROVINCE
9
7% 8% 5% 6% 6% 6%
5% 5%4% 4% 4% 4%
36% 35% 43% 42% 39% 40%
16% 16%17% 17%
16% 17%
5% 6% 1% 3%2% 2%
4% 5% 2% 3%2% 3%
1% 2%1% 0%
1%1%
5% 5%3%
4%4% 3%
20% 18%25% 23% 26% 25%
0%
10%
20%
30%
40%
50%
60%
70%
80%
90%
100%
Total GeneralPractitioner (GP)
Anaesthetist Gynaecologist &Obstetrician
Physician OrthopaedicSurgeon
MEDICAL PRACTITIONERS (TOP 10 SERVICES) BY PROVINCE: 2017
Western Cape
North West
Northern Cape
Mpumalanga
Limpopo
KwaZulu-Natal
Gauteng
Free State
Eastern Cape
Source: Medpages (Access Date 25 June 2017) Image Source: Pixabay

Source: Dis-Chem; Dis-Chem Consolidated Results 28 Feb 2017 Image Source: Dis-Chem
SAMPLE FROM REPORT: DIS-CHEM: OVERVIEW
Dis-Chem Stores
2017: 108 Stores
10
Dis-Chem is SA’s second largest retail
pharmacy chain, with a turnover
increase of 15.3% and with like-for-like
turnover increasing by 9.1% in 2017.
Dis-Chem’s gross profit increased by 19.4%
to R4.2 billion for the 2017 financial year,
with the 2017 gross profit margin at 24.4%
and the 2016 margin at 23.4%.
This increase in gross profit is mainly due to
better trade terms with suppliers, while the
Group also continued to increase market
shares across their core categories.
Turnover growth for the Group was a result
of a maturing store base and the addition of
11 stores in the current year, resulting in 108
stores as at February 2017.
Dis-Chem estimates that at least 18 stores
are expected to open during the financial
year ending 28 February 2018.
Dis-Chem is opting for the franchise route in
order to accelerate expansion plans and
double their footprint, whilst also mirroring
Clicks’ loyalty program as its primary
customer retention strategy.
Despite the strong start to the new financial year,
it is expected that the weak consumer spending
environment will continue in 2017, with the
ongoing political uncertainty, low economic growth
and increase in taxes constraining consumers.

TABLE OF CONTENTS
1. Executive Summary (8 pages):
1.1 Global Burden of Disease
1.2 SA’s Burden of Disease
1.3 Major Chronic Diseases
1.4 Healthcare Policy Overview
1.5 Healthcare Practitioners
1.6 Hospital and Clinic Snapshot
1.7 Medical Aids Snapshot
1.8 Pharmaceutical Sector Snapshot
2. South African Population Demographics (3 pages):
2.1 South African Population: 2017 Race and Gender Estimate: TOTAL SA POPULATION BY RACE (2017), TOTAL SA POPULATION BY GENDER (2017)
(Graphs and Table)
2.2 South African Population: 2017 Age Estimate: SOUTH AFRICAN POPULATION AGE DISTRIBUTION (2017) (Graph and Table)
2.3 SA Province Overview (2017): GDP Contribution and Population Size (Tables)
11

TABLE OF CONTENTS
12
3. Global and South African Burden of Disease (16 pages):
3.1 Global Burden of Disease (8 pages)
3.1.1 Global Health Indicators: Mortality, Life Expectancy and Fertility: GLOBAL POPULATION (IN BILLIONS): 1955-2030, GLOBAL POPULATION YEARLY
GROWTH RATE (IN PERCENTAGE) : 1951-2016 (Graphs and Table)
3.1.2 Global Burden of Disease: GLOBAL DISTRIBUTION OF DEATHS AMONG THE THREE MAIN CAUSE GROUPS (BY PERCENTAGE): 2000 VS 2015, REGIONAL
DISTRIBUTION OF DEATHS AMONG THE THREE MAIN CAUSE GROUPS (BY PERCENTAGE): 2000 VS 2015 (Graphs)
3.1.3 Global Burden of Disease: GLOBAL TOP 10 CAUSES OF DEATH (IN MILLIONS): 2010 VS 2015 (Graph)
3.1.4 Global Noncommunicable Diseases: LEADING CAUSES OF NCD DEATHS (BY PERCENTAGE): 2000 VS 2015 (Graph)
3.1.5 Global Communicable Diseases: LEADING CAUSES OF COMMUNICABLE DEATHS (BY PERCENTAGE): 2000 VS 2015 (Graph)
3.1.6 Global Healthcare Trends
3.2 South African Burden of Disease (8 pages)
3.2.1 South African Health Indicators: Mortality, Life Expectancy and Fertility: SOUTH AFRICAN POPULATION (IN MILLIONS): 1960-2030, LIFE
EXPECTANCY AT BIRTH (IN YEARS): 1960-2015, CRUDE DEATH RATE: 2002-2016 (Graphs and Table)
3.2.2 South African Burden of Disease: ANNUAL NUMBER OF DEATHS IN SOUTH AFRICA (2010-2015), DISTRIBUTION OF NATURAL AND NON-NATURAL CAUSES
OF DEATH (2010-2015) (Graphs)
3.2.3 South African Burden of Disease: Natural Causes of Death: TOP 10 NATURAL CAUSES OF DEATH IN SOUTH AFRICA: 2015, TEN LEADING
UNDERLYING NATURAL CAUSES OF DEATH: 2013-2015 (Graphs)
3.2.4 South African Burden of Disease: Main Groups of Causes of Death: DISTRIBUTION OF SOUTH AFRICAN DEATHS AMONG THE THREE MAIN
GROUPS OF CAUSES OF DEATH: 2015 (Graph)
3.2.5 South African Noncommunicable Diseases: TOP NONCOMMUNICABLE CAUSES OF DEATH IN SOUTH AFRICA: 2013-2015 (Graph)

TABLE OF CONTENTS
13
3. Global and South African Burden of Disease Continued (16 pages):
3.2 South African Burden of Disease Continued (8 pages)
3.2.6 South African Communicable Diseases: TOP COMMUNICABLE CAUSES OF DEATH IN SOUTH AFRICA: 2013-2015 (Graph)
3.2.7 South African Healthcare Trends
4. Major Non-Communicable Diseases (15 pages):
4.1 Diabetes Mellitus: Major characteristics; Prevalence; Policy landscape; Current Treatment; New treatments and latest research
4.2 Cardiovascular Disease: Major characteristics; Prevalence; Policy landscape; Current Treatment; New treatments and research
4.3 Hyperlipidaemia: Major characteristics; Prevalence; Policy landscape; Current Treatment; New treatments and latest research
4.4 Hypertension: Major characteristics; Prevalence; Policy landscape; Current Treatment; New treatments and latest research
5. Department of Health and Healthcare Policy (21 pages):
5.1 Healthcare Policy Overview (5 pages)
5.1.1 South Africa Health Policy: National Development Plan 2030
5.1.2 South Africa Health Policy: Medium-Term Strategic Framework 2014-2019
5.1.3 Health Policy Highlights 2015/2016
5.1.4 National Budget Speech 2017

TABLE OF CONTENTS
14
5. Department of Health and Healthcare Policy Continued (21 pages):
5.2 National Strategic Plan on HIV, STI’S and TB Overview (9 pages)
5.2.1 SA Focus on HIV
5.2.2 SA Focus on Tuberculosis
5.2.3 National Strategic Plan on HIV, STI’S and TB (2012-2016): INCREASING NUMBERS OF PATIENTS ON ART (Graph)
5.2.4 National Strategic Plan on HIV, STI’S and TB: 2016 Achievement (Table)
5.2.5 National Strategic Plan on HIV, STI’S and TB: 2017-2022
5.3 National Health Insurance Overview (7 pages): Based on Government Gazette 30 June 2017
5.3.1 National Health Insurance: Definition and Features of NHI
5.3.2 National Health Insurance: Functioning in Private and Public Hospitals
5.3.3 National Health Insurance: Financing of NHI
5.3.4 National Health Insurance: NHI and Medical Aid Providers
5.3.5 National Health Insurance: Service Offering

TABLE OF CONTENTS
15
6. Healthcare Practitioner Statistics (20 pages):
6.1 Healthcare Practitioner Overview: 2017: REGISTERED HEALTHCARE PRACTITIONER OVERVIEW: 2017 (Graph and Table)
6.2 Medical Practitioners Services Overview: 2017: MEDICAL PRACTITIONERS IN SOUTH AFRICA BY SERVICE. 2017 ( Graph and Table)
6.3 Medical Practitioners in South Africa: Public vs. Private (Table)
6.4 Medical Practitioners Services Overview: 2017 (Tables)
6.5 Medical Practitioners by Province: 2017: MEDICAL PRACTITIONERS (TOP 10 SERVICES) BY PROVINCE: 2017 (Graph)
6.6 Mental Health Practitioner Services Overview: 2017: MENTAL HEALTH PRACTITIONERS IN SOUTH AFRICA BY PROFESSION: 2017 (Graph and Table)
6.7 Mental Health Practitioner by Province: 2017: MENTAL HEALTH PRACTITIONERS BY PROVINCE: 2017 (Graph)
6.8 Allied & Auxiliary Practitioner Services Overview: 2017: ALLIED AND AUXILIARY PROFESSIONALS IN SOUTH AFRICA BY PROFESSIONS: 2017 (Graph
and Tables)
6.9 Allied & Auxiliary Practitioner by Province: 2017: ALLIED & AUXILIARY PRACTITIONER BY PROVINCE: 2017 (Graph)
6.10 Dental Practitioner Services Overview: 2017: DENTAL PRACTITIONERS IN SOUTH AFRICA BY PROFESSION: 2017 (Graph and Table)
6.11 Dental Practitioner by Province: 2017: DENTAL PRACTITIONERS BY PROVINCE: 2017 (Graph)
6.12 Complementary & Integrative Practitioner Services: 2017: COMPLEMENTARY & INTEGRATIVE MEDICINCE PRACTITIONERS IN SOUTH AFRICA: 2017
(Graph and Table)
6.13 Complementary & Integrative Practitioner Services Overview: 2017: (Table)
6.14 Complementary & Integrative Practitioner by Province: 2017: COMPLEMENTARY & INTEGRATIVE MEDICINCE PRACTITIONERS BY PROVINCE: 2017
(Graph)
6.15 Animal Health Practitioner Services Overview: 2017: ANIMAL HEALTH PRACTITIONERS IN SOUTH AFRICA BY PROFESSION: 2017 (Graph and Table)

TABLE OF CONTENTS
16
7. Hospitals and Clinics (6 pages):
7.1 Hospital Types in South Africa: 2017: HOSPITAL TYPES BY TOTAL PRIVATE, PUBLIC: 2017 (Graph)
7.2 Clinic Types in South Africa: 2017: CLINIC TYPES BY TOTAL PRIVATE, PUBLIC: 2017 (Graph)
7.3 Private Hospitals and Clinic Groups: Total Numbers 2017: HOSPITALS AND CLINIC GROUPS- TOTAL LEVEL: 2017 (Graph)
7.4 Private Hospitals vs. Clinics Provincial Distribution: 2017: PRIVATE HOSPITALS VS CLINICS PROVINCIAL DISTRIBUTION: 2017 (Graph and Table)
7.5 Private Hospital Beds: 2016: PRIVATE HOSPITAL BED MARKET SHARE: 2016 (Graph and Table)
7.6 Public Hospitals vs. Clinics Provincial Distribution: 2017: PUBLIC HOSPITALS VS CLINICS PROVINCIAL DISTRIBUTION: 2017 (Graph and Table)
8. Medical Aids (16 pages):
8.1 Medical Aid Landscape
8.2 Medical Aid: Number of Beneficiaries: 2005-2015: NUMBER OF BENEFICIARIES (MILLION): 2005-2015 (Graph)
8.3 Medical Aid: Age and Gender Distribution of Beneficiaries: 2015: AGE AND GENDER DISTRIBUTION OF BENEFICIARIES: 2015 (Graph)
8.4 Medical Aid: Provincial Distribution of Beneficiaries: 2014 vs. 2015: PROVINCIAL DISTRIBUTION OF BENEFICIARIES: 2014 VS. 2015 (Graph)
8.5 Medical Aid: Number of Schemes: 2005-2015: NUMBER OF SCHEMES: 2005-2015 (Graph)
8.6 Medical Aid: Schemes by Size: 2014-2015: NUMBER OF SCHEMES BY SIZE: 2014-2015 (Graph)
8.7 Medical Aid Administrators: Market Share: 2010-2015: LARGEST MARKET SHARE FOR ALL SCHEMES: 2010-2015: (Graphs)
8.8 Discovery: Company Profile
8.9 GEMS: Company Profile

TABLE OF CONTENTS
17
8. Medical Aids (16 pages):
8.10 Medscheme: Company Profile
8.11 Metropolitan Health Risk Management: Company Profile
8.12 Momentum Health: Company Profile
8.13 Medical Aid: Benefits Paid 2014 vs. 2015: DISTRIBUTION OF HEALTHCARE BENEFITS PAID: 2014 VS. 2015 (Graph)
8.14 Medical Aid: Benefits Paid from Medical Savings Accounts 2015: DISTRIBUTION OF HEALTHCARE BENEFITS PAID FROM SAVINGS: 2015 (Graph)
8.15 Medical Aid: Benefits Paid 2014-2015: TOTAL BENEFITS PAID PER VISIT: 2014-2015 (Graph)
9. Pharmaceutical Services Sector (8 pages):
9.1 Pharmaceutical Services: Retail Pharmacies: 2017: RETAIL PHARMACIES (TOTAL NUMBERS): 2017 (Graph)
9.2 Clicks: Overview: RETAIL BREAKDOWN % FOR CLICKS FOR THE SIX MONTHS ENDED 28 FEBRUARY 2017 (Graph)
9.3 Durbell: Overview
9.4 Dis-Chem: Overview
9.5 Other SA Retailers
9.6 SWOT Analysis of the Pharmaceutical Market
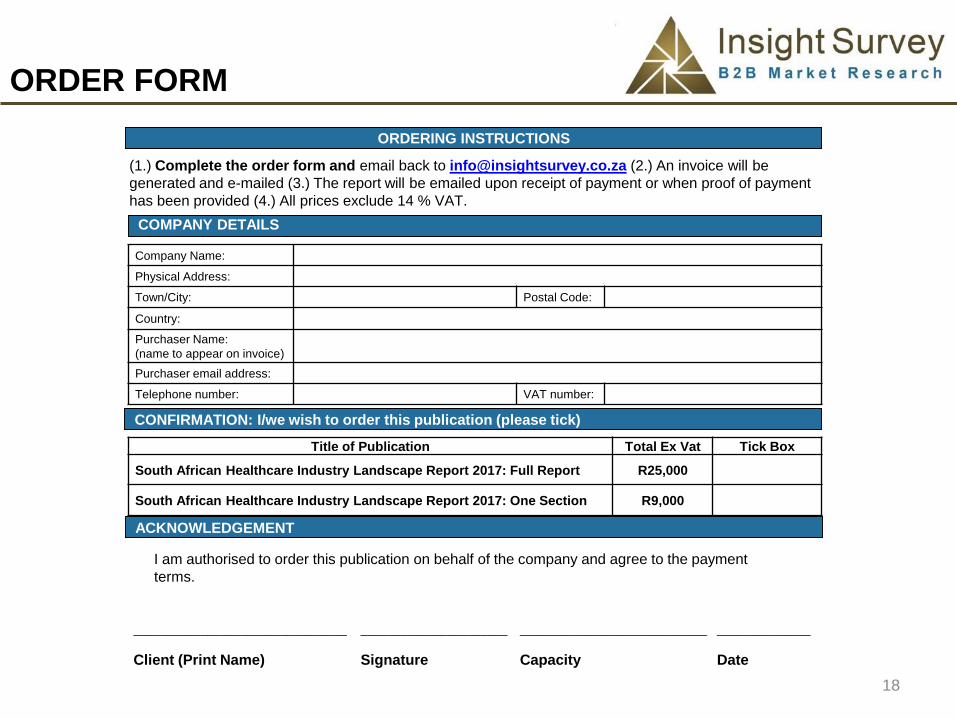
ORDER FORM
ORDERING INSTRUCTIONS
COMPANY DETAILS
Company Name:
Physical Address:
Town/City: Postal Code:
Country:
Purchaser Name:
(name to appear on invoice)
Purchaser email address:
Telephone number: VAT number:
CONFIRMATION: I/we wish to order this publication (please tick)
Title of Publication Total Ex Vat Tick Box
South African Healthcare Industry Landscape Report 2017: Full Report R25,000
South African Healthcare Industry Landscape Report 2017: One Section R9,000
ACKNOWLEDGEMENT
I am authorised to order this publication on behalf of the company and agree to the payment
terms.
________________________________
Client (Print Name)
______________________
Signature
______________________________
Capacity
______________
Date
(1.) Complete the order form and email back to [email protected] (2.) An invoice will be
generated and e-mailed (3.) The report will be emailed upon receipt of payment or when proof of payment
has been provided (4.) All prices exclude 14 % VAT.
18

COMPANY OVERVIEW
Insight Survey is a South African B2B market research company with almost 10
years of heritage, focusing on business-to business (B2B) market research to ensure
smarter, more-profitable business decisions are made with reduced investment risk.
We offer B2B market research solutions to help you to successfully improve or
expand your business, enter new markets, launch new products or better understand
your internal or external environment.
19

Our bespoke Competitive Business Intelligence Research can help give you the edge in a global
marketplace, empowering your business to overcome industry challenges quickly and effectively, and enabling you to realise your potential and achieve your vision.
From strategic overviews of your business’s competitive environment through to specific
competitor profiles, our customised Competitive Intelligence Research is designed to meet your
unique needs.
COMPETITIVE INTELLIGENCE
OUR RESEARCH SOLUTIONS
✓ Competitor pricing research
✓ Store visits and store checks
✓ Competitor interviews
✓ Customer interviews
✓ Company website analysis
✓ Governmental held records
14

CONTACT DETAILS
Johannesburg Cape Town
Telephone: +27 (0) 10 140-5756 +27 (0) 21 045-0202
Physical Address: 1 Wedgewood Link Unit 5
Bryanston Building 12
Johannesburg The Estuaries
2191 Century City
Cape Town
Contact: [email protected]
Website: www.insightsurvey.co.za
Recommended