10/8/2012
1
Role of Ganglion Cell Complex
(GCC)
in Evaluation of Glaucoma
BY
Azza Ismaiel Sedkey, M.D.
Consultant of Ophthalmology
Cairo University
• Retinal ganglion cells encompass three layers in the retina:
▫ The retinal nerve fiber layer (NFL) Made up of the ganglion cell axons,
▫ The ganglion cell layer (GCL) Made up of the ganglion cell bodies,
▫ The inner-plexiform layer (IPL) Made up of a network of axons and dendrites from
ganglion cells, bipolar cells, and amacrine cells
All three layers, collectively known as the ganglion cell
complex (GCC)
10/8/2012
2
Loss of the retinal ganglion cells and their axons is known
to occur in the posterior pole, where these cells may
constitute 30% to 35% of the retinal thickness in the
macular region Zeimer et al., 1998
Approximately 50% of retinal ganglion cells are located in
the macular region 4 to 5 mm from the center of the fovea
with the peak density occurring 750 to 1100 µm from the
foveal center where the cell density may be 4 to 6 cell
bodies thick Wässle H et al., 1989
Curcio CA et al., 1990
Normal Macular Architecture

10/8/2012
3
GCC
Area of Concern …………
OCT and GCC

10/8/2012
4
OCT and GCC
OCT and GCC
1
1
2
2
3
3

10/8/2012
5
OCT and GCC
OCT and GCC

10/8/2012
6
OCT and GCC
• Focal Loss Volume %
------ Localized field defects
OCT and GCC
• Global Loss Volume %
----- Generalized Retinal
Sensitivity

10/8/2012
7
Maps obtained
The Deviation Map
• Shows the percent loss from normal as determined by the normative database
• Map is calculated by taking the actual value from a scan at each pixel location in the map, subtracting the normal
value, and then dividing that by the normal value
• The result is a percent loss value at each pixel location in the map
• The map is color coded where blue represents GCC thinning from 20-30% relative to normal. Black coloring in the
Deviation Map represent a 50% loss or greater, relative to an age-matched normal
Normal GCC Parameters
• The thickness map is color coded where thicker regions are displayed in hot colors (yellow & orange), and thinner areas are displayed in cooler colors (blue & green) • The GCC map for a normal eye shows a bright circular band surrounding the macula representing a thick GCC from healthy ganglion cells

10/8/2012
8
Affected GCC Parameters
Affected GCC Parameters

10/8/2012
9
Relation between GCC thickness
and RNFL thickness
Severe GCC damage

10/8/2012
10
Severe GCC damage
Severe GCC damage

10/8/2012
11
Same
patient:
GCC and
RNFL
evaluation
Verification of Structural
Damage of GCC
10/8/2012
12
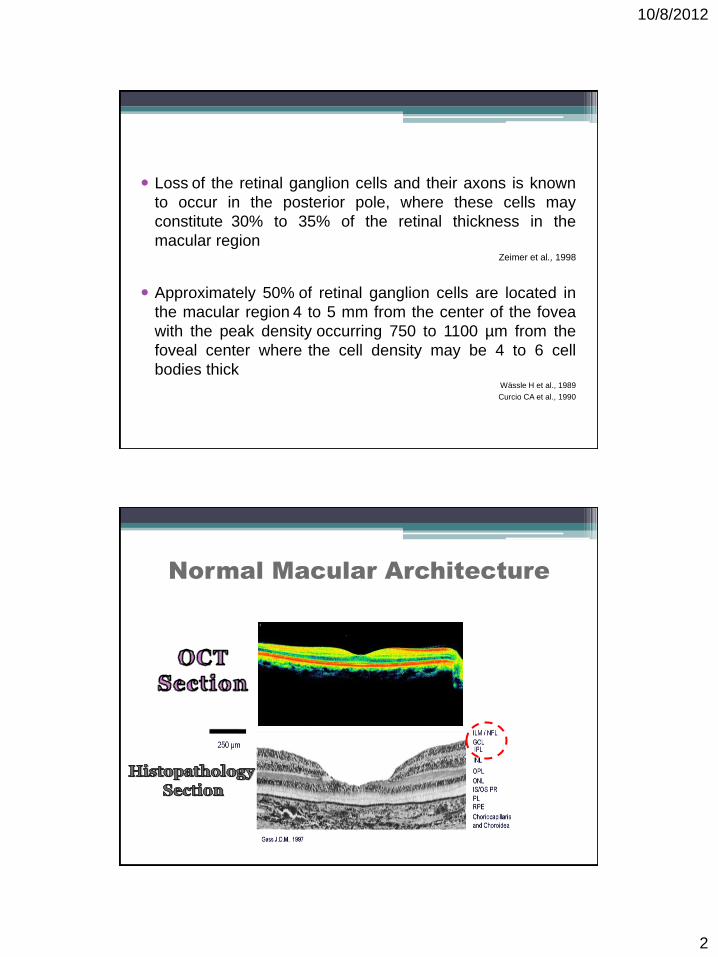
24-2 Threshold Field Print-out
10-2 field
• 10-2 strategy (usually used for evaluation of macular diseases e.g.
drug toxicity, AMD):
• Maximizes detection of defects centrally & provides the ability
to follow disease progression through increasing the number of
points tested

10/8/2012
13
Thickness map
Significance map
Gray Scale (10-2)
Thickness map
Significance map
Gray Scale (10-2)

10/8/2012
14
Thickness map
Significance map
Gray Scale (10-2)
Gray Scale (10-2)
Thickness map
Significance map

10/8/2012
15
Follow-up of GCC parameters
Follow-up of GCC parameters

10/8/2012
16
Follow-up of GCC parameters

10/8/2012
17
• Ganglion Cell Complex status should be considered on
evaluation of glaucoma patients
▫ It would also explain the common complaint of the patient
of un-satisfaction with the quality of BSCVA
• A significant correlation exists between GCC
affection and RNFL findings
• The significant correlation between macular field
affection and macular GCC thickness should drive the
ophthalmologists’ attention to the hazards of
neglecting macular affection in glaucoma patients
Residual tubular field
10/8/2012
18
Recommended