Roberson and Associates, LLC Technology and Management Consultants
Roberson and Associates, LLC Proprietary.
GPS SENSITIVITY MEASUREMENT PLAN
AUG 24, 2015
V1.1
1 MEASUREMENT PLAN EXECUTIVE SUMMARY ........................................................ 2 1.1 PURPOSE ................................................................................................................................ 2 1.2 DELIVERABLES ...................................................................................................................... 2 2 KPI MEASUREMENT PLAN ............................................................................................... 2 2.1 TEST PLAN FOR CELLULAR GPS DEVICES ......................................................................... 2 2.2 KEY PERFORMANCE INDICATORS (KPIS) FOR NON-CELLULAR GPS DEVICES ............... 3 2.3 GPS DEVICE LIST ................................................................................................................. 4 2.4 ANTENNAS ............................................................................................................................. 5 2.5 CONDUCTED MEASUREMENTS ............................................................................................. 6 2.6 RADIATED MEASUREMENTS ................................................................................................. 6 2.7 DEPENDENCIES AND ASSUMPTIONS ..................................................................................... 8 2.8 EQUIPMENT LIST ................................................................................................................. 10 2.9 CALIBRATION AND PRETEST .............................................................................................. 11 3 KPI MEASUREMENT ......................................................................................................... 11 3.1 MEASUREMENT SEQUENCE ................................................................................................ 11 3.2 AVIATION CERTIFIED MEASUREMENTS ............................................................................ 13 3.3 AVIATION (UNCERTIFIED) MEASUREMENTS ..................................................................... 14 3.4 HIGH PRECISION MEASUREMENTS .................................................................................... 15 3.5 TIMING ................................................................................................................................. 19 3.6 CELLULAR DEVICE MEASUREMENTS ................................................................................ 20 3.7 GENERAL NAVIGATION DEVICE MEASUREMENTS ........................................................... 22 4 TTFF AND REACQUISITION TESTING ........................................................................ 23 5 ANALYSIS ............................................................................................................................ 24 5.1 STATISTICAL ANALYSIS ...................................................................................................... 24 6 CHANGE HISTORY ............................................................................................................ 25

Roberson and Associates, LLC
2 Roberson and Associates, LLC Proprietary
1 MEASUREMENT PLAN EXECUTIVE SUMMARY
1.1 Purpose The purpose of the GPS receiver measurement project is to collect supporting data to establish the impact on Key Performance Indicators (KPIs) that a GPS device user may experience when L-band LTE downlink and uplink signals are present. Signal to noise ratios in the form of reported C/No values and other GPS receiver data will also be collected. Emphasis is on real world expected LTE signal levels including temporal and spatial variations in signal levels.
1.2 Deliverables For each device in each category the main deliverables are detailed records of the KPI statisticsobserved as a function of LTE signal levels at the input to the GPS device. A determination is made of the received power adjacent band levels versus observed changes in KPI statistics without any pass/fail determination.
2 KPI MEASUREMENT PLAN
2.1 Test Plan for Cellular GPS Devices
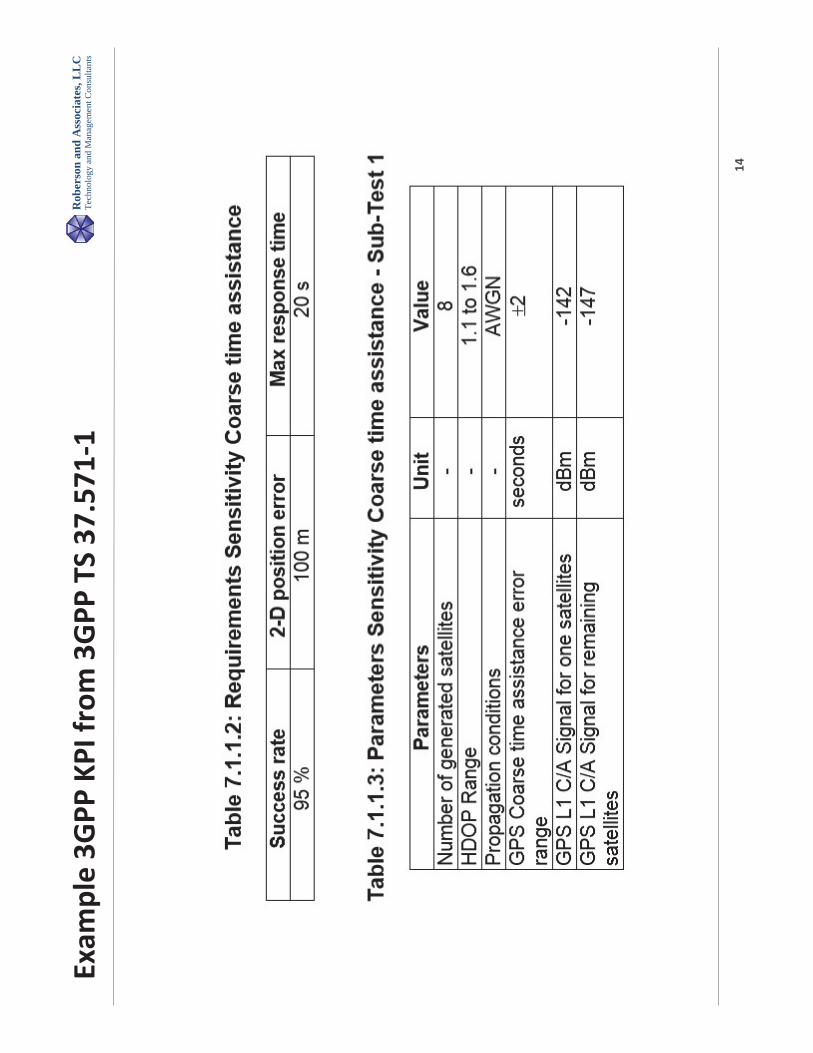
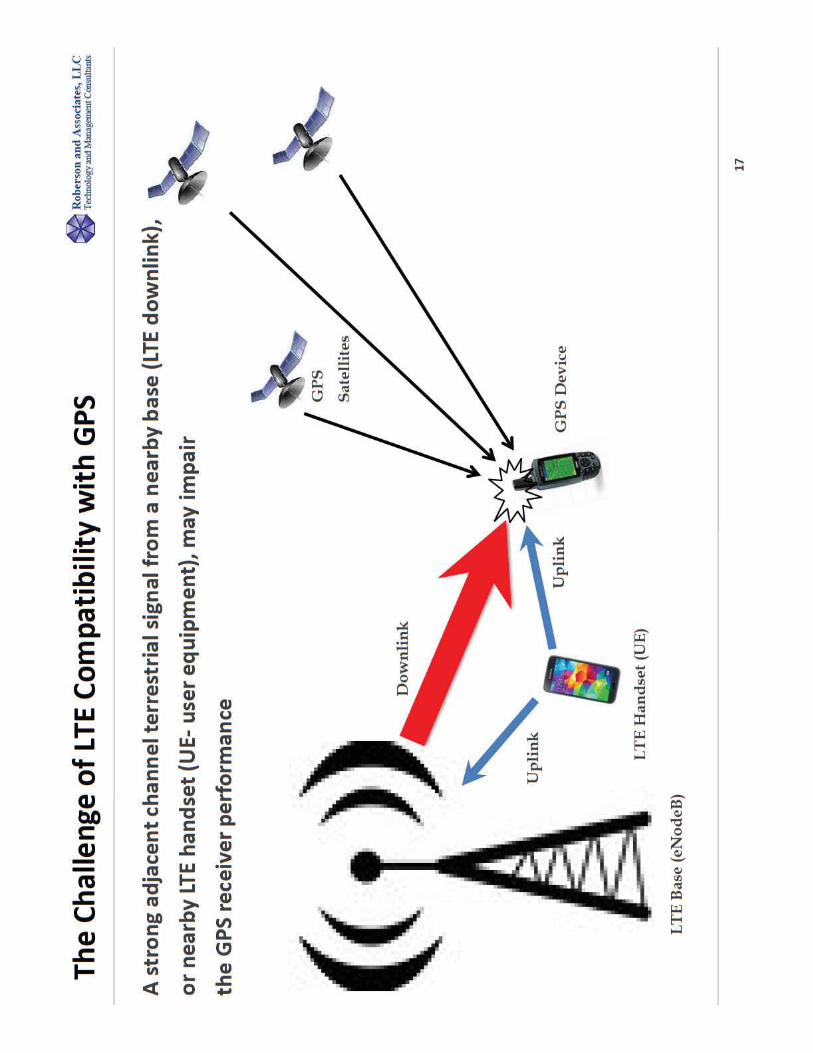
Cellular GPS devices will be tested as per the TWG devised test plans for Accuracy [TWG Report, Sections 3.2.9.2.2 and 3.2.9.2.3] and Sensitivity [TWG Report, Section 3.2.9.2.1]. If it is infeasible to perform the tests exactly as per these test plans, the latter may be modified in the future. These 3GPP tests are found in 3GPP Specification 37.571-1 for UTRAN and E-UTRAN based systems. The Sensitivity test is described in section 7.1 and the Accuracy test is describedin section 7.2.
The two figures below are taken from TS 37-571-1.

Roberson and Associates, LLC
3 Roberson and Associates, LLC Proprietary
Figure 1 3GPP Sensitivity KPI and test conditions from TS 37.571-1
Figure 2 3GPP Accuracy KPI and test setup from TS 37.571-1
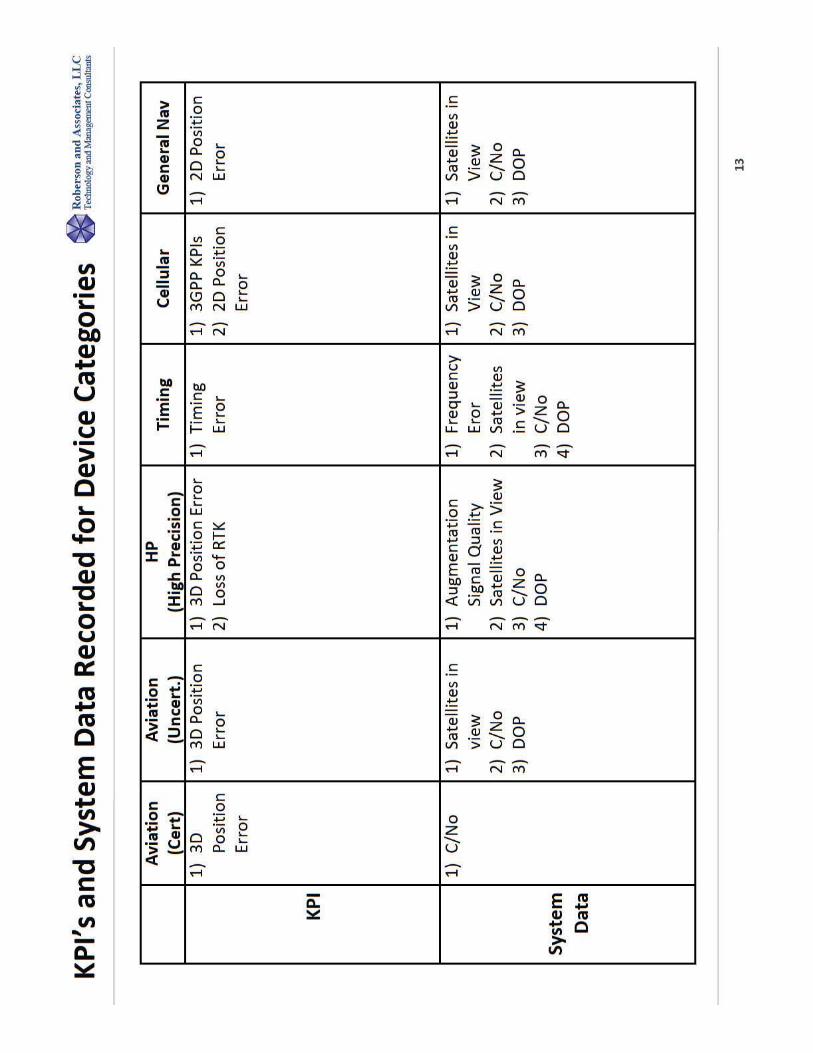
2.2 Key Performance Indicators (KPIs) for non-Cellular GPS Devices
The table below lists a preliminary list of the KPIs of the different GPS device classes. This list is subject to enhancement as additional inputs are received hopefully including inputs from the key GPS vendors whose devices will be the subject of this test. Dilution of Precision (DOP) is a function of the position of satellites and not a KPI dependent on LTE signals level. Since C/No is reported in NMEA messages along with other data it will be collected.
C/No and the number of satellites are reported for each satellite in NMEA messages and will also be collected and included in the statistical analysis. Not all devices report C/No.


Roberson and Associates, LLC
6 Roberson and Associates, LLC Proprietary
PCTel Mobile 8171D-HR
PCTel Timing GPS-TMG-HR-26N
JAVAD (LSQ Provided) High Precision N/A
Novatel High Precision GPS-713-GGG-N
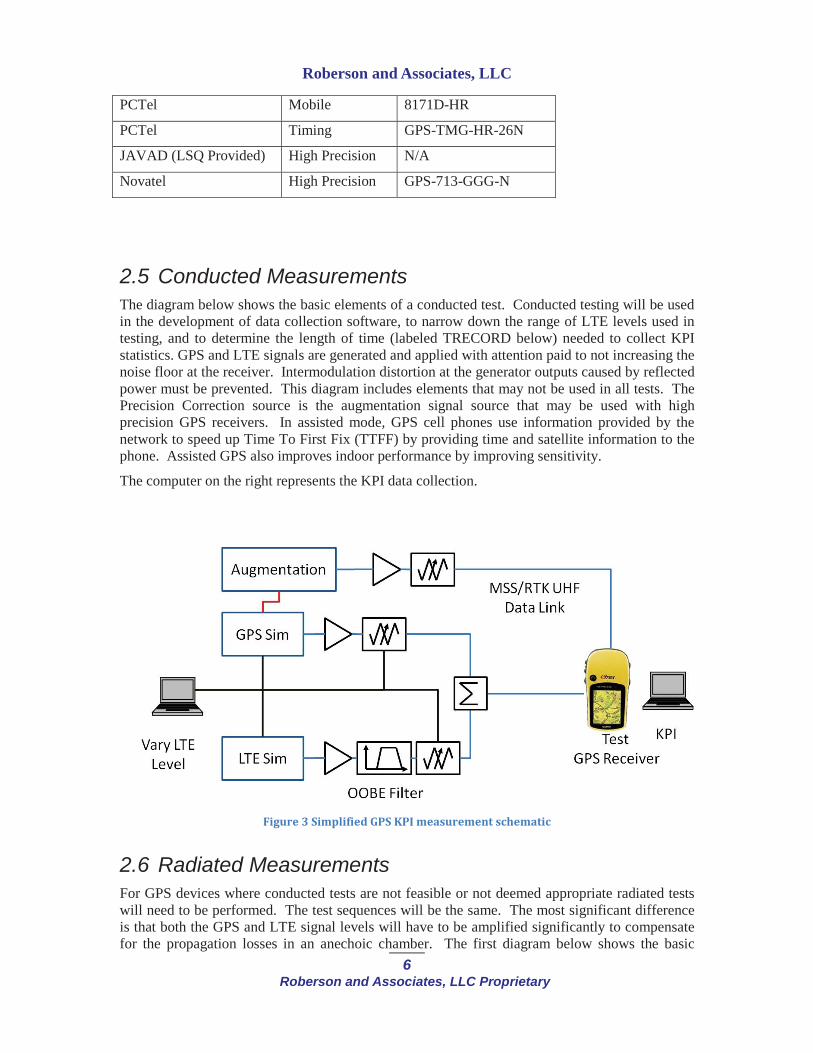
2.5 Conducted MeasurementsThe diagram below shows the basic elements of a conducted test. Conducted testing will be used in the development of data collection software, to narrow down the range of LTE levels used in testing, and to determine the length of time (labeled TRECORD below) needed to collect KPI statistics. GPS and LTE signals are generated and applied with attention paid to not increasing the noise floor at the receiver. Intermodulation distortion at the generator outputs caused by reflected power must be prevented. This diagram includes elements that may not be used in all tests. The Precision Correction source is the augmentation signal source that may be used with high precision GPS receivers. In assisted mode, GPS cell phones use information provided by the network to speed up Time To First Fix (TTFF) by providing time and satellite information to the phone. Assisted GPS also improves indoor performance by improving sensitivity.
The computer on the right represents the KPI data collection.
Figure 3 Simplified GPS KPI measurement schematic
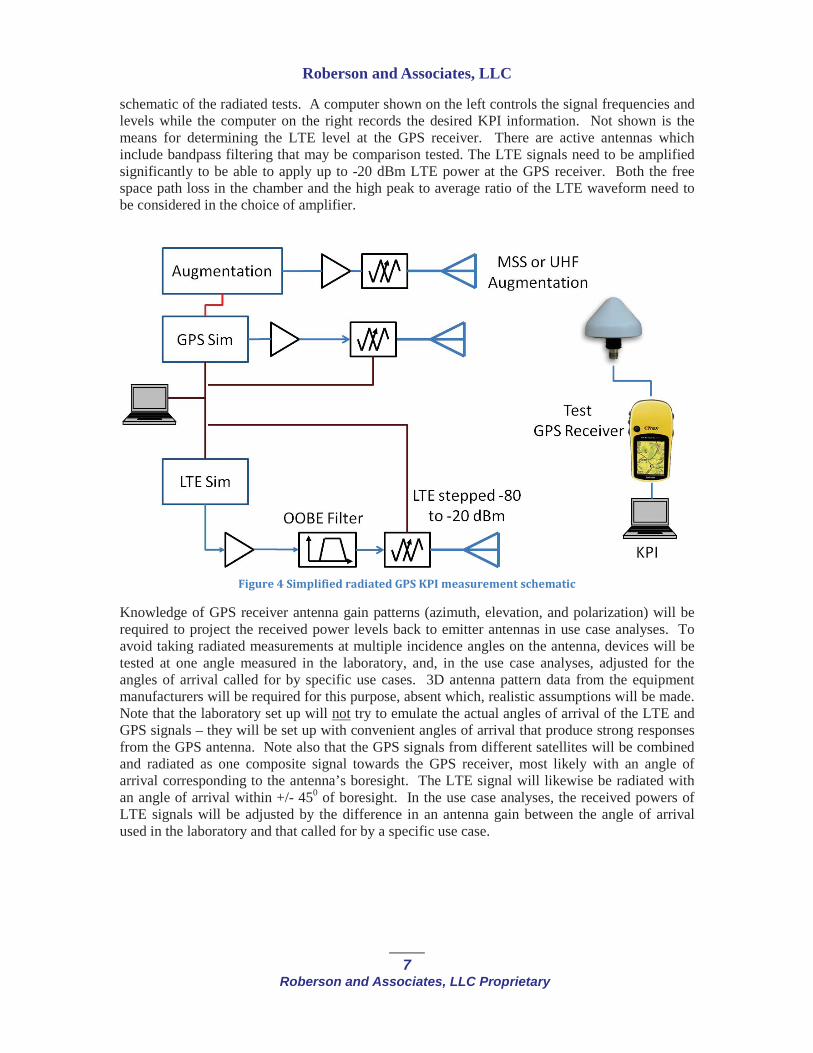
2.6 Radiated MeasurementsFor GPS devices where conducted tests are not feasible or not deemed appropriate radiated tests will need to be performed. The test sequences will be the same. The most significant difference is that both the GPS and LTE signal levels will have to be amplified significantly to compensate for the propagation losses in an anechoic chamber. The first diagram below shows the basic
Roberson and Associates, LLC
7 Roberson and Associates, LLC Proprietary
schematic of the radiated tests. A computer shown on the left controls the signal frequencies and levels while the computer on the right records the desired KPI information. Not shown is the means for determining the LTE level at the GPS receiver. There are active antennas which include bandpass filtering that may be comparison tested. The LTE signals need to be amplified significantly to be able to apply up to -20 dBm LTE power at the GPS receiver. Both the free space path loss in the chamber and the high peak to average ratio of the LTE waveform need to be considered in the choice of amplifier.
Figure 4 Simplified radiated GPS KPI measurement schematic
Knowledge of GPS receiver antenna gain patterns (azimuth, elevation, and polarization) will be required to project the received power levels back to emitter antennas in use case analyses. To avoid taking radiated measurements at multiple incidence angles on the antenna, devices will be tested at one angle measured in the laboratory, and, in the use case analyses, adjusted for the angles of arrival called for by specific use cases. 3D antenna pattern data from the equipment manufacturers will be required for this purpose, absent which, realistic assumptions will be made. Note that the laboratory set up will not try to emulate the actual angles of arrival of the LTE and GPS signals – they will be set up with convenient angles of arrival that produce strong responses from the GPS antenna. Note also that the GPS signals from different satellites will be combined and radiated as one composite signal towards the GPS receiver, most likely with an angle of arrival corresponding to the antenna’s boresight. The LTE signal will likewise be radiated with an angle of arrival within +/- 450 of boresight. In the use case analyses, the received powers of LTE signals will be adjusted by the difference in an antenna gain between the angle of arrival used in the laboratory and that called for by a specific use case.

Roberson and Associates, LLC
8 Roberson and Associates, LLC Proprietary
2.7 Dependencies and Assumptions Only the 10 MHz bandwidth version of LTE signals will be used in the measurements. Downlink LTE signals will be assumed to be supporting many devices and have most or all LTE resource blocks assigned.
Uplink LTE signals will be representative of high data rate, greater than 1Mbps, traffic, for example traffic representative of streaming video, nominally 3.5 Mbps. The high data rate case is the worst case since this represents transmitting on the most time and frequency resource blocks over time. Lower uplink data rates may be measured also but with a lower priority. Lower data rates will be experienced in the field and result in lower radiated power, since many of the resource blocks are not being used.
The post measurement Analysis of the data involves comparison of the measured received estimated positions (for navigation receivers) and time (for timing receivers) with the true values. The basic process is to compare true position and time with received values. 2D and 3D mean and RMS position errors and timing errors will be calculated and C/No values recorded asfunctions of LTE downlink and uplink signal levels at the receiver. No pass/fail judgment will be made, but analysis will be performed to estimate the impact to the user of KPI degradation in real life scenarios.
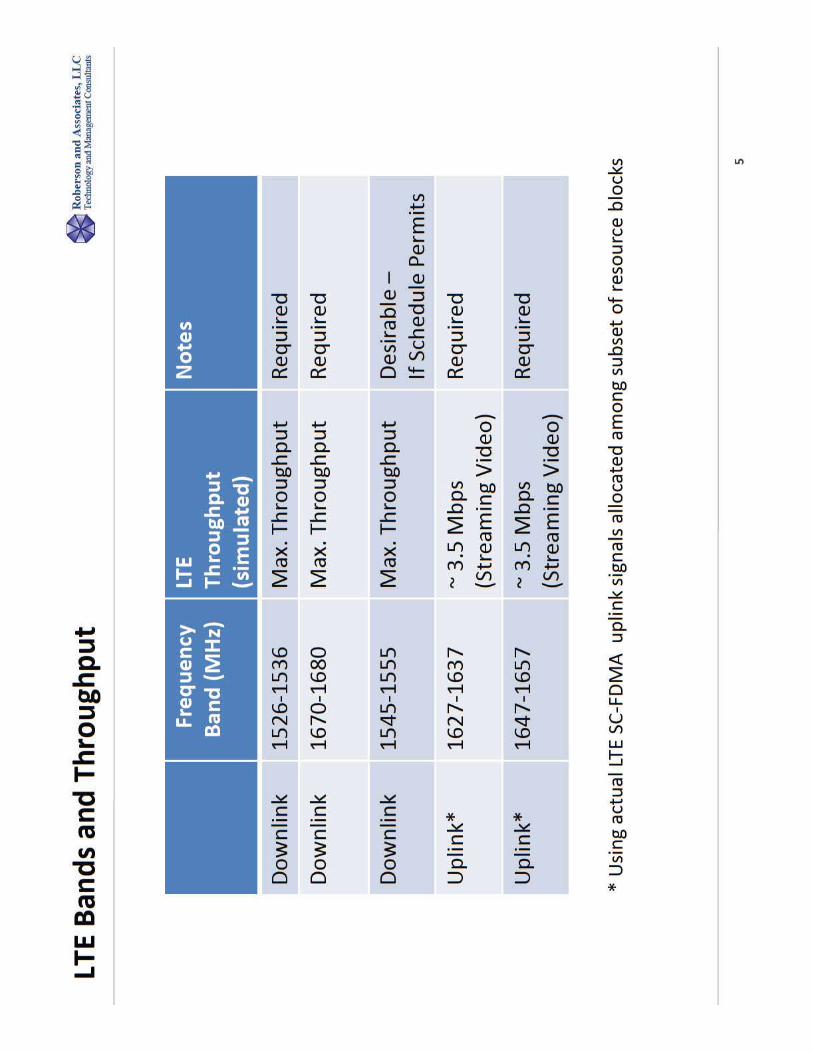
2.7.1 LTE BandsThe bands for the LTE signals to be used in the KPI measurements are shown below: Only 10 MHz bandwidths will be used. Uplink signals will include LTE resource block scheduling effects for high (3.5 Mbit/second) data rate file transfers..
LTE Direction LTE Band
Downlink 1526-1536 MHz
Downlink 1545-1555 (Schedule permitting)
Downlink 1670-1680
Uplink 1627.5-1637.5
Uplink 1646.7-1656.7
2.7.2 LTE Uplink Signal Generation OOBE Noise FloorThe uplink LTE signals need to simulate the entire output power spectrum that is expected to be seen from a cellular phone. The OOBE limit for LightSquared’s devices is -95 dBW/MHz in the Radio Navigation Satellite Service band (1559-1610 MHz). The tests will emulate LightSquared devices emitting OOBE at their licensed limit. The diagram below shows the desired power spectral density for LTE uplink signals.


Roberson and Associates, LLC
10Roberson and Associates, LLC Proprietary
2.7.3 GPS Conditions
Two GPS conditions will be provided for some KPI measurements.
Condition Number Level
Open 8+ satellites -130 dBm
Stressed 5 Satellites TBD
2.7.4 GPS ImpairmentsOther GPS system impairments, external to the receiver, will be emulated where feasible. These impaired conditions are summarized in the table below. These are important to be able to accurately gauge the incremental impact of LTE signals. These impairments were derived starting with values from “GLOBAL Positioning System Standard Positioning Service Performance Standard” 4th Edition, From GPS DIRECTORATE; Page 65 and 108. A conservative Zero Age of DATA (AOD) was used. Finally, the 95 % values were converted to 50% CEP values.
Table 2GPS impairments
2.8 Equipment List The list below includes the equipment that may be needed for measuring the sensitivity of GPS KPIs to LTE signal levels
1. Spirent or other GPS Test Set capable of introducing typical GPS impairments
2. MSS Augmentation signal source
3. RTK Augmentation message generation and RF, WiFi, or Ethernet RTK signal source
4. LTE Signal Generator
5. RF Amplifiers
6. RF Attenuators
7. RF Signal Combiners
Roberson and Associates, LLC
11Roberson and Associates, LLC Proprietary
8. LTE TX OOBE Filters
9. LTE TX and GPS TX Antennas
10. GPS RX Antennas
11. GPS RX Filters
12. Timing jitter test equipment
13. Frequency Error test equipment
2.9 Calibration and Pretest Prior to collecting detailed KPI data the devices need to be characterized for their basic performance levels. The GPS devices need to have their GPS signal sensitivities measured and recorded. This involves applying a GPS constellation signal at a fixed, known level to each device and recording the reported C/No for each device. No adjacent band signal will be present during these measurements.
In addition to sensitivity (C/N0 reported with -130 dBm received signal level) the gradient of the reported C/N0 vis a vis input C/N0 will also be measured. The value of the received signal level will be reduced in 1 dB steps from -130 dBm to -145 dBm and the reported C/N0 reported for each step. Ideally a given reduction in the input signal level should result in an identical reduction of C/N0 but this may not be the case with actual receivers.
A large variation in C/No or its gradient between GPS devices will need further investigation and a decision will be made regarding continuing measurements with that device.
Prior to data collection it is important to verify that the thermal noise floor has not been increased and that no spurious intermodulation signal produced by interactions between the GPS and LTE signal generators.
2.9.1 Pretest GPS ImpairmentsThere are two pretest GPS conditions of interest. These are the un-impaired OPEN and impaired OPEN GPS conditions. These tests can also be performed during step 2 shown in the LTE sensitivity test sequence shown in Figure 7 below.
GPS Impairment GPS Condition KPIs/Network Data
Un-impaired OPEN Described in Table 1
Impaired, Table 2 OPEN Described in Table 1
3 KPI MEASUREMENT
3.1 Measurement Sequence The basic sequence to measure the changes in KPIs as a function of LTE signal level is shown below. The idea is to apply LTE signal and increase the level in 1 dB steps and capturing

Roberson and Associates, LLC
12Roberson and Associates, LLC Proprietary
statistically valid KPI data sets at each step. A baseline set of KPI data without the LTE signal will also be collected.
The GPS simulator will be set to emulate standard User Equivalent Range Errors (UERE)) that are independent of receiver C/N0. The error sources will include at least: satellite ephemeris error, satellite clock error, ionospheric and tropospheric delay error and standard multipath profiles (conforming to a standard such as 3GPP). Receivers using augmentation signals may be able to remove a large part of these errors but non-augmented receives will experience a baseline rms error, as they do in real life operation, that will be present in the absence of LTE signals. The KPI statistics will show the impact of the LTE signals on the baseline error.
Figure 7 Generic GPS KPI measurement sequence
The pseudo-code description for the MEASURE_KPI_SET() sequence is given below. The parameter TRECORD must be long enough to capture a large enough set of KPI measurements so that statistically valid KPI averages and standard deviations can be calculated. TRECORD may be as long as one minute or more for devices that report KPI values at a low rate. Power GPS deviceApply GPS signalWait for the GPS receiver to enter the fix-found stateAdjust GPS source level until received GPS SNR (C/No) is 45
dB.HzRecord baseline GPS NMEA signal parameters, and KPI values for
TRECORD seconds.Apply LTE signal Adjust the LTE level until the received LTE signal level is -85
dBm.Loop until LTE level reaches -20 dBmrecord GPS NMEA signal parameters and KPI values for TRECORD
seconds.
Roberson and Associates, LLC
13Roberson and Associates, LLC Proprietary
increase LTE level by (coarse 5 dB then fine 1 dB) Loop until LTE level reaches -80 dBm
record GPS NMEA signal parameters and KPI values for TRECORDseconds.
decrease LTE level by (fine 1 dB then coarse 5 dB)
3.2 Aviation Certified Measurements
3.2.1 Aviation Certified situationCertified aviation GPS receivers have to meet RTCA standards for immunity to adjacent band signals. It is important to understand how the ability of certified aviation receivers to accurately report 3-D position is affected by the presence of LTE signals in the adjacent band.
3.2.2 Desired GoalsCharacterize the 3D position error performance of a small sample of certified aviation devices as a function of a constant LTE signal at different levels. The change in position error will be used as the KPI, and compared to the measurement of 1 dB C/No reported by the device.
3.2.3 Plan Measure only a small number of certified aviation GPS receivers. Standard RTCA tests are very involved and include C/No as a performance metric so C/No needs to be collected along with 3D position error to be able to show that the GPS receivers meet and exceed the RTCA standards.
Aviation devices will not be subject to urban canyon effects. The Stressed GPS conditions do not apply.
3.2.4 AssumptionsAccess is available to NMEA messages or C/No data.
3.2.5 Test SequenceThe pseudo-code for static measurements is given belowSet GPS condition to OPENFor each downlink frequency band (1531, 1550, 1675)
MEASURE_KPI_SET()For each uplink frequency band (1631, 1657)
MEASURE_KPI_SET()Calculate KPI averages and standard deviations for each LTE level

Roberson and Associates, LLC
14Roberson and Associates, LLC Proprietary
3.3 Aviation (uncertified) Measurements
3.3.1 Aviation (uncertified) situationUncertified aviation devices offer a wealth of information to pilots. GPS receiver data is linked to maps, terrain databases, and airport databases. Cellular devices are very widely used and it is likely they will operate in close proximity to aviation devices while a plane is on the ground.Uplink signal levels corresponding to those that might be seen for distances as close as a few meters need to be tested.
Airplanes are also able to view multiple base-stations when in the air at cruising altitudes. Testing with downlink signals is an important consideration at lower altitudes during takeoff and landing.
3.3.2 Desired GoalsCharacterize the KPI performance of the latest uncertified aviation devices as a function of a constant LTE signal at different levels.
3.3.3 Plan Measure only the high sales volume devices (listed in device table) and capture and store KPI data as function of LTE signal strength. Independent of market share, include a few devices known/expected to have best in class tolerance to adjacent band power levels. Log true position, and other KPI data from simulator. Plot RMS KPI errors in KPI values vs. LTE signal level and C/No. Aviation devices will not be subject to urban canyon effects. The Stressed GPS conditions do not apply.
Analysis: Compare true position and velocity with received values. Plot absolute and RMS errors of KPIs.
3.3.4 AssumptionsAccess is available to 3D location error data and NMEA data.
3.3.5 Test SequenceThe pseudo-code for static measurements is given belowSet GPS condition to OPENFor each downlink frequency band (1531, 1550, 1675)
MEASURE_KPI_SET()For each uplink frequency band (1631, 1657)
MEASURE_KPI_SET()Calculate KPI averages and standard deviations for each LTE level
Roberson and Associates, LLC
15Roberson and Associates, LLC Proprietary
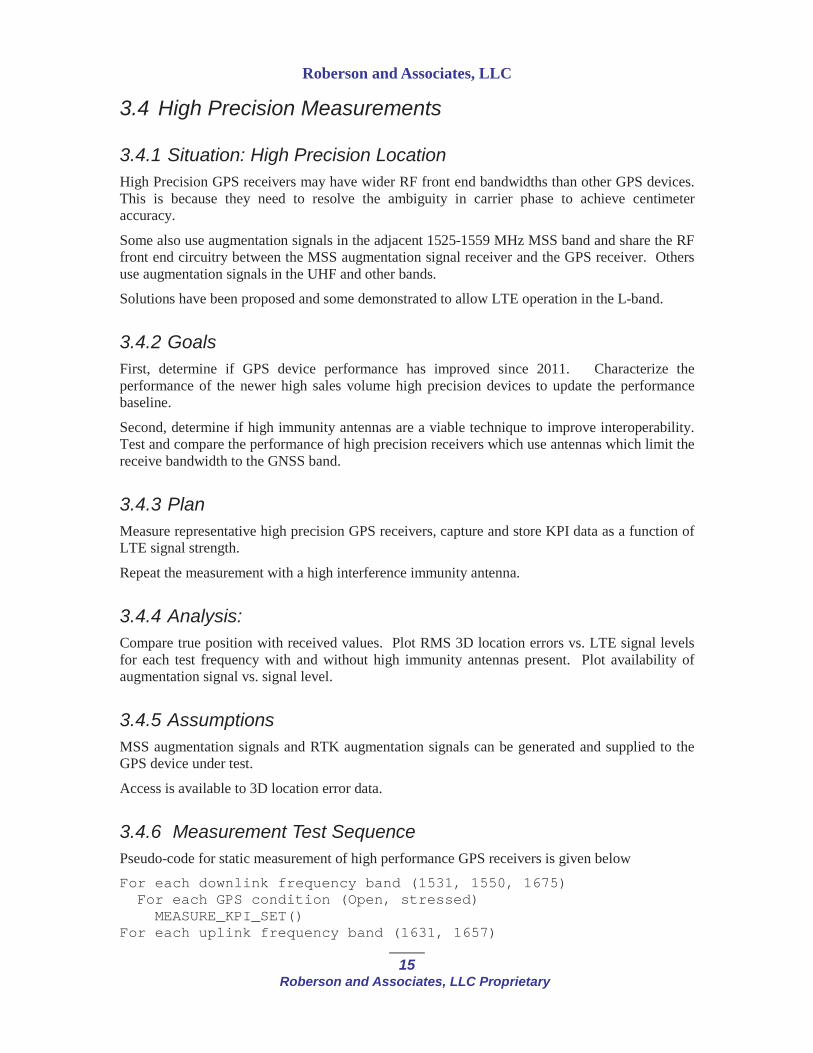
3.4 High Precision Measurements
3.4.1 Situation: High Precision LocationHigh Precision GPS receivers may have wider RF front end bandwidths than other GPS devices. This is because they need to resolve the ambiguity in carrier phase to achieve centimeter accuracy.
Some also use augmentation signals in the adjacent 1525-1559 MHz MSS band and share the RF front end circuitry between the MSS augmentation signal receiver and the GPS receiver. Others use augmentation signals in the UHF and other bands.
Solutions have been proposed and some demonstrated to allow LTE operation in the L-band.
3.4.2 GoalsFirst, determine if GPS device performance has improved since 2011. Characterize the performance of the newer high sales volume high precision devices to update the performance baseline.
Second, determine if high immunity antennas are a viable technique to improve interoperability. Test and compare the performance of high precision receivers which use antennas which limit the receive bandwidth to the GNSS band.
3.4.3 Plan Measure representative high precision GPS receivers, capture and store KPI data as a function of LTE signal strength.
Repeat the measurement with a high interference immunity antenna.
3.4.4 Analysis: Compare true position with received values. Plot RMS 3D location errors vs. LTE signal levels for each test frequency with and without high immunity antennas present. Plot availability of augmentation signal vs. signal level.
3.4.5 AssumptionsMSS augmentation signals and RTK augmentation signals can be generated and supplied to the GPS device under test.
Access is available to 3D location error data.
3.4.6 Measurement Test SequencePseudo-code for static measurement of high performance GPS receivers is given belowFor each downlink frequency band (1531, 1550, 1675)For each GPS condition (Open, stressed)MEASURE_KPI_SET()
For each uplink frequency band (1631, 1657)

Roberson and Associates, LLC
16Roberson and Associates, LLC Proprietary
For each GPS condition (Open, stressed)MEASURE_KPI_SET()
Enable MSS Augmentation SignalFor each downlink frequency band (1531, 1550, 1675)For each GPS condition (Open, stressed)MEASURE_KPI_SET()
For each uplink frequency band (1631, 1657)For each GPS condition (Open, stressed)MEASURE_KPI_SET()
Enable RTK Augmentation SignalFor each downlink frequency band (1531, 1550, 1675)For each GPS condition (Open, stressed)MEASURE_KPI_SET()
For each uplink frequency band (1631, 1657)For each GPS condition (Open, stressed)MEASURE_KPI_SET()
Calculate KPI averages and standard deviations for each LTE level
3.4.7 Potential Issues: Augmentation SignalsCertain augmentation signals will likely require cooperation from the manufacturers. GPS signal constellation generators may be able to produce some augmentations signals. Providing an augmentation signal may require a second base unit in addition to the unit being tested.
3.4.8 MSS Augmentation SignalIf a proprietary source of MSS augmentation signal cannot be obtained and installed in time then an alternative is to use available commercial MSS augmentation signals. The schematic below shows how an external antenna can be used to gather GPS and MSS augmentation signals and apply them to a GPS receiver under test in an anechoic chamber. Without a location reference from a GPS signal generator the “true” location will have to be estimated from a long term average under LTE signal “Off” conditions.

Roberson and Associates, LLC
17Roberson and Associates, LLC Proprietary
Figure 8 External GPS plus MSS augmentation signal capture
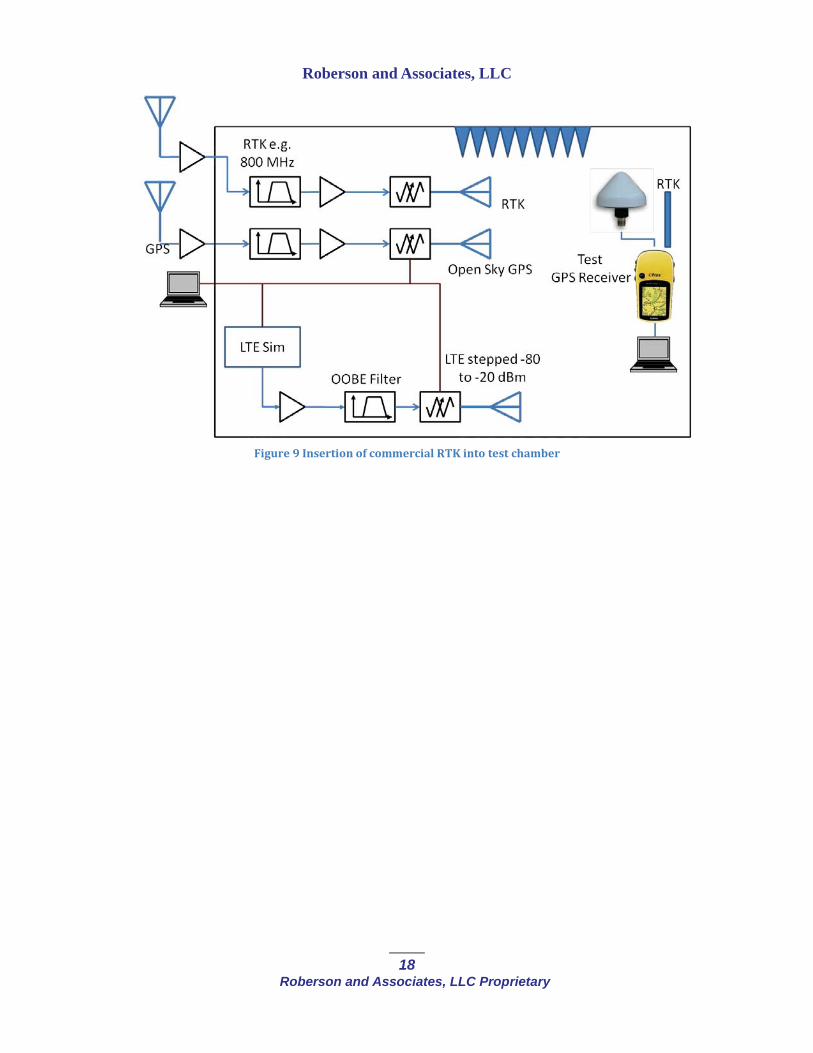
3.4.9 RTK Augmentation SignalCommercial and public RTK correction data is available from many sources. There are statewide networks and commercial networks that make RTK correction data available over cellular internet connections. The schematic below shows a system for gathering commercial cellular RTK correction data from a cellular or other wireless data network for application to the GPS receiver under test. Note the RTK antenna on the GPS receiver.
An alternative would be to use commercial internet based RTK services if possible.
Roberson and Associates, LLC
18Roberson and Associates, LLC Proprietary
Figure 9 Insertion of commercial RTK into test chamber
Roberson and Associates, LLC
19Roberson and Associates, LLC Proprietary
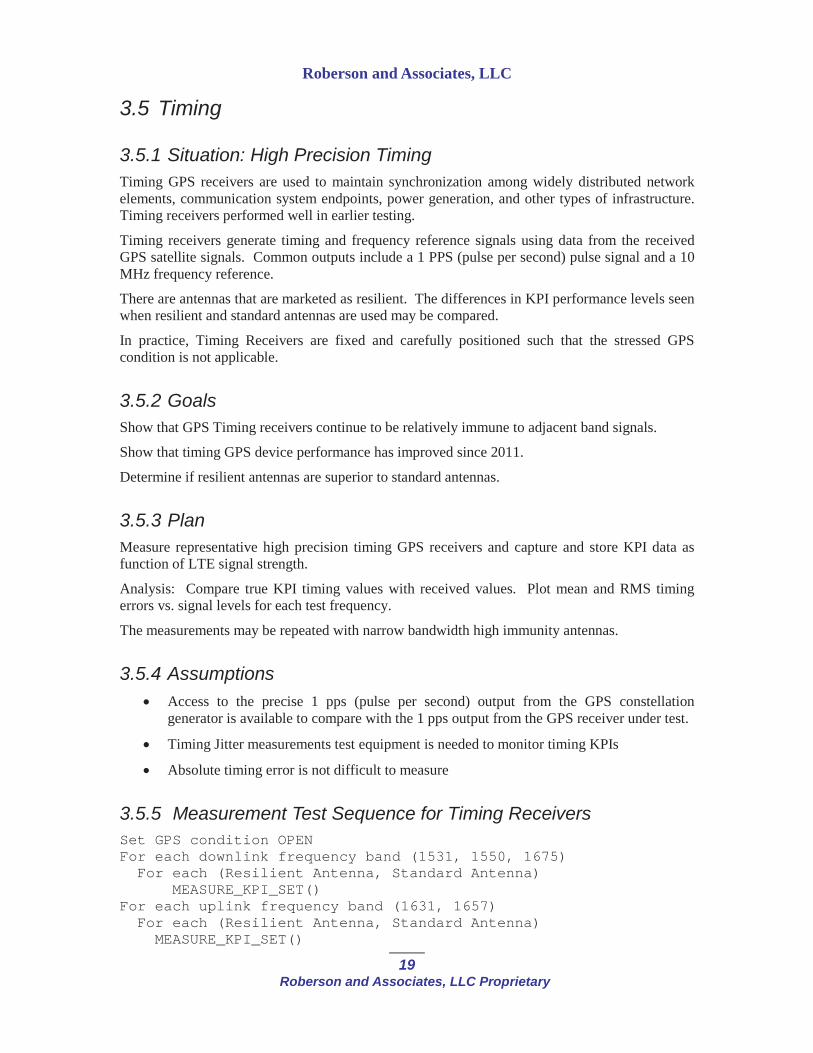
3.5 Timing
3.5.1 Situation: High Precision Timing Timing GPS receivers are used to maintain synchronization among widely distributed network elements, communication system endpoints, power generation, and other types of infrastructure. Timing receivers performed well in earlier testing.
Timing receivers generate timing and frequency reference signals using data from the received GPS satellite signals. Common outputs include a 1 PPS (pulse per second) pulse signal and a 10 MHz frequency reference.
There are antennas that are marketed as resilient. The differences in KPI performance levels seen when resilient and standard antennas are used may be compared.
In practice, Timing Receivers are fixed and carefully positioned such that the stressed GPS condition is not applicable.
3.5.2 GoalsShow that GPS Timing receivers continue to be relatively immune to adjacent band signals.
Show that timing GPS device performance has improved since 2011.
Determine if resilient antennas are superior to standard antennas.
3.5.3 Plan Measure representative high precision timing GPS receivers and capture and store KPI data as function of LTE signal strength.
Analysis: Compare true KPI timing values with received values. Plot mean and RMS timing errors vs. signal levels for each test frequency.
The measurements may be repeated with narrow bandwidth high immunity antennas.
3.5.4 AssumptionsAccess to the precise 1 pps (pulse per second) output from the GPS constellation generator is available to compare with the 1 pps output from the GPS receiver under test.
Timing Jitter measurements test equipment is needed to monitor timing KPIs
Absolute timing error is not difficult to measure
3.5.5 Measurement Test Sequence for Timing ReceiversSet GPS condition OPENFor each downlink frequency band (1531, 1550, 1675)For each (Resilient Antenna, Standard Antenna)
MEASURE_KPI_SET()For each uplink frequency band (1631, 1657)For each (Resilient Antenna, Standard Antenna)MEASURE_KPI_SET()
Roberson and Associates, LLC
20Roberson and Associates, LLC Proprietary
Calculate KPI averages and standard deviations for each LTE level
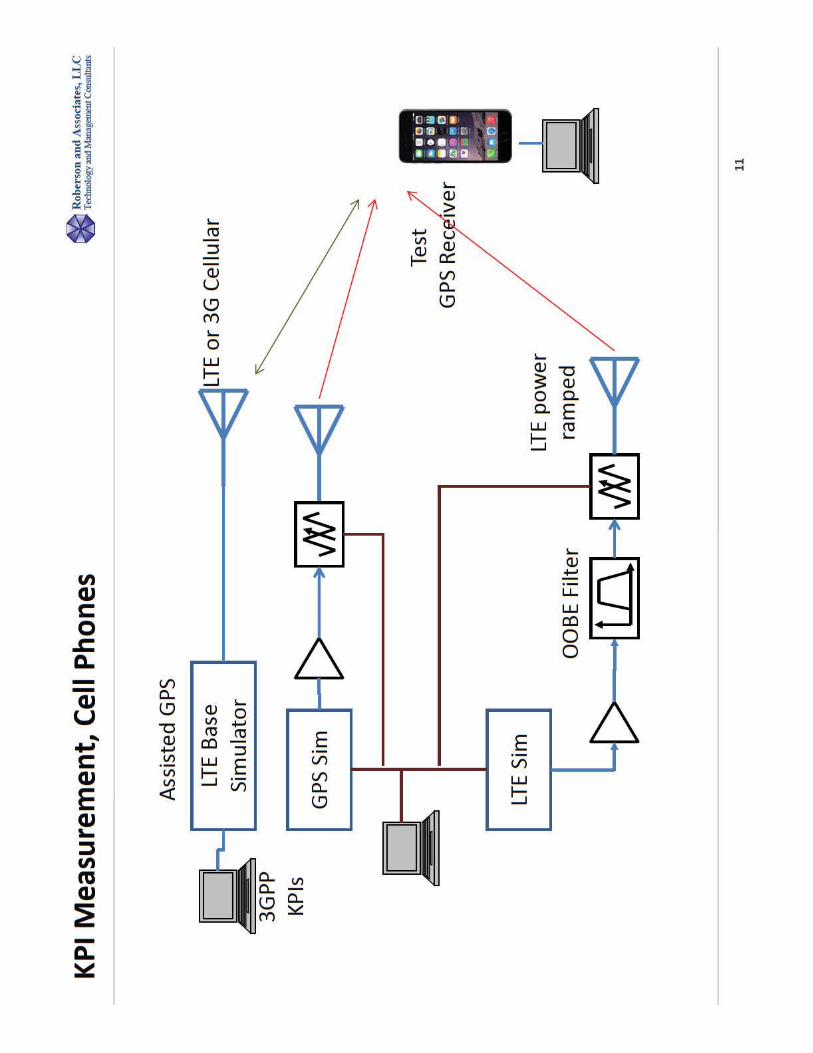
3.6 Cellular Device Measurements
3.6.1 Cellular Device SituationCellular devices and smart phones have rapid replacement cycles. Smart-phones are very commonly used for mapping, location, and navigation based on embedded GPS receivers as well as network provided location information. Today's best selling devices were not marketed in 2011. GLONASS capability is now included in high volume GPS chipsets and this capability may have resulted in different RF front end filter characteristics for the embedded GNSS receiver in Cellular devices.
3.6.2 Desired GoalsCharacterize the performance of the latest, high sales volume cellular devices to update the performance baseline.
3.6.3 Plan Measure only the high sales volume devices and capture and store KPI data as function of LTE signal strength.
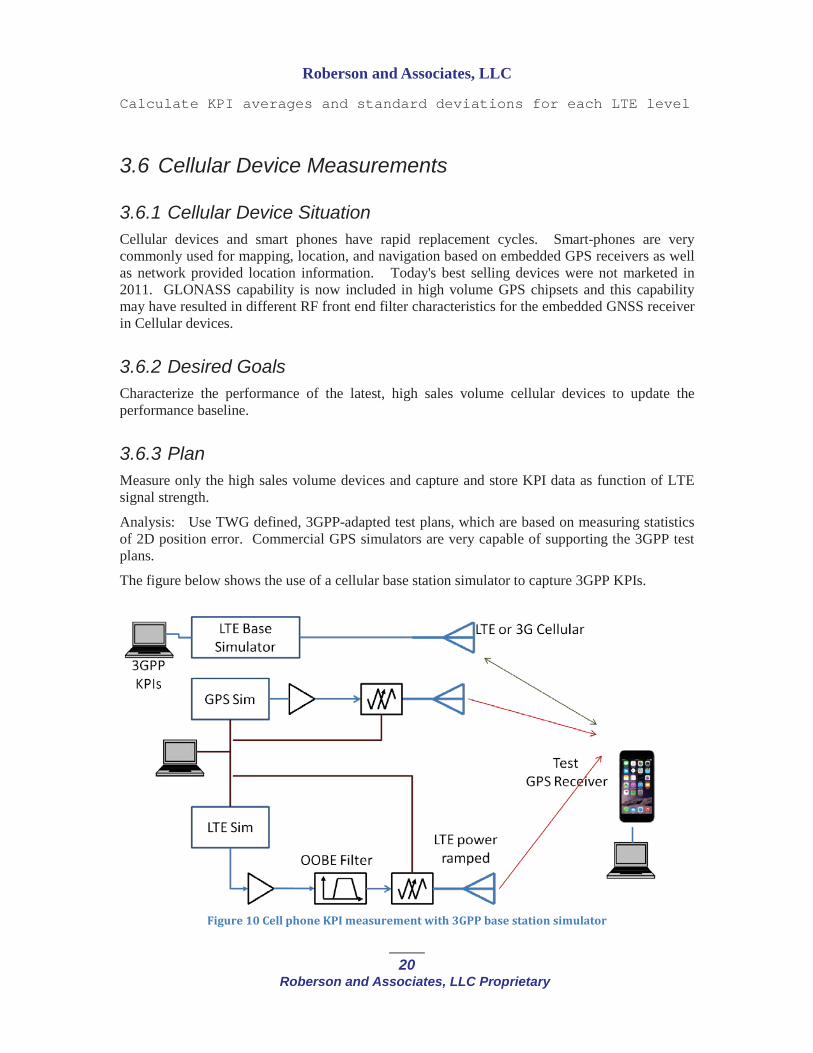
Analysis: Use TWG defined, 3GPP-adapted test plans, which are based on measuring statistics of 2D position error. Commercial GPS simulators are very capable of supporting the 3GPP test plans.
The figure below shows the use of a cellular base station simulator to capture 3GPP KPIs.
Figure 10 Cell phone KPI measurement with 3GPP base station simulator
Roberson and Associates, LLC
21Roberson and Associates, LLC Proprietary
3.6.4 AssumptionsGLONASS reception will not be tested but GLONASS signals may be generated depending on equipment availability.
Access to KPIs or NMEA sequences is available and exportable to an external logging system.
3.6.5 Measurement SequenceA pseudo-code description of the cellular device measurement sequence is listed below. For each downlink frequency band (1531, 1550, 1675)For each GPS condition (Open, stressed)MEASURE_KPI_SET()
For each uplink frequency band (1631, 1657)For each GPS condition (Open, stressed)MEASURE_KPI_SET()
Calculate KPI averages and standard deviations for each LTE level

Roberson and Associates, LLC
22Roberson and Associates, LLC Proprietary
3.7 General Navigation Device Measurements
3.7.1 General Navigation SituationIn prior testing, General Navigation GPS device were tested with LTE signal levels as high as -15 dBm, a level extremely unlikely to be encountered in a user scenario. The present tests will limit the maximum received power to -20 dBm.
3.7.2 Desired GoalsCharacterize the KPI performance of the latest, high sales volume general navigation GPS devices.
3.7.3 Plan Measure only the high sales volume devices and capture and store detailed KPI data as function of LTE signal strength.
3.7.4 AssumptionsAccess to KPIs or NMEA sequences is available and exportable to an external logging system.
3.7.5 Measurement SequenceA pseudo-code description of the cellular device measurement sequence is listed below. For each downlink frequency band (1531, 1550, 1675)For each GPS condition (Open, stressed) MEASURE_KPI_SET()
For each uplink frequency band (1631, 1657)For each GPS condition (Open, stressed)MEASURE_KPI_SET()
Calculate KPI averages and standard deviations for each LTE level
Roberson and Associates, LLC
23Roberson and Associates, LLC Proprietary
4 TTFF AND REACQUISITION TESTINGTime to First Fix is a very important KPI for users who transition in and out of GPS coverage and simultaneously in and out of LTE coverage. For example, a public safety user exiting a building could be exposed to a strong LTE signal at the same time the GPS receiver in his two-way radiois re-acquiring GPS signals. The presence of strong adjacent band signals may increase the TTFF. TTFF is tested under cold-start and warm-start conditions which refer to how much information the GPS receiver already possesses about the satellites and the GPS system time.
The goal of TTFF testing is to determine and quantify differences in TTFF as a function of the presence of LTE adjacent band signals and the absence of these signals. The LTE signal levels will be selected to fall in a range above and below the level where significant position errors were observed. The reason for this is to conserve test time in part because TTFF may take several minutes in cold-start mode.
Re-acquisition refers to the situation where lock is lost and the GPS receiver tracking loops need to re-lock onto the GPs signal. If the outage is brief then re-acquiring satellite lock is also rapid.
To test re-acquisition the LTE signal needs to be applied at the level where loss of lock was observed.
4.1.1 AssumptionsAll devices can be reset to a known cold-start state prior to each TTFF measurement.
Access to a lock indicator is available to be able to determine when the GPS receiver has achieved lock.
4.1.2 TTFF PlanApply LTE signals and power up the GPS receiver. Record the time until LOCK is indicated. Reset the GPS receiver and repeat N times.
Calculate average TTFF vs. LTE power for a small set of LTE powers. The figure below illustrates the TTFF measurement sequence.

Roberson and Associates, LLC
24Roberson and Associates, LLC Proprietary
Figure 11 TTFF measurement sequence
Like position error, TTFF will also be subject to random variations from one measurement to another. For each choice of LTE power level, including no LTE signal, a set of TTFF values will be collected. These will be subjected to statistical analysis to determine KPI impact of the LTE signal.
Re-acquisition data may be available from the ramped LTE power tests used to capture position KPI data if the devices loose LOCK at the higher LTE power levels. The LTE power levels where LOCK is lost and the power level where LOCK is regained will be available.
5 ANALYSIS At each LTE power level many KPI data samples will be collected. The mean and standard deviation of each KPI will be calculated for each power level sample set and logged in one of the KPI, TTFF, or Timing Test Data Tables.
Raw NMEA and other data from GPS devices will be stored in the format it is received in. It is likely that the formats will be different for each device.
Relative changes in the RMS KPI error will be the measure of interference used in later work.
5.1 Statistical AnalysisIn order to translate the KPI vs. LTE signal level statistics collected in the measurements to a probability of harmful interference, an analysis is needed to determine the likelihood, frequency, and expected duration that a user will experience LTE levels that cause an increase in KPI standard deviation. Data is available from existing LTE networks that can be used to develop a statistical model for LTE signal levels on the ground. Scenarios can be developed for the typical movements of a user within the coverage area of an LTE network. Combining these statistics and
Roberson and Associates, LLC
25Roberson and Associates, LLC Proprietary
scenarios with the KPI sensitivities to LTE signal strength will produce a picture of how often and how much the presence of the LTE network will impact users.
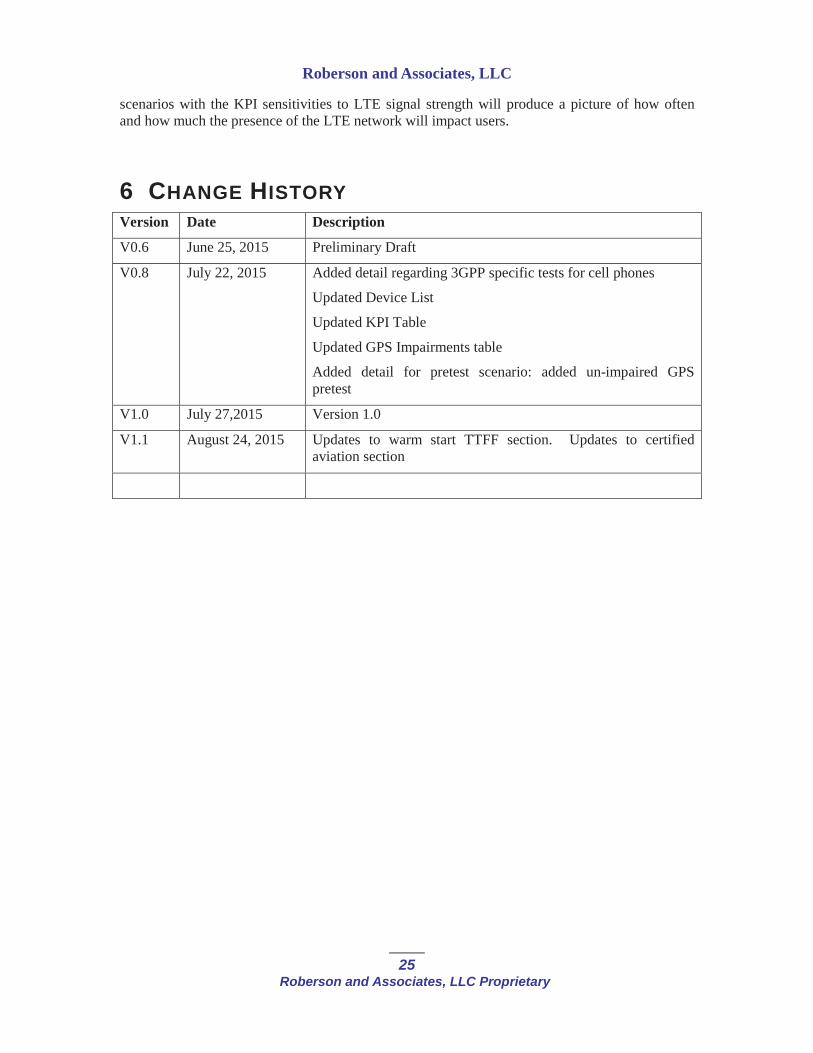
6 CHANGE HISTORYVersion Date Description
V0.6 June 25, 2015 Preliminary Draft
V0.8 July 22, 2015 Added detail regarding 3GPP specific tests for cell phones
Updated Device List
Updated KPI Table
Updated GPS Impairments table
Added detail for pretest scenario: added un-impaired GPSpretest
V1.0 July 27,2015 Version 1.0
V1.1 August 24, 2015 Updates to warm start TTFF section. Updates to certified aviation section

2
R
ober
son
and
Ass
ocia
tes,
LL
C
T
echn
olog
y an
d M
anag
emen
t Con
sulta
nts
GPS
and
Ligh
tSqu
ared
ATC
Com
patib
ility
Ana
lysi
s: O
verv
iew
• W
hy U
pdat
ed C
ompa
tibili
ty A
naly
sis i
s Nec
essa
ry
• Kno
wle
dge
Gain
ed fr
om 2
011
TWG
• Und
erst
andi
ng o
f GPS
LTE
Susc
eptib
ility
and
Com
patib
ility
Sol
utio
ns
• Mea
sure
GPS
rece
iver
ove
rload
thre
shol
ds b
ased
on
KPI d
egra
datio
n, n
ot ju
st 1
dB
C/N
0 •R
evis
ed L
ight
Squa
red
LTE
Depl
oym
ent P
lan:
Fre
quen
cy B
ands
and
LTE
Pow
er
•Pro
gres
s in
GPS
Rec
eive
r Des
ign
• Ke
y El
emen
ts o
f 201
5 Co
mpa
tibili
ty A
naly
sis A
ppro
ach
• Rad
iate
d RF
Mea
sure
men
ts o
f Key
GPS
Dev
ices
’ Sus
cept
ibili
ty to
LTE
Emis
sion
s
• Ide
ntifi
catio
n of
LTE
“Thr
esho
ld o
f Har
m”
Leve
l Bas
ed o
n G
PS S
ervi
ce (U
ser)
Impa
ct
• Sta
tistic
al A
naly
sis o
f Geo
grap
hic
and
Tem
pora
l Im
pact
to G
PS in
LTE
Envi
ronm
ent
• Ide
ntifi
catio
n of
Cha
ract
eris
tics o
f GPS
Dev
ices
Com
patib
le w
ith L
Sq A
TC
• Ide
ntifi
catio
n of
Com
patib
ility
Sol
utio
ns fo
r GPS
Dev
ices
Not
Cur
rent
ly C
ompa
tible

3
R
ober
son
and
Ass
ocia
tes,
LL
C
T
echn
olog
y an
d M
anag
emen
t Con
sulta
nts
GNSS
Spe
ctru
m N
eigh
borh
ood
The
spec
trum
155
9 –
1610
MHz
is a
lloca
ted
for G
NSS
serv
ice
on g
loba
l bas
is Th
ere
are
4 m
ajor
GN
SS sy
stem
s tha
t sha
re th
e sp
ectr
um.
Thes
e sy
stem
s use
spec
tral
sepa
ratio
n as
wel
l as c
oord
inat
ed si
gnal
ove
rlay
that
allo
w fo
r fut
ure
com
patib
ility
of d
evic
es th
at le
vera
ge th
ese
diffe
rent
GN
SS c
onst
ella
tions
. As
show
n in
the
figur
e ab
ove,
GLO
NAS
S sig
nals
resid
e cl
oser
to th
e Li
ghtS
quar
ed u
plin
ks. L
ikew
ise, b
oth
BeiD
ou a
nd G
alile
o ar
e th
e lo
wer
end
of
the
GNSS
ban
d br
ingi
ng th
em c
lose
r to
the
Ligh
tSqu
ared
dow
nlin
k sp
ectr
um


6
R
ober
son
and
Ass
ocia
tes,
LL
C
T
echn
olog
y an
d M
anag
emen
t Con
sulta
nts
GPS
Sign
al C
onst
ella
tions
•
For P
reci
sion
Dev
ices
with
Aug
men
tatio
n, li
ve sk
y da
ta w
ill b
e us
ed a
nd n
o im
pairm
ents
w
ill b
e ad
ded.
•
Test
s util
izin
g a
sim
ulat
or m
ay h
ave
Impa
irmen
ts a
dded
up
to th
e va
lues
in th
e ta
ble.
•
Impa
irmen
ts d
eter
min
ed fr
om “
GLO
BAL
Posi
tioni
ng S
yste
m S
tand
ard
Posi
tioni
ng S
ervi
ce
Perf
orm
ance
Sta
ndar
d” 4
th E
ditio
n, F
rom
GPS
DIR
ECTO
RATE
; Pag
e 65
and
108
. •
A ve
ry c
onse
rvat
ive
ZERO
Age
of D
ata
is u
sed
•95
% e
rror
is co
nver
ted
to 5
0% (m
ean)
err
or u
sing
Circ
ular
Err
or P
roba
bilit
y •
(CEP
50 u
sing
Ray
leig
h di
strib
utio
n w
ith sa
me
sigm
a pa
ram
eter
)
zero
AO
D, 9
5% E
rror
C
EP50
(val
ues u
sed)
Cl
ock
Stab
ility
0
0 Gr
oup
Dela
y St
abili
ty
3.1
1.49
11
Oth
er S
pace
Seg
men
t Err
ors
1 0.
481
Cloc
k/Ep
hem
eris
Estim
atio
n 2
0.96
2 Cl
ock/
Ephe
mer
is Cu
rve
0.8
0.38
48
Iono
sphe
ric D
elay
9.
8 - 1
9.6
(14.
7)
7.07
07
Grou
p De
lay
Tim
e
4.5
2.16
45
Oth
er C
ontr
ol S
egm
ent E
rror
s 1
0.48
1 Tr
opos
pher
ic D
elay
3.
9 1.
8759
Re
ceiv
er N
oise
2.
9 1.
3949
M
ultip
ath
0.2
0.09
62
Oth
er U
ser S
egm
ent E
rror
s 1
0.48
1 95
% S
yste
m U
ERE
12.7
- 21
.2 (1
6.65
) CE
P50
8.00
9047
212
g95
%Sy
stem
UER
E12
721
2(1
665
)

7
R
ober
son
and
Ass
ocia
tes,
LL
C
T
echn
olog
y an
d M
anag
emen
t Con
sulta
nts
Devi
ce L
ist (
Subj
ect t
o Av
aila
bilit
y)
Avia
tion
(cer
tifie
d)G
arm
in G
TN 6
25A
vidyn
e IF
D 4
40Av
iatio
n (n
on-c
ertif
ied)
Gar
min
GPS
MA
P 69
6G
arm
in ae
ra 5
10Ce
llula
rG
arm
in N
uvi 2
597L
MT
Gar
min
Nuv
i 55L
MTo
mTo
m V
IA 1
515M
Al p
ine In
-Das
h X
008U
Gar
min
GPS
MA
P 76
CSx
Gar
min
eTre
x H
Gar
min
Nuv
i 249
5LM
TTo
mTo
m G
o 50
S/60
SG
arm
in/Pa
naso
nic U
conn
ect 8
.4N
RB5
Mot
orol
a A
PX 7
000
Mot
orol
a M
W81
0Pi
onee
r AV
IC-5
100N
EXH
arm
an T
oyot
a En
tune
861
40-0
2050
Bo
sch
in-da
sh N
issan
259
15C
J0A
Gar
min
GPS
MA
P 78
SC
Gar
min
Mon
tana
650
tM
agell
an E
xplo
rist 3
50H
Bush
nell O
nix 4
00 W
ater
proo
f Hik
ing G
PSFu
runo
GP3
2W
abte
k C
omm
link
II or
Nav
igatio
n Se
nsor
Mod
ule
Gen
eral
loca
tion
and
navi
gatio
nA
pple
iPho
ne 5
sA
pple
iPho
ne 6
Sam
sung
Gala
xy S
5Sa
msu
ng G
alaxy
S6
iPad
(w/c
ellula
r dat
a)Sa
msu
ng G
alaxy
Tab
4G
LTE
High
pre
cisi
onD
eere
Sta
rfire
300
0 (0
907P
C, 1
010,
201
0 an
d 78
00)
Nov
Ate
l Sm
art6
or S
mar
t6-L
Topc
on S
GR-1
Topc
on S
yste
m 3
10Tr
imbl
e A
gGPS
542
Trim
ble
5800
NA
VC
OM
SF-
3050
Trim
ble
Geo
7x
Trim
ble
Net
R9
Trim
ble
R8Tr
imbl
e TM
3000
Trim
ble
SPS8
55 G
NSS
Rec
eiver
Trim
ble
SPS9
85 A
nten
naTo
pcon
HiP
er A
G (V
)Ti
min
gA
rbite
r 108
8B G
PS S
atell
ite C
lock
(40n
s)S y
mm
etric
om 5
8540
A

8
R
ober
son
and
Ass
ocia
tes,
LL
C
T
echn
olog
y an
d M
anag
emen
t Con
sulta
nts
Ante
nnas
The
timin
g an
d hi
gh p
reci
sion
cat
egor
ies u
se e
xter
nal
ante
nnas
. Pe
rfor
man
ce b
etw
een
Stan
dard
and
“I
nter
fere
nce
Resi
lient
” an
tenn
as w
ill b
e co
mpa
red.
Ven
dor
Cla
ssM
odel
PCTe
lM
obile
3915
D-H
RPC
Tel
Mob
ile81
71D
-HR
PCTe
lTi
min
g G
PS-T
MG
-HR
-26N
Aer
oAnt
enna
Tec
hnol
ogy
Avi
atio
nA
eroA
nten
na A
T575
-93
Nov
atel
Prec
ision
/ M
arin
eG
PS-7
13-G
GG
-NJa
vad
(LSQ
Pro
vide
d)H
igh
Prec
ision
N/A


14
R
ober
son
and
Ass
ocia
tes,
LL
C
T
echn
olog
y an
d M
anag
emen
t Con
sulta
nts
Exam
ple
3GPP
KPI
from
3GP
P TS
37.
571-
1


16
R
ober
son
and
Ass
ocia
tes,
LL
C
T
echn
olog
y an
d M
anag
emen
t Con
sulta
nts
GPS
Com
patib
ility
with
LTE
: Con
text
Recommended