1
00/2014
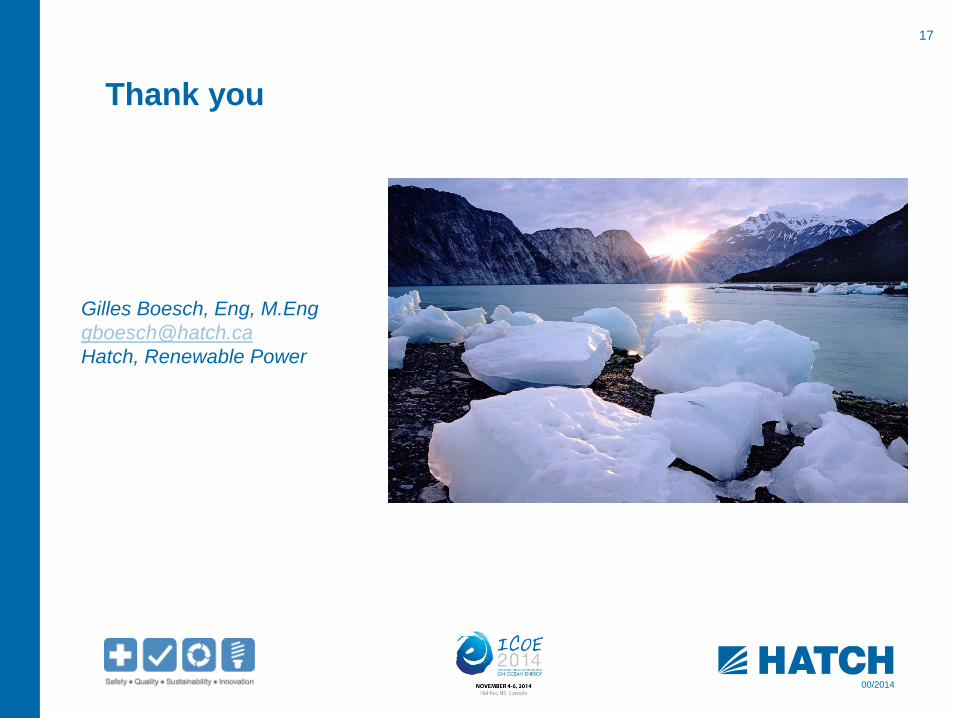
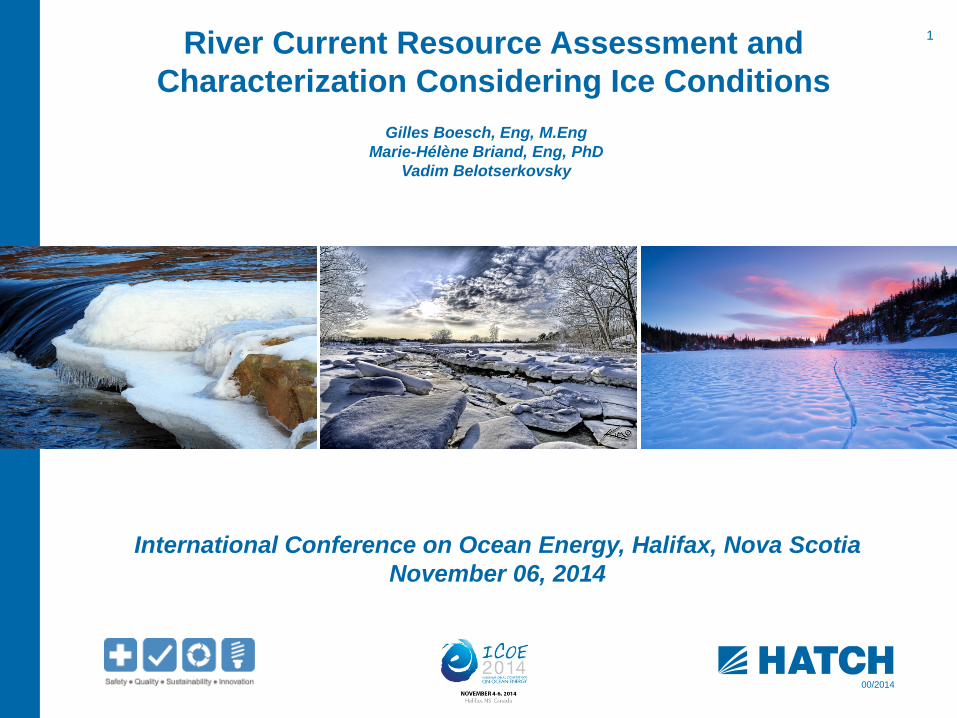
River Current Resource Assessment and Characterization Considering Ice Conditions
International Conference on Ocean Energy, Halifax, Nova Scotia November 06, 2014
Gilles Boesch, Eng, M.Eng Marie-Hélène Briand, Eng, PhD
Vadim Belotserkovsky
2
00/2014
Overview
• Background • Part 1: Ice-free aspects
– Reconnaissance Study (Stage 1) – Pre and Full Feasibility Study (Stage 2A and 2B) – Layout Design (Stage 3)
• Part 2: Ice Processes and Impacts on Resource Assessment – Ice characteristics (frazil, ice cover, ice jam…) – Impacts on the Resource for all Stages
3
00/2014
Background
• 120 TWh/yr of technically recoverable energy in the continental US1
• 750 GW of total hydrokinetic power in Canada2
• No standards currently exist for River Current Resource Assessments
• Accelerate the development of technical guidelines • Present guidelines using the terminology from IEC62600-201
(“Tidal Energy Resource Assessment and Characterization”) • Integrate aspects related to ice impacts for Northern climate
applications
1 EPRI, Assessment and Mapping of the Riverine Hydrokinetic Resource in the Continental United States 2 NRC, Assessment of Canada’s Hydrokinetic Power Potential
4
00/2014
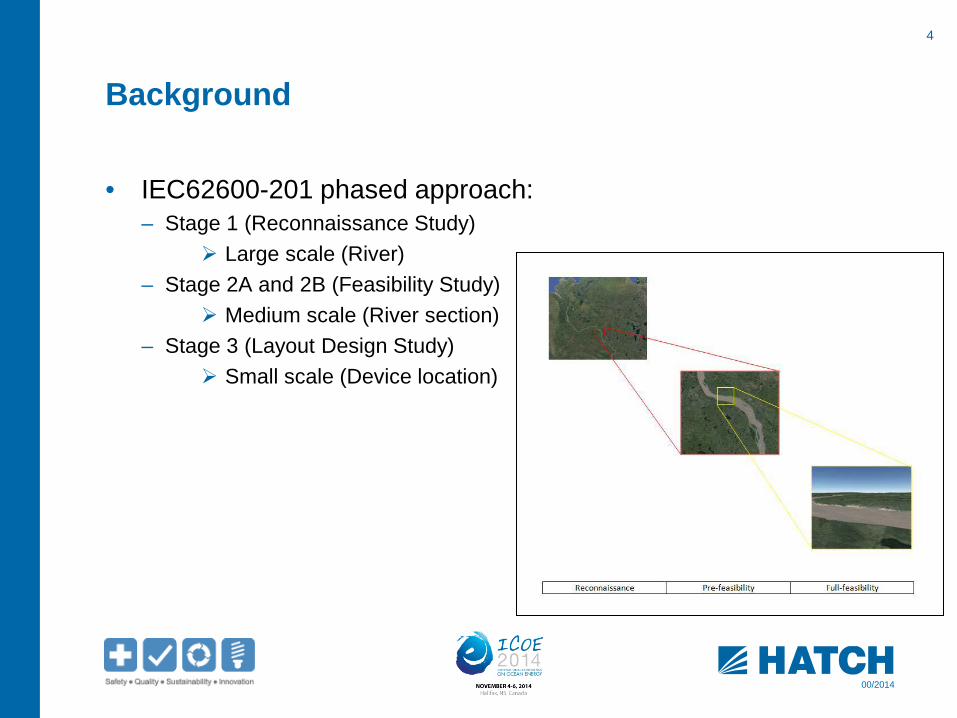
Background
• IEC62600-201 phased approach: – Stage 1 (Reconnaissance Study)
Large scale (River) – Stage 2A and 2B (Feasibility Study)
Medium scale (River section) – Stage 3 (Layout Design Study)
Small scale (Device location)
5
00/2014
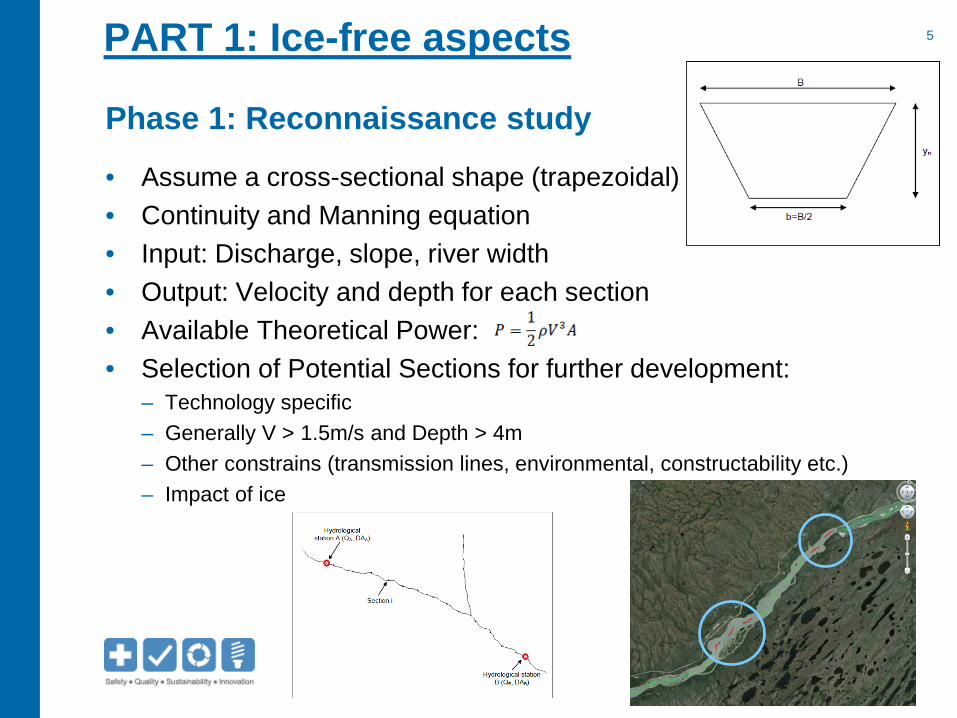
Phase 1: Reconnaissance study • Assume a cross-sectional shape (trapezoidal) • Continuity and Manning equation • Input: Discharge, slope, river width • Output: Velocity and depth for each section • Available Theoretical Power: • Selection of Potential Sections for further development:
– Technology specific – Generally V > 1.5m/s and Depth > 4m – Other constrains (transmission lines, environmental, constructability etc.) – Impact of ice
PART 1: Ice-free aspects
6
00/2014
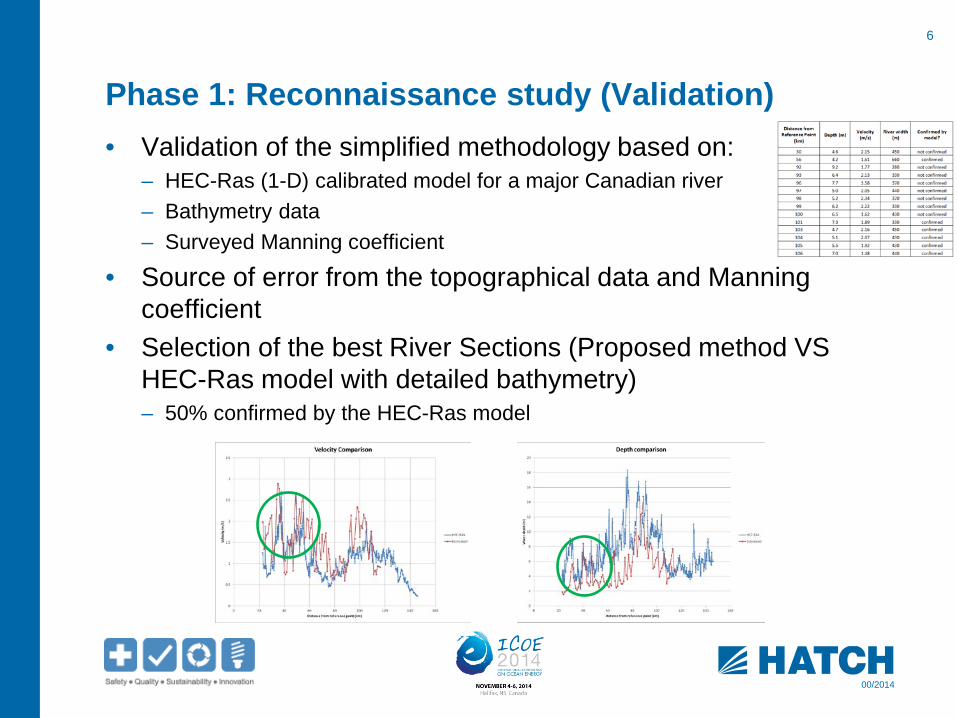
Phase 1: Reconnaissance study (Validation) • Validation of the simplified methodology based on:
– HEC-Ras (1-D) calibrated model for a major Canadian river – Bathymetry data – Surveyed Manning coefficient
• Source of error from the topographical data and Manning coefficient
• Selection of the best River Sections (Proposed method VS HEC-Ras model with detailed bathymetry) – 50% confirmed by the HEC-Ras model
7
00/2014
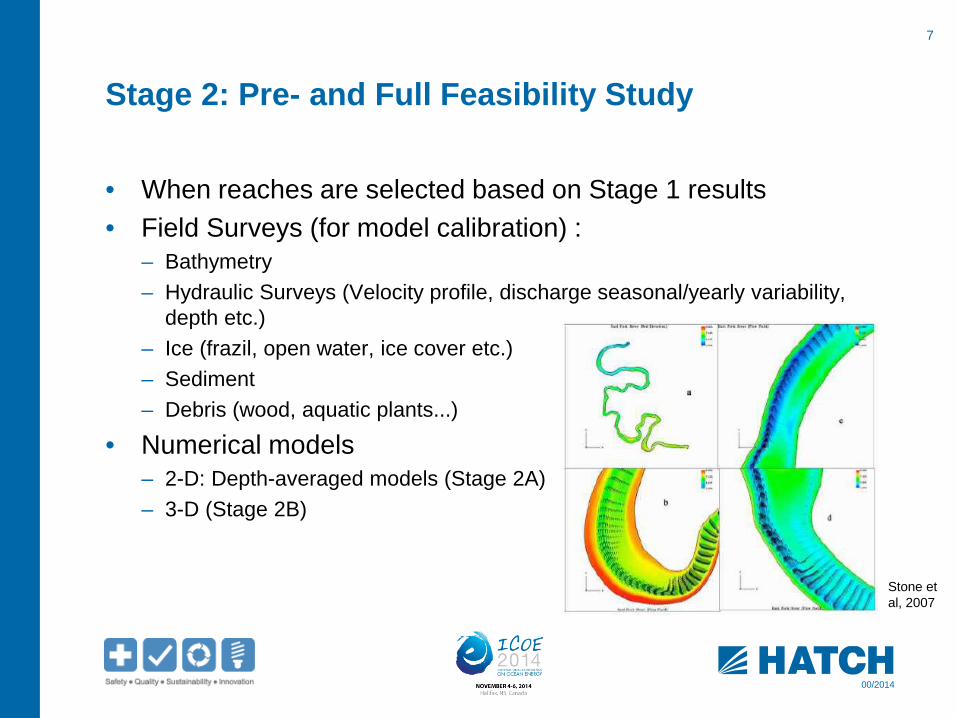
Stage 2: Pre- and Full Feasibility Study
• When reaches are selected based on Stage 1 results • Field Surveys (for model calibration) :
– Bathymetry – Hydraulic Surveys (Velocity profile, discharge seasonal/yearly variability,
depth etc.) – Ice (frazil, open water, ice cover etc.) – Sediment – Debris (wood, aquatic plants...)
• Numerical models – 2-D: Depth-averaged models (Stage 2A) – 3-D (Stage 2B)
Stone et al, 2007
8
00/2014
Stage 3: Layout Design
• Project optimization (type/number of devices, location) • Turbulence considerations (loads on turbines, energy
extraction) • Net Energy Predictions
– Turbine Power Curve – Losses Assessment (wake effects, unavailability, electrical losses etc.)
• Uncertainty Analysis and probability of exceedence (P50, P90, P99)
9
00/2014
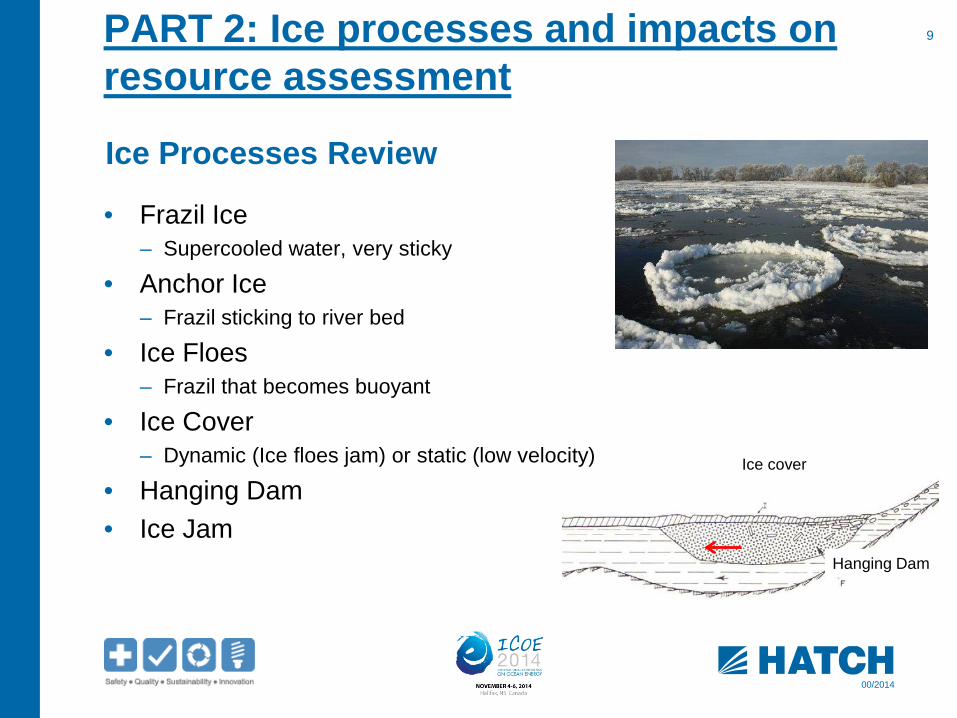
Ice Processes Review
• Frazil Ice – Supercooled water, very sticky
• Anchor Ice – Frazil sticking to river bed
• Ice Floes – Frazil that becomes buoyant
• Ice Cover – Dynamic (Ice floes jam) or static (low velocity)
• Hanging Dam • Ice Jam
PART 2: Ice processes and impacts on resource assessment
Hanging Dam
Ice cover

10
00/2014
Stage 1: Reconnaissance Study
• Frazil – In turbulent supercooled water (-0.01degC) – Very sticky in active mode – Visual Approach (detection of rapids) – High Froude number (high turbulence)
Rapids

11
00/2014
Stage 1: Reconnaissance Study
• Ice cover: – Progression
• Critical Froude number = 0.154(1-pj) (Prowse, 1996) • Fr < Frc Ice cover progression • Fr > Frc Underturning of drifting floes
Can create Hanging Dams Open Water with high Froude number upstream Frazil Ice
– Hydraulic Impact:
• Additional roughness • Composite Manning coefficient
12
00/2014
Stage 1: Reconnaissance Study
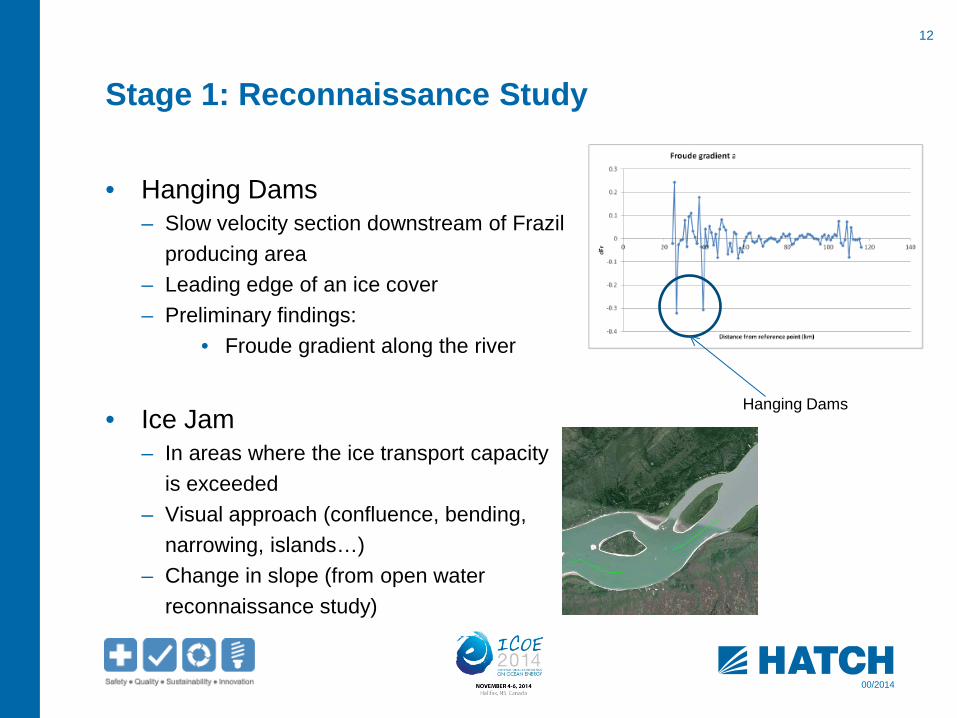
• Hanging Dams – Slow velocity section downstream of Frazil producing area – Leading edge of an ice cover – Preliminary findings:
• Froude gradient along the river
• Ice Jam
– In areas where the ice transport capacity is exceeded – Visual approach (confluence, bending, narrowing, islands…) – Change in slope (from open water reconnaissance study)
Hanging Dams
13
00/2014
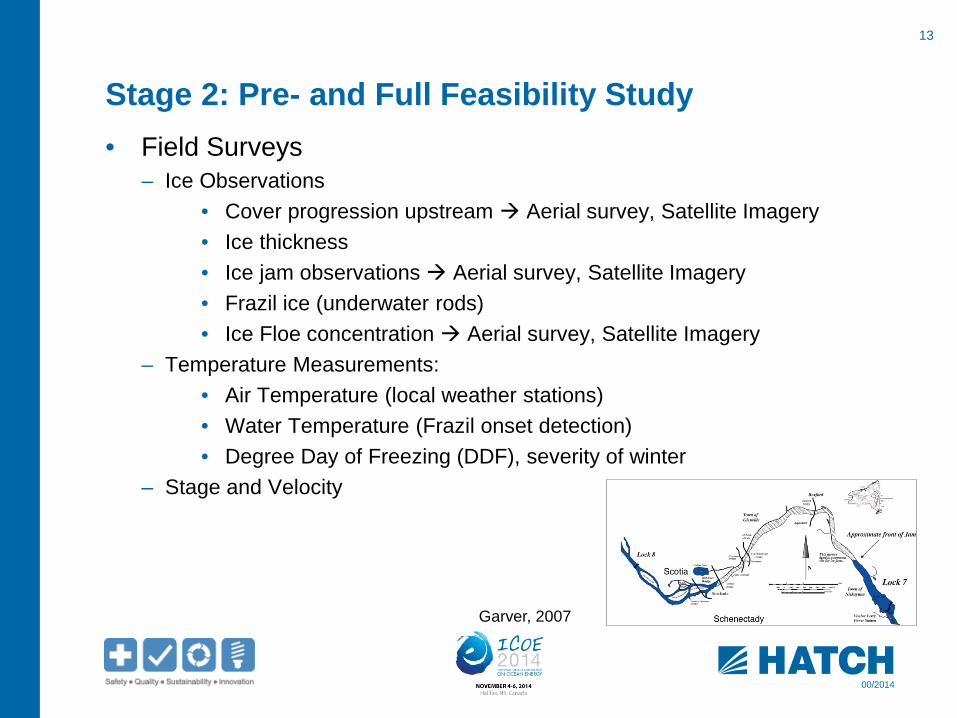
Stage 2: Pre- and Full Feasibility Study • Field Surveys
– Ice Observations • Cover progression upstream Aerial survey, Satellite Imagery • Ice thickness • Ice jam observations Aerial survey, Satellite Imagery • Frazil ice (underwater rods) • Ice Floe concentration Aerial survey, Satellite Imagery
– Temperature Measurements: • Air Temperature (local weather stations) • Water Temperature (Frazil onset detection) • Degree Day of Freezing (DDF), severity of winter
– Stage and Velocity
Garver, 2007
14
00/2014
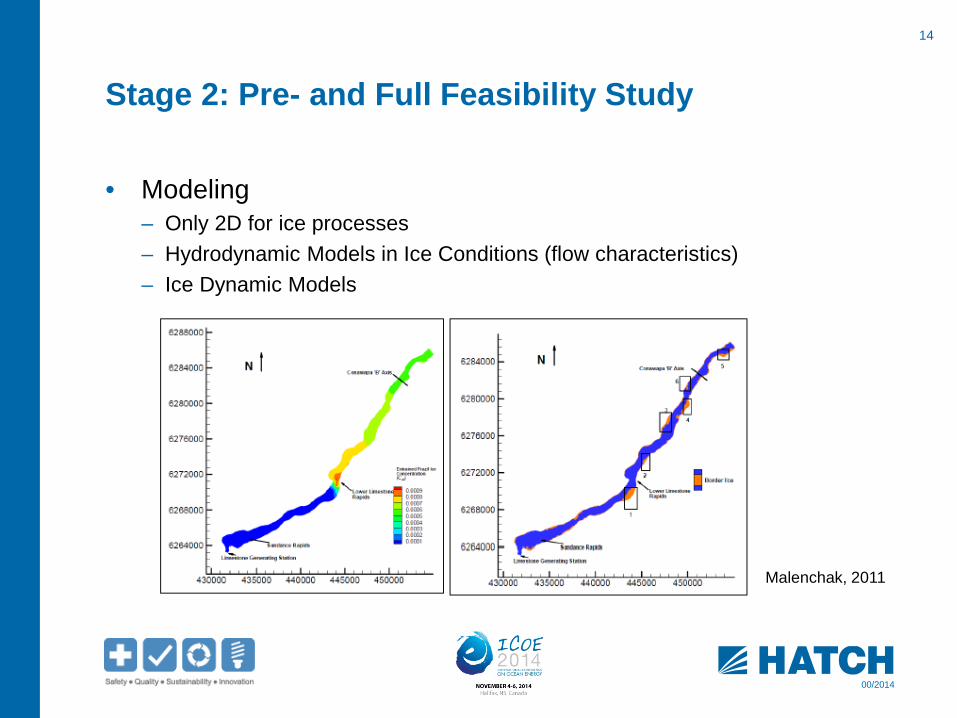
Stage 2: Pre- and Full Feasibility Study
• Modeling – Only 2D for ice processes – Hydrodynamic Models in Ice Conditions (flow characteristics) – Ice Dynamic Models
Malenchak, 2011
15
00/2014
Stage 3: Layout Design
• Avoid areas with frazil, ice jam or hanging dams • Support the additional loads due to ice impacts • Lower availability in ice conditions • Collaborative effort with turbine manufacturer

16
00/2014
Conclusion
• Resource Assessment process • Complex in Ice Conditions • Phased approach:
– Early detection of fatal flaws – Easier monitoring planning
• Further Developments: – Validation of Froude number to detect frazil, ice floes or hanging dams – Numerical model validation (ice) – Field surveys – Energy losses due to ice – Ice Mitigation means
Recommended