Page 1 of 16
Reversalmodeinstabilityandmagnetoresistanceinperpendicular(Co/Pd)/Cu/(Co/Ni)pseudo‐spin‐valves
J. E. Davies1,*, D. A. Gilbert2, S. M. Mohseni3,4, R. K. Dumas5, J. Åkerman3,4,5 and Kai Liu2,*
1NVE Corporation, Eden Prairie, MN 55344
2Physics Department, University of California, Davis, CA 95616 3Materials Physics, School of ICT, Royal Institute of Technology (KTH), 164 40 Kista, Sweden
4NanOSC AB, Electrum 205, 164 40 Kista, Sweden 5Department of Physics, University of Gothenburg, 412 96 Gothenburg, Sweden
Abstract
We have observed distinct temperature‐dependent magnetization reversal modes in a
perpendicular (Co/Pd)4/Co/Cu/(Co/Ni)4/Co pseudo‐spin‐valve, which are correlated with spin‐
transport properties. At 300 K, magnetization reversal occurs by vertically correlated domains.
Below 200 K the hysteresis loop becomes bifurcated due to laterally correlated reversal of the
individual stacks. The magnetic configuration change also leads to higher spin disorders and a
significant increase in the giant magnetoresistance effect. First order reversal curve
measurements reveal that the coupled state can be re‐established through field cycling, and
allow direct determination of the interlayer coupling strength as a function of temperature.
PACS: 75.60._d, 75.70.Kw, 75.30.Kz, 75.70.Cn

Page 2 of 16
Giant magnetoresistance (GMR) and tunneling magnetoresistance (TMR)‐based magnetic
heterostructures with perpendicular magnetic anisotropy (PMA) attract ever increasing
attention due to their potential use in spin transfer torque (STT) and other spintronic
applications.1–5 A main challenge in developing these devices with PMA materials is that the
optimal non‐magnetic spacer thickness for maximizing the MR is also in a regime where strong
magnetic coupling exists between the ferromagnetic layers at room temperature.6,7 For GMR
pseudo‐spin‐valves (PSVs), thickening the spacer helps to decouple the layers,8 but is often at
the expense of reducing the GMR.9,10 The situation is more extreme in TMR structures as the
tunnel barrier thickness dependence is very sensitive.11,12 In the all‐important thin spacer
regime, the effect of strong interlayer exchange coupling is usually discussed in terms of the
degree of antiferromagnetic coupling across the spacer in zero field, which corresponds to the
spin disorder that gives rise to the high resistance state.13,14
Here we report a strongly temperature‐dependent GMR effect in a (Co/Pd)/ Cu/(Co/Ni)
GMR PSV with a thin Cu spacer (30 Å) and the Co/Pd and Co/Ni ML stacks have two very
different coercivities at all temperatures. Using first order reversal curve (FORC) measurements
we have determined that the GMR temperature‐dependence is caused by the change from
vertically to laterally (i.e. layer‐by‐layer) correlated reversal with decreasing temperature.
Furthermore, we have directly measured the variation of the interlayer exchange coupling
strength.
The PSV in this study was grown by dc‐magnetron sputtering onto silicon wafers with a
2000 Å vapor deposited SiNx buffer layer. The vacuum chamber has a base pressure of 6 x 10‐8

Page 3 of 16
torr, and the Ar gas pressure during sputtering was 3 mtorr. We focus on the following
polycrystalline film stack (thicknesses in Å):
SiNx/Ta (50)/Cu (100)/Pd (100)/[Co (4)/Pd (8)]4/Co (4)/Cu (30)/[Co (2)/Ni (4.5)]4/Co (2)/Pd (25)
The Cu spacer thickness is tuned to generate antiferromagnetic (AF) interlayer exchange
coupling.15,20 Magnetic properties were studied by a superconducting quantum interference
device (SQUID) and a vibrating sample magnetometer (VSM), with applied field normal to the
film plane. Four‐point magneto‐transport measurements were performed on the VSM. In order
to study the magnetization reversal behavior, we have employed a FORC technique, as
described earlier.15–18 After positive saturation, the sample is brought to a reversal field HR, and
the magnetization M(H, HR) is measured as the applied field H increases to positive saturation,
tracing out a FORC. A family of FORCs is measured at different HR to extract a FORC distribution,
R
RR HH
HHMHH
),(
2
1),(
2
, which captures irreversible switching processes.
The major hysteresis loops and GMR at various temperatures are shown in Figs. 1a and 1b,
respectively. At 300 K, along the descending field branch of the major loop, there is a single
abrupt magnetization switching event, corresponding to a nucleation field (HN1) of 0.40 kOe. HN1
decreases monotonically with decreasing temperature. The observation of a single switching
event indicates that both the Co/Ni and Co/Pd stacks are switching simultaneously by a
vertically correlated reversal mechanism. Below T = 200 K (Fig. 1a) a second switching “corner”
emerges at a field (HN2) of ‐0.5 kOe, resulting in bifurcation of the major loop. A significant
decrease in HN1 is also observed. This bifurcation is due to the decoupling of the Co/Ni and
Co/Pd stacks (i.e. laterally correlated reversal). The decoupling becomes more pronounced with
decreasing temperature as HN2 decreases monotonically to ‐0.9 kOe at 50 K. A measurement at

Page 4 of 16
T = 15 K (not shown) shows that HN2 does not substantially decrease below ‐0.9 kOe. Major
loops for individually grown (Co/Ni)4/Co and (Co/Pd)4/Co MLs (Fig. 1a, inset) show the Co/Ni ML
to be magnetically softer and thus always reverses first in the PSV. It is also worth noting that
the individual loops were measured at room temperature and thus the 300 K PSV loop is
obviously not a simple superposition of loops from the two layers.
The change in reversal behavior with temperature also has a pronounced effect on the GMR
(Fig. 1b). At T = 300 K, a 0.3 % GMR is observed, with a gradually varying dependence on
magnetic field. The shape of the GMR curve changes significantly at T = 200 K, with a sharp
peak emerging at H = ±0.5 kOe along the ascending/descending field sweep. As T is further
decreased, the peak center shifts to H = ‐0.7 kOe and GMR increases substantially, reaching 1.6
% at 77 K. The significant GMR enhancement is due to the higher spin disorder associated with
the largely antiparallel alignment of the Co/Ni and Co/Pd stacks. The GMR peaks near HN2 from
the major loop (Fig. 1, vertical dashed line), where the Co/Ni stack is near negative saturation
and the Co/Pd stack is just starting to reverse, and the net magnetization is close to zero.
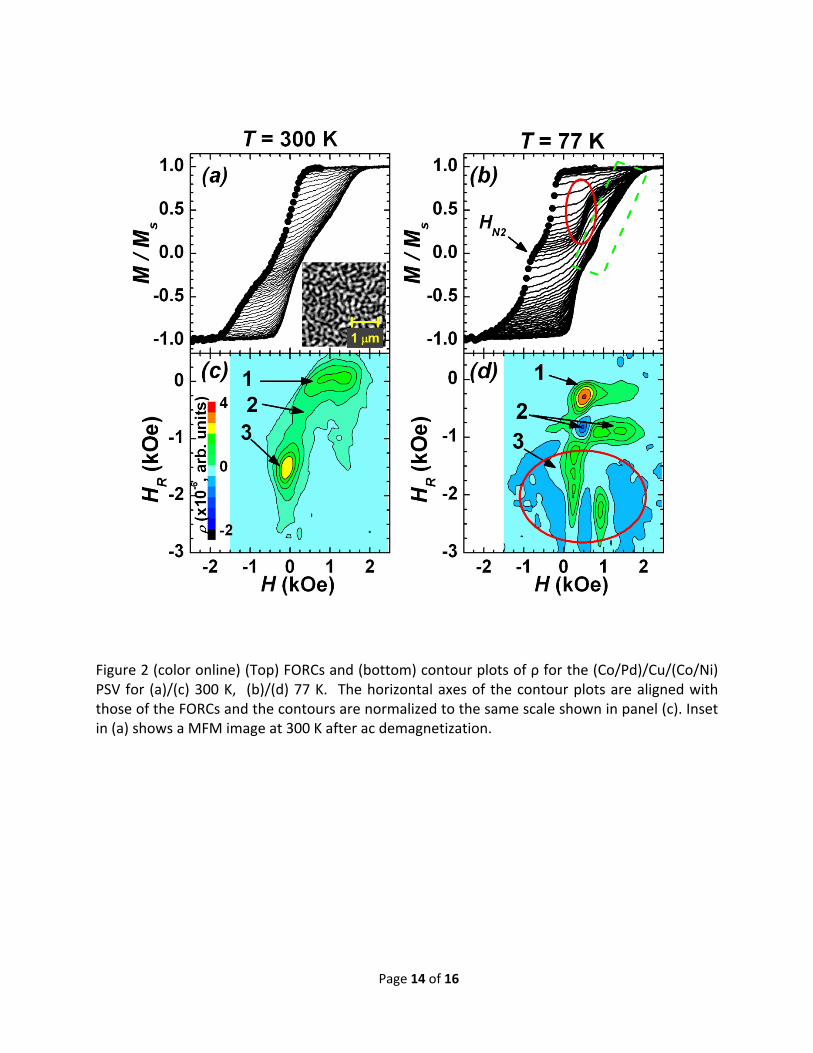
In order to more closely compare the reversal behavior between the vertically and laterally
correlated modes we performed FORC measurements at various temperatures. Fig. 2 shows
the FORC curves (top) and contour plots of ρ (bottom), whose horizontal axes are aligned to
better correlate the key features, at 300 K (left) and 77 K (right). The starting points of the
FORCs delineate the descending branch of the major loop. SQUID‐VSM measurements (not
shown) show the ascending branch to be symmetric. At 300K, the major loop is pinched near
the coercive field (Fig. 2a). The FORC distribution (Fig. 2c) exhibits a horizontal ridge, a plateau
and a negative/positive region as HR is decreased (denoted by areas 1, 2 and 3, respectively).

Page 5 of 16
This pattern is characteristic of vertically correlated reversal by a domain nucleation,
propagation and annihilation process, as previously seen in Co/Pt and (Co/Pt)/Ru systems.17,19,20
This is also supported by a magnetic force microscopy (MFM) study after ac‐demagnetization
(Fig. 2a, inset) showing a labyrinth‐type domain pattern with domain width of ~100 nm.
The FORCs measured at 77 K clearly show the major loop bifurcation (i.e. the laterally
correlated reversal mode) with the second switching “corner“ forming at HN2 = ‐0.9 kOe (Fig.
2b) along the descending branch. With the bifurcation, the FORCs change significantly with a
noticeable grouping around H=0.5 kOe (Fig. 2b, circled region) as the minor loop from the
decoupled magnetization reversal of the Co/Ni ML develops. The change in reversal behavior is
accompanied by a more complex FORC distribution (Fig. 2d), characteristic of the laterally
correlated mode. As HR is decreased from positive saturation the first feature encountered is a
positive peak at HR = ‐0.25 kOe (Fig. 2d, feature 1), due to the Co/Ni reversal. For ‐0.9 kOe < HR
< ‐0.8 kOe, coincident with the onset of Co/Pd reversal, a negative “pit” emerges in the FORC
distribution, followed by a positive horizontal ridge (Fig. 2d, feature 2). In this HR range, the
slope of the successive FORCs decreases near H = 0.5 kOe (Fig. 2b, circled region), leading to the
negative feature, but increases at higher H‐values, resulting in the positive ridge. This is an
indication of a significant change to the vertically correlated reversal mode. Finally, for HR < ‐0.9
kOe ρ becomes a complicated series of two negative/positive features (Fig. 2d, region 3). These
features arise as the vertically correlated mode reverts to the laterally correlated mode. This is
also seen in the FORCs (Fig. 2b, dashed boxed region), and the FORCs protrude outside of the
major loop, a direct consequence of the reversal mode instability.

Page 6 of 16
To better illustrate the crossover between reversal modes, Fig. 3 shows several
representative FORCs at 77 K. The Co/Ni ML reverses at HN2 < HR< HN1. At HR = ‐0.6 kOe the
Co/Ni ML is near negative saturation; the FORC shows an abrupt switching at H = 0.35 kOe,
corresponding to re‐nucleation of reversal domains in the positive field direction (filled
squares). For HR < HN2 the Co/Pd ML undergoes reversal. At HR = ‐1.1 kOe domains are present
in the Co/Pd ML while the Co/Ni ML is saturated. The FORC curvature here has changed
significantly, with the reversal becoming more gradual and no distinct renucleation steps are
present (open squares). When FORCs measured at 300 K at similar HR are superimposed onto
Fig. 3 (dashed lines), the resemblance in both curvature and saturation field to the 77 K FORCs
is striking. This is a clear indication that the vertically correlated mode is reestablished by field
cycling. It is only near complete saturation at HR = ‐3.0 kOe, well beyond the apparent
saturation of the major loop at ‐2.1 kOe, that the FORCs return to the bifurcated and stepped
reversal exhibited by the descending branch of the major loop (filled triangles).
This exotic crossover between vertically and laterally correlated reversal modes with both
temperature and field cycling highlights the delicate balance amongst the magnetostatic
(Edemag), domain wall (Ewall) energies and interlayer exchange coupling (Eex), which is typically AF
at our Cu thickness.15,13,20 The stable state is defined by the difference in total energy between
the laterally and vertically correlated modes. The saturation magnetization (Ms) and the
perpendicular anisotropy (Ku), the parameters which define Edemag and Ewall, have a small effect
on the energy difference. Ms increases by 5 % between 300 K and 77 K based on our
measurements and Ewall is proportional to UK resulting roughly 5 % variation as well based
on literature values.21 Thus, the dominating parameter controlling the reversal process is Eex,

Page 7 of 16
and can be quantified by the exchange energy density, E SJ = H M t , where HE and t are the
exchange field and thickness of the switching magnetic layer, respectively. Values of MS = 775
emu/cm3 and t = 2.8 nm were used based on the measurement of the Co/Ni ML grown
individually (Fig. 1a, inset). We are able to extract HE of the Co/Ni ML for T ≤ 150 K from its
peak position in ρ (Fig. 2d, feature 1), using a coordinate transformation where the local bias
field is given by b RH = H + H 2 .22,23 Values of HE and the corresponding J are shown in Table I,
which increase by a factor of ~ 2.5 from 150 K to 77K.24 It is this strong temperature
dependence that tips the energy balance and leads to the reversal mode crossover. These
values of J are the same order of magnitude as those reported for Co/Cu/Co trilayers.15
We also observe that slight changes to the ML stack structure can destroy the ability to
switch between the modes. This is evidenced in a similar PSV with the only change being the
addition of a Ni/Co bilayer at the Cu spacer on the Co/Pd ML side:
SiNx/Ta(50)/Cu(100)/Pd(100)/[Co(4)/Pd(8)]4/Ni(5)/Co(4)/Cu(30)/[Co(2)/Ni(4.5)]4/Co(2)/Pd(25)
The major loops for this sample (Fig. 4a) show no evidence of bifurcation and maintain the
pinched shape, indicating persistence of the vertically correlated reversal mode at all
temperatures. An MFM micrograph (Fig. 4a, inset) shows that the domain topography and
domain size is similar to the earlier sample (Fig. 2a inset). Additionally, the GMR curves (Fig. 4b)
remain qualitatively similar with no sharp increase in GMR below 200 K as was observed in our
mixed mode sample (Fig. 1b). The maximum resistance occurs near the coercive field where
the labyrinth domain pattern results in the largest spin disorder. The inability of this sample to
achieve the laterally correlated reversal mode is likely due to an increase in magnetostatic
energy ( Ms2) in the Co/Pd stack from the additional moment as well as an anisotropy

Page 8 of 16
reduction from the softer Ni layer reducing the domain wall energy ( UK ), making domain
nucleation in that stack more favorable. This would also increase the amount of dipole field
that would be imparted on the Co/Ni stack from the demagnetized Co/Pd ML, resulting in
reinforcement of the vertical correlation of domains even at decreased temperatures.
Interestingly, such a delicate balance has been previously observed in more strongly AF
coupled Co/Pt MLs with Ru spacers, where temperature and field cycling were able to induce
the laterally and vertically correlated reversal modes. In that case, the exchange coupling was
more pronounced with J being an order of magnitude larger than the present system,
consistent with the more pronounced AF coupling across the Ru spacers.20,24
In conclusion, we have demonstrated the crossover between vertically and laterally
correlated magnetization reversal in a (Co/Pd)/Cu/(Co/Ni) PSV, which can be manipulated by
both temperature variation and cycling of the magnetic field. The contrasting magnetic
configurations offer a new handle to tune spin disorders and GMR effects. The instability of
these modes is due to the delicate balance amongst magnetostatic, domain wall and interlayer
exchange coupling energies. The FORC measurements were utilized to extract the exchange
energy density, which has strong temperature dependence that facilities the reversal mode
crossover. Adding an additional Ni/Co bilayer at the [Co/Pd]/Cu interface further demonstrates
the sensitivity of the mixed reversal behavior and was able to completely suppress the laterally
coupled reversal mode, likely due to increased Ms and reduced Ku.
The authors would like to acknowledge support from the National Science Foundation
(Grant # IIP‐1013982, DMR‐1008791 and ECCS‐0925626), the Swedish Institute, the Swedish

Page 9 of 16
Foundation for Strategic Research, the Sweidsh Research Council, and the Knut and Alice
Wallenberg Foundation. JED would like to acknowledge Dave Brownell for useful discussions.
Page 10 of 16
References
*Authors to whom correspondence should be addressed. Electronic mail: [email protected], [email protected].
1 S. Mangin, D. Ravelosona, J.A. Katine, M.J. Carey, B.D. Terris, and E.E. Fullerton, Nature Materials 5, 210 (2006).
2 D.C. Ralph and M.D. Stiles, Journal of Magnetism and Magnetic Materials 320, 1190 (2008).
3 J.A. Katine and E.E. Fullerton, Journal of Magnetism and Magnetic Materials 320, 1217 (2008).
4 W.H. Rippard, A.M. Deac, M.R. Pufall, J.M. Shaw, M.W. Keller, S.E. Russek, and C. Serpico, Physical Review B 81, 014426 (2010).
5 S.A. Wolf, D.D. Awschalom, R.A. Buhrman, J.M. Daughton, S. von Molnár, M.L. Roukes, A.Y. Chtchelkanova, and D.M. Treger, Science (New York, N.Y.) 294, 1488 (2001).
6 C.L. Zha, Y.Y. Fang, J. Nogués, and J. Åkerman, Journal of Applied Physics 106, 053909 (2009).
7 G. Feng, H.C. Wu, J.F. Feng, and J.M.D. Coey, Applied Physics Letters 99, 042502 (2011).
8 S. Mohseni, R. Dumas, Y. Fang, J. Lau, S. Sani, J. Persson, and J. Åkerman, Physical Review B 84, 174432 (2011).
9 M.N. Baibich, J.M. Broto, A. Fert, F.N. Van Dau, and F. Petroff, Physical Review Letters 61, 2472 (1988).
10 B. Dieny, V. Speriosu, S. Parkin, B. Gurney, D. Wilhoit, and D. Mauri, Physical Review B 43, 1297 (1991).
11 J.S. Moodera and G. Mathon, Journal of Magnetism and Magnetic Materials 200, 248 (1999).
12 S.S.P. Parkin, K.P. Roche, M.G. Samant, P.M. Rice, R.B. Beyers, R.E. Scheuerlein, E.J. O’Sullivan, S.L. Brown, J. Bucchigano, D.W. Abraham, Y. Lu, M. Rooks, P.L. Trouilloud, R.A. Wanner, and W.J. Gallagher, Journal of Applied Physics 85, 5828 (1999).
13 S. Parkin, R. Bhadra, and K. Roche, Physical Review Letters 66, 2152 (1991).
14 J. Xiao, J. Jiang, and C. Chien, Physical Review Letters 68, 3749 (1992).
15 I. Mayergoyz, Mathematical Models of Hysteresis and Their Applications (AcademicPress‐Elsevier, 2003).

Page 11 of 16
16 A.P. Roberts, C.R. Pike, and K.L. Verosub, Journal of Geophysical Research 105, 28461 (2000).
17 J. Davies, O. Hellwig, E. Fullerton, G. Denbeaux, J. Kortright, and K. Liu, Physical Review B 70, 224434 (2004).
18 J.E. Davies, O. Hellwig, E.E. Fullerton, J.S. Jiang, S.D. Bader, G.T. Zimányi, and K. Liu, Applied Physics Letters 86, 262503 (2005).
19 M. Pierce, C. Buechler, L. Sorensen, J. Turner, S. Kevan, E. Jagla, J. Deutsch, T. Mai, O. Narayan, J. Davies, K. Liu, J. Dunn, K. Chesnel, J. Kortright, O. Hellwig, and E. Fullerton., Physical Review Letters 94, 17202 (2005).
20 O. Hellwig, A. Berger, J.B. Kortright, and E.E. Fullerton, Journal of Magnetism and Magnetic Materials 319, 13 (2007).
21 J.I. Hong, S. Sankar, A.E. Berkowitz, and W.F. Egelhoff, Journal of Magnetism and Magnetic Materials 285, 359 (2005).
22 J. Davies, J. Wu, C. Leighton, and K. Liu, Physical Review B 72, 134419 (2005).
23 R. Dumas, C.‐P. Li, I. Roshchin, I. Schuller, and K. Liu, Physical Review B 75, 134405 (2007).
24 J. Davies, O. Hellwig, E. Fullerton, and K. Liu, Physical Review B 77, 014421 (2008).
25 O. Hellwig, T.L. Kirk, J.B. Kortright, A. Berger, and E.E. Fullerton, Nature Materials 2, 112 (2003).

Page 12 of 16
Table I. HE and J as a function of temperature.
Temperature (K)
HE (kOe)
J (x10-2 erg/cm2)
77 0.13 2.8 100 0.12 2.4 125 0.11 2.3 150 0.05 1.1

Page 13 of 16
Figure 1 (color online) (a) Major hysteresis loops measured by SQUID Magnetometry at different temperatures, with 300K VSM measurements of the individual Co/Ni and Co/Pd stacks shown in the inset, and corresponding (b) GMR of the (Co/Pd)/Cu/(Co/Ni) PSV. The vertical dashed line highlights the GMR peak position below 100 K. For both measurements the magnetic field is applied perpendicular to the film.
Page 14 of 16
Figure 2 (color online) (Top) FORCs and (bottom) contour plots of ρ for the (Co/Pd)/Cu/(Co/Ni) PSV for (a)/(c) 300 K, (b)/(d) 77 K. The horizontal axes of the contour plots are aligned with those of the FORCs and the contours are normalized to the same scale shown in panel (c). Inset in (a) shows a MFM image at 300 K after ac demagnetization.

Page 15 of 16
Figure 3. (color online) Major loop (blue triangles) along with representative FORCs and schematics of the reversal behavior at 77K. The ‐0.6 kOe FORC (filled squares) has a minor loop switching “corner” corresponding to Co/Ni reversal. The ‐1.1 kOe FORC at 77K (open squares) is similar to the 300 K FORC (dashed line), indicating a return to vertically correlated reversal. Laterally correlated reversal returns near negative saturation (blue triangles).

Page 16 of 16
Figure 4. (color online) (a) Major loops and (b) GMR curves at different temperatures for a (Co/Pd)4/Ni/Co/Cu/(Co/Ni)4 PSV. Inset in (a) is a MFM micrograph at 300 K after ac demagnetization.
Recommended