Western Kentucky UniversityTopSCHOLAR®
Public Health Faculty Publications Public Health
3-2014
Results of the Kentucky Worksite Assessment:Utilization of the CDC’s Health ScoreCardCecilia M. WatkinsWestern Kentucky University, [email protected]
Grace Lartey
Gretchen Macy
Vijay [email protected]
Teresa Lovely
Follow this and additional works at: http://digitalcommons.wku.edu/public_hlth_fac_pub
Part of the Public Health Commons
This Report is brought to you for free and open access by TopSCHOLAR®. It has been accepted for inclusion in Public Health Faculty Publications byan authorized administrator of TopSCHOLAR®. For more information, please contact [email protected].
Recommended Repository CitationWatkins, Cecilia M.; Lartey, Grace; Macy, Gretchen; Golla, Vijay; and Lovely, Teresa, "Results of the Kentucky Worksite Assessment:Utilization of the CDC’s Health ScoreCard" (2014). Public Health Faculty Publications. Paper 16.http://digitalcommons.wku.edu/public_hlth_fac_pub/16

Results of the Kentucky Worksite Assessment:
Utilization of the CDC’s Health ScoreCard
Final Report
Cecilia Watkins, PhD, MS, CHES,1 Grace Lartey, PhD, MA,
1 Gretchen Macy,
EdD, MPH,1 Vijay Golla, PhD, MBBS, MPH,
1 Teresa Lovely, MS, CHES
2
1. Western Kentucky University
2. Kentucky Department for Public Health

2
PREFACE
This project was a collaboration between the Kentucky Department for Public Health and the
Western Kentucky University (WKU) Department of Public Health.
Funding for this study was provided by the Centers for Disease Control and Prevention
Cooperative Agreement 2B01DP009022-13 through the Kentucky Department for Public
Health.
The contents are solely the responsibility of the authors and do not necessarily represent the
official views of the Centers for Disease Control and Prevention.
Results of the Kentucky Worksite Assessment: Utilization of the CDC’s Health ScoreCard.
View the full report and executive summary at
http://kentucky.stateofwellness.org/ and http://chfs.ky.gov/dph/info/dpqi/cd/

3
CONTENTS
Preface 2
Summary 4
Acknowledgements 5
Abbreviations 6
Literature Review 7 - 18
Methods 19 - 21
Results 22 - 98
Discussion 99 - 112
Limitations 113
Conclusion 114
Recommendations 115 - 117
References 118 - 124

4
SUMMARY
Study Objectives and Research Approach
A Health Impact Assessment (HIA) conducted in 2011-2012 of a proposed Kentucky
Worksite Wellness Tax Credit highlighted gaps in the data available on worksite wellness
programs in the Commonwealth of Kentucky.
Conducting a state-wide assessment of worksite wellness programs was a recommendation
that resulted from this HIA.
The purpose of the assessment is to:
1) Identify the number of comprehensive worksite health promotion programs in Kentucky.
2) Determine the health needs of worksites in Kentucky.
By Identifying current wellness practices in Kentucky, better tools and support can be
provided at a state level to assist organizations to implement results-oriented wellness
programs. As worksite wellness science continues to advance and the expectations of
successful outcomes continue to increase, more will be required of those in charge of these
programs.
Upon receiving approval from WKU’s Institutional Review Board (IRB), 1,200 randomly
drawn businesses received a questionnaire via email. Two-week increments were allowed for
workplaces that needed reminders or more time to complete the survey. The survey began in
May 2013 and closed in October 2013.
Data was analyzed for outstanding themes, which will form the bases for decisions made on
the needs of worksite-wellness programs in Kentucky. Data was analyzed further —
descriptively and inferentially — to determine worksite factors that contribute to the
increasing trends of chronic diseases in the workplace.

5
ACKNOWLEDGEMENTS
The group would like to acknowledge the following individuals for their contributions to the
project:
Sue Thomas-Cox, Kentucky Department for Public Health
Dennis Chaney, Barren River District Health Department
Sireesha Kodali, Graduate Assistant, WKU Department of Public Health
Melissa Sacrey, WKU Student Intern, Kentucky Department for Public Health
6
ABBREVIATIONS
AED: Automated External Defibrillators
CDC: Centers for Disease Control and Prevention
COPD: Chronic Obstructive Pulmonary Disease
CPR: Cardiopulmonary Resuscitation
EAP: Employee Assistance Program
FDA: Food and Drug Administration
FTE: Full-Time Employee
GED: General Education Development
HIA: Health Impact Assessment
HP: Health Promotion
HRA: Health Risk Assessment
HSC: Worksite Health Scorecard
KDPH: Kentucky Department for Public Health
NIOSH: National Institute for Occupational Safety and Health
OTC: Over-the-counter
PEHP: Public Employee Health Plan
PTO: Paid time off
WHP: Worksite Health Promotion

7
LITERATURE REVIEW
United States health issues and chronic diseases:
The Centers for Disease Control and Prevention (CDC) reported that chronic diseases are the
leading cause of death and disability in the United States. Four modifiable lifestyle behaviors
are responsible for a considerable amount of these chronic diseases: sedentary lifestyles, poor
nutrition, tobacco use and excessive alcohol consumption (Centers for Disease Control and
Prevention, 2012). Stress is also a contributor to chronic diseases. In a study conducted by
Wolever et al., (2012), stress essentially has been linked to all chronic conditions and
depression, anxiety, fatigue, obesity, musculoskeletal pain, productivity loss and elevated
healthcare costs.
It is estimated that 164 million Americans or nearly half of the U.S. population will have at
least one chronic disease by 2025 (The Growing Crisis of Chronic Disease in the United
States, n.d.). Due to the increase in chronic diseases and subsequently the increased need for
health care services, the costs of health care premiums will continue to catapult for U.S.
businesses and their employees. Health care premiums have increased by 87% since the year
2000 (The Growing Crisis of Chronic Disease in the United States, n.d.).
Kentucky Health Issues and Chronic Diseases
The five most common causes of death in the United States are: heart disease, cancer, stroke,
chronic lower-respiratory diseases and unintentional injuries. When comparing Kentucky’s
rates to the U.S. in these leading causes of death, Kentucky’s rates are higher in all categories
(CDC, 2008). In 2011, Kentucky reported 29% of adults and 26% of high school students as
being current smokers, costing $1.46 billion in personal healthcare expenditures and $2.3

8
billion in lost productivity annually (CDC, 2013a). In 2007, 69% of Kentucky high school
students did not attend physical education classes and 56% of Kentucky adults were not
moderately or vigorously physically active, resulting in 16% of high school students and 69%
of adults reported as overweight or obese (CDC, 2008).
In “America's Health Rankings” (2013), Kentucky’s overall ranking was 45 out of 50 .
Kentucky’s challenges noted in this report included a high rate of smoking, a high rate of
preventable hospitalization, and a high rate of cancer deaths. Some of the core measures of
“America's Health Rankings” reveal the continued challenges Kentuckians experience in
improving lifestyle behaviors. In these core measures, Kentucky ranks 50 in smoking, 50 in
cancer deaths, 49 in preventable hospitalizations, 46 in physical inactivity and 42 in obesity
(United Health Foundation, 2013).
What is Worksite Health Promotion (WHP)
Worksite Health Promotion (WHP) is “the business-/industry-sponsored employee health
promotion/education/safety programs with a goal of realizing a person’s fullest physical,
psychological, social, spiritual and economic potential” (Michaels, & Greene, 2013).
According to the National Prevention Strategy (2011), employers have the ability to
implement policies and programs that can improve the health, well-being and safety of their
employees. Prevention is the National Prevention Strategy’s core value and is the most cost-
effective way for Americans to live longer and with a better quality of life.
One of the actions recommended by the National Prevention Strategy is for businesses and
employers to provide preventive services and comprehensive wellness programs to their
employees (National Prevention Council, 2011). Key elements of a comprehensive WHP

9
are: health education; links to related employee services; supportive physical and social
environments for health improvement; integration of health promotion into an organization’s
culture; and employee screenings with adequate treatment and follow up (Goetzel &
Ozminkowski, 2008).
Benefits of WHP Programs
A study by Baicker, Cutler and Song (2010) on the available literature on wellness programs
revealed interesting findings about wellness-generated savings. Implementation of worksite
wellness programs resulted in a three-fold reduction in costs associated with medical care
and two-fold decrease in costs due to absenteeism (Baicker et al., 2010). Studies have
concluded that an effective worksite wellness program can save $3.27 in medical cost
savings and $2.73 in absenteeism reductions for every dollar employers invest in health
promotion activities (Parkinson, 2013). WHP programs reduce absenteeism, increase
productivity and eliminate financial loss incurred due to decreased morale and employee
illness (McPeck, Ryan & Chapman, 2009). Additionally, Fabius et al., (2013) revealed that
companies building a culture of health by focusing on the well-being and safety of their
workforce yielded greater value for their investors.
The Task Force on Community Preventive Services notes that the worksite environment
provides advantages over other types of environments for the creation of health promotion.
The large and rather stable population of the worksite, the potential for recruitment and
participation in programs and the social support and peer influences of coworkers are all
advantages that the worksite environment offers the health promotion effort (Task Force on
Community Preventive Services, 2010).

10
Challenges of WHP Programs
Results from the 2004 National Worksite Health Promotion Survey revealed that two of the
five most common challenges to effective worksite health-promotion programs are employee
related — lack of employee interest and participation of high-risk employees. Lack of
funding, management support and staff resources are considered administrative challenges to
successful worksite health promotion programs (Linnan et al., 2008). Regardless of the
evidence that WHP programs are popular due to both financial and non-financial outcomes,
these programs are often not effective. Fewer than 1 in 10 companies offer wellness
programs of sufficient quality and scope to be considered comprehensive (Felter, Nolan,
Colombi, Albert & Pringle, 2013).
Ethical concerns can also be a challenge in implementing wellness programs in the
workplace. A study conducted in 2010 on obesity in the workplace, revealed some general
eithical concerns of employees involving the promotion of healthy eating and exercise, even
though workplace safety and security not being met. Specific methods and strategies such as
food changes, point-of-decision prompts, use of incentives and confidentialitiy in conjunction
with privacy issues also caused ethical concern (Gates & Brehm, 2010).
A 2008 study found that employees perceive environmental factors at the workplace
can influence their eating and exercise behaviors. This study revealed that the majority
of employees perceived the quality of food and stress influenced their eating choices,
while the lack of access to a gym prevented them from getting enough exercise. Cost
and time affected both eating and exercise habits at the workplace (Watkins, Lartey,
Golla & Khubchandani, 2008).

11
A statewide survey conducted on worksites in New York examined the worksite policy and
environmental support for physical activity, healthy eating, stress management and
preventive screenings. Results of this study revealed that small and medium worksites
reported significantly less support for environmental policies in all four categories. These
results address the need for assistance in worksites with fewer than 200 employees when
starting a wellness program. Findings also indicated that programs supported by a wellness
committee or a designated manager are more likely to be successful than those without one
(Brissette, Fisher, Spicer & King, 2008). While small employers (fewer than 500 employees)
make up 99.7% of the workforce in the U.S., less than 7% of small businesses have
comprehensive wellness programs (McPeck et al., 2009). According to a 2011 statewide
health-impact assessment (HIA), approximately 99% of Kentucky’s businesses have fewer
than 249 employees, which would contribute to the notion that WHP programs if
implemented effectively could benefit Kentucky (Lovely & Watkins, 2012).
Trends in WHP
Sparling (2010), notes that there are 10 key principles when determining the success of a
WHP program. Successful WHP programs:
• are comprehensive and integrated.
• have top leadership commitment.
• are available to all employees.
• provide systematic health assessments with feedback and goal setting.
• have programs designed to an individual’s needs.
These programs also:

12
• provide effective incentives.
• are supported by healthy environments and policies.
• are linked to safety and job performance at all employee levels.
• deliver extended services to employee families.
• have systematic evaluation of needs and programs.
Even though a comprehensive program is needed for long-term success in WHP, not all
worksites are at the same capacity to establish a comprehensive WHP program. The Worksite
Health Promotion Capacity Instrument (WHPCI) is a tool developed to assess the collective
willingness and systemic implementation of health-promotion activities in companies (Jung
et al., 2010). This study suggests that this tool will have the ability to diagnose, describe,
explain and evaluate the present level of health promotion readiness in businesses and the
degree to which businesses currently are implementing WHP systematically (Jung et al.,
2010).
The integration of health promotion and health protection is a trend that is gaining substantial
support in the field of worksite health promotion. A recent article, Hymel et al. (2011)
discussed the case for changing the way health promotion and health protection are
separately managed and how integration of these two can create a healthier and safer
workforce through synergy. As Goetzel (2005) notes in a final report to NIOSH, although
much research is needed to learn more about what works best and why, employers can
maximize safety and employee health by integrating health, safety and worker-productivity
management programs. Goetzel discusses the common practice of departments within
organizations to operate in silos with little interaction, which can impede the integration
process mentioned above (Goetzel, 2005).

13
The Worksite Health Promotion Readiness Checklist (WRCL) is a tool developed to measure
the readiness of a company to implement a worksite health promotion and health protection
program. This tool may also be capable of identifying the availability of existing resources
that can be utilized, especially by small worksites that often have a preconceived notion that
wellness programs are too expensive (Faghri, Kotejoshyer, Cherniack, Reeves & Punnett,
2010).
In a brief issued by Trust for America’s Health (2013), recommendations to provide
workplace wellness programs to all American workers included the following:
“comprehensive wellness programs should be offered by the federal government that can
serve as a model for other governmental and private workplaces; state and local governments
should offer effective wellness programs to their employees; and wellness programs should
be offered to educators to pass on to their students”. In addition, states should offer wellness
programs as a key component of their Health Insurance Exchanges. And private businesses
should partner with government, hospitals and community-based organizations to offer
wellness programs, while federal, state and local governments should offer tax incentives and
other assistance to encourage the usage of wellness programs.
The 2013 RAND Workplace Wellness Programs Study evaluated current wellness-program
participation, program impact, and the role of incentives in workplace wellness programs.
Results from this study revealed that about half of U.S. employers with 50 or more
employees provide a wellness program and are committed to long-term support of the
program. The evidence reveals that lifestyle management interventions can reduce risk
factors and increase healthy behaviors. Although employers believe that wellness programs
are a viable strategy to contain healthcare costs, the outcomes are rarely formally evaluated.
14
Incentives of more than $50 appeared effective in getting employees to complete an HRA.
Five factors are considered as key facilitators to make WHP successful: effective
communication strategies; providing opportunities to employees to engage; engaged
leadership at all organizational levels; efficient utilization of existing resources; and
relationships and continuous evaluation (Mattke et al., 2013).
The 2013 Staying@Work Survey results revealed that establishing a culture of health as a
company’s top priority is vital to a healthy company. A major component to sustaining
healthy behaviors is connecting the health, well-being and worker-effectiveness strategy to
employee values. Stress, obesity and lack of physical activity are the biggest challenges that
the respondents faced and most often are targeted in program development. The top priorities
of the respondents’ health and productivity programs included developing a culture where
employees are responsible for their health while they understand its importance, improving
employee engagement in health programs, educating employees to be better healthcare
consumers, improving employee awareness of health and risks, and improving employee
physical and emotional/mental health (Towers Watson, 2013).
The Stay@Work survey showed several factors that contributed to the major challenge of a
participant’s lack of engagement in programs and ways to alleviate them.
• First, was the lack of a clear articulated health and productivity strategy.
Employees must understand the program and how their values tie into the goals of the
program.
• Second, was a lack of employee accountability can also inhibit employee engagement
(Towers Watson, 2013).

15
Extrinsic incentives such as penalties, gateway incentives and outcome-based incentives are
becoming more and more common, but the ability to tie intrinsic values of health is proving
to be a more sustainable way to make employees responsible for their health.
• Third was that efficient but not effective programs have shown that while some successes
can be experienced through innovative methods, such as flex time and financial incentives,
low usage rates keep the programs from being as effective as they could be (Towers Watson,
2013).
• Fourth, was that the needs and desires of the employees must be acknowledged and
programs tailored to individuals and specific demographic groups with proper dissemination
of information and evaluation of progress.
• Fifth was that limited engagement of vendors and providers need to be alleviated by making
these groups part of the workplace environment whenever possible (Towers Watson, 2013).
WHP in Local Governments and States
According to Benavides and David (2010), local governments are becoming more invested in
wellness. With rising healthcare costs and the need to maintain a healthy workforce, many
local governments are determining that prevention is more effective than treatment. The
latest results from the Principal Financial Well-being Index revealed that 57% of employees
surveyed believed wellness benefits are very or somewhat successful in reducing healthcare
costs and 74% agreed that wellness benefits encouraged them to work harder. The Centers
for Disease Control and Prevention (CDC) funded a comprehensive worksite wellness
program to improve employee efficiency at the Metropolitan Transportation Authority in
Austin, Texas. The return on investment was $2.43 for every dollar spent on the worksite

16
wellness program during a four-year period (Davis et al., 2009). Kansas City’s Healthiest
Employer is available to help employers considering implementing a wellness program.
Healthiest Employer is a wellness company that provides unbiased data and advice to aid in
analyzing a company’s wellness status, and it builds a strategy for implementation of a
worksite wellness program (Kansas City: Healthiest Employer, 2011).
More states are implementing wellness programs designed for improving the health of their
workforce. The Kansas Department of Health and Environment has begun a campaign that
promotes implementing comprehensive worksite health-promotion programs throughout the
state (Kansas Department of Health and Environment, 2014). States such as Alabama and
Arkansas offer discounts ranging from $10 to $30 on the state employee’s wellness premium
upon submission of their Health Risk Assessments (HRA). Other states such as Delaware,
Missouri, Ohio, South Dakota and West Virginia are offering financial incentives to
encourage participation in state wellness programs. Utah’s Public Employee Health Plan
(PEHP) — unique from other states — offers rebates starting from $50 up to $300 depending
on the health improvements made by the PEHP member. Montana’s wellness program has
been offering state employees free health screenings along with health coaching, as well as
lunch and learn programs for no cost since 2007 (National Conference of State Legislatures,
2012).
In 2012, the Kentucky Coordinated Chronic Disease Prevention and Health Promotion
Program released its Unbridled Health Report, A Plan for Coordinated Chronic Disease
Prevention and Health Promotion (2012-2016). This plan is a call to action for a healthier
Kentucky. This effort includes the shared vision and united effort of all community entities,
including employers, and aims to improve health through the implementation of tobacco-free

17
policies at facilities, the use of incentives to reduce barriers and encourage regular
screenings, providing healthy foods in vending machines and cafeterias, and adopting
comprehensive worksite wellness policies and programs (Kentucky Department for Public
Health, 2013).
The CDC Worksite Health ScoreCard
The CDC recently released its Worksite Health ScoreCard (HSC), an instrument designed by
the Emory University Prevention Research Center in partnership with the CDC, state health
departments and worksite health experts. The HSC is a tool designed to aid employers in
assessing to what degree their health promotion interventions are comprehensive and
evidenced-based. With the HSC, the employers can identify gaps in their programs and
prioritize strategies for improvements. The HSC covers the following health topics:
organizational support, tobacco control, nutrition, physical activity, weight management,
stress management, depression, high blood pressure, high cholesterol, diabetes, signs and
symptoms of heart attack and stroke, and emergency response to heart attack and stroke
(Matson-Koffman & Dyann, 2012).
At the end of 2012, New Hampshire’s Cheshire County began using the CDC Worksite
Health ScoreCard to help attain its Vision 2020 initiative of “the healthiest community in the
nation”. More than 1,900 individuals and 80 organizations are currently registered in
Cheshire County’s “Champion Program”. Champions are committed to either implementing
or improving their employer-based, health-promotion programs with assistance from the
CDC’s ScoreCard. With results from the ScoreCard, businesses are encouraged to select

18
three issues as first-year priorities and receive help designing an action plan. An inventory of
practical assistance and local resources based on each question on the ScoreCard is being
compiled for county employers. Eventually, all Champion organizations will use the
ScoreCard for health program improvement. The ScoreCard also will be used yearly to track
improvements in programs and overall employee health status. These worksite health-
promotion programs have a high capacity for reaching most adults in Cheshire County with
its approximately 45,000 working-age adults and its low unemployment, approximately 5%
(CDC, 2013b).

19
METHODS
Research Design
The CDC Health ScoreCard was used to collect information on health promotion practices at
workplaces in Kentucky. Workplace health promotion practices were examined under the
following health topics: organizational supports, tobacco control, nutrition, physical activity,
weight management, stress management, depression, high blood pressure, high cholesterol,
diabetes, signs and symptoms of heart attack and stroke, emergency response to heart attack
and stroke, lactation support, occupational health and safety, vaccine-preventable diseases,
community resources, cancer, and asthma and chronic pulmonary disease (COPD).
Sample Selection
A random sample of 1,200 workplaces in Kentucky was selected from a database to
participate in the study. Of this sample, 206 emails were undeliverable resulting in 994
potential participating worksites. The database consisted of a directory of all workplaces
(excluding federal agencies, healthcare, and retail worksites) in Kentucky obtained from the
Kentucky Cabinet for Economic Development’s Select Kentucky searchable database and a
directory of all workplaces in Kentucky purchased from a commercial mailing list company.
The two directories were combined into one database. The database was cleaned to prevent
duplication of workplaces before sample selection.
Instrument Development
The CDC Health ScoreCard was used to collect information from workplaces. The CDC
ScoreCard is a 22-page instrument designed to capture information on a variety of health-

20
promotion activities. The instrument consisted of a combination of close-ended and open-
ended questions. The ScoreCard is arranged in modules and asks for information on the
following health topics: organizational supports, tobacco control, nutrition, physical activity,
weight management, stress management, depression, high blood pressure, high cholesterol,
diabetes, signs and symptoms of heart attack and stroke, and emergency response to heart
attack and stroke. Additional questions provided by the CDC related to lactation support,
occupational health and safety, vaccine-preventable disease, and community resources also
were included. The CDC permitted inclusion of these questions as they intend to use them as
part of the ScoreCard in the future. The instrument also included background questions to
determine the characteristics of workplaces and employees. In addition to the questions from
the ScoreCard, the researchers added four questions related to cancer and five questions
covering asthma and COPD, per request of the Kentucky Department for Public Health
(KDPH).
Procedure
The instrument was entered in the Qualtrics research software for electronic distribution.
The ScoreCard and additional questions were entered in modules for ease of scoring. Upon
IRB approval from Western Kentucky University, a participation letter was sent out to all
potential worksites one week prior to the commencement of the assessment period asking for
their participation and providing information regarding the purpose of the study, potential
benefits of participation, and an introduction of the researchers.
The following week, a survey link was distributed to the Worksite Health Promotion
Directors/Managers identified through the database directory as contacts at their respective

21
worksites or to Human Resource Managers through email. The email explained to
participants that their responses would be saved after completion of each module and that
they could return to continue the survey at any time. Informed consent also was included in
the email and participants were informed they could leave the study at any time without
penalty. Two weeks after the email containing the survey link was first distributed, a second
email was sent out to any potential participants that had not completed the survey urging
their participation.
Following the initial reminder, weekly reminders were sent to all participants that had not
completed the survey. The response rate was very low after the initial reminder. Therefore,
weekly reminders were distributed for the duration of the study period to encourage
participation. During the last weeks of the study, participants who had not responded to the
survey were contacted via telephone to urge their participation. Following completion of the
individual assessment, each participant was emailed a scoring sheet and a link to the CDC
Health ScoreCard document. Directions for comparison of individual worksites to the
sample of worksites participating in the ScoreCard Validation Benchmarking Report also
were included.
Data Analysis
SPSS 21 and the Qualtrics research software were used to analyze the data. Descriptive
summary statistics were used to describe the central tendency and variance of each variable
measured, including the demographic characteristics. Graphs also were included to provide a
pictorial display of the information.
22
RESULTS
Company Demographics
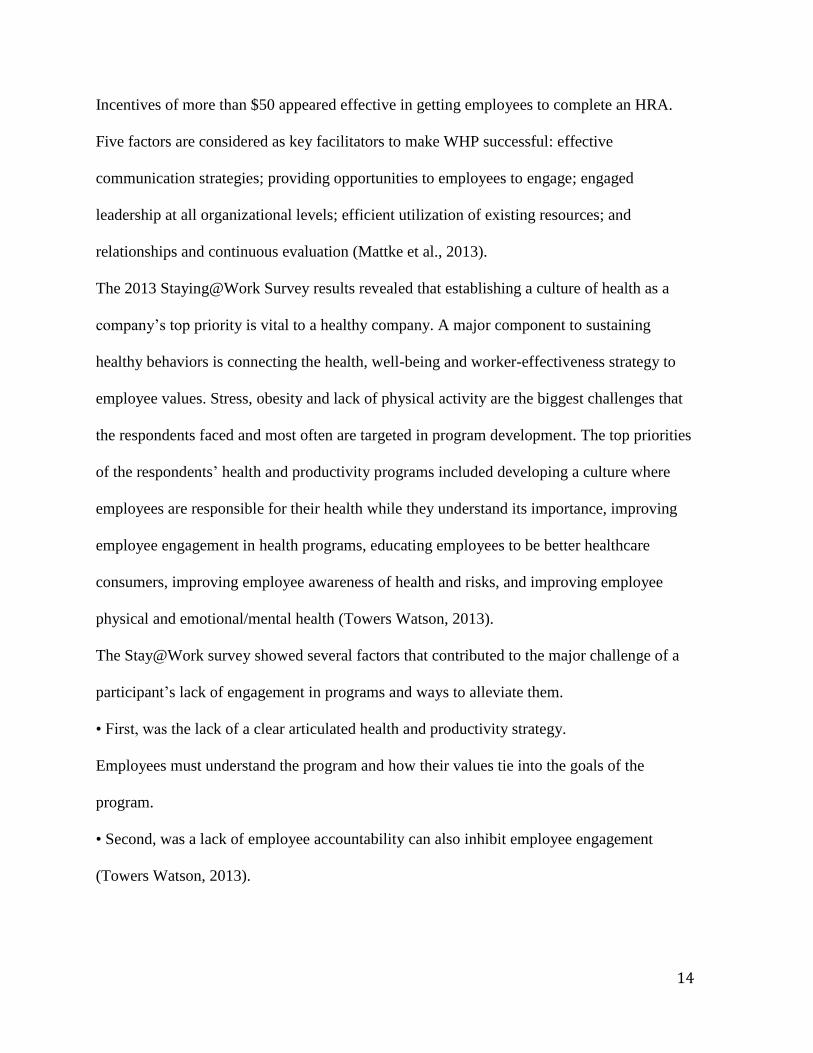
Among 944 invited companies, 365 participated in the assessment for a 37% response rate.
Sixty-seven of the participants (39%) had less than 50 full-time employees (FTE) with 11%
reporting between 1-19 FTE and 28% reporting between 20-49 FTE. Among all participants,
44% had between 50-250 FTE, 20% had between 50-99 FTE, and 24% had between 100-249
FTE. Nineteen participating companies (11%) had between 250-499 FTE and 11 companies
(6%) had more than 500 FTE. (See Table 1).
Table 1. Participating workplaces by number of full time employees (FTE)
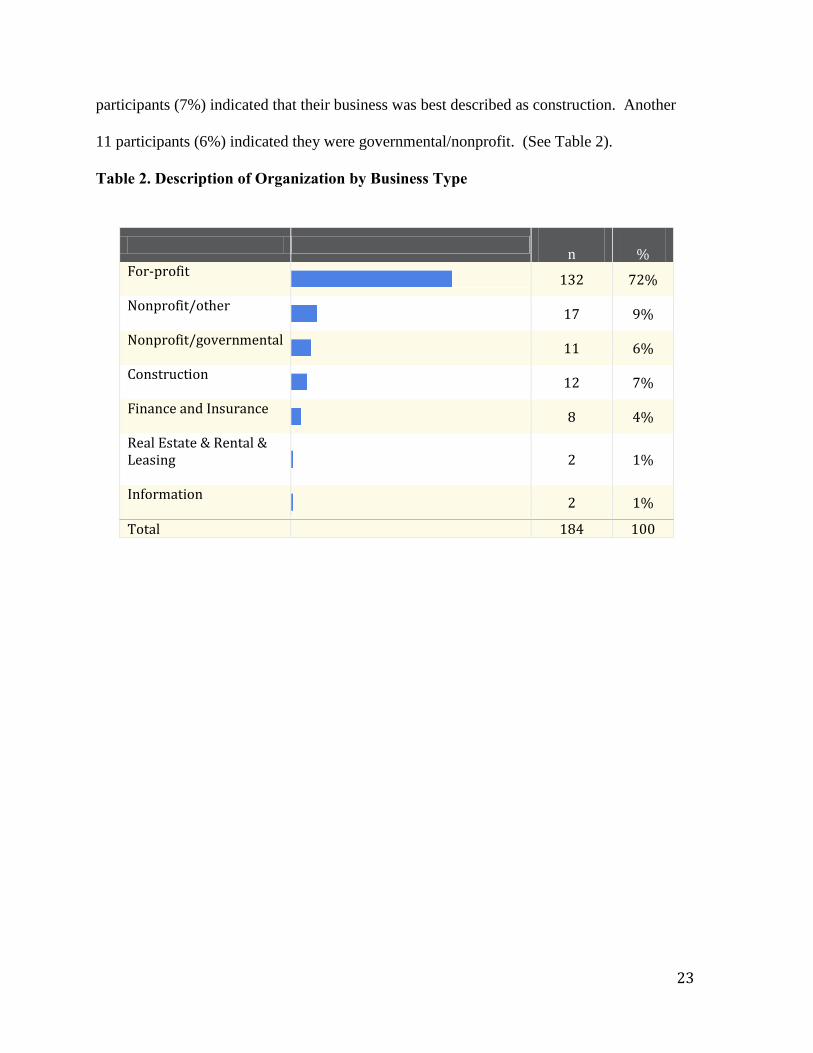
Of the participating companies, 144 (73.8%) indicated that they were located at their
company’s headquarters. The majority of the companies (72%) reported being for-profit
businesses. Seventeen businesses (9%) were categorized as nonprofit/other. An additional 12
Workplace Size
n %
1-19 FTE
19 11%
20-49 FTE
48 28%
50-99 FTE
34 20%
100-249 FTE
41 24%
250-499 FTE
19 11%
> 500 FTE
11 6%
Total 172 100%
23
participants (7%) indicated that their business was best described as construction. Another
11 participants (6%) indicated they were governmental/nonprofit. (See Table 2).
Table 2. Description of Organization by Business Type
n
%
For-profit
132 72%
Nonprofit/other
17 9%
Nonprofit/governmental
11 6%
Construction
12 7%
Finance and Insurance
8 4%
Real Estate & Rental & Leasing
2 1%
Information
2 1%
Total 184 100

24
When asked which category best described the business industry type, 87 (48%) workplaces
listed manufacturing. An additional 18% of the respondents reported “other services” as the
organization’s industry, 15 participants (8%) reported Healthcare and Social Assistance, and
8% of organizations reported that retail/wholesale best described the company’s industry
type. (See Table 3).

25
Table 3. Description of Organization by Industry Type
n
%
Manufacturing
87 48%
Other Services (except Public Administration):
32 17%
Healthcare & Social Assistance
15 8%
Retail/Wholesale Trade
14 8%
Transportation, Warehousing & Utilities
10 5%
Educational Services
7 4%
Professional, Scientific & Technical Services
6 3%
Agriculture, Forestry, Fishing & Hunting
3 2%
Accommodation & Food Service
4 2%
Mining, Quarrying, Oil & Gas Extraction
2 1%
Arts, Entertainment & Recreation
2 1%
Administrative & Support & Waste Management & Remediation Services
1 <1%
Total 183 100%

26
The majority of respondents (98%) indicated that his/her company provided health insurance
coverage to employees. Only 51% of participants responded as to whether his or her
organization had a wellness program. Of this group, 49% indicated that a wellness program
was in place (See Table 4). Among those reporting an established wellness program, the
majority (95%) indicated that his/her organization had offered the wellness program for less
than five years. Among businesses with 1-19 FTE, 37% reported having a wellness program,
while among businesses with 20-49 FTE, 25% reported having a wellness program. On
average, larger businesses were more likely to report having a wellness program. Among
businesses with 250-499 FTE, 63% reported having a wellness program and of those
businesses with >500 FTE, 91% reported having a wellness program (See Table 5). Among
those that indicated that their organization did not currently have a wellness program, 69%
reported no intention of starting a program. None of the 12 organizations with 1-19 FTE
without a wellness program reported an intention to start a wellness program in the future
and only 23% of those organizations with 20-49 FTE without a wellness program reported an
intention to start a wellness program in the future. Of the seven organizations with 250-499
FTE without a wellness program, 71% reported an intention to start a wellness program in
the future and the organization with >500 FTE without a wellness program reported an
intention to start a program. The majority of companies (57%) that expressed an intention to
start a program in the future reported plans to do so during the next two years.

27
Table 4. Businesses Reporting Established Worksite Health Promotion (WHP)
Programs
Table 5. Established worksite health promotion program by workplace size
Worksite Size
Established WHP Program
Total Worksites by size
Yes
n (%) No
n (%)
1-19 FTE
7 (37) 12 (63) 19
20-49 FTE
12 (25)
36 (75)
48
50-99 FTE
13 (38)
21 (62)
34
100-249 FTE
25 (61)
16 (39)
41
250-499 FTE
12 (63)
7 (37)
19
> 500 FTE
10 (91)
1 (9)
11
Total 172
n
% Yes
90 49%
No
95 51%
Total 185 100%

28
The most frequently reported elements offered as part of a worksite health promotion
program were links to employee related services and supportive physical and social
environments for health improvement. Of the options provided, the element offered least
was integration of health promotion into the organization’s culture. Responses for all
element offerings are shown below (See Table 6).
Table 6. Offering of specific elements of WHP program (n=185)
Element n % Health education (e.g., skills development and behavior change classes; awareness building brochures, posters)
92 50%
Links to related employee services (e.g., referral to employee-assistance programs (EAPs))
105 57%
Supportive physical and social environments for health improvement (e.g., tobacco-free policies, subsidized gym memberships)
103 56%
Integration of health promotion into your organization's culture (e.g., health promotion being part of business mission statement)
33 18%
Employee screenings with adequate treatment and follow-up (e.g., Health Risk Assessments (HRAs) and biometric screenings)
90 49%

29
Workforce Demographics
Among the participating companies, the majority of the workforce was female (54%). Most
employees were between 45-64 years of age (42%). Non-Hispanic whites (88%) were the
majority of the workforce, with Non-Hispanic blacks (8%), Hispanic/Latino (2%), Asian
(1%), and American Indian/Pacific Islander/Other (1%) comprising the remaining 12%.
Most employees (76%) were paid hourly. The highest degree earned for the majority of
employees (53%) was a high school degree/GED, with 7% earning an advanced degree, 23%
earning a college diploma, 14% reporting some college hours or a technical degree, and
approximately 3% reportedly not having at least a high school diploma or GED (See Table
7).

30
Table 7. Worker demographics
Characteristic n %
Total Employees
Gender
57,511
Male 26,341 46
Female 31,170 54
Age in years 52,860
< 18 114 .2
18-34 15,419 29
34-44 13,247 25
45-64 22,426 42
>65 1,654 3
Race/Ethnicity 39,456
Non-Hispanic Whites
34,607 88
Non-Hispanic Black
3,154 8
Hispanic/ Latino
721 2
Asian 579 1
American Indian/Pacific Islander/Other
395 1
Job Type 41,374
Salaried 9,940 24
Hourly 31,434 76
Education Level 13,637
< High school diploma
401 3
High school Diploma/ GED
7,238 53
Some college or technical school
1,883 14
College graduate
3,184 23
Advanced degree
931 7

31
Organizational Support
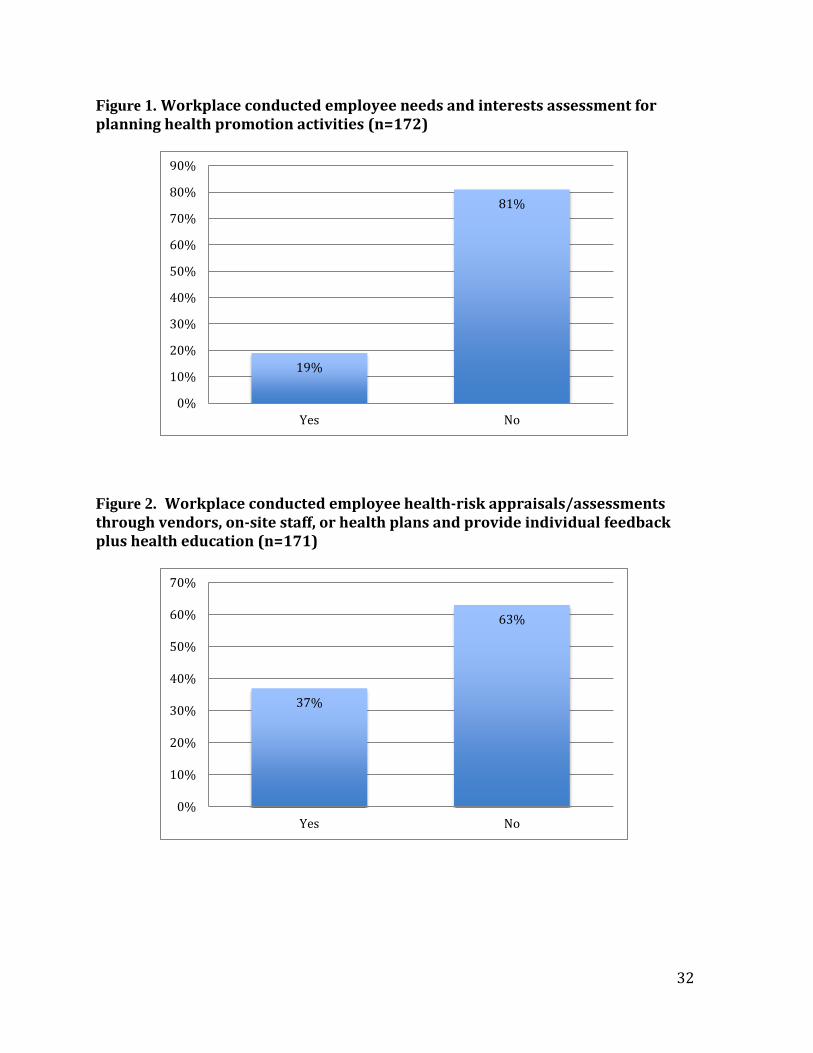
Participating workplaces were asked if they conducted needs and interests assessment for
planning their health promotion activities during the past 12 months. Out of the 172
workplaces that responded, only 32 (19%) conducted needs and interests assessment (See
Figure 1). Similarly, about 37% of workplaces conducted health-risk appraisals/assessments,
health plans or provided individual feedback or health education (See Figure 2). Sixty
workplaces (35%) reported that their organizational support and commitment of worksite
health promotion was demonstrated at all levels of management (See Figure 3).
32
Figure 1. Workplace conducted employee needs and interests assessment for planning health promotion activities (n=172)
Figure 2. Workplace conducted employee health-risk appraisals/assessments through vendors, on-site staff, or health plans and provide individual feedback plus health education (n=171)
19%
81%
0%
10%
20%
30%
40%
50%
60%
70%
80%
90%
Yes No
37%
63%
0%
10%
20%
30%
40%
50%
60%
70%
Yes No

33
Figure 3. Workplace demonstrated organizational commitment and support of worksite health promotion at all levels of management (n=171)
To assess how employees are motivated to participate in worksite health promotion
programs, workplaces were asked whether they used incentives with other strategies to
promote participation. Sixty (44%) out of 170 workplaces reported they did use incentives
with other strategies (See Figure 4). Only 58 (34%) of workplaces reported using
competitions combined with interventions to support employees making behavior changes
(See Figure 5).
On marketing health promotion programs to employees, 40% (69) workplaces reported
promoting and marketing health programs to their employees (See Figure 6). About 33 (20%)
workplaces reported using examples of employees role-modeling appropriate health
behaviors or health-related stories as marketing materials (See Figure 7).
35%
65%
0%
10%
20%
30%
40%
50%
60%
70%
Yes No

34
Figure 4. Workplace used and combined incentives with other strategies to increase participation in health promotion programs (n=171)
Figure 5. Workplace used competitions when combined with additional interventions to support employees making behavior changes (n=171)
44%
57%
0%
10%
20%
30%
40%
50%
60%
Yes No
34%
66%
0%
10%
20%
30%
40%
50%
60%
70%
Yes No

35
Figure 6. Workplace promoted and marketed health promotion programs to employees (n=171)
Figure 7. Workplace used examples of employees role-modeling appropriate health behaviors or employee health-related “success stories” in the marketing materials (n=171)
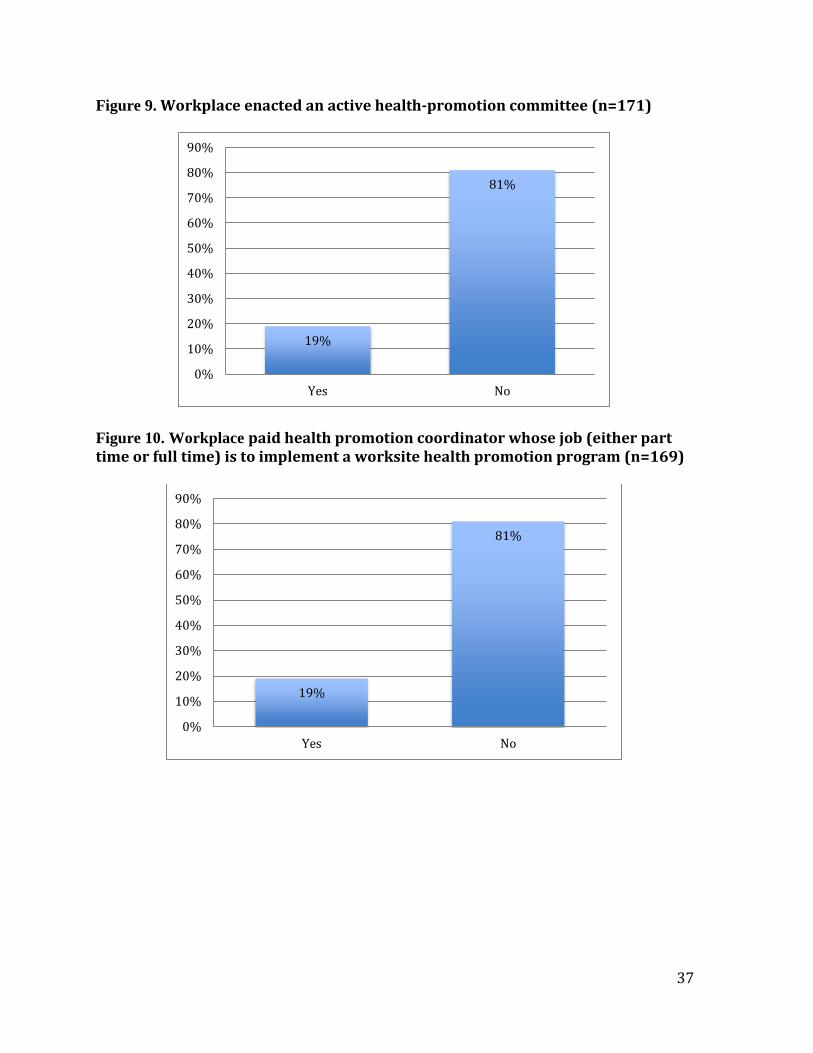
Regarding adaptation of health-education materials to suit language, literacy level, culture, or
readiness to change, only 42 workplaces (25%) reported doing this (See Figure 8). Less than
one-fifth of workplaces (32 or 19%) reported having an active health-promotion committee
(See Figure 9). The same number of workplaces reported having a paid health-promotion
40%
60%
0%
10%
20%
30%
40%
50%
60%
70%
Yes No
20%
80%
0%
10%
20%
30%
40%
50%
60%
70%
80%
90%
Yes No

36
coordinator responsible for implementing worksite health-promotion programs either part
time or full time (See Figure 10). Furthermore, 29% of workplaces (50) reported having a
champion(s) who strongly advocated for health promotion programs (See Figure 11).
Figure 8. Workplace tailored some health promotion programs and education materials to the language, literacy levels, culture, or readiness to change of various segments of the workforce (n=171)
25%
75%
0%
10%
20%
30%
40%
50%
60%
70%
80%
Yes No
37
Figure 9. Workplace enacted an active health-promotion committee (n=171)
Figure 10. Workplace paid health promotion coordinator whose job (either part time or full time) is to implement a worksite health promotion program (n=169)
19%
81%
0%
10%
20%
30%
40%
50%
60%
70%
80%
90%
Yes No
19%
81%
0%
10%
20%
30%
40%
50%
60%
70%
80%
90%
Yes No

38
Figure 11. Workplace identified champion(s) who was/were a strong advocate/advocates for the health promotion program (n=170)
Workplaces also were asked about dedicated funds for health-promotion programs. Forty-
seven (28%) workplaces reported having an annual budget for their programs during the past
12 months (See Figure 12). Only 31 workplaces (19%) set annual organizational health
promotion objectives (See Figure 13). In addition, approximately 31 workplaces (13%) had
business objectives or an organizational mission statement which made references to
improving or maintaining employee health (See Figure 14).
29%
71%
0%
10%
20%
30%
40%
50%
60%
70%
80%
Yes No

39
Figure 12. Workplace possessed an annual budget or receipt of dedicated funding for health promotion programs (n=167)
Figure 13. Workplace established annual organizational objectives for health promotion (n=167)
28%
72%
0%
10%
20%
30%
40%
50%
60%
70%
80%
Yes No
19%
81%
0%
10%
20%
30%
40%
50%
60%
70%
80%
90%
Yes No

40
Figure 14. Workplace included references to improve or maintain employee health in the business objectives or organizational mission statement (n=167)
Thirty-seven workplaces (22%) reported they conducted evaluations of their health
promotion programs using multiple data sources (See Figure 15). Availability of health
promotion programs to employee family members was slightly better. Fifty-five workplaces
(33%) reported making health promotion programs available to family members (See Figure
16). Provision of flexible work-schedule policies was also assessed. Fifty-eight workplaces
(34%) reported having flexible work-schedule policies to promote employee health during
the past 12 months (See Figure 17). When going beyond the workplace into the community,
71 workplaces (42%) reported engaging in community health initiatives and supporting
employee participation and volunteer efforts during the past month (See Figure 18).
13%
87%
0%
10%
20%
30%
40%
50%
60%
70%
80%
90%
100%
Yes No

41
Figure 15. Workplace conducted ongoing evaluations of health-promotion programming that used multiple data sources (n=170)
Figure 16. Workplace offered health promotion programs available to family members (n=169)
22%
78%
0%
10%
20%
30%
40%
50%
60%
70%
80%
90%
Yes No
33%
67%
0%
10%
20%
30%
40%
50%
60%
70%
80%
Yes No

42
Figure 17. Workplace provided flexible work-scheduling policies (n=169)
Figure 18. Workplace engaged in other health initiatives throughout the community and supported employee participation and volunteer efforts (n=170)
34%
66%
0%
10%
20%
30%
40%
50%
60%
70%
Yes No
42%
58%
0%
10%
20%
30%
40%
50%
60%
70%
Yes No

43
Tobacco Control
Of the 170 respondents, 86 (51%) indicated that there was a written policy banning
tobacco at his/her worksite. The majority of participants (51%) also indicated that
his/her worksite actively enforced a written policy banning tobacco use (See Figure
19). Additionally, 97 (58%) workplaces said that his/her worksite displayed signs with
information about the tobacco-use policy (See Figure 20). However, less than half of all
respondents (31%) indicated that his/her worksite referred tobacco-users to a state or
other tobacco-cessation telephone quit line (See Figure 21).
Figure 19. Workplace established and actively enforced a written policy banning
tobacco (n=170)
51% 51%
49% 49%
0%
20%
40%
60%
80%
100%
120%
Written Policy In Place Written Policy ActivelyEnforced
Yes No

44
Figure 20. Workplace displayed signs (including “no smoking” signs) with information
about their tobacco-use policy (n=168)
Figure 21. Workplace referred tobacco-users to a state or other tobacco-cessation
telephone quit line (n=168)
Sixty-eight (41%) of the participants reported that his/her worksite provided health
insurance coverage for prescription tobacco-cessation medication, 55 (33%) of
workplaces indicated provision of health insurance coverage for FDA-approved over-
the-counter, nicotine-replacement products (See Figure 22). Of the participating
58%
42%
0%
10%
20%
30%
40%
50%
60%
70%
Yes No
31%
69%
0%
10%
20%
30%
40%
50%
60%
70%
80%
Yes No

45
workplaces, 64 (38%) provided or promoted free or subsidized tobacco-cessation
counseling (See Figure 23), while 74 (44%) workplaces informed employees about
health insurance coverage or programs that include tobacco cessation and counseling
(See Figure 24).
Figure 22. Workplace provided health insurance coverage for prescription and over-the-counter (OTC) medications for smoking cessation (n=170)
41% 33%
59% 67%
0%
20%
40%
60%
80%
100%
120%
Health insurance coverage forprescription medications
Health insurance coverage for OTCmedications
Yes No

46
Figure 23. Workplace provided and/or promoted free or subsidized tobacco-cessation
counseling (n=170)
Figure 24. Workplace informed employees about health insurance coverage or
programs that include tobacco-cessation medication and counseling (n=168)
Of 168 respondents, 28 (17%) provided incentives for being a current nonuser of
tobacco or for users taking part in cessation activities (See Figure 25). Lastly, 80%
38%
62%
0%
10%
20%
30%
40%
50%
60%
70%
Yes No
44%
56%
0%
10%
20%
30%
40%
50%
60%
Yes No

47
indicated that the sale of tobacco products on company property was prohibited (See
Figure 26).
Figure 25. Workplace provided incentives for being a current nonuser of tobacco and
for current tobacco users that are currently involved in a cessation class or actively
quitting (n=167)
Figure 26. Workplace permitted the sale of tobacco products on company property
(n=170)
17%
83%
0%
10%
20%
30%
40%
50%
60%
70%
80%
90%
Yes No
79%
21%
0%
10%
20%
30%
40%
50%
60%
70%
80%
90%
Yes No

48
Nutrition
Among 170 workplaces, 141 provided places for employees to purchase food and beverage
(See Figure 27). Although most workplaces provided places to purchase food and beverages,
only 21% of participating workplaces had written policies or formal communication making
healthier food and beverage choices available in vending machines (See Figure 28). Twenty-
one workplaces (14%) reported more than 50% of food and beverage choices available in
vending machines, cafeterias, snack bars or other purchase points were healthier choices
during the past 12 months (See Figure 29).
Figure 27. Workplace provided places to purchase food and beverages (n= 170)
88%
12% 0%
10%
20%
30%
40%
50%
60%
70%
80%
90%
100%
Yes No

49
Figure 28. Workplace established a written policy or formal communication that made
healthier food and beverage choices available in vending machines (n=146)
Figure 29. Workplace made healthier most (more than 50%) of the food and beverage
choices available in vending machines, cafeterias, snack bars, or other purchase points
(n=147)
21%
79%
0%
10%
20%
30%
40%
50%
60%
70%
80%
90%
Yes No
14%
86%
0%
10%
20%
30%
40%
50%
60%
70%
80%
90%
100%
Yes No
50
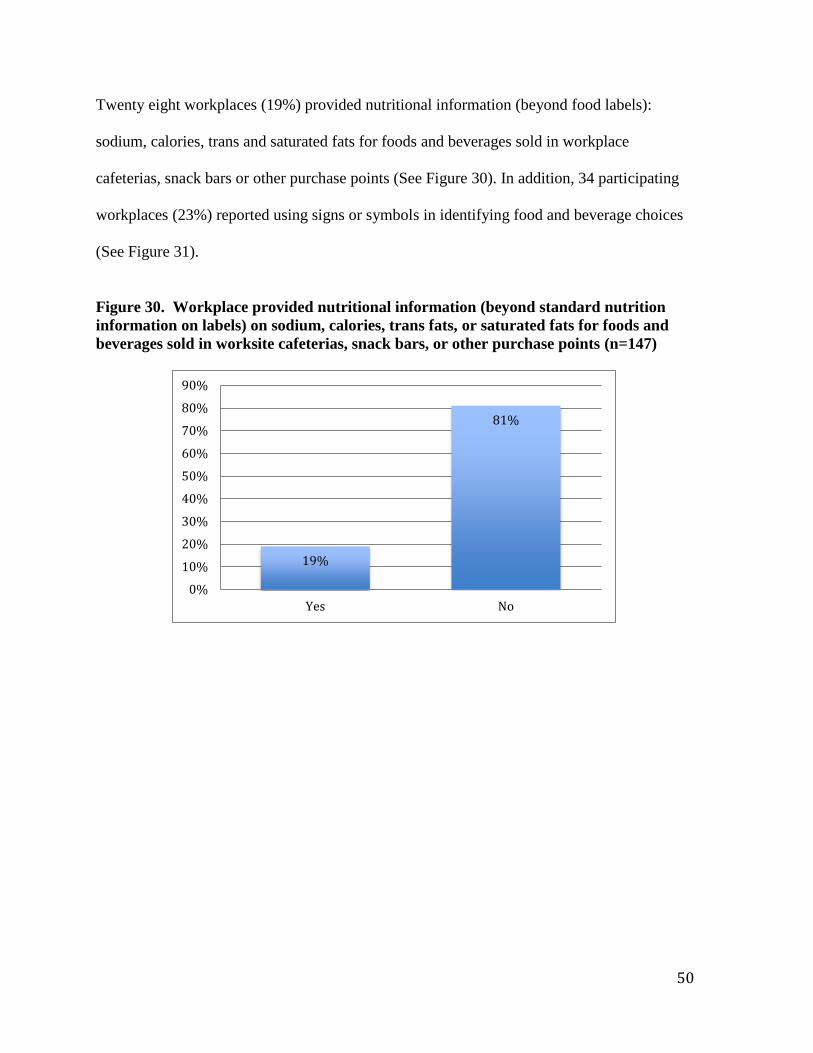
Twenty eight workplaces (19%) provided nutritional information (beyond food labels):
sodium, calories, trans and saturated fats for foods and beverages sold in workplace
cafeterias, snack bars or other purchase points (See Figure 30). In addition, 34 participating
workplaces (23%) reported using signs or symbols in identifying food and beverage choices
(See Figure 31).
Figure 30. Workplace provided nutritional information (beyond standard nutrition
information on labels) on sodium, calories, trans fats, or saturated fats for foods and
beverages sold in worksite cafeterias, snack bars, or other purchase points (n=147)
19%
81%
0%
10%
20%
30%
40%
50%
60%
70%
80%
90%
Yes No
51
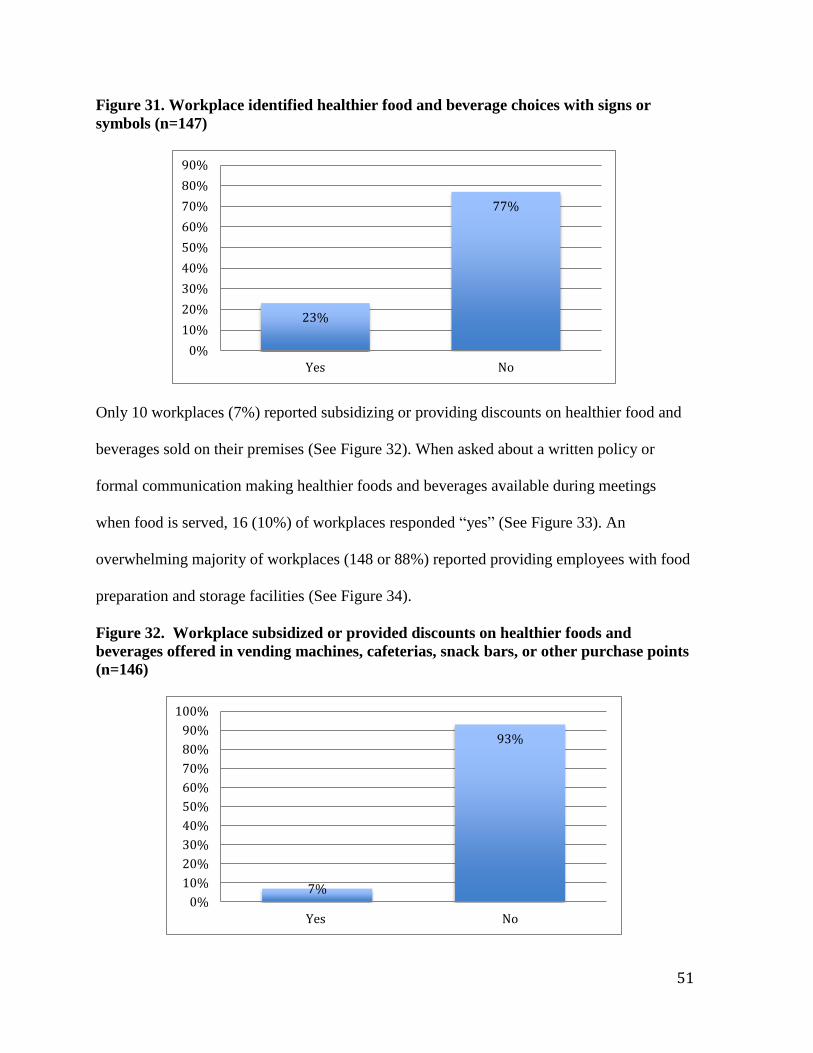
Figure 31. Workplace identified healthier food and beverage choices with signs or
symbols (n=147)
Only 10 workplaces (7%) reported subsidizing or providing discounts on healthier food and
beverages sold on their premises (See Figure 32). When asked about a written policy or
formal communication making healthier foods and beverages available during meetings
when food is served, 16 (10%) of workplaces responded “yes” (See Figure 33). An
overwhelming majority of workplaces (148 or 88%) reported providing employees with food
preparation and storage facilities (See Figure 34).
Figure 32. Workplace subsidized or provided discounts on healthier foods and
beverages offered in vending machines, cafeterias, snack bars, or other purchase points
(n=146)
23%
77%
0%
10%
20%
30%
40%
50%
60%
70%
80%
90%
Yes No
7%
93%
0%
10%
20%
30%
40%
50%
60%
70%
80%
90%
100%
Yes No

52
Figure 33. Workplace established written policy or formal communication, which
makes healthier food and beverage choices available during meetings when food is
served (n=169)
Figure 34. Workplace provide food preparation and storage facilities to employees
(n=169)
Less than one-fifth of workplaces (27 or 16%) offer or promote during the past 12 months an
on-site or nearby famers’ market where fruits and vegetables are sold (See Figure 35). Close
to half of participating workplaces 78 (46%) reported providing healthy eating information
through brochures, videos, pamphlets, newsletters or other written or online avenues to their
10%
90%
0%
10%
20%
30%
40%
50%
60%
70%
80%
90%
100%
Yes No
88%
12% 0%
10%
20%
30%
40%
50%
60%
70%
80%
90%
100%
Yes No

53
employees (See Figure 36). On educational seminars, workshops or classes on nutrition,
approximately 45 workplaces (27%) reported offering such programs to their employees (See
Figure 37). Twenty-two percent of workplaces (36) reported providing free or subsidized
self-management programs for healthy eating (See Figure 38).
Figure 35. Workplace offered or promoted an on-site or nearby farmers’ market where
fresh fruits and vegetables are sold (n=169)
16%
84%
0%
10%
20%
30%
40%
50%
60%
70%
80%
90%
Yes No

54
Figure 36. Workplace provided brochures, videos, posters, pamphlets, newsletters, or
other written or online information that address the benefits of healthy eating (n=168)
Figure 37. Workplace provided a series of educational seminars, workshops, or classes
on nutrition (n=170)
46%
54%
42%
44%
46%
48%
50%
52%
54%
56%
Yes No
27%
73%
0%
10%
20%
30%
40%
50%
60%
70%
80%
Yes No

55
Figure 38. Workplace provided free or subsidized self-management programs for
healthy eating (n=167)
Physical Activity
Participating workplaces were asked about the provision of on-site or subsidized off-site
exercise facilities during the past 12 months. Out of the 169 workplaces responding, 34
(20%) provided an on-site exercise facility, while, 55 (33%) of workplaces offered
subsidized or discounted cost of on-site or offsite exercise facilities (See Figure 39). Forty-
seven (28%) workplaces reported a provision of environmental supports (e.g. trails or
walking tracks, maps of suitable walking tracks, bicycle racks, a basketball court, open space
designated for recreation, a shower or changing facility) during the past 12 months (See
Figure 40). Only 9 (5%) of workplaces posted signs at elevators, stairwells, and other
locations that encourage employees to use the stairs, while approximately 39 (24%) of
workplaces offered organized individual or group physical activity programs for employees
during the past 12 months (See Figure 40).
22%
78%
0%
10%
20%
30%
40%
50%
60%
70%
80%
90%
Yes No

56
Figure 39. Workplace provided on-site exercise facility and subsidized or discounted
cost of exercise facility
Figure 40. Workplace provided environmental supports, signs, and individual or group
physical-activity programs for employees
In order to examine other elements related to physical activity, workplaces were asked
whether educational classes and materials were present at the workplace in the past 12
months. Sixty-six workplaces (40%) provided brochures, videos, posters, pamphlets,
20% 33%
80% 67%
0%
20%
40%
60%
80%
100%
120%
Provided an on-site exercise facility(n=169)
Subsidized or discounted cost ofexercise facilities (n=168)
Yes No
28% 5%
24%
72% 95%
77%
0%
20%
40%
60%
80%
100%
120%
Provided otherenvironmental
supports (n=168)
Posted signs toencourage employeeuse of stairs (n=169)
Provided individual orgroup physical activity
programs foremployees (n=166)
Yes No

57
newsletters, or other written or online information addressing the benefits of physical
activity. While, only 33 (20%) provided educational seminars, workshops, or classes on
physical activity (See Figure 41). According to the results, there was also a lack of
assessments and counseling regarding physical activity at the workplace. Only 23
(14%) of the 165 participating workplaces offered or subsidized physical fitness
assessments, follow-up counseling and physical activity recommendations either on-
site or through a community exercise facility. The same number of workplaces (14%)
provided free or subsidized self-management programs for physical activity (See Figure
41) .
Figure 41. Workplace provided written or online information and education seminars,
workshops, or classes about physical activity
40% 20% 14% 14%
60% 80% 86% 86%
0%
20%
40%
60%
80%
100%
120%
Provided written oronline informationthat addressed thebenefits of physical
activity (n=167)
Provided educationalseminars, workshops,or classes on physical
activity (n=166)
Provided orsubsidized physical
activity assessments,follow-up counseling,and physical activity
recommendations(n=165)
Provided free orsubsidized self-
managementprograms for physical
activity (n=165)
Yes No

58
Weight Management
Participating workplaces were asked about the provision of assessments and educational
information regarding weight management during the past 12 months. Out of the 167
workplaces responding, 58 (35%) provided free or subsidized body composition
measurement, Body Mass Index (BMI) scores, or other body fat assessments (beyond HRAs)
followed by direct feedback and clinical referral when appropriate (See Figure 42).
Figure 42. Workplace provided free or subsidized body composition measurement,
Body Mass Index (BMI) scores, or other body fat assessments (n=167)
Only 65 (39%) workplaces provided brochures, videos, posters, pamphlets, newsletters, or
other written or online information that addressed the risks of overweight or obesity during
the past 12 months. Forty-one workplaces (25%) reported offering educational seminars,
workshops, or classes on weight management during the past 12 months (See Figure 43).
35%
65%
0%
10%
20%
30%
40%
50%
60%
70%
Yes No

59
Figure 43. Workplace provided educational materials and classes related to weight
management (n=167)
Approximately 39 (24%) workplaces offered free or subsidized one-on-one or group lifestyle
counseling for employees who were overweight or obese during the past 12 months.
Additionally, 23% of workplaces offered free or subsidized self-management programs for
weight management (See Figure 44).
39% 25%
61% 75%
0%
20%
40%
60%
80%
100%
120%
Provided free or subsidized bodycomposition measurement
Provided written or online informationaddressing overweight or obesity
Yes No

60
Figure 44. Workplace provided of lifestyle counseling and self-management programs
for weight management
Stress Management
Participating workplaces were asked about elements related to stress management provided
to employees. Out of the 165 workplaces responding, only 17 (10%) provided a dedicated
space where employees could engage in relaxation activities like meditation, yoga or
biofeedback (See Figure 45). However, 105 (63%) workplaces sponsored or organized social
events during the past 12 months (See Figure 46).
24% 23%
76% 77%
0%
20%
40%
60%
80%
100%
120%
Provided free or subsidized one-or-one orgroup lifestyle counseling for overweight or
obese employees (n=165)
Provided free or subsidized self-management programs for weight
management (n=164)
Yes No

61
Figure 45. Workplace provided dedicated space for relaxation (n=165)
Figure 46. Workplace sponsored or organized social events (n=167)
Forty-five (32%) participating workplaces reported that stress management programs were
provided during the past 12 months. Similarly, 53 (32%) workplaces offered work-life
balance/ life-skills programs for their employees (See Figure 47).
10%
90%
0%
10%
20%
30%
40%
50%
60%
70%
80%
90%
100%
Yes No
63%
37%
0%
10%
20%
30%
40%
50%
60%
70%
Yes No

62
Figure 47. Workplace provided stress-management and work-life balance programs
(n=166)
Of the 165 participating workplaces, only 37 (22%) provided training for managers on
identifying and reducing workplace stress-related issues (See Figure 48). Just 43 (26%)
workplaces provided employees with opportunities to participate in organizational decisions
regarding workplace issues that affect job stress (See Figure 49).
Figure 48. Workplace provided training for managers to identify and reduce
workplace stress (n=165)
27% 32%
73% 68%
0%
20%
40%
60%
80%
100%
120%
Provided stress-managementprograms
Provided work-life balance/life-skilsprograms
Yes No
22%
78%
0%
10%
20%
30%
40%
50%
60%
70%
80%
90%
Yes No

63
Figure 49. Workplace utilized employee participation in decisions regarding workplace
stress (n=165)
Depression
Participating workplaces were asked about providing screenings and assessments for
depression during the past 12 months. Of the 167 workplaces responding, 31 (19%) provided
free or subsidized clinical screening for depression (beyond HRAs) followed by direct
feedback and clinical referral when appropriate, while only 35 (21%) workplaces offered
access to online or paper self-assessment depression-screening tools (See Figure 50).
26%
74%
0%
10%
20%
30%
40%
50%
60%
70%
80%
Yes No

64
Figure 50. Workplace provided clinical screening and online or paper self-assessment
for depression (n=167)
Only 24 workplaces (15%) provided brochures, videos, posters, pamphlets, newsletters, or
other written or online information addressing depression during the past 12 months.
Similarly, less than 24 (15%) provided educational seminars, workshops, or classes on
preventing and treating depression. Only 39 (23%) of the 167 participating workplaces
offered one-on-one or group counseling for employees with depression (See Figure 51).
19% 21%
81% 79%
0%
20%
40%
60%
80%
100%
120%
Provided free or subsidized clinicalscreening for depression
Provided access to online or paperself-assessment for depression
Yes No

65
Figure 51. Workplace provided written or online information, educational workshops or classes, and one-on-one or group counseling for depression
There was also a lack of training in the workplaces regarding depression. Out of all
participating workplaces, 9 (6%) provided training for managers on depression in the
workplace (See Figure 52). However, 95 workplaces (58%) provided health insurance
coverage with no or low out-of-pocket costs for depression medications and mental
health counseling (See Figure 53).
Figure 52. Workplace provided training for managers related to depression (n=165)
28% 15%
23%
72% 85%
77%
0%
20%
40%
60%
80%
100%
120%
Provided written or onlineinformation that addressed
depression (n=167)
Provided educationalseminars, workshops or
classes on depression(n=163)
Provided one-on-one orgroup counseling fordepression (N=167)
Yes No
6%
94%
0%
20%
40%
60%
80%
100%
Yes No

66
Figure 53. Workplace offered health insurance coverage for depression medication and
mental health counseling (n=164)
High Blood Pressure
Participating workplaces were asked about screening and educational materials and classes
addressing high blood pressure during the past 12 months. Out of the 164 workplaces that
responded, 58 (35%) provided free or subsidized blood pressure screening (beyond HRAs)
followed by direct feedback and clinical referral when appropriate (See Figure 54).
Figure 54. Workplace provided screening for high blood pressure (n=164)
58%
42%
0%
10%
20%
30%
40%
50%
60%
70%
Yes No
35%
65%
0%
10%
20%
30%
40%
50%
60%
70%
Yes No

67
Sixty-nine workplaces (43%) provided brochures, videos, posters, pamphlets, newsletters, or
other written or online information that addressed the risks of high blood pressure.
Approximately 30 (18%) workplaces provided educational seminars, workshops, or classes
on preventing and controlling high blood pressure (See Figure 55).
Figure 55. Workplace provided written or online information and educational
workshops or classes related to high blood pressure
As for providing counseling and self-management programs for high blood pressure in
the workplace, 40 (25%) participating workplaces offered one-on-one or group lifestyle
counseling and follow-up monitoring for employees with high blood pressure or pre-
hypertension. Only 36 (22%) provided free or subsidized self-management programs
for blood pressure control (See Figure 56).
43%
18%
57%
82%
0%
20%
40%
60%
80%
100%
120%
Provided written or onlineinformation related to blood
pressure (n=162)
Provided educational workshops orclasses related to blood pressure
(n=163)
Yes No

68
Figure 56. Workplace provided counseling and self-management for employees with
high blood pressure (n=162)
Approximately 34 (21%) workplaces made available blood pressure-monitoring devices with
instruction to employees to conduct their own self-assessments (Figure 57). More than half
(67%) of the workplaces provided health insurance coverage with no or low out-of-
pocket costs for blood pressure control medications (See Figure 58).
Figure 57. Workplace made available blood pressure monitoring devices for self-assessment (n=162)
25% 21%
75% 79%
0%
20%
40%
60%
80%
100%
120%
Provided one-on-one or groupcounseling for employees with high
blood pressure
Provided free or subsidized self-management programs for blood
pressure control
Yes No
21%
79%
0%
10%
20%
30%
40%
50%
60%
70%
80%
90%
Yes No

69
Figure 58. Workplace provided health insurance coverage with no or low out-of-pocket
costs for blood pressure control medications (n=163)
High Cholesterol
Participating workplaces were asked if they provided screening, and educational materials
and classes that addressed high cholesterol during the past 12 months. Out of the 165
workplaces that responded, 56 (34%) provided free or subsidized cholesterol screening
(beyond HRAs) followed by direct feedback and clinical referral when appropriate (See
Figure 59).
67%
33%
0%
10%
20%
30%
40%
50%
60%
70%
80%
Yes No

70
Figure 59. Workplace provided screening for high cholesterol (n=165)
Approximately 64 participating workplaces (39%) provided brochures, videos, posters,
pamphlets, newsletters, or other written or online information that addressed the risks of high
cholesterol. Nearly 25 (16%) workplaces provided educational seminars, workshops, or
classes on preventing and controlling high cholesterol (See Figure 60).
Figure 60. Workplace provided written or online information and educational
workshops or classes related to high cholesterol
34%
66%
0%
10%
20%
30%
40%
50%
60%
70%
Yes No
39%
16%
61%
84%
0%
20%
40%
60%
80%
100%
120%
Provided written or online informationrelated to high cholesterol (n=164)
Provided educational workshops orclasses related to high cholesterol
(n=161)
Yes No

71
As for providing counseling and self-management programs for high cholesterol in the
workplace, 36 (22%) participating workplaces offered one-on-one or group lifestyle
counseling and follow-up monitoring for employees with high cholesterol. Only 34
(21%) workplaces provided free or subsidized self-management programs for
cholesterol control (See Figure 61).
Figure 61. Workplace provided one-on-one or group counseling and free or subsidized
self-management for employees with high cholesterol
22% 21%
78% 79%
0%
20%
40%
60%
80%
100%
120%
Provided one-on-one or groupcounseling for high cholesterol
(N=164)
Provided free or subsidized self-management for cholesterol
control (N=165)
Yes No
72
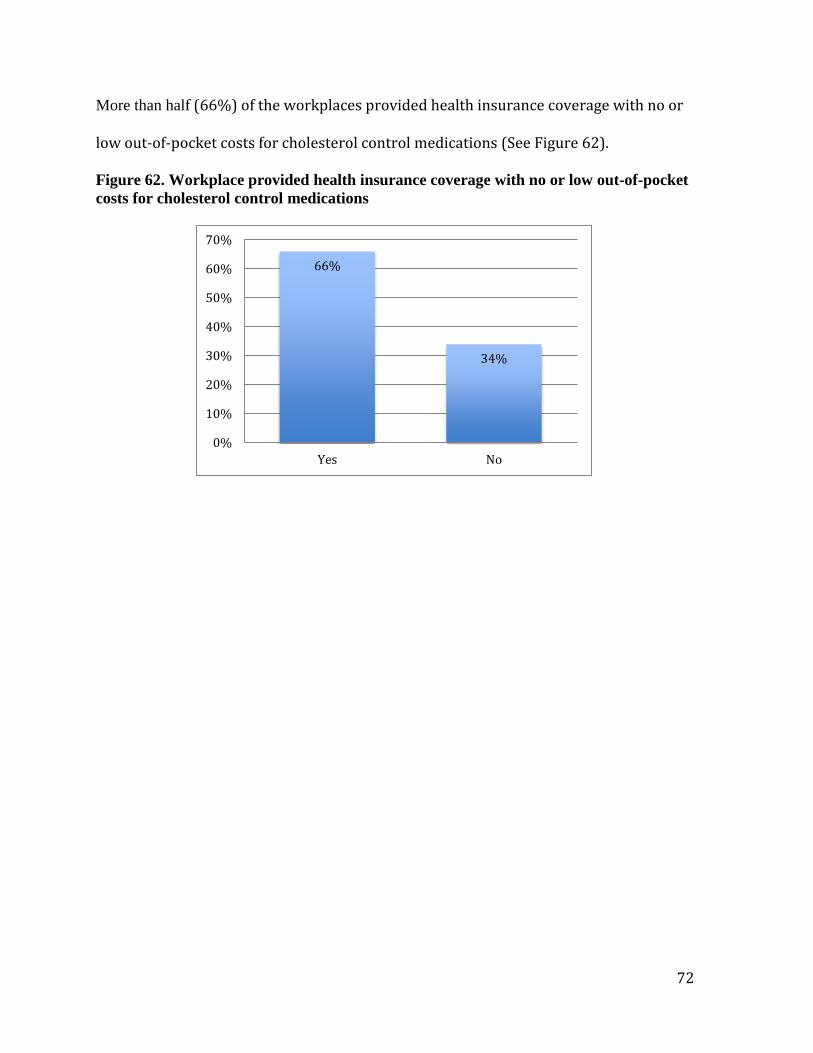
More than half (66%) of the workplaces provided health insurance coverage with no or
low out-of-pocket costs for cholesterol control medications (See Figure 62).
Figure 62. Workplace provided health insurance coverage with no or low out-of-pocket
costs for cholesterol control medications
66%
34%
0%
10%
20%
30%
40%
50%
60%
70%
Yes No

73
Diabetes
Participating workplaces were asked about screenings and assessments for diabetes during
the past 12 months. Out of the 162 workplaces responding, 51(32%) provided free or
subsidized pre-diabetes and diabetes risk factor self-assessments and feedback, followed by
blood glucose screening and clinical referral when appropriate (See Figure 63).
Figure 63. Workplace provided self-assessments for pre-diabetes and diabetes
Sixty (37%) workplaces provided brochures, videos, posters, pamphlets, newsletters, or other
written or online information addressing diabetes. Approximately 30 (18%) provided
educational seminars, workshops, or classes on preventing and treating diabetes (See Figure
64).
32%
68%
0%
10%
20%
30%
40%
50%
60%
70%
80%
Yes No

74
Figure 64. Workplace provided written or online information and educational
workshops or classes related to diabetes (n=164)
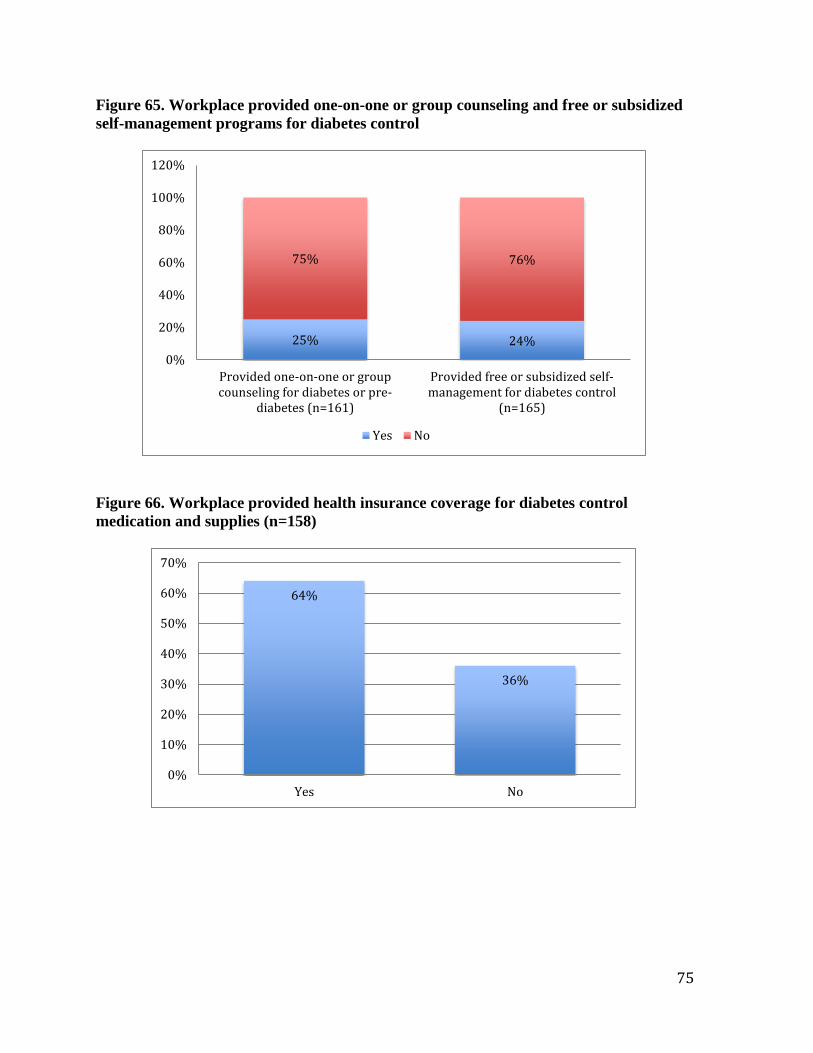
Forty (25%) of the participating workplaces offered one-on-one or group lifestyle counseling
and follow-up monitoring for employees with abnormal blood glucose levels (pre-diabetes or
diabetes). Similarly, 40 (24%) workplaces offered free or subsidized self-management
programs for diabetes control (See Figure 65). Among the workplaces, 101 (64%) provided
health insurance coverage with no or low out-of-pocket costs for diabetes control
medications and supplies (See Figure 66).
37%
18%
63%
82%
0%
20%
40%
60%
80%
100%
120%
Provided written or onlineinformation related to diabetes
Provided educational workshopsor classes related to diabetes
Yes No
75
Figure 65. Workplace provided one-on-one or group counseling and free or subsidized
self-management programs for diabetes control
Figure 66. Workplace provided health insurance coverage for diabetes control
medication and supplies (n=158)
25% 24%
75% 76%
0%
20%
40%
60%
80%
100%
120%
Provided one-on-one or groupcounseling for diabetes or pre-
diabetes (n=161)
Provided free or subsidized self-management for diabetes control
(n=165)
Yes No
64%
36%
0%
10%
20%
30%
40%
50%
60%
70%
Yes No

76
Signs and Symptoms of Heart Attack and Stroke
Participating workplaces were asked about utilizing signs, posters, and additional information
regarding the signals and symptoms of heart attack and stroke during the past 12 months. Out
of the 164 workplaces that responded, 48 (29%) indicated that posters or fliers identifying the
signs and symptoms of heart attack and informing that heart attacks are to be treated as
emergencies were placed in common areas. Of the participating workplaces, 45 (27%)
indicated that posters or fliers that identified the signs and symptoms of stroke and informing
that strokes are to be treated as emergencies were placed in common areas (See Figure 67).
Figure 67. Workplace utilized signs or posters in common areas identifying the signals
and symptoms of heart attack and stroke
29% 27%
71% 73%
0%
20%
40%
60%
80%
100%
120%
Had posters and flyers identifying the signsand symptoms of heart attack (n=164)
Had posters and fliers identifying the signsand symptoms of stroke (n=165)
Yes No
77
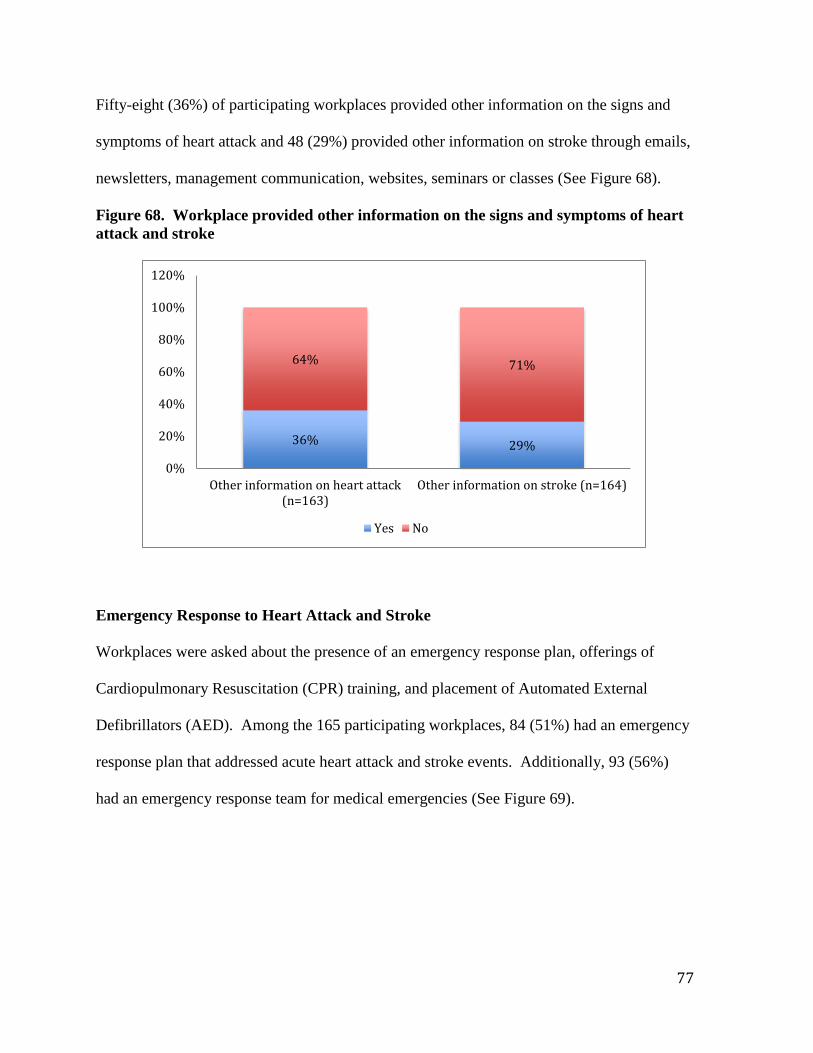
Fifty-eight (36%) of participating workplaces provided other information on the signs and
symptoms of heart attack and 48 (29%) provided other information on stroke through emails,
newsletters, management communication, websites, seminars or classes (See Figure 68).
Figure 68. Workplace provided other information on the signs and symptoms of heart
attack and stroke
Emergency Response to Heart Attack and Stroke
Workplaces were asked about the presence of an emergency response plan, offerings of
Cardiopulmonary Resuscitation (CPR) training, and placement of Automated External
Defibrillators (AED). Among the 165 participating workplaces, 84 (51%) had an emergency
response plan that addressed acute heart attack and stroke events. Additionally, 93 (56%)
had an emergency response team for medical emergencies (See Figure 69).
36% 29%
64% 71%
0%
20%
40%
60%
80%
100%
120%
Other information on heart attack(n=163)
Other information on stroke (n=164)
Yes No

78
Figure 69. Workplace established emergency response plans for heart attack/stroke
and established an emergency response team (n=165)
Access to a nationally-recognized training course on CPR that includes training on AED
usage was offered by 96 (59%) participating workplaces (See Figure 70). Ninety-seven
workplaces (59%) had a policy that requires an adequate number of employees per floor,
work unit, or shift, in accordance with pertinent state and federal laws to be certified in
CPR/AED (See Figure 71).
51% 56%
49% 44%
0%
20%
40%
60%
80%
100%
120%
Emergency response plan for heartattack and stroke
Emergency response team
Yes No

79
Figure 70. Workplace offered access to a nationally recognized CPR/AED training
course (n=163)
Figure 71. Workplace established a policy requiring an adequate number of employees
trained in CPR/AED
Additionally, 82 (50%) workplaces had one or more functioning AEDs in place (See Figure
72). And 73 (89%) workplaces indicated the presence of one or more functioning AEDs in
the workplaces and had an adequate number of AED units in order to reach a person within
3-5 minutes of collapse (See Figure73). Among this same group, 67 (82%) indicated that the
location of AEDs were identified with posters, signs, markers, or other forms of
communication other than the AED (See Figure 74) and 82 (99%) indicated that routine
59%
41%
0%
10%
20%
30%
40%
50%
60%
70%
Yes No
59%
41%
0%
10%
20%
30%
40%
50%
60%
70%
Yes No
80
maintenance or testing was performed on all AEDs (See Figure 75). In addition, 47 (59%)
workplaces with at least one AED in place provided information to the local community
Emergency Medical Service providers regarding the presence of an AED in case of an
emergency response (See Figure 76).
Figure 72. Workplaces with functioning AEDs (n=164)
Figure 73. Workplace provided adequate number of AEDs among workplaces with one
or more AEDs (n=82)
50% 50%
0%
10%
20%
30%
40%
50%
60%
Yes No
89%
11% 0%
10%
20%
30%
40%
50%
60%
70%
80%
90%
100%
Yes No

81
Figure 74. Workplace identified location of AEDs with posters, signs, markers or other
forms of communication other than the AED itself among workplaces with one or more
AED (n=82)
Figure 75. Workplace performed routine maintenance or testing on AEDs among
workplaces with one or more AEDs (n=82)
82%
18%
0%
10%
20%
30%
40%
50%
60%
70%
80%
90%
Yes No
99%
1% 0%
20%
40%
60%
80%
100%
120%
Yes No

82
Figure 76. Workplace provided information to local community Emergency Medical
Services providers among workplaces with one or more AEDs (n=80)
Additional CDC Health Scorecard Modules
Lactation Support
Participating workplaces were asked about elements of lactation support provided to
employees. Out of the 165 workplaces responding, only 18 (11%) had a written policy on
breastfeeding. Less than half (43%) provided a private space (other than a restroom) that
could be used by employees to express breast milk (See Figure 77).
59%
41%
0%
10%
20%
30%
40%
50%
60%
70%
Yes No

83
Figure 77. Workplace established a written policy on breastfeeding and private space
for employees to express milk (n=165)
Fourteen (9%) workplaces provided breast pumps at the worksite, while almost half (49%) of
workplaces provided flexible break times to allow mothers to pump breast milk (See Figure
78).
Figure 78. Workplace provided breast pumps and flexible break times for pumping
breast milk
11%
43%
89%
57%
0%
20%
40%
60%
80%
100%
120%
Written policy on breastfeeding Provided space for expressing milk
Yes No
9%
49%
91%
51%
0%
20%
40%
60%
80%
100%
120%
Breast pumps (n=165) Flexible breaks (n=163)
Yes No

84
Twelve (7%) of the participating workplaces offered free or subsidized breastfeeding support
groups or educational classes, while 49 (30%) offered paid maternity leave separate from any
other accrued leave (See Figure 79).
Figure 79. Workplace provided breastfeeding support groups or educational classes
and paid maternity leave separate from other accrued leave
Occupational Health and Safety
Workplaces were asked about the presence of occupational health and safety measures. Of
the 161 participating workplaces, 63 (39%) included references to improving/maintaining job
health and safety in the business objectives or organizational mission statements (See Figure
80). Additionally, 111 (68%) had a written injury and illness prevention program (See
Figure 81), while 70 (43%) workplaces employed an occupational health and safety
professional (See Figure 82).
7%
30%
93%
70%
0%
20%
40%
60%
80%
100%
120%
Support groups and educationalclasses (n=162)
Paid maternity leave(n=164)
Yes No

85
Figure 80. Workplace included references to improving/maintaining job health and
safety in mission statement (n=161)
Figure 81. Workplace referenced a written illness and injury program (n=164)
39%
61%
0%
10%
20%
30%
40%
50%
60%
70%
Yes No
68%
32%
0%
10%
20%
30%
40%
50%
60%
70%
80%
Yes No

86
Figure 82. Workplace employed an occupational health and safety professional (n=163)
Of the participating workplaces, 150 (93%) encouraged reporting injuries and near misses,
while 125 workplaces (79%) provided opportunities for employee input on hazards and
solutions (See Figure 83).
43%
57%
0%
10%
20%
30%
40%
50%
60%
Yes No

87
Figure 83. Workplace encouraged reporting injuries/near misses and provided
opportunities for employee input on hazards/solutions
Additionally, 130 (81%) workplaces had a program to investigate the causes of injuries or
illnesses. In addition, 115 (72%) workplaces provided written materials about health and
safety at work to educate employees (See Figure 84). One-hundred and twenty-nine
workplaces (81%) also provided training to all new workers on how to be safe on the job.
However, only 56 (35%) coordinated with health and safety administrators and health-
promotion and wellness professionals to plan activities for employees (See Figure 85).
93% 79%
7% 21%
0%
20%
40%
60%
80%
100%
120%
Encouraged reporting (n=162) Provided opportunities (n=158)
Yes No

88
Figure 84. Workplace offered a program to investigate causes of injury/illness and
provision of written materials about health and safety at the workplace
81% 72%
19% 28%
0%
20%
40%
60%
80%
100%
120%
Program to investigateinjuries/illnesses (n=161)
Provided written materials (n=160)
Yes No

89
Figure 85. Workplace provided safety training to all new workers and coordinated
health and safety administrators and with other professionals to plan activities for
employees
When asked about the establishment of policies or employee benefits related to occupational
health and safety, 102 (63%) workplaces offered paid time off (PTO) for days of hours
especially for sickness/illness of employees or dependents, while 155 (95%) offered paid
vacation time or personal days or hours for non-exempt employees (See Figure 86).
81%
35%
19%
65%
0%
20%
40%
60%
80%
100%
120%
Safety training (n=159) Coordinated professionals to planactivities for employees (n=162)
Yes No

90
Figure 86. Workplace established policies and benefits related to PTO and paid
vacation time
Vaccine Preventable Disease
Participating workplaces were asked about vaccinations and education in the past 12 months.
Among the 163 workplaces responding, 126 (77%) provided health insurance coverage with
no or low out-of-pocket costs for influenza vaccination. Ninety-six of the 162 responding
workplaces (59%) conducted influenza vaccinations at the worksite (See Figure 87). Among
the workplaces offering on-site influenza vaccinations, 94 (99%) offered vaccinations with
no or low out-of-pocket costs to employees. Within the same group, 28 (29%) offered
vaccinations other than seasonal influenza at the worksite with no or low out-of-pocket costs
to employees (See Figure 88).
0%
20%
40%
60%
80%
100%
120%
Paid time off (PTO) (n=162) Paid vacation time or personaldays (n=164)
No
Yes

91
Figure 87. Workplace provided health insurance coverage for influenza vaccines and
on-site influenza vaccinations
Figure 88. Workplace provided on-site vaccinations at no or low-cost to employees
77% 59%
23% 41%
0%
20%
40%
60%
80%
100%
120%
Health insurance coverage for fluvaccines (n=163)
Conducted on-site flu vaccines(n=162)
Yes No
99%
29%
1%
71%
0%
20%
40%
60%
80%
100%
120%
Flu vaccines (n=95) Vaccines other than flu (n=96)
Yes No

92
The majority of workplaces (55%) promoted influenza vaccinations through brochures,
videos, posters, pamphlets, newsletters or other written or online information that addressed
the benefits of influenza vaccinations (See Figure 89).
Figure 89. Workplace promoted influenza vaccines through written and online
information (n=161)
Community Resources
Participating workplaces were asked about providing information, programs or resources
from various organizations. Response rates for each are listed below. (See Figure 90).
55%
45%
0%
10%
20%
30%
40%
50%
60%
Yes No

93
Figure 90. Workplace provided information, programs and resources to employees by
organization (n=165)
Participating workplaces were asked if they received technical support from various
organizations related to the development of a workplace wellness program. Response rates
for each are listed below (See Figure 91).
19%
81%
45% 39% 30% 32% 15% 8% 12% 7% 6%
81%
19%
55% 61% 70% 68% 85% 92% 88% 93% 94%
0%
20%
40%
60%
80%
100%
120%
Yes No

94
Figure 91. Workplace received technical support by organization (n=165)
Participating workplaces were asked if they participated in any Community Coalitions
focused on health or business and community partnerships. Response rates are listed below
(See Figure 92).
Figure 92. Workplace participated in community coalitions focused on health or
business and community partnerships (n=160)
11%
50% 29% 25%
8% 30%
3% 1% 7% 1% 5%
89%
50% 71% 75%
92% 70%
97% 99% 93% 99% 95%
0%
20%
40%
60%
80%
100%
120%
Yes No
21%
79%
0%
10%
20%
30%
40%
50%
60%
70%
80%
90%
Yes No

95
Kentucky Department for Public Health Questions on Chronic Disease
Cancer
Participating workplaces were asked about benefits, paid time off, and communication
regarding cancer screening. Among the 165 participating workplaces, 151 (92%) provided
health benefit coverage at no or reduced cost for screening of breast, cervical and colorectal
cancers. Seventy-seven of the 163 participating workplaces (47%) provided paid time off
(PTO) to get preventive cancer screenings. Sixty-nine workplaces (42%) communicated the
importance of breast, cervical, and colorectal cancer screenings (See Figure 93). Among
workplaces that communicated the importance of these screenings, the most frequently cited
methods of communication were through open enrollment fairs and written or electronic
communication (e.g. reminders, newsletters, brochures).
Figure 93. Workplace provided health coverage and PTO for breast, cervical and
colorectal cancer screenings
92%
47% 42%
8%
53% 58%
0%
20%
40%
60%
80%
100%
120%
Health benefit for cancerscreening (n=165)
PTO for preventive healthscreenings (n=163)
Communicate importance ofcancer screening (n=163)
Yes No

96
Asthma and Chronic Obstructive Pulmonary Disease (COPD)
Participating workplaces were asked about screening benefits and policies related to asthma
and chronic obstructive pulmonary disease (COPD). Among the 158 participating
workplaces, 25 (16%) provided free or subsidized clinical screenings for asthma and COPD
(See Figure 93).
Figure 93. Workplace provided screenings for asthma and COPD (n=158)
Eighty (50%) workplaces had a written policy regarding the reduction of risk for airborne
particulate matter related to chemicals, dust and other possible respiratory exposures in the
workplace. Among the 156 participating workplaces that participated, 39 (25%) had written
policies for factors that affect asthma and COPD including integrated pest management (i.e.
reduction of cockroaches, droppings from mice), limiting indoor spraying of pesticides, and
immediate attention to water damage to reduce mold (See Figure 94).
16%
84%
0%
10%
20%
30%
40%
50%
60%
70%
80%
90%
Yes No

97
Figure 94. Workplace established written policies related to airborne particulate matter
and factors affecting COPD and Asthma
Among participating workplaces, 112 (69%) provided health insurance coverage with no or
low out-of-pocket costs for asthma and COPD inhalers and medications. And 34 (21%)
workplaces provided brochures, posters, pamphlets, newsletter articles, or other written or
on-line information that address asthma and/or COPD (See Figure 95).
50%
25%
50%
75%
0%
20%
40%
60%
80%
100%
120%
Airborne particulate matter (n=159) Factors related to asthma and COPD(n=156)
Yes No

98
Figure 95. Workplace provided health insurance coverage for asthma and/or COPD
inhalers and medication and written or online information addressing asthma and/or
COPD
69%
21%
31%
79%
0%
20%
40%
60%
80%
100%
120%
Health insurance coverage for inhalersand medication (n=162)
Written or online information (n=159)
Series 1 Series 2

99
DISCUSSION
Workplace health-promotion programs are identified as an effective strategy to improve the
health, well-being and safety of employees (National Prevention Strategy, 2011). Yet only
51% of survey participants responded as to whether their organization had a wellness
program and of this group, only 49% indicated that a wellness program was in place.
Additionally, among those that indicated that their organization did not currently have a
wellness program, 69% reported no intention of starting a program. These results support the
notion that although the workplace environment offers the best opportunities over other types
of environments for health promotion awareness and education, Kentucky’s workplaces are
not utilizing (whether by choice or through lack of resources) this advantage (Task Force on
Community Preventive Services, 2010).
Kentucky’s Unbridled Health Report, A Plan for Coordinated Chronic Disease Prevention
and Health and Health Promotion (2012-2016), calls for employers to adopt comprehensive
workplace wellness policies and programs. A comprehensive workplace health promotion
program includes: the components of health education; links to related employee services;
supportive physical and social environments; integration of health promotion into the
organization’s culture; and employee screenings with adequate treatment and follow-up.
Comprehensive workplace health promotion programs are more effective in improving
employee health than programs without these components (Goetzel & Ozminkowski, 2008).
Only 18% of responding workplaces stated that their organization integrated health
promotion into their culture, even though the 2013 Staying@Work Survey results indicated
that establishing a culture of health is vital to a healthy company. Approximately half of the

100
responding workplaces offered the remaining components of a comprehensive health-
promotion program.
The majority of responding workplaces (83%) have fewer than 249 employees, (often
categorized as small companies) which represent approximately 99% of Kentucky
Businesses (Lovely & Watkins, 2012). Small companies were less likely than large
companies to report having a wellness program and small companies without a wellness
program were less likely to report an intention to start a wellness program than larger
companies. These results are synonymous with the 2004 National Worksite Health
Promotion Survey results, which state the number, quality and types of workplace health
promotion programs, especially in small companies, must be increased (Linnan et al., 2008).
Among respondents, 98% indicated that health insurance coverage was provided to
employees. While health insurance is an important benefit, prevention is the most cost
effective way for Americans to live a longer and better quality of life (National Prevention
Council, 2011). Kentucky is ranked 49 in preventable hospitalization (United Health
Foundation, 2013). The lack of preventive services and health promotion programs coupled
with the substantial number of preventable hospitalizations possibly contributed considerably
to the high healthcare costs experienced in Kentucky.
Organizational Support:
Few workplaces (19%) had an active health promotion committee, or had a full-time or part-
time wellness coordinator. A New York state study revealed that workplace health promotion
programs supported by a wellness committee or designated manager are more likely to
succeed than those without (Brissette, Fisher, Spicer & King, 2008).

101
Similarly, only 19% of responding workplaces conducted employee needs and interest
assessments or established annual organizational objectives for health promotion, while only
13% included references to improve or maintain employee health in the business objectives
or organizational mission statement. Establishing a “culture of health” in the workplace is
vital for a successful company (Fabius et al., 2013). Workers need to understand the health
promotion program and how their values tie into the goals of the program. The needs and
interests of workers should be acknowledged and programs should be tailored to individuals
and specific demographic groups with effective communication and evaluation of progress
(Towers Watson, 2013).
While Sparling (2010) notes that successful health promotion programs should have a
systematic evaluation of needs and programs and should extend health promotion and
preventive services to family members, only 22% of responding companies conducted
ongoing evaluations of health promotion programming and just 33% made their workplace
health promotion programs available to employee families.
Tobacco Control:
In 2011, tobacco use cost Kentucky $1.46 billion in personal healthcare expenditures and
$2.3 billion in lost productivity annually (CDC, 2013a). Although in “America's Health
Rankings” (2013), Kentucky ranks 50 among states in smoking and 50 in cancer deaths
(United Health Foundation, 2013), 79% of responding workplaces permitted the sale of
tobacco products on company property.
Half of the participants had an actively enforced written policy banning tobacco. Only 31%
of responding workplaces referred tobacco users to a state or other tobacco-cessation

102
telephone quit line, while just 33% provided health insurance coverage for OTC smoking-
cessation medications and 41% for prescription smoking-cessation medications. Tobacco-
cessation counseling was offered by 38% of responding workplaces and 44% informed
employees about health insurance coverage or programs that include cessation medication
and counseling. Just 17% of workplaces offered incentives for current nonusers of tobacco
and for current tobacco users that are currently quitting. This pattern promotes the use of
tobacco products, while offering little incentive to quit.
Nutrition:
While the majority of responding workplaces (88%) provided sites to purchase food and
beverages, only 21% had a written policy that made vending machine food or beverage
offerings healthier and a mere 10% had written policies for healthier food and beverage
services at meetings. Just 14% of participating workplaces made more than half of the food
and beverages choices available in vending machines, cafeterias, snack bars or other
purchase points healthier. Only 23% identified healthier food and beverages with signs and
symbols, and just 19% provided nutritional information (beyond standard information on
labels) for food and beverages sold. Although 46% provided information on the benefits of
healthy eating, only 26% offered or promoted on-site or nearby farmers’ markets and just 7%
subsidized or provided discounts on healthier foods and beverages sold. Environmental
factors at the workplace, such as time and costs constraints along with the quality of food can
negatively influence a worker’s eating choices (Watkins et al., 2008). As noted by the
National Prevention Council (2011), employers can assist workers in eating healthier through
making available affordable and healthy foods at the workplace (e.g., through policies, farm

103
to work programs and farmers’ markets) along with easy-to-understand nutritional
information at the point of purchase.
Physical Activity:
Only 20% of responding workplaces provided an on-site exercise facility, while 33% offered
subsidized or discounted cost of on-site or off-site exercise facilities. Approximately 28%
reported providing environmental supports (e.g. trails or walking tracks, maps of suitable
walking tracks, bicycle racks, a basketball court, open space designated for recreation, a
shower or changing facility), while 24% offered organized individual or group physical-
activity programs for employees. A mere 5% posted signs at elevators, stairwells, and other
locations that encourage employees to use the stairs. The written or online information about
the benefits of physical activity was offered more often (40%) than educational seminars,
subsidized assessments with follow-up counseling or free or subsidized self-management on
physical activity (20%-14%). Studies found that employees who received consultation and
were provided educational materials reported greater readiness to change their exercise
behavior than employees who did not (Mattke, Schyer & Van Busum, 2012). The National
Prevention Council (2011) has recommended that employers should adopt policies and
programs that promote physical activity such as access to fitness facilities, flex time and
changing facilities which can increase the number of employees who are physically active
during the day.

104
Weight Management:
A study conducted by Archer et al., (2011) identified six promising worksite practices that
were viable for employee weight loss. These are enhanced access to opportunities for
physical activity combined with: health education; exercise prescriptions; multicomponent
educational practices; weight loss competitions and incentives; and behavioral practices with
and without incentives. Approximately 35% of participants offered body fat assessments,
while 39% provided educational materials and 25% offered classes related to weight
management. Only 24% workplaces offered free or subsidized one-on-one or group lifestyle
counseling for employees who were overweight or obese. Additionally, 23% of workplaces
offered free or subsidized self-management programs for weight management.
Implementation of effective weight management programs has the potential to lower medical
costs and absenteeism associated with obesity, and to increase productivity (Archer et al.,
2011). These results show more opportunity for physical activity along with education and
that other weight-loss strategies need to be made available at Kentucky workplaces.
Stress Management:
According to the 2013 Staying@Work Survey, stress is the biggest lifestyle-risk issue in the
U.S. workplace. As noted by Wolever et al., (2012), stress-management programs should
have company leadership’s support and should be made easily accessible and convenient
through on-site locations and flexible time requirements. While a majority of responding
workplaces (63%) sponsored or organized a social event, only 32% of workplaces offered
work-life balance/life skills programs, and just 22% provided stress=management programs.
Twenty-two percent provided training to managers on stress identification and management
105
and 26% offered opportunities to employees to participate in organizational decisions related
to workplace issues affecting job stress. A small percentage of responding workplaces (10%)
reported having dedicated spaces where employees could engage in relaxation activities.
Efforts to provide stress-management programs and to train management on stress
identification must be accessible to improve the employee well-being and quality of life
(Towers Watson, 2013). Studies found that individuals using telephone-based counseling and
educational materials were twice as likely to practice stress management and showed a 6.1%-
risk reduction compared with nonparticipants (Mattke, 2012).
Depression:
U.S. businesses spend $2,184 or 48% more in medical costs on workers with depression than
on workers without (Goetzel, et al., 2012). While 58% of participants provided health
insurance coverage at no or low out-of-pocket cost to employees, only 6% of workplaces
offered trainings on depression to managers. And 19% percent of workplaces provided free
or subsidized clinical screening for depression (beyond HRAs).
High Blood Pressure:
Workers with high blood pressure pay 31.6% more in medical costs than employees without
high blood pressure (Goetzel, et al., 2012). Thirty-five percent of workplaces provided free
or subsidized blood pressure screenings (beyond HRAs) followed by direct feedback and
clinical referrals when appropriate. A slightly higher percentage of workplaces, 43%,
provided written and electronic information on the risk of high blood pressure to their
employees. About 25% of workplaces provided one-on-one or group counseling and follow-

106
up monitoring for employees with high blood pressure or pre-hypertension. Only 22% of
workplaces provided free or subsidized self-management programs for blood pressure
control. Twenty-one percent of workplaces had blood pressure monitoring devices available
with instructions for employees to monitor their blood pressure. A majority of workplaces
offered health insurance that covered blood pressure-control medications at no or low out-of-
pocket costs. Prevention of high blood pressure is more cost effective than treatment of high
blood pressure, yet only 18% of responding workplaces offered educational classes,
workshops or seminars on preventing and controlling high blood pressure.
High Cholesterol:
On the issue of cholesterol, 34% of workplaces provided free or subsidized cholesterol
screening (beyond HRAs) followed by direct feedback and clinical referral when needed.
Thirty-nine percent of workplaces provided information on the risk of high cholesterol
through a wide range of written and electronic communication. Just 22% of participating
workplaces offered one-on-one or group counseling and follow-up monitoring for
cholesterol. Only 21% of workplaces provided free or subsidized self-management programs
for cholesterol control to their employees. The good news is that 66% provided health
insurance coverage with no or low out-of-pocket costs for cholesterol control medications.
Prevention of high cholesterol is more cost effective than treatment of high cholesterol, yet
only 16% of responding workplaces provided educational workshops, seminars and classes
on preventing and controlling high cholesterol.

107
Diabetes:
Kentucky has the eighth-highest rate of diabetes in the U.S. (Kentucky Department for Public
Health, 2013). Workplaces were asked about their activities regarding diabetes. Thirty-seven
percent of workplaces provided diabetes information through a variety of written and
electronic communications to their employees. Thirty-two percent of workplaces provided
free or subsidized pre-diabetes and diabetes risk factor assessments and feedback to their
employees. These workplaces followed the assessment with blood glucose screening and
clinical referral when appropriate. Twenty-four percent of workplaces offered free or
subsidized self-management programs to help employees control their diabetes. The majority
of workplace health insurance, 64%, covered diabetes medication and supplies at no or low
out-of-pocket cost. A study conducted by Aldana, et al. (2005), determined that diabetes
prevention programs are effective in the workplace. Only 18% of workplaces provided
diabetes prevention seminars, classes and workshops.
Emergency Response to Heart Attack and Stroke:
To assess employee familiarity with signs and symptoms of a heart attack and stroke,
workplaces were asked if they had any information on their premises to which employees
could refer. Surprisingly, only 29% of workplaces had posters or fliers identifying the signs
and symptoms of a heart attack and stroke, and 27% went further to inform employees to
treat such cases as emergencies.
Quick response time decreases a patient’s hospitalization and recovery time (McGruder et al.,
2008, O’Brien et al., 2012). Workplaces were asked about the presence of an emergency
response plan, CPR training and placement of AED, and 51% of the workplaces had an

108
emergency plan for acute heart attack and stroke incidents. Fifty-six percent of workplaces
also had a response team in place for medical emergencies. Fifty-nine percent of workplaces
participated in CPR trainings that included AED provided by nationally recognized bodies.
One half of responding workplaces reported having one or more functioning AEDs. Almost
all of these workplaces provided information to their local Emergency Medical Service about
the presence of an AED in case of emergency response. And 89% of workplaces with
functioning AEDs reported having their units in places so that a victim could be reached
within 3-5 minutes of collapse. Most workplaces with functioning AEDs had posters, signs,
markers and other forms of communication indicating the location of AEDs. Almost all
workplaces routinely maintain their AEDs.
Lactation:
Lactation policies appear deficient in Kentucky workplaces. This is evident is the small
percentage of responding workplaces — only 11% — that had written breastfeeding policies.
About 43% of workplaces reported having a private space other than a restroom for breast
milk expression by their employees. About half of responding workplaces provided flexible
break times to nursing mothers to pump breast milk. However, only 9% of workplaces
provided breast pumps at their sites. Only 7% of workplaces provided free or subsidized
breastfeeding education classes or support groups. It came as no surprise that only 30% of
responding workplaces offered paid maternity leave separate from any accrued leave.
Employers can increase employee satisfaction and morale, lower absenteeism, decrease
turnover, and reduce insurance costs by supporting breastfeeding mothers in the workplace
(Mills, 2009).

109
Occupational Health and Safety:
Workplaces reported that to reduce injury and illness at the workplace 68% had written
injury and illness prevention programs. Furthermore, 43% of this group had employed an
occupational health and safety officer to promote these policies. And 93% of workplaces
encouraged employees to report injuries or near misses, while 79% provided opportunities
for employees to offer input on hazards and solutions. Similarly, 81% provided safety
training to all new employees. Among respondents, 63% provided paid time off to sick
employees or their dependents. Non-exempt employees received paid vacation or personal
days from 95% of workplaces. Regardless, a little more than one-third of responding
workplaces or 39% included safety and maintenance of job health in their business objectives
and or organizational mission. Health promotion and occupational health and safety when
integrated can create a “culture of health,” which would create synergy and enhance the
overall health and well-being of the workforce and prevent occupational injuries and illnesses
(Hymel, et al., 2011).
Vaccine Preventable Disease:
Providing vaccination opportunities and getting employees vaccinated ensures protection or
community immunity to employees. Community immunity prevents the spread of certain
infectious diseases among employees (Department of Health and Human Services, 2013;
Eash, 2009). Individuals are protected from illness and the consequences of illnesses when
they get vaccinated. Vaccinated employees have fewer loss-work days and are able to work
and provide for themselves and their families (Eash, 2009). Employer-offered health

110
insurance covered vaccinations at no or low-out-of pocket cost was offered, according to
77% of responding workplaces. Similarly, more than half of workplaces offered on-site
influenza vaccinations, while approximately 29% also offered other on-site vaccinations
beside the seasonal influenza vaccinations at no or low-out-of pocket cost to employees.
Fifty-five percent of workplaces promoted their influenza vaccinations through written or
electronic media to their employees.
Community Resources:
Among workplaces responding: 81% reported receiving health plan information, resources
and programs from health insurance companies; 45% reported receiving those from health
and wellness organizations; and 30% reported receiving those from other health-related
organizations. But only 7% of workplaces reported receiving health information and
resources from the State Department for Public Health. Insurance companies still lead in
providing technical support to workplaces. Fifty percent of workplaces reported receiving
technical assistance from insurance companies. Twenty-nine percent of workplaces reported
receiving technical support from health and wellness agencies with only 1% of workplaces
reporting receiving technical support from State Department for Public Health. The State
Department for Public Health may not have enough resources to meet the needs of most
workplaces, however, the department can partner with health and wellness agencies to
provide information, resources and technical support to workplaces. A pilot study, The Small
Worksite Wellness Project (SWWP), was conducted to match small businesses with existing
community wellness resources. The study found that employees found it helpful to know

111
about the community resources and reported less stress, sick time and fewer injuries during
the study period (Weed & Bras, 2013).
KDPH Chronic Disease:
Cancer:
Most workplaces offering health insurance policies to their employees cover cancer-
prevention programs with 92% reporting their polices covered breast, cervical and colorectal
cancer screenings at no or reduced costs and 53% reporting their policies offered paid time
off for preventive cancer screenings. Kentucky leads the nation in lung cancer deaths
(Kentucky Coordinated Chronic Disease Prevention and Health Promotion Program, 2012).
Screening may provide opportunity for early detection and treatment of lung cancer
(Diagnosing Lung Cancer - American Lung Association, n.d.). Surprisingly, only 42% of
workplaces reported communicating the importance of cancer screening to their employees.
Workplaces that provided the importance of cancer screenings to their employees did so
during open enrollment fairs, and with written and electronic communication.
Asthma and COPD:
Written policies regarding airborne particulate matter related to chemicals, dust, and other
possible workplace respiratory exposures were even. About half of responding workplaces
did have written policies. On the other hand, only 25% of workplaces had written policies on
asthma and COPD, including pest management, and 69%) health insurance policies that
cover asthma and COPD medications or inhalers with no or very low-out-pocket costs.
Workplaces in Kentucky thus place more emphasis on particulate matter than asthma and

112
COPD. Asthma is one of the top 10 most costly and prevalent health conditions associated
with presenteeism — the measurable extent to which health symptoms, conditions and
diseases adversely affect the work productivity of individuals who choose to remain at work
(Chapman, 2005). Health-promotion programs can also include disease management
elements that can aid individuals with asthma or other existing ailments through adherence to
treatment and patient self-management (Goetzel & Ozminowski, 2008).

113
LIMITATIONS
This study potentially had the following limitations:
• The response rate of 37% was a potential threat to external validity. The finding of the
study would have been different if all workplaces had responded.
• Some data may have been under- or over-reported due to the self-reporting nature of the
instrument.
• External validity may also have been affected by the respondents of the survey.
• The majority of respondents were Human Resources Personnel who may not be familiar
with health-promotion programs in their workplaces, thus resulting in response bias. Another
internal validity threat may have been recall bias. Respondents had to recall activities
conducted during the past 12 months on most questions.
• Several modules of the Health ScoreCard (Lactation Support, Occupational Health and
Safety, Vaccine Preventable Disease, and Community Resources) had not yet been validated.
This study was a pilot for these questions and revision of the questions may be deemed
necessary in the future.

114
CONCLUSION
Few workplaces in Kentucky have health promotion programs and even fewer have
comprehensive programs. More businesses rely on health insurance to treat chronic diseases
than health promotion programs or preventive services to reduce chronic diseases. Poor
lifestyle habits that contribute to chronic diseases are not being addressed at the majority of
Kentucky’s workplaces. Tobacco control, nutrition, physical activity, weight management
and stress management could all be improved through employee screenings with adequate
treatment and follow up, health education, links to related employee services, supportive
physical and social environments for health improvement, and the integration of health
promotion into the worksite culture.
Small companies were less likely to have a wellness program and less likely to have
intentions of starting a wellness program. A clearinghouse for resources needs to be
established for small companies along with training for employers so they can realize the
importance of prevention, both for human capital and financial capital.

115
RECOMMENDATIONS
Kyhealthnow 2019 Goals
*Kyhealthnow is Gov. Steve Beshear’s 2019 health goals for Kentucky. You can visit
kyhealthnow.com to view all seven of the health goals. These goals align with the
recommended strategies from this assessment (2013 Kentucky Worksite Health Assessment
Survey results).
*Goal: Reduce Kentucky’s smoking rate by 10%
Expand and actively enforce tobacco-free policies in all workplaces
Increase availability of smoking-cessation resources (telephone quit line, subsidized
cessation medication, cessation counseling) in all workplaces
Establish or increase incentives for current nonusers of tobacco and for current
tobacco users that currently are quitting in all workplaces
*Goal: Reduce the obesity rate among Kentuckians by 10%
Make affordable and healthy foods available at the workplace (e.g., through policies,
farm to work programs and farmers’ markets) along with easy-to-understand
nutritional information at the point of purchase
Work with public and private workplaces to adopt healthy concessions and vending
policies reflecting federal guidelines in all workplaces
Provide ready access to employees to stairwells at all workplaces
Develop initiatives to honor and recognize businesses and schools that provide
greater opportunities for physical activity
Employers should adopt policies and programs that promote physical activity such as
access to fitness facilities, flex time and restructuring the physical environment at
facilities to increase the number of employees who are physically active
All employers should offer enhanced access to opportunities for physical activity
combined with health education, exercise prescriptions, multicomponent educational
practices, weight loss competitions and incentives, and skill building opportunities
Increase the availability of body fat or other body-composition assessments
Increase access to opportunities for physical activity
Increase multicomponent educational practices, including weight-management
classes
Offer free or subsidized one-on-one or group counseling for weight management

116
Offer weight loss competitions and incentives
*Goal: Reduce Kentucky Cancer Deaths by 10%
Increase screening rates for colon, lung and breast cancer by 25% in accordance with
evidence-based guidelines in all workplaces
*Goal: Reduce Cardiovascular Deaths by 10%
Increase employee accessibility to blood pressure, cholesterol and diabetes screening
at the workplace
Offer educational classes, workshops or seminars on preventing and controlling high
blood pressure in all workplaces
Offer educational workshops, seminars and classes on preventing and controlling
high cholesterol in all workplaces
Offer educational workshops, seminars and classes on preventing and controlling
diabetes in all workplaces
Workplaces should partner and support the ongoing efforts of the Kentucky CARE
Collaborative, a statewide effort designed to provide blood pressure-awareness
education within communities
*Goal: Reduce by 25% the average number of poor mental health days of Kentuckians
Increase efforts to provide stress-management programs and to train management on
stress and depression identification in all workplaces
Stress management programs should have management support and should be made
easily accessible and convenient with on-site locations (when feasible) and flexible
time requirements in all workplaces
Organizational Support
Build employee health into your mission
Know the needs and interests of your employees
Establish an active health promotion committee; get expert advice when possible
Management should support wellness initiatives and serve as role models
Establish a “culture of health”
Small companies should seek community resources when available
Include families in wellness initiatives
Emergency Response to Heart Attack and Stroke
Provide more posters or fliers identifying the signs and symptoms of a heart attack
and stroke

117
Train employees to identify and treat individuals with signs and symptoms of a heart
attack and stroke as emergencies
Lactation
Provide written policies on breastfeeding
Provide a private area (other than a restroom) for breast milk expression
Provide flex time for breast milk expression
Increase employee accessibility to breastfeeding support groups through the
workplace
Occupational Health and Safety
Include safety and maintenance of job health in the company’s mission
Integrate health promotion and health protection (safety) to create a “culture of
health”
Vaccine Preventable Disease
Offer flu and other vaccinations on-site
Promote vaccination adherence through written or electronic media
Community Resources
Wellness resources and technical support from local, state and national agencies need
to be established to provide assistance in wellness efforts, especially for small
businesses
Cancer
Increase screening rates for colon, lung and breast cancer by 25% in accordance with
evidence-based guidelines in all workplaces
Asthma and COPD
Written policies need to be established for asthma and COPD in all workplaces
Offer educational classes, workshops or seminars on preventing and controlling
asthma and COPD in all workplaces

118
REFERENCES
Aldana, S.G., Barlow, M., Smith, R., Yanowitz, F. G., Adams, T., Loveday, L., Arbuckle, J.,
LaMonte, M. J. (2005). The diabetes prevention program: a worksite experience.
American Association of Occupation Health Nurses, 53(11), 499-505.
Archer, W.R., Batan, M.C., Buchanan, L.R., Soler, R. E., Ramsey, D. C., Kirchhofer, A.,
Reyes. (2011). Promising practices for the prevention and control of obesity in the
worksite. American Journal of Health Promotion, 25 (3), 12-26.
doi:10.4278/ajhp.080926-LIT-220
Baicker, K., Cutler, D., & Song, Z. (2010). Workplace wellness programs can generate
savings. Health affairs, 29(2), 1-8. doi:10.1377/hltaff.2009.0626
Benavides, A. D., & David, H. (2010). Local government wellness programs: A viable option
to decrease healthcare costs and improve productivity. Public Personnel
Management, 39(4), 291-306. doi:10.1177/009102601003900401
Brissette, I., Fisher, B., Spicer, D. A., & King, L. (2008). Worksite characteristics and
environmental and policy supports for cardiovascular disease prevention in New York
State. Preventing Chronic Disease, 5(2).
Centers for Disease Control and Prevention. (2008). Kentucky: Burden of Chronic Diseases.
Retrieved from http://www.cdc.gov/chronicdisease/states/kentucky.htm
Centers for Disease Control and Prevention. (2012). Chronic Diseases and Health
Promotion. Retrieved February 2014, from
http://www.cdc.gov/chronicdisease/overview/index.htm

119
Centers for Disease Control and Prevention. (2013a). Prevention Status Reports 2013:
Tobacco Use—Kentucky. Atlanta, GA: US Department of Health and Human
Services; 2014.
Centers for Disease Control and Prevention. (2013b). Prevention Research Centers: PRC
Uses The CDC Worksite Health ScoreCard in New Hampshire. (2013, June).
Retrieved February 10, 2014, from http://www.cdc.gov/prc/stories-prevention-
research/stories/new-hampshire-scorecard.htm
Chapman, L. S. (2005). Presenteeism and its role in worksite health promotion. American
Journal of Health Promotion, 19(4), :suppl 1-8. Retrieved from
http://www.ncbi.nlm.nih.gov/pubmed/15768928
Davis, L., Loyo, K., Glowka, A., Schwertfeger, R., Danielson, L., Brea, C., & Griffin-Blake,
S. (2009). A comprehensive worksite wellness program in Austin, Texas: partnership
between Steps to a Healthier Austin and Capital Metropolitan Transportation
Authority. Prev Chronic Dis, 6(2), A60.
Department of Health and Human Services. (2013). Community immunity. Retrieved March
11, 2014 from http://www.vaccine.gov
Diagnosing Lung Cancer - American Lung Association. (n.d.). Retrieved March 3, 2014,
from http://www.lung.org/lung-disease/lung-cancer/learning-more-about-lung-
cancer/diagnosing-lung-cancer/
Eash, B. A. (2009). Everyone benefits from vaccinations. Materials and Management in
Health Care, 18(11), 36.
Fabius, R., Thayer, R. D., Konicki, D. L., Yarborough, C. M., Peterson, K. W., Isaac, F., ... &
Dreger, M. (2013). The Link Between Workforce Health and Safety and the Health of

120
the Bottom Line: Tracking Market Performance of Companies That Nurture a
“Culture of Health”. Journal of Occupational and Environmental Medicine, 55(9),
993-1000.
Faghri, P. D., Kotejoshyer, R., Cherniack, M., Reeves, D., & Punnett, L. (2010). Assessment
of a worksite health promotion readiness checklist. Journal of Occupational and
Environmental Medicine, 52(9), 893-899.
Felter, E. M., Nolan, B. A., Colombi, A., Albert, S. M., & Pringle, J. L. (2013). We're
Working Hard, but Is It Hardly Working? Why Process Is Critical in the Delivery of
Worksite Health Promotion Programs. Journal of Occupational and Environmental
Medicine, 55(5), 586-592. doi:10.1097/JOM.0b013e3182882c17
Gates, D. M., & Brehm, B. J. (2010). Challenges of a worksite health promotion
project. AAOHN journal: official journal of the American Association of
Occupational Health Nurses, 58(3), 117-122.
Goetzel, R. Z. (2005). Policy and practice working group examining the value of integrating
occupational health and safety and health promotion programs in the
workplace. National Institute of Occupational Safety and Health (NIOSH), 211-2004.
Goetzel, R. Z., & Ozminkowski, R. J. (2008). The health and cost benefits of work site
health-promotion programs. Annual Review of Public Health, 29, 303-323.
doi:10.1146/annurev.publhealth.29.020907.090930
Goetzel, R. Z., Pei, X., Tabrizi, M. J., Henke, R. M., Kowlessar, N., Nelson, C. F., Metz, R.
D. (2012). Ten modifiable health risk factors are linked to more than one-fifth of
employer-employee health care spending. Health Affairs, 31(11), 2474-2484. doi:
10.1377/hlthaff.2011.0819

121
The growing crisis of chronic disease in the United States (n.d.). Partnership to Fight
Chronic Disease. Retrieved January 30, 2014, from
http://www.fightchronicdisease.org/sites/fightchronicdisease.org/files/docs/GrowingC
risisofChronicDiseaseintheUSfactsheet_81009.pdf
Hymel, P. A., Loeppke, R. R., Baase, C. M., Burton, W. N., Hartenbaum, N. P., Hudson, T.
W., ...Larson, P. W. (2011). Workplace Health Protection and Promotion: A new
pathway for a healthier—and safer—workforce. Journal of Occupational and
Environmental Medicine, 53(6), 695-702. doi: 10.1097/JOM.0b013e31822005d0
Jung, J., Nitzsche, A., Neumann, M., Wirtz, M., Kowalski, C., Wasem, J., ...Pfaff, H. (2010).
The Worksite Health Promotion Capacity Instrument (WHPCI): Development,
validation and approaches for determining companies' levels of health promotion
capacity. BMC Public Health, 10(1), 550. doi:10.1186/1471-2458-10-550
Kansas City: Healthiest Employer. (2011). Research Findings from Kansas City Employers.
Kansas Department of Health & Environment (KDHE) (2014). Building Wellness into the
Workplace: The BIG Picture.
Kentucky Department for Public Health (KDPH ) (2013). Unbridled Health: A plan for
Coordinated Chronic Disease Prevention and Health Promotion (2012-2016).
Linnan, L., Bowling, M., Childress, J., Lindsay, G., Blakey, C., Pronk, S., …Royall, P.
(2008). Results of the 2004 national worksite health promotion survey. Journal
Information, 98(8). doi:10.2105/AJPH.2006.100313
Lovely, T., & Watkins, C. (2012). Kentucky Worksite Wellness Tax Credit: A Health Impact
Assessment. Kentucky Department for Public Health.

122
Matson-Koffman, Dyann M (2012). The CDC Worksite Health Scorecard: An assessment
tool for employers to prevent heart disease, stroke, & related health conditions.
Atlanta, GA: National Center for Chronic Disease Prevention and Health Promotion,
Division for Heart Disease and Stroke Prevention.
Mattke, S., Liu, H., Caloyeras, J. P., Huang, C. Y., Van Busum, K. R., Khodyakov, D., &
Shier, V. (2013). Workplace Wellness Programs Study. RAND Corporation.
Mattke, S., Schnyer, C., Van Busum, K. (2012) A Review of the U.S. Workplace Wellness
Market. RAND Corporation.
McGruder, H. E., Greenlund, K. J., Malarcher, A. M., Antoine, T. L., Croft, J. B., & Zheng,
Z. J. (2008). Racial and ethnic disparities associated with knowledge of symptoms of
heart attack and use of 911: National Health Interview Survey, 2001. Ethnicity and
Disease, 18(2), 192-197.
McPeck, W., Ryan, M., & Chapman, L. S. (2009). Bringing wellness to the small employer.
American Journal of Health Promotion, 23(5), 1-12.
doi:http://dx.doi.org/10.4278/ajhp.23.5.tahp
Michaels, C. N., & Greene, A. M. (2013). Worksite wellness increasing adoption of
workplace health promotion programs. Health Promotion Practice, 14(4), 473-479.
doi:10.1177/1524839913480800
Mills, S.P. (2009). Workplace Lactation Programs: A critical element for breastfeeding
mothers’ success. American Association of Occupational Health Nurses. 57(6), 227-
231. doi: 10.3958/08910162-20090518-02
National Prevention Council, National Prevention Strategy, Washington, DC: U.S.
Department of Health and Human Services, Office of the Surgeon General, 2011.

123
National Conference of State Legislature (2012, December). State Employee Health Benefits
NCSL. Retrieved February 2014, from http://www.ncsl.org/research/health/state-
employee-health-benefits-ncsl.aspx.
O’Brien, W., Crimmins, D., Donaldson, W., Risti, R., Clarke, T. A., Whyte, S., & Sturm, J.
(2012). FASTER (Face, Arm, Speech, Time, Emergency response): Experience of
Central Coast Stroke Services implementation of a pre-hospital notification system
for expedient management of acute stroke. Journal of Clinical Neuroscience, 19(2),
241-245
Parkinson, M. D. (2013). Employer Health and Productivity Roadmap™ Strategy. Journal of
Occupational and Environmental Medicine, 55, S46-S51.
doi:10.1097/JOM.0000000000000049
Sparling, P. B. (2010). Worksite health promotion: principles, resources, and challenges.
Preventing Chronic Disease, 7(1). Retrieved from
http://www.cdc.gov/pcd/issues/2010/jan/09_0048.htm
Task Force on Community Preventive Services. (2010). Recommendations for worksite-
based interventions to improve workers' health. American journal of preventive
medicine, 38(2 Suppl), S232.
Towers Watson, & National Business Group on Health (2013). 2013/2014 Staying@Work
U.S. Executive Summary Report. Retrieved February 2014, from
http://www.towerswatson.com/en-US/Insights/IC-Types/Survey-Research-
Results/2013/09/2013-2014-stayingatwork-us-executive-summary-report
Trust for America's Health (2013. January). Issue brief: Provide Workplace Wellness
Programs To All American Workers. Retrieved from
124
http://healthyamericans.org/assets/files/Provide%20Workplace%20Wellness%20Prog
rams03.pdf
United Health Foundation (2013). America's Health Rankings®
. Retrieved February 2014,
from http://www.americashealthrankings.org/rankings
Watkins, C., Lartey, G., Golla, V. & Khubchandani, J. (2008) Workers’ Perceptions;
Environmental factors influencing obesity at the workplace. American Journal of
Health Studies, 23(2), 74-80.
Weed, W. S., & Bras, A. (2013). Very small businesses: Increasing wellness program
resources (Issue No. 34). Retrieved February 2014
from http://www.uml.edu/Research/Centers/CPH-NEW/emerging-topics/Issue-
34.aspx
Wise, M., & Signal, L. (2000). Health promotion development in Australia and New
Zealand. Health Promotion International, 15(3), 237-248.
doi:10.1093/heapro/15.3.237
Wolever, R.Q., Bobinet, K.J., McCabe, K., Mackenzie, E.R., Fekete, E., Kusnick, C.A.,
Baime, M. (2012). Effective and viable mind-body reduction in the workplace: a
randomized controlled trial. Journal of Occupational Health Psychology, 17 (2), 246-
258. doi: 10.1037/a0027278
Recommended