Research ArticleSimultaneous Estimation of Four Antitussive Components fromHerbal Cough Syrup by HPTLC
Sharada L. Deore, Payal S. Jaju, and Bhushan A. Baviskar
Government College of Pharmacy, Kathora Naka, Amravati 444604, India
Correspondence should be addressed to Sharada L. Deore; sharudeore [email protected]
Received 10 June 2014; Accepted 16 August 2014; Published 28 October 2014
Academic Editor: Jiiang H. Jeng
Copyright © 2014 Sharada L. Deore et al. This is an open access article distributed under the Creative Commons AttributionLicense, which permits unrestricted use, distribution, and reproduction in any medium, provided the original work is properlycited.
A new simple, rapid, selective and precise high performance thin layer chromatographic (HPTLC) method has been developedfor simultaneous estimation of vasicine, glycyrrhizin, eugenol, and cineole in herbal cough syrup.The retention factors of vasicine,glycyrrhizin, eugenol, and cineole are 0.53, 0.44, 0.75, and 0.77, respectively. Chromatography was performed on 60F
254percolated
TLC plate using n-hexane : ethyl acetate : glacial acetic acid (8.5 : 1.0 : 0.5 v/v/v). Methods are validated according to ICH guidelinesand can be adopted for the routine analysis of vasicine, glycyrrhizin, eugenol and cineole in herbal cough syrup.
1. Introduction
Herbal cough syrup is a pharmaceutical dosage form used totreat coughing and related conditions. Many of these herbalor ayurvedic cough syrups are incorporated with coughsuppressants or expectorants from vasaka, liquorice, tulsi,ginger, kantkari, black pepper, camphor, and many more [1].Out of these plants, constituents from vasaka, liquorice, tulsiand ginger are chosen for simultaneous estimation.
Vasaka is perennial, evergreen shrub of biological sourceAdhatoda vasica belonging to family Acanthaceae. It containsquinazoline alkaloids like vasicine and vasicinone and alsoessential oil. Vasicine present in the leaves possesses respira-tory stimulant activity and induces bronchodilation as well asrelaxation of the tracheal muscle. It offered significant protec-tion against histamine induced bronchospasm [2]. Liquoriceis root of Glycerrhiza glabra belonging to family Legumi-nosae. It contains majorly triterpenoid saponin glycyrrhizinand few flavonoids. Glycyrrhizin exerts antitussive effect bystimulating salivation and inducing amore frequent swallow-ing reflex [3]. Tulsi is evergreen plant of Ocimum sanctumbelonging to family Lamiaceae. It contains volatile oil 0.4–0.8% comprising eugenol and beta-caryophyllene and manyother monoterpenes. Eugenol shows an antitussive effect bycentral action mediated through both opioid and GABAer-gic system [4]. Ginger is dried as well as fresh rhizomes
of Zingiber officinalis belonging to family Zingiberaceae.It contains 1–4% volatile oil containing cineole, zingibe-rene, borneol, and resins like gingerol and shogaol. Cineoleshows antitussive effect by suppressing the cough reflexthrough direct action of cough centre in the medulla [5].
According to World Health Organisation’s (WHO) stan-dardisation guidelines, development and validation of analyt-ical methods are needed to help in discovery, development,and marketing of quality herbal formulations. The literature[6–9] revealed that various TLC methods are available forestimation of vasicine, glycyrrhizin, eugenol, and cineole asindividual component only; hence, in present work attempthas beenmade to develop simple, rapid, accurate, precise, andeconomical method for simultaneous estimation of all thesefour constituents in herbal cough syrup.
HPTLC is preferred over HPLC because HPTLC offersvisual inspection throughout the process, less solvent con-sumption, multiple choices of fresh stationary phases, fastersimultaneous estimation of many compounds with goodanalytical precision, and accuracy within less time.
2. Experimental
2.1. Reagents and Materials. All chemicals and solvents usedwere of AR and HPLC grade (E. Merck, Mumbai, India).
Hindawi Publishing CorporationInternational Scholarly Research NoticesVolume 2014, Article ID 976264, 7 pageshttp://dx.doi.org/10.1155/2014/976264

2 International Scholarly Research Notices
N
N
OH
OH
H3C
H3CHOHO
HOHO O
O
OO
OO
O
CH2
CH3
CH3
COOH
HOOC
HOOC
H
H
H
HO
Glycyrrhizin Vasicine Eugenol Cineole
Figure 1
Marker standard vasicine, glycyrrhizin, eugenol, and cineole(Figure 1) were obtained as gift sample from Natural Reme-dies, Bangalore, India. TLC aluminium plates precoated withsilica gel 60F254 (20 cm × 20 cm, 0.2mm thick) were from E.Merck, Darmstadt, Germany.
2.2. Instrumentation. The method has been developed onCamag HPTLC system (Camag, Muttenz, Switzerland) con-sisting of twin trough chamber, Linomat V applicator, TLCscanner III, andWinCATS software version 1.4.4. Separationand identification of vasicine, glycyrrhizin, eugenol, andcineole were performed on aluminium backed silica gel60F254 (20 cm × 10 cm of plate size, layer thickness 0.2mm).
2.3. Chromatographic Conditions. Standard solutions of vas-icine (99%), glycyrrhizin (98%), eugenol (98%), and cineole(98%) were prepared either separately or in a mixture ata concentration of 1mgmL each in absolute methanol.Ultrasonication of mixture was required to ensure completedissolution. The experiment was performed on a silica gel60F254 (0.2mm thickness) HPTLC plates (20 × 10 cm).Samples were applied by Linomat-V applicator to the platesas 4mm bands with 4mm distance. Many mobile phasecompositions from solvents toluene, ethyl acetate, n-hexane,methanol, glacial acetic acid, and water were tried. Finallythe plates were developed by the ascending technique, in atwin trough glass chamber with a stainless steel lid, usingan optimised mobile phase composed of n-hexane : ethylacetate : glacial acetic acid (8.5 : 1 : 0.5 v/v/v). The chambersaturation time was kept as 20min. After development, plateswere driedwith a hot hair dryer; the spots which separated onplate were visualised when it was placed in iodine chamberand then scanned with a TLC Scanner, using WinCATSsoftware in absorbance mode, with slit dimensions 3.00 ×0.45mm.The detection wavelength 300 nmwas selected.TheRf values for vasicine, glycyrrhizin, eugenol, and cineole were0.53, 0.44, 0.75, and 0.77, respectively, as shown in Figure 2.
2.4. Quantification of Vasicine, Glycyrrhizin, Eugenol, andCineole through Calibration Curve. All the standards werespotted in triplicate on 20 × 10 cm TLC plates for preparingsix-point linear calibration curves. The calibration graph was
E1 E2 E3 E4 E5 C1 C2 C3 C4 C5 G1 G2 G3 G4 G5 V1 V2 V3 V4 V5 A
Figure 2:HPTLCplate showing simultaneous estimation of eugenol(E1–E5), cineole (C1–C5), glycyrrhizin (G1–G5), vasicine (V1–V5),and adulsa cough syrup (A).
plotted using the concentration versus average peak areaat 300 nm for all standards. Peak area and concentrationdata were treated by linear least-squares regression analysis.Various standard dilutions of vasicine, glycyrrhizin, eugenol,and cineole were applied on TLC plate, developed, andscanned to know linearity range with reference to peak area.
2.5. Validation. As per ICH guidelines the method is vali-dated for linearity, accuracy, precision, LOD, LOQ, rugged-ness, and robustness [10].
(i) Linearity: standard stocks of 1mgmL−1 of vasicine,glycyrrhizin, eugenol, and cineole were prepared anddiluted to appropriate concentrations. The linearitywas evaluated using linear least-squares regressionanalysis for generation of calibration curve. Theregression equation with slope, intercept, and coeffi-cient of correlation was calculated (Table 1).
(ii) Accuracy (recovery): the accuracy of the methodwas assessed by spiking preanalyzed samples withknown amounts of standard vasicine, glycyrrhizin,eugenol, and cineole solution and then reanalysed bythe HPTLC method. The spiking was done at threedifferent concentration levels and average percentrecovery at each concentration level was calculated(Table 1).
International Scholarly Research Notices 3
Table 1:Method validation parameters for quantification of vasicine, glycyrrhizin, eugenol, and cineole in herbal cough syrup by the proposedHPTLC method.
Validation parameters Vasicine Glycyrrhizin Eugenol CineoleCorrelation coefficient, 𝑛 = 3 0.99 0.99 0.99 0.97Linearity range (ng/spot), 𝑛 = 3 300–900 1000–5000 400–1000 2000–10,000Rf 0.53 0.44 0.75 0.77Limit of detection (ng/spot), 𝑛 = 3 45 105 60 225Limit of quantification (ng/spot), 𝑛 = 3 125 350 175 800Instrumental precision (RSD), 𝑛 = 6 0.58 0.48 0.35 0.47Method precision (RSD), 𝑛 = 6 0.72 0.59 0.42 0.58Specificity Specific Specific Specific SpecificRobustness (RSD), 𝑛 = 3 0.92 0.94 0.85 0.92
−0.07 0.13 0.33 0.53 0.73 0.93
800
700
600
500
400
300
200
100
0
(AU
)(A
U)
(AU
)
Vasicine
2500
2000
1500
1000
500
0
0.00
50.00
100.00
150.00
200.00
250.00
300.00
350.00
400.00
450.00
(ng)
0.00
50.00
100.00
150.00
200.00
250.00
300.00
350.00
400.00
450.00
(ng)
100
80
90
70
60
50
40
30
20
10
0
Track 19, ID: standard 4
600.0
400.0
200.0
0.0−0.20
0.000.20
0.400.60
0.801.00
1.20 0.0
50.0
100.0
150.0
200.0
All tracks at 300nm
(AU
)600.0
400.0
200.0
0.0
(AU
)
(mm)
Substance: vasicine at 300nm. Regression mode: linearr = 0.99665, sdv = 4.65%
Substance: vasicine at 300nm. Regression mode: linearr = 0.99972, sdv = 1.33%Y = 7.573 + 0.185 ∗ X,Y = 184.056 + 4.647 ∗ X,
Rf
Rf
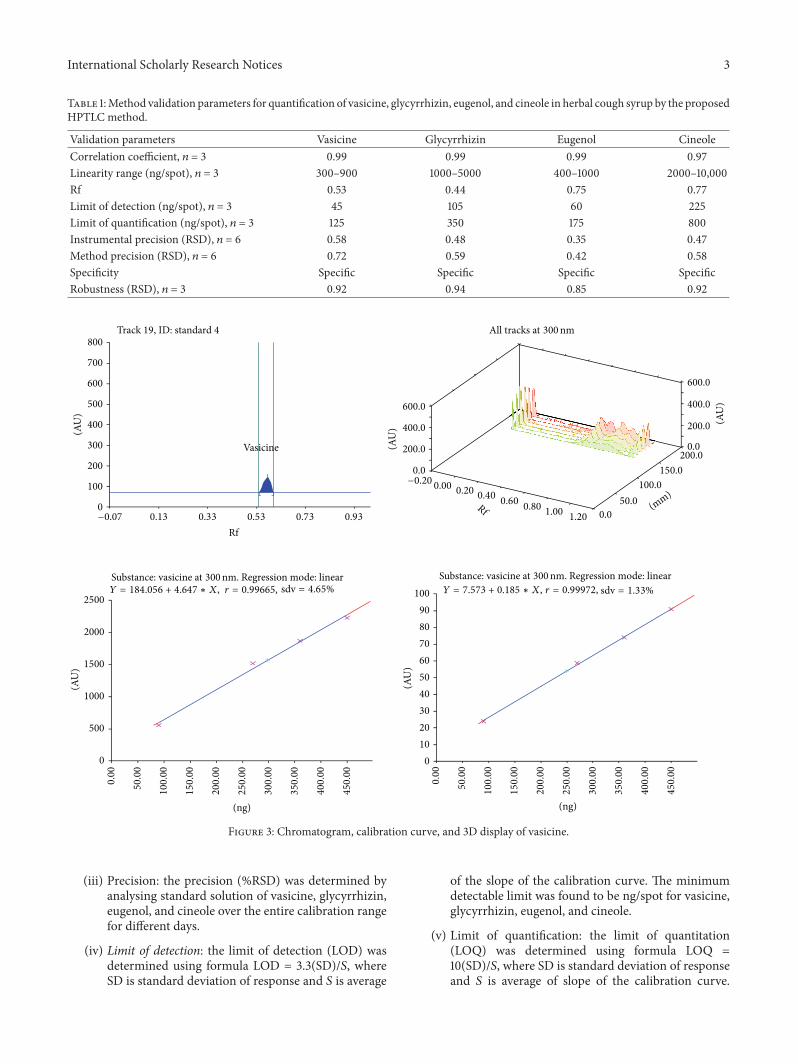
Figure 3: Chromatogram, calibration curve, and 3D display of vasicine.
(iii) Precision: the precision (%RSD) was determined byanalysing standard solution of vasicine, glycyrrhizin,eugenol, and cineole over the entire calibration rangefor different days.
(iv) Limit of detection: the limit of detection (LOD) wasdetermined using formula LOD = 3.3(SD)/𝑆, whereSD is standard deviation of response and 𝑆 is average
of the slope of the calibration curve. The minimumdetectable limit was found to be ng/spot for vasicine,glycyrrhizin, eugenol, and cineole.
(v) Limit of quantification: the limit of quantitation(LOQ) was determined using formula LOQ =10(SD)/𝑆, where SD is standard deviation of responseand 𝑆 is average of slope of the calibration curve.

4 International Scholarly Research Notices
(ng) (ng)
500
450
400
350
300
250
200
150
100
50
0
(AU
)(A
U)
(AU
)
−0.07 0.13 0.33 0.53 0.73 0.93
160
140
120
100
80
60
40
20
0
0.00 20.00 40.00 60.00 80.00 100.00 120.00 140.00 0.00 20.00 40.00 60.00 80.00 100.00 120.00 140.00
5000
4500
4000
3500
3000
2500
2000
1500
1000
500
0
Glycyrrhizine
Track 13, ID: standard 3
−0.200.00 0.20
0.400.60
0.801.00
1.20
All tracks at 300nm
600.0
400.0
200.0
0.0
(AU
)
600.0
400.0
200.0
0.0
(AU
)
0.0
50.0
100.0
150.0
200.0
(mm)
Regression mode: linear Regression mode: linearY = 20.172 + 0.820 ∗ X, r = 0.99626, sdv = 4.08% Y = 334.224 + 27.668 ∗ X, r = 0.99643, sdv = 4.51%
Substance: glycyrrhizine at 300nm. Substance: glycyrrhizine at 300nm.
RfRf
Figure 4: Chromatogram, calibration curve, and 3D display of glycyrrhizin.
The minimum quantified limit was found to beng/spot for vasicine, glycyrrhizin, eugenol, and cine-ole. It was observed that other constituents presentin the formulation did not interfere either with thepeak of vasicine, glycyrrhizin, eugenol, or cineole.Therefore the developed method is specific.
(vi) Ruggedness of the method:it expresses the precisionwithin laboratories variations like different analysts.Ruggedness of themethodwas assessed by spiking thestandards 5 times with different analyst by using thesame equipment.
(vii) Robustness of the method: by introducing smallchanges in the mobile phase composition, develop-ment distance, mobile phase volume, and durationof chamber saturation, the effects on the results wereexamined.
3. Results and Discussion
HPTLC method was optimized with view to quantify allfour constituents in liquid herbal cough syrup. As far asindividual estimation of vasicine, glycyrrhizin, eugenol, andcineole by chromatographicmethods is concerned, a number
of solvent systems have been reported. However, there hasnot been cited a single report for separation of vasicine,glycyrrhizin, eugenol, and cineole simultaneously in a singlesolvent system. n-Hexane : ethyl acetate : glacial acetic acidin ratio of 8.5 : 1.0 : 0.5 v/v/v shown good resolution forvasicine, glycyrrhizin, eugenol, and cineole with Rf valueof 0.53, 0.44, 0.75, and 0.77, respectively. Well-defined spotswere obtained after chamber was saturated for 20min atroom temperature. TLC plate was visualized when placedin iodine chamber without derivatization. The identity ofvasicine, glycyrrhizin, eugenol, and cineole was confirmed bycomparing chromatogram of standard vasicine, glycyrrhizin,eugenol, and cineole with that of extract and by comparingretention factor of reference with standard.
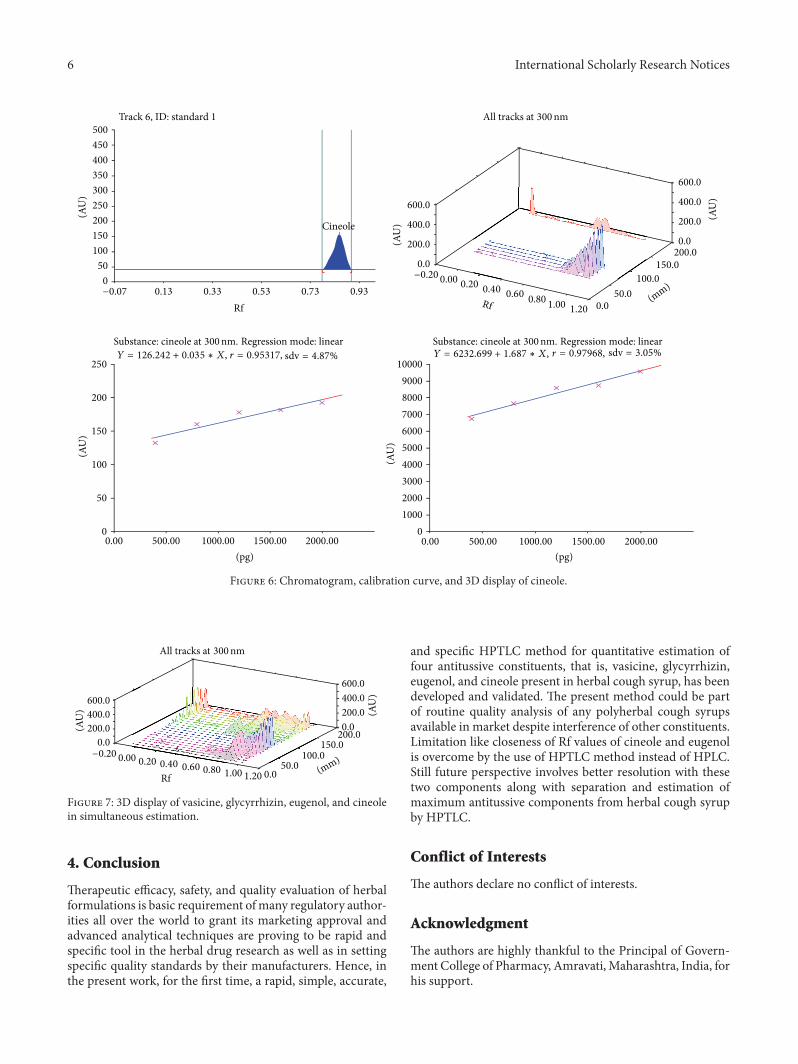
Calibration plot shown in Figures 3, 4, 5, and 6 indicatesthat the response is linear function of concentration inthe range of 300–900, 1000–5000, 400–1000, and 2000–10,000 ng/spot for vasicine, glycyrrhizin, eugenol, and cine-ole, respectively. The correlation coefficient, intercept, andslope for vasicine, glycyrrhizin, eugenol, and cineole are givenin Table 1.
As per validation results given in Table 2, lower %RSD(<2%) suggests precision of the method. The good recoverywithin acceptable limit indicates accuracy of method. The

International Scholarly Research Notices 5
−0.07 0.13 0.33 0.53 0.73 0.93
500
450
400
350
300
250
200
150
100
50
0
(AU
) Eugenol
Track 3, ID: standard 3
20000
15000
10000
5000
00.00 2.00 4.00 6.00 8.00 10.00 12.00 14.00
350
300
250
200
150
100
50
0
(ng)0.00 2.00 4.00 6.00 8.00 10.00 12.00 14.00
(ng)
(AU
)
(AU
)
600.0
400.0
200.0
0.0
600.0
400.0
200.0
0.0
−0.200.000.20
0.400.60
0.801.001.20 0.0
50.0
100.0
150.0
200.0
All tracks at 300nm
(AU
) (AU
)
(mm)
Substance: eugenol at 300nm. Regression mode: linear Substance: eugenol at 300nm. Regression mode: linearY = 3437.825 + 965.974 ∗ X, r = 0.99167, sdv = 5.55% Y = 83.972 + 16.016 ∗ X, r = 0.98030, sdv = 7.55%
Rf
Rf
Figure 5: Chromatogram, calibration curve, and 3D display of eugenol.
Table 2: Parameters used for ruggedness and robustness.
Sr. number Parameter Initial condition Changed condition Effect
1 Mobile phasen-Hexane : ethyl
acetate : glacial acetic acid(8.5 : 1 : 0.5)
n-Hexane : ethylacetate : glacial acetic acid
(8 : 1 : 1)
Very minute effect on the resolution,quantitative estimations, Rf, and peak
area/height
2 Development distance 4 cm 3 cmVery minute effect on the resolution,quantitative estimations, Rf, and peak
area/height
3 Temperature 27 ± 3∘C (winter) 35 ± 3∘C (summer) Affects greatly the resolution, quantitativeestimations, Rf, and peak area/height
4 Tank saturation time 25min 30minVery minute effect on the resolution,quantitative estimations, Rf, and peak
area/height
5 Analyst Analyst 1 Analyst 2Very minute effect on the resolution,quantitative estimations, Rf, and peak
area/height
limit of detection (LOD) and limit of quantitation (LOQ) ofvasicine, glycyrrhizin, eugenol, and cineole show adequatesensitivity of method. Good correlation of 0.99, 0.99, 0.99,and 0.97 was obtained between the standard and sample ofvasicine, glycyrrhizin, eugenol, and cineole, respectively.
Ruggedness and robustness parameters confirmed thatthe method is able to withstand minor experimental changes(Table 2). It was observed that other constituents present inthe formulations did not interfere with any of the peaks of allfour constituents (Figure 7); therefore the method is specific.
6 International Scholarly Research Notices
500
450
400
350
300
250
200
150
100
50
0
−0.07 0.13 0.33 0.53 0.73 0.93
(AU
)(A
U)
(AU
)
Cineole
Track 6, ID: standard 1
250
200
150
100
50
00.00 500.00 1000.00 1500.00 2000.00
(pg) (pg)
10000
9000
8000
7000
6000
5000
4000
3000
2000
1000
00.00 500.00 1000.00 1500.00 2000.00
All tracks at 300nm
600.0
400.0
200.0
0.0
600.0
400.0
200.0
0.0(AU
)
(AU
)
−0.200.00
0.200.40
0.600.80
1.001.20 0.0
50.0
100.0
150.0
200.0
(mm)
Substance: cineole at 300nm. Regression mode: linear Substance: cineole at 300nm. Regression mode: linearY = 126.242 + 0.035 ∗ X, r = 0.95317, sdv = 4.87% Y = 6232.699 + 1.687 ∗ X, r = 0.97968, sdv = 3.05%
Rf Rf
Figure 6: Chromatogram, calibration curve, and 3D display of cineole.
600.0
400.0
200.0
0.0
−0.200.00 0.20 0.40 0.60 0.80
1.201.00 0.050.0
100.0
150.0200.0
All tracks at 300nm
(AU
)
600.0
400.0
200.0
0.0
(AU
)
(mm)
Rf
Figure 7: 3D display of vasicine, glycyrrhizin, eugenol, and cineolein simultaneous estimation.
4. Conclusion
Therapeutic efficacy, safety, and quality evaluation of herbalformulations is basic requirement ofmany regulatory author-ities all over the world to grant its marketing approval andadvanced analytical techniques are proving to be rapid andspecific tool in the herbal drug research as well as in settingspecific quality standards by their manufacturers. Hence, inthe present work, for the first time, a rapid, simple, accurate,
and specific HPTLC method for quantitative estimation offour antitussive constituents, that is, vasicine, glycyrrhizin,eugenol, and cineole present in herbal cough syrup, has beendeveloped and validated. The present method could be partof routine quality analysis of any polyherbal cough syrupsavailable in market despite interference of other constituents.Limitation like closeness of Rf values of cineole and eugenolis overcome by the use of HPTLC method instead of HPLC.Still future perspective involves better resolution with thesetwo components along with separation and estimation ofmaximum antitussive components from herbal cough syrupby HPTLC.
Conflict of Interests
The authors declare no conflict of interests.
Acknowledgment
The authors are highly thankful to the Principal of Govern-ment College of Pharmacy, Amravati,Maharashtra, India, forhis support.

International Scholarly Research Notices 7
References
[1] N. Chattopadhyay, G. Nosal’Ova, S. Saha, S. S. Bandyopadhyay,D. Fleskova, and B. Ray, “Structural features and antitussiveactivity of water extracted polysaccharide from Adhatodavasica,” Carbohydrate Polymers, vol. 83, no. 4, pp. 1970–1974,2011.
[2] J. Kamei, A. Saitoh, T. Asano et al., “Pharmacokinetic andpharmacodynamic profiles of the antitussive principles of Gly-cyrrhizae radix (licorice), a main component of the Kampopreparation Bakumondo-to (Mai-men-dong-tang),” EuropeanJournal of Pharmacology, vol. 507, no. 1–3, pp. 163–168, 2005.
[3] P. Prakash andN. Gupta, “Therapeutic uses ofOcimum sanctumLinn (tulsi) with a note on eugenol and its pharmacologicalactions: a short review,” Indian Journal of Physiology andPharmacology, vol. 49, no. 2, pp. 125–131, 2005.
[4] P. D. Nadig and S. Laxmi, “Study of anti-tussive activityof Ocimum sanctum linn in guinea pigs,” Indian Journal ofPhysiology and Pharmacology, vol. 49, no. 2, pp. 243–245, 2005.
[5] F. Sayyad Sadikali and S. Chaudhary R, “Isolation of volatileoil from some plants of zingiberaceae family and estimation oftheir antibacterial potential,” Journal of Current PharmaceuticalResearch, vol. 4, no. 1, pp. 1–3, 2010.
[6] N. A. Patel, M. Patel, and R. P. Patel, “Standardization andevaluation of polyherbal cough syrup,” The Indian Pharmacist,vol. 5, no. 45, pp. 29–35, 2012.
[7] J. A. J. Sunilson, K. Anandarajagopal, A. Khan, K. Pasha, Q.B. Hassan, and P. V. Kunaraja, “Antihistaminic evaluation offormulated polyherbal cough syrup,” Journal ofMedicinal PlantsResearch, vol. 4, no. 14, pp. 1482–1485, 2010.
[8] A. Meher, T. K. Mohapatra, R. R. Nayak et al., “Antitussiveevaluation of formulated polyherbal cough syrup,” Journal ofDrug Delivery &Therapeutics, vol. 2, no. 5, pp. 61–64, 2012.
[9] V. V. Kadlag, V. S. Kasture, S. A. Gosavi, and R. D. Bhalke,“Standardization of marketed adulsa syrup containing vasakaby high performance thin layer chromatography,”Asian Journalof Chemistry, vol. 23, no. 5, pp. 1917–1921, 2011.
[10] “Q2 (R1) validation of analytical procedure: text and method-ology,” in Proceedings of the 2005 International Conference onHarmonization, November 2005.

Submit your manuscripts athttp://www.hindawi.com
Stem CellsInternational
Hindawi Publishing Corporationhttp://www.hindawi.com Volume 2014
Hindawi Publishing Corporationhttp://www.hindawi.com Volume 2014
MEDIATORSINFLAMMATION
of
Hindawi Publishing Corporationhttp://www.hindawi.com Volume 2014
Behavioural Neurology
EndocrinologyInternational Journal of
Hindawi Publishing Corporationhttp://www.hindawi.com Volume 2014
Hindawi Publishing Corporationhttp://www.hindawi.com Volume 2014
Disease Markers
Hindawi Publishing Corporationhttp://www.hindawi.com Volume 2014
BioMed Research International
OncologyJournal of
Hindawi Publishing Corporationhttp://www.hindawi.com Volume 2014
Hindawi Publishing Corporationhttp://www.hindawi.com Volume 2014
Oxidative Medicine and Cellular Longevity
Hindawi Publishing Corporationhttp://www.hindawi.com Volume 2014
PPAR Research
The Scientific World JournalHindawi Publishing Corporation http://www.hindawi.com Volume 2014
Immunology ResearchHindawi Publishing Corporationhttp://www.hindawi.com Volume 2014
Journal of
ObesityJournal of
Hindawi Publishing Corporationhttp://www.hindawi.com Volume 2014
Hindawi Publishing Corporationhttp://www.hindawi.com Volume 2014
Computational and Mathematical Methods in Medicine
OphthalmologyJournal of
Hindawi Publishing Corporationhttp://www.hindawi.com Volume 2014
Diabetes ResearchJournal of
Hindawi Publishing Corporationhttp://www.hindawi.com Volume 2014
Hindawi Publishing Corporationhttp://www.hindawi.com Volume 2014
Research and TreatmentAIDS
Hindawi Publishing Corporationhttp://www.hindawi.com Volume 2014
Gastroenterology Research and Practice
Hindawi Publishing Corporationhttp://www.hindawi.com Volume 2014
Parkinson’s Disease
Evidence-Based Complementary and Alternative Medicine
Volume 2014Hindawi Publishing Corporationhttp://www.hindawi.com
Recommended