Remote Desktop Session Host Capacity Planning in Windows Server 2008 R2
Microsoft Corporation
Published: February 2010
Abstract The Remote Desktop Session Host (RD Session Host) role service lets multiple concurrent users run
Windows®-based applications on a remote computer running Windows Server® 2008 R2. This white
paper is intended as a guide for capacity planning of RD Session Host in Windows Server 2008 R2. It
describes the most relevant factors that influence the capacity of a given deployment, methodologies to
evaluate capacity for specific deployments, and a set of experimental results for different combinations
of usage scenarios and hardware configurations.

Copyright Information
The information contained in this document represents the current view of Microsoft Corporation on the
issues discussed as of the date of publication. Because Microsoft must respond to changing market
conditions, it should not be interpreted to be a commitment on the part of Microsoft, and Microsoft
cannot guarantee the accuracy of any information presented after the date of publication.
This White Paper is for informational purposes only. MICROSOFT MAKES NO WARRANTIES, EXPRESS,
IMPLIED OR STATUTORY, AS TO THE INFORMATION IN THIS DOCUMENT.
Complying with all applicable copyright laws is the responsibility of the user. Without limiting the rights
under copyright, no part of this document may be reproduced, stored in or introduced into a retrieval
system, or transmitted in any form or by any means (electronic, mechanical, photocopying, recording, or
otherwise), or for any purpose, without the express written permission of Microsoft Corporation.
Microsoft may have patents, patent applications, trademarks, copyrights, or other intellectual property rights covering subject matter in this document. Except as expressly provided in any written license agreement from Microsoft, the furnishing of this document does not give you any license to these patents, trademarks, copyrights, or other intellectual property.
2010 Microsoft Corporation. All rights reserved.
Microsoft, Hyper-V, Windows, and Windows Server are trademarks of the Microsoft group of companies.
All other trademarks are property of their respective owners.
Contents Introduction .................................................................................................................................................. 5
Capacity Planning for a Specific Deployment ............................................................................................... 6
Problem statement ................................................................................................................................... 6
What determines the capacity of a system? ............................................................................................ 7
Usage scenario ...................................................................................................................................... 7
Hardware resources .............................................................................................................................. 7
Typical evaluation approaches ................................................................................................................. 7
Load simulation tests ............................................................................................................................ 9
Testing methodology .............................................................................................................................. 10
Test bed configuration ........................................................................................................................ 11
Load generation .................................................................................................................................. 11
Response time measurement ............................................................................................................. 12
Scenarios ............................................................................................................................................. 14
Examples of test results for different scenarios ..................................................................................... 15
Tuning Your Server to Maximize Capacity .................................................................................................. 18
Impact of hardware on server capacity .................................................................................................. 18
CPU ...................................................................................................................................................... 19
Memory ............................................................................................................................................... 22
Disk storage ......................................................................................................................................... 25
Network .............................................................................................................................................. 26
Impact of Remote Desktop Services features on server capacity .......................................................... 28
32-bit color depth ............................................................................................................................... 28
Windows printer redirection (XPS) ..................................................................................................... 28
Compression algorithm for RDP data ................................................................................................. 28
Desktop Experience pack .................................................................................................................... 29
RemoteApp programs ............................................................................................................................. 29
Hyper-V ................................................................................................................................................... 30
Impact of Windows System Resource Manager (WSRM) ....................................................................... 31
Comparison with Windows Server 2008 ................................................................................................. 32
Conclusions ................................................................................................................................................. 32
Appendix A: Test Hardware Details ............................................................................................................ 33
Appendix B: Testing Tools ........................................................................................................................... 34
Test control infrastructure ...................................................................................................................... 34
Scenario execution tools ......................................................................................................................... 35
Appendix C: Test Scenario Definitions and Flow Chart ............................................................................... 36
Knowledge Worker v2 ............................................................................................................................. 36
Knowledge Worker v1 ............................................................................................................................. 38
Appendix D: Remote Desktop Session Host Settings .................................................................................. 40
Introduction The Remote Desktop Session Host (RD Session Host) role service lets multiple concurrent users run
Windows®-based applications on a server running Windows Server® 2008 R2. This white paper is
intended as a guide for capacity planning of an RD Session Host server running Windows Server 2008 R2.
In a server-based computing environment, all application execution and data processing occurs on the
server. As a consequence, the server is one of the most likely systems to run out of resources under
peak load and cause disruption across the deployment. Therefore it is very valuable to test the
scalability and capacity of the server system to determine how many client sessions a specific server can
support for specific deployment scenarios.
This document presents guidelines and a general approach for evaluating the capacity of a system in the
context of a specific deployment. Most of the key recommendations are also illustrated with examples
based on a few scenarios that use Microsoft® Office applications. The document also provides guidance
on the hardware and software parameters that can have a significant impact on the number of sessions
a server can support effectively.
Capacity Planning for a Specific Deployment
Problem statement One of the key questions faced by somebody planning a Remote Desktop Session Host server
deployment is: “How many users will this server be able to host?” (or one of its variants: “How much
hardware is required to properly host all my users?” or “What kind of server is required to host <N>
users?”). Determining the system configuration able to support the load generated by users is a typical
challenge faced by any service (such as Microsoft Exchange, Internet Information Services (IIS), SQL
Server). This is a difficult question to answer even for server roles that support workloads defined by a
relatively small set of transactions and parameters that characterize the profile of a workload (DNS is a
good example where the load can be well defined by DNS queries). The RD Session Host servers find
themselves at the other end of the spectrum because the load is defined fundamentally by the deployed
applications, the clients, and the user interaction. While one deployment may host a relatively
lightweight application that users access infrequently and with low resource costs (like a data entry
application), another may host a very demanding CAD application requiring a lot of CPU, RAM, disk
and/or network bandwidth.
There are a few assumptions implied by this question that are worth clarifying:
1. The deployment needs to be sized such that users’ applications perform at an acceptable level.
2. The number of resources that servers are provisioned with does not significantly exceed the
number required for meeting the deployment goals.
The performance criterion is difficult to state in objective terms because of the large spectrum of
applications that may be involved and the variety of ways that users can use those applications. One of
the most typical complaints that users have about the performance of their RD Session Host server
applications is that performance is slow or unresponsive, but there are other ways in which performance
degradation may occur, such as jittery behavior as opposed to a smooth, even response, sometimes in
alternating bursts and lags that may be extremely annoying even if the average performance may be
deemed acceptable. The tolerances to performance degradation vary substantially across deployments:
while some systems are business-critical and accept no substantial degradation at any time, others may
accept short time spans of peak load where performance is quite poor. Clarity on what the users’
expectations are in terms of performance is a key piece of input in the process of sizing the capacity of a
deployment.
Regarding the second goal, it is commonly expected that the planning exercise should estimate resource
requirements reasonably close to the values that are really required, without overestimating by large
margins. For example, if a server requires 14 gigabytes (GB) of RAM to properly accommodate the target
number of 100 users for a certain deployment, including peak load situations (all users open a memory
intensive application at the same time), it is a reasonable expectation that the estimate coming from the
planning exercise would be within the 14-16 GB of RAM range. But an estimate of 24 GB of RAM would
be a significant waste of resources, because a significant fraction of that RAM (14 GB) would never be
used.
What determines the capacity of a system? Before we discuss the details of testing a certain scenario on a server, it is important to know what
factors impact the scalability of the server. At a macro level, these factors fall under two buckets:
Usage scenario
An extremely important factor in determining the capacity of a given server is the usage scenario – the
typical sequence of interactions users have with the applications deployed on the server. A server of a
given hardware configuration may support 2 users or 200 users depending on the scenario. If the
scenario is light in resource usage, the server will be able to support a lot of users. An example of such a
light scenario is a user entering data in a simple line of business application. On the other hand, if the
scenario is heavy in resource usage, the server will not be able to support as many users. An example of
a heavy scenario is a user working with a CAD application or with a complex software development
environment that’s very CPU and input/output intensive.
This means that when trying to estimate the number of users a server can support, that number only
makes sense in the context of a particular scenario. If the scenario changes, the number of supported
users will also change.
Generally the scenario is defined by system software configuration, applications used, specific features
exercised for each application, the amount and content of data being processed, actions performed, and
the speed with which actions are being performed. Following are a few examples of significant factors
that can influence a simple scenario like editing a document:
Is the user typing in Notepad or Microsoft Word?
What version of Microsoft Word is used?
Is the spelling checker enabled?
Does the document contain pictures? Does it contain graphs?
What is the typing speed?
What is the session color depth?
Answering any of the questions incorrectly may throw off the results by significant amounts.
Hardware resources
The server hardware has a major impact on the capacity of a server. The main hardware factors that
have to be considered are CPU, memory, disk storage, and network. The impact of each of these factors
will be addressed in more detail later in this white paper.
Typical evaluation approaches The above considerations should make it clear that it is not possible to answer the capacity planning
questions with reasonable accuracy based on a set of pre-configured numbers. Surveys of Remote
Desktop Session Host server deployments show that the overwhelming majority of deployments support
between 25 and 150 users, so stating that a Remote Desktop Session Host server deployment would
host 85 users with an 85% error rate is an accurate statement, but not very useful. Similarly, choosing
one of the numbers measured on an actual deployment or simulation and applying it to another
deployment that has significant differences in scenario or hardware configuration is not any more useful
given the potential error. Therefore, unless careful consideration is given to the factors affecting the
deployment scenario, it is not reasonable to expect a high accuracy. There are practical approaches that
can help reduce the estimation error to more reasonable values, and these approaches typically result in
different trade-offs between effort invested and accuracy of results. To enumerate a few:
1. Piloting. This is probably the most common and simple approach. One test server is configured
and deployed, and then load is gradually increased over time while monitoring user feedback.
Based on user feedback, the system load is adjusted up and down until the load stabilizes
around the highest level that provides an acceptable user experience. This approach has the
advantage that it is fairly reliable and simple, but will require initial investments in hardware or
software that may turn out to be ultimately unsuitable for the deployment goals (for example,
the server cannot support enough memory to achieve desired consolidation). This approach can
be further enhanced by monitoring various load indicators (CPU usage, paging, disk and network
queue length etc.) to determine potential bottlenecks, and overcome them by adding hardware
resources (CPUs, RAM, disks, network adapters). However, the lack of control on the level of
load makes it difficult to correlate variation in indicators with actual system activity.
2. Simulation. In this approach, based on data collected about the specific usage scenario, you can
build a simulation by using specific tools that are used to generate various (typically increasing)
level of loads against a test server while monitoring the server’s ability to timely handle user
interactions. This approach requires a fairly high initial investment for building the usage
scenario simulation and relies significantly on the simulated scenario being a good
approximation of the actual usage scenario. However, assuming the simulation is accurate, it
allows you to determine very accurately the acceptable levels of load and the limiting factors,
and offers a good environment for iterating while adjusting various software and hardware
configurations.
3. Projection based on single user systems. This approach uses extrapolation based on data
collected from a single user system. In this case, various key metrics like memory usage, disk
usage, and network usage are collected from a single user system and then used as a reference
for projecting expected capacity on a multi-user system. This approach is fairly difficult to
implement because it requires detailed knowledge of system and application operations.
Furthermore, it is rather unreliable because the single user system data contain a significant
level of “noise” generated by interference with the system software. Also, in the absence of
sophisticated system modeling, translating the hardware performance metrics (CPU speed, disk
speed) to the target server from the reference system used to collect the data is a complex and
difficult process.
In general, the first approach will prove to be more time and cost effective for relatively small
deployments, while the second approach may be preferable for large deployments where making an
accurate determination of server capacity could have a more significant impact on purchasing decisions.

Load simulation tests
Load simulation, as outlined above, is one of the more accurate techniques for estimating the capacity
of a given system. This approach works well in a context in which the user scenarios are clearly
understood, relatively limited in variation, and not very complicated. Generally it involves several
distinct phases:
1. Scenario definition. Having a good definition of the usage scenarios targeted by the deployment
is a key prerequisite. Defining the scenarios may turn out to be complicated, either because of
the large variety of applications involved or complex usage patterns. Getting a reasonably
accurate usage scenario is likely the most costly stage of this approach. It is equally important to
capture not only the right sequence of user interactions, but also to use the right data content
(such as documents, data files, media content) because this also may play a significant role in
the overall resource usage on the system. Such a scenario can be built based on interviews with
users, monitoring user activity, tracking metrics on key infrastructure servers, project goals, etc.
2. Scenario implementation. In this phase, an automation tool is used to implement the scenario
so that multiple copies can be run simultaneously against the test system. An ideal automation
tool will drive the application user interface from the Remote Desktop Connection client, has a
negligible footprint on the server, is reliable, and tolerates variation in application behavior well
due to server congestion. At this stage, it is also important to have a clear idea of the metrics
used to gauge how viable the system is at various load levels and to make sure that the scenario
automation tools accommodate collecting those metrics.
3. Test bed setup. The test bed typically lives on an isolated network and includes 3 categories of
computers:
a. The RD Session Host server(s) to be tested
b. Infrastructure servers required by the scenario (such as IIS, SQL Server, Exchange) or
that provide basic services (DNS, DHCP, Active Directory)
c. Test clients used to generate the load
Having an isolated network is a very important factor because it avoids interference of network
traffic with either the Remote Desktop Connection traffic or the application-specific traffic. Such
interference may cause random slowdowns that would affect the test metrics and make it
difficult to distinguish such slowdowns from the ones caused by resource exhaustion on the
server.
4. Test execution. Typically this consists of gradually increasing the load against the server while
monitoring the performance metrics used to assess system viability. It is also a good idea to
collect various performance metrics on the system to help later in identifying the type of
resources that come under pressure when system responsiveness degrades. This step may be
repeated for various adjustments made based on conclusions derived from step 5.
5. Result evaluation. This is the final step where, based on the performance metrics and other
performance data collected during the test, you can make a determination of the acceptable
load the system can support while meeting the deployment performance requirements and the
type of resources whose shortage causes the performance to start degrading. The conclusions
reached in this step can be a starting point for a new iteration on hardware adjusted to mitigate
the critical resource shortage in order to increase load capacity.
Coming up with a single application-independent criterion for defining when an application performance
degrades is fairly difficult. However, there is an interaction sequence that captures the most
fundamental transaction of an interactive application: sending input, such as from a keyboard or mouse,
to the application and having the application draw something back in response. The most trivial case of
this would be typing, but other interactions like clicking a button, or selecting a check box or menu item
also map in a very straightforward way to this type of transaction. The reason this interaction pattern
stands out is that it captures the fundamental intention of connecting to a remote desktop: allowing a
user to interact with a rich user interface running on a remote system the same way he or she would if
the application were running locally. Although this metric will not cover all relevant metrics for tracking
application performance, it is a very good approximation for many scenarios, and degradation measured
through this metric correlates well in general with degradation from other metrics.
This capacity evaluation approach is what we recommend when a reasonably accurate number is
required, especially for cases like large system deployments where sizing the hardware accurately has
significant implications in terms of cost and a low error margin is desirable. We used the same approach
for the experimental data that we used to illustrate various points in this document, for the following
reasons:
This approach allowed us to make fairly accurate measurements of the server capacity under
specific conditions.
It makes it possible for independent parties to replicate and confirm the test results.
It allows a more accurate evaluation of various configuration changes on a reference test bed.
Testing methodology We included various results obtained in our test labs to illustrate many of the assertions made in this
document. These tests were executed in the Microsoft laboratories. The tests used a set of tools
developed specifically for the purpose of Remote Desktop Session Host server load test simulations so
that they meet all the requirements outlined above for effective load test execution. These tools were
used to implement a few scenarios based on Office2007 and Internet Explorer. Response times for
various actions across the scenarios were used to assess the acceptable level of load under each
configuration.
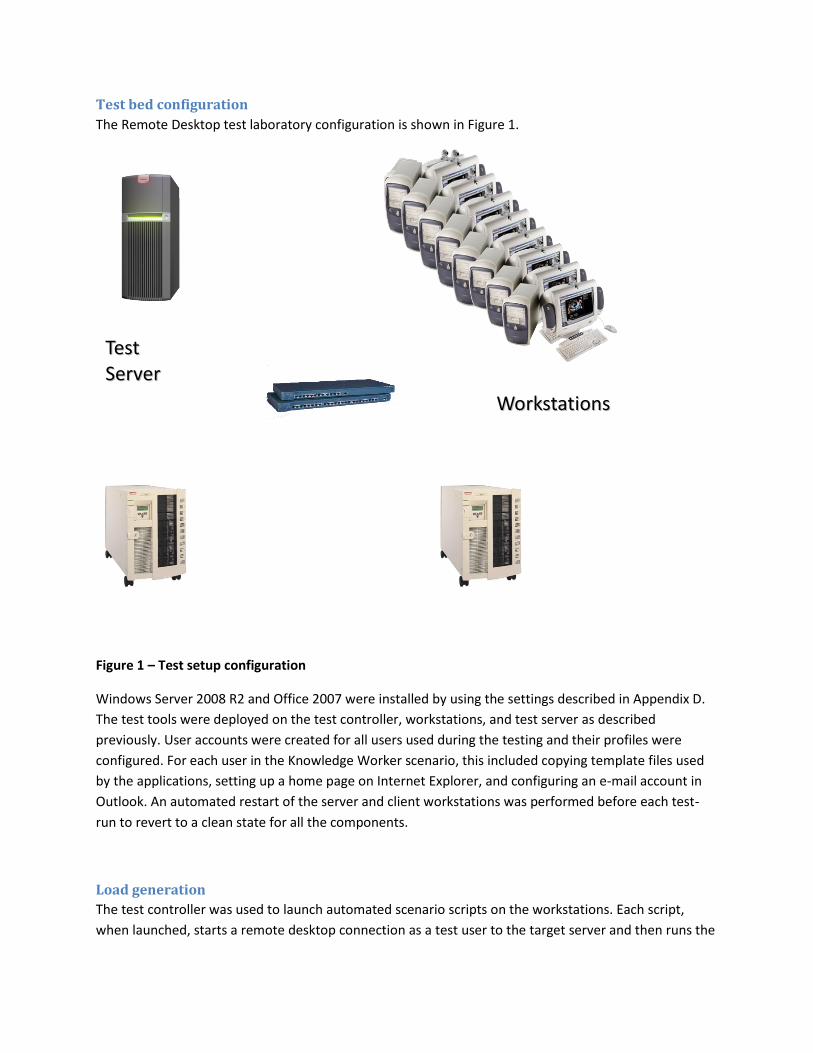
Test bed configuration
The Remote Desktop test laboratory configuration is shown in Figure 1.
Figure 1 – Test setup configuration
Windows Server 2008 R2 and Office 2007 were installed by using the settings described in Appendix D.
The test tools were deployed on the test controller, workstations, and test server as described
previously. User accounts were created for all users used during the testing and their profiles were
configured. For each user in the Knowledge Worker scenario, this included copying template files used
by the applications, setting up a home page on Internet Explorer, and configuring an e-mail account in
Outlook. An automated restart of the server and client workstations was performed before each test-
run to revert to a clean state for all the components.
Load generation
The test controller was used to launch automated scenario scripts on the workstations. Each script,
when launched, starts a remote desktop connection as a test user to the target server and then runs the
TTeesstt
SSeerrvveerr
WWoorrkkssttaattiioonnss
scenario. The Remote Desktop users were started by the test controller in groups of ten with 30 seconds
between successive users. After the group of ten users was started, a 5-minute stabilization period was
observed in which no additional sessions were started before starting with the next group. What this
means is that it takes 4 minutes and 30 seconds to start 10 users. Taking into account the 5-minute
stabilization period, the controller takes 1 hour and 30 minutes to start 100 users.
This approach of logging on users one at a time has two advantages. First, it ensures that we don't
overwhelm the server by logging on 100 users at the same time. Second, we can look at the resulting
data from the test and point to a specific number of users after which the server became unresponsive.
From the results in the following sections it can be seen that the number of supported users has been
reported to the nearest 10. The reason for this is that we use a group size of 10 users and the level of
precision that we get from the test data is not sufficient to clearly distinguish between users from the
same group.
Response time measurement
A user scenario is built by grouping a series of actions. An action sequence starts with the test script
sending a key stroke through the client to one of the applications running in the session. As a result of
the key stroke, the application does some drawing. For example, sending CTRL-F to Microsoft Word
results in the application drawing the File menu.
The test methodology is based on measuring the response time of all actions that result in drawing
events (except for typing text). The response time is defined as the time taken between the key stroke
and the drawing that happens as a result. A timestamp (T1) is taken on the client side when the test
tools on the client send a keystroke to the Remote Desktop client. When the drawing happens in the
server application, it is detected by a test framework tool that runs inside each Remote Desktop session.
The test tool on the server side sends a confirmation to the client side tools and at this point the client
side tools take another timestamp (T2). The response time of the action is calculated as T2 − T1. This
measurement gives an approximation of the actual response time. It is accurate to within a few
milliseconds (ms).
The response time measurement is important because it is the most reliable and direct measurement of
user experience as defined by system responsiveness. Looking at performance metrics such as CPU
usage and memory consumption only gives us a rough idea as to whether the system is still within
acceptable working conditions. For example, it is difficult to qualify exactly what it means for the users if
the CPU is at 90% utilization. The response times tell us exactly what the users will experience at any
point during the test.
As the number of users increases on a server, the response times for all actions start to degrade after a
certain point. This usually happens because the server starts running out of one or more hardware
resources. A degradation point is determined for the scenario beyond which the server is considered
unresponsive and therefore beyond capacity. To determine the degradation point for the entire
scenario, a degradation point is determined for each action based on the following criteria:
For actions that have an initial response time of less than 200 ms, the degradation point is

considered to be where the average response time is more than 200 ms and 110% of the initial
value.
For actions that have an initial response time of more than 200 ms, the degradation point is
considered to be the point where the average response time increases with 10% of the initial value.
These criteria are based on the assumption that a user will not notice degradation in a response time
when it is lower than 200 ms.
Generally, when a server reaches CPU saturation, the response time degradation point for most actions
is reached at the same number of users. In situations where the server is running out of memory, the
actions that result in file input/output degrade faster than others (because of high paging activity
resulting in congestion in the input/output subsystem), such as opening a dialog box to select a file to
open or save. For the purpose of this testing, the degradation point for the whole test was determined
to be the point where at least 20% of the user actions have degraded. A typical user action response
time chart is shown in Figure 2. According to the criteria described above, the degradation point for this
action is at 150 users.
Figure 2 – Response time evaluation
Duration Users 50 구간의 이동 평균 (Duration)
Degradation point
150 Users
Scenarios
The scenarios used for testing are automated and meant to simulate real user behavior. Although the
scripts used in these scenarios simulate tasks that a normal user could perform, the users simulated in
these tests are tireless—they never reduce their intensity level. The simulated clients type at a normal
rate, pause as if looking at dialog boxes, and scroll through mail messages as if to read them, but they do
not get up from their desks to get a cup of coffee, they never stop working as if interrupted by a phone
call, and they do not break for lunch. The tests assume a rather robotic quality, with users using the
same functions and data sets during a thirty-minute period of activity. This approach yields accurate but
conservative results.
Knowledge Worker v2
The knowledge worker scenario consists of a series of interactions with Microsoft Office 2007
applications (Word, Excel, Outlook, and PowerPoint) and Internet Explorer. The set of actions and their
frequency in Office segments of the scenario are based on statistics collected from the Software Quality
Management data submitted by Office users and should represent a good approximation of an “average”
Office user. The scenario includes the following:
Creating and saving Word documents
Printing spreadsheets in Excel
Using e-mail communication in Outlook
Adding slides to PowerPoint presentations and running slide shows
Browsing Web pages in Internet Explorer
This scenario is described in detail in Appendix A.
Knowledge Worker v2 with text-only presentation
This scenario is very similar to the Knowledge Worker scenario above. It is exactly the same except for
one difference—the PowerPoint presentation file used in this scenario is a text-only version. The file
used in the original Knowledge Worker scenario is rich in content. The comparison of these two
scenarios is interesting because it reveals how some differences in the scenarios can impact the capacity
of the server.
Knowledge Worker v2 without PowerPoint
This scenario is similar to the Knowledge Worker scenario in most ways. The significant difference in this
case is that the light Knowledge Worker scenario does not use PowerPoint. The duration of the scenario
is the same as the Knowledge Worker scenario, but instead of spending time using PowerPoint, the user
spends more time typing Word documents, filling Excel spreadsheets, and typing e-mail messages. This
scenario is significantly lighter in terms of CPU usage compared to the Knowledge Worker scenario
because PowerPoint, while taking only ~10% of the total work cycle duration, uses more than half of the
CPU. This also generates significant variation in the CPU usage during the work cycle, with much higher
levels of CPU usage during the short PowerPoint interaction sequence. There were two reasons to
introduce this scenario: PowerPoint usage data shows that it is not as widely used as the other Office

applications in the mix and this scenario gives an alternate angle on examining various factors due to its
relatively lighter load and smoother variations in resource usage.
Knowledge Worker v1
This is the Knowledge Worker scenario that was used for testing in the Windows Server 2003 Terminal
Server Capacity and Scaling (http://go.microsoft.com/fwlink/?LinkId=178901) white paper. This scenario
was significantly different from the current Knowledge Worker v2, and is described in detail in Appendix
A.
Examples of test results for different scenarios
Server Configuration Scenario Capacity
HP DL 585 4 x AMD Opteron Dual-core CPUs 2.4 GHz 1024 KB L2 Cache 64 GB Memory
Knowledge Worker v2
150 users
HP DL 585 4 x AMD Opteron Dual-core CPUs 2.4 GHz 1024 KB L2 Cache 64 GB Memory
Knowledge Worker v1
230 users
HP DL 585 4 x AMD Opteron Dual-core CPUs 2.4 GHz 1024 KB L2 Cache 64 GB Memory
Knowledge Worker v2 with text-only presentation
200 users
HP DL 585 4 x AMD Opteron Dual-core CPUs 2.4 GHz 1024 KB L2 Cache 64 GB Memory
Knowledge Worker v2 without PowerPoint
230 users
Table 1 - Server capacity by scenario
Table 1 shows the comparison of server capacity between different scenarios. The capacity numbers are
determined by using the criteria outlined above, but these numbers should be treated with caution and
may need to be adjusted for the real deployments.
The most important observation about these results is that relatively minor tweaks in the scenario cause
significant impact in scalability. Although both test that PowerPoint has the same test in the
presentation, the difference in the way it is rendered accounts for a 33% variation in capacity. Although
the PowerPoint interaction is only ~10% of the total scenario execution cycle, removing it increased the
capacity by ~53%. These examples serve as a strong reminder that careful consideration of the scenario
used for capacity measurements is paramount to having accurate numbers. It also makes a compelling
case that providing off-shelf numbers for capacity planning is not useful, and if such an effort is worth
considering, you need to actually customize it to your needs.
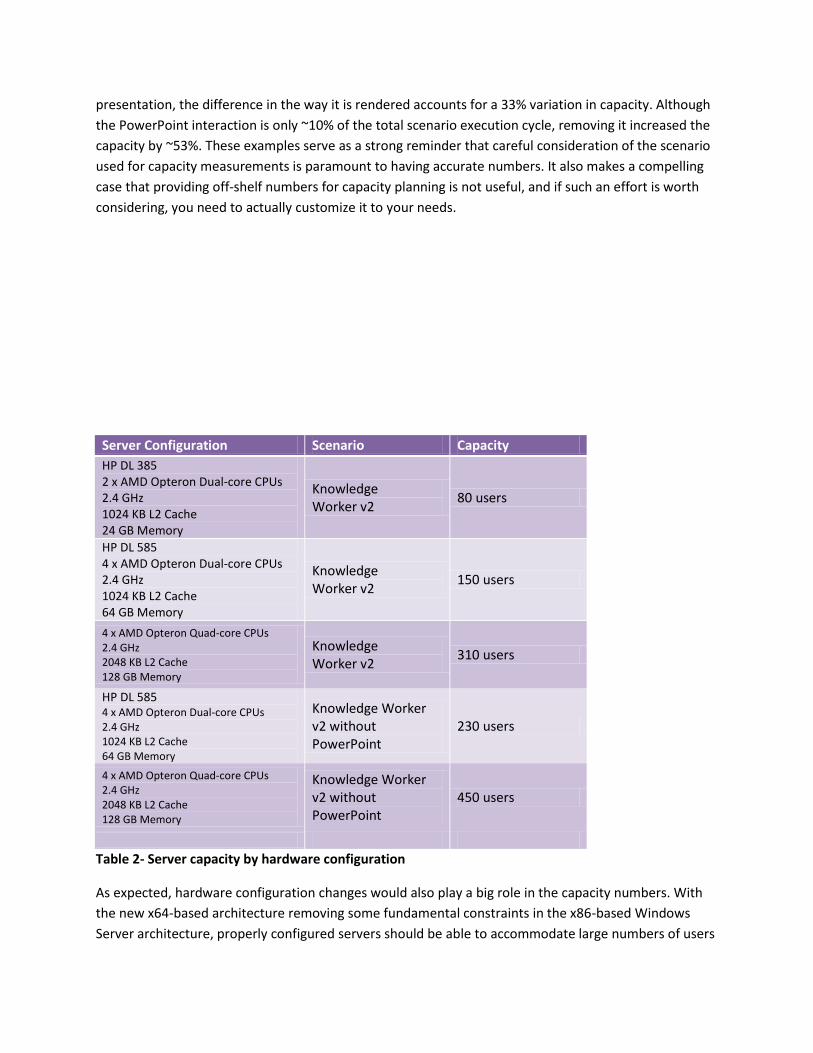
Server Configuration Scenario Capacity
HP DL 385 2 x AMD Opteron Dual-core CPUs 2.4 GHz 1024 KB L2 Cache 24 GB Memory
Knowledge Worker v2
80 users
HP DL 585 4 x AMD Opteron Dual-core CPUs 2.4 GHz 1024 KB L2 Cache 64 GB Memory
Knowledge Worker v2
150 users
4 x AMD Opteron Quad-core CPUs 2.4 GHz 2048 KB L2 Cache 128 GB Memory
Knowledge Worker v2
310 users
HP DL 585 4 x AMD Opteron Dual-core CPUs 2.4 GHz 1024 KB L2 Cache 64 GB Memory
Knowledge Worker v2 without PowerPoint
230 users
4 x AMD Opteron Quad-core CPUs 2.4 GHz 2048 KB L2 Cache 128 GB Memory
Knowledge Worker v2 without PowerPoint
450 users
Table 2- Server capacity by hardware configuration
As expected, hardware configuration changes would also play a big role in the capacity numbers. With
the new x64-based architecture removing some fundamental constraints in the x86-based Windows
Server architecture, properly configured servers should be able to accommodate large numbers of users

for many mainstream workloads. There is no reason to expect that RD Session Host servers are
inherently limited to a certain number of users.

Tuning Your Server to Maximize Capacity In the remainder of this document we will explore a series of hardware and software configuration
changes to assess their impact on the capacity of a server. The numbers below are specific to the
hardware and scenarios used in our tests and will likely differ for other scenarios/hardware
configurations, but they should still be able to give a good sense of the order of magnitude and direction
in which such a configuration change could impact a Remote Desktop Services deployment.
In general, there are two main categories of questions we are trying to address:
1. How can you tune a system to increase capacity?
2. What is the impact of turning on a certain feature?
Impact of hardware on server capacity There are a few general considerations as to what would be a suitable server for a Remote Desktop
Session Host server deployment that would give a reasonable approximation for a good server without
taking the scenario in consideration. There is a good range of 2U form factor servers today that have:
2 processor slots (some even 4) and would support 8 to 12 cores (16 in the near future when 8
core processors will be available)
4 to 9 memory DIMM slots per core which can be populated with up to 32–72 GB of RAM by
using cost effective 4-GB modules.
8 2.5” SAS/SATA drive slots
You can start with such a server, configured for 16 GB of RAM and with 4 disks and then, based on actual
usage data, extend RAM or disk configuration to accommodate more users. These servers have a very
good price/performance ratio, good rack density, very good storage support, and can accommodate a
lot of RAM if needed. They give you a lot of flexibility to tune the configuration to specific usage while
being very easy to scale out after there is a need for more capacity.
Going forward, we are going to focus on the hardware factors that most significantly impact the server
capacity: CPU, memory, disk storage, and network. The test results are presented below for each of
these.
CPU
The data presented in Table 3 was obtained by using 2 different test servers. The only difference
between the two servers was that one of them has a single Quad-core CPU and the other one has 2
Quad-core CPUs.
Server Configuration Scenario Capacity
AMD Opteron Quad-core CPU 2.7 GHz 512 KB L2 Cache 32 GB Memory
Knowledge Worker v2
110 users
2 x AMD Opteron Quad-core CPU 2.7 GHz 512 KB L2 Cache 32 GB Memory
Knowledge Worker v2
200 users
AMD Opteron Quad-core CPU 2.7 GHz 512 KB L2 Cache 32 GB Memory
Knowledge Worker v2 without PowerPoint
180 users
2 x AMD Opteron Quad-core CPU 2.7 GHz 512 KB L2 Cache 32 GB Memory
Knowledge Worker v2 without PowerPoint
300 users
Table 3 - Server capacity by CPU configuration and scenario
The data in Table 3 shows the results for two different scenarios. One of the important factors to
consider here is that the factor that determines capacity on all these systems is CPU, which is one of the
resources that is very often subjected to unexpected variations and pressure points. Therefore, in a real-
life deployment it is more prudent to put aside a fraction of CPU resources to act as a cushion when
unexpected spikes of activity happen on the box (such as everyone using a certain application at the
same time). Another factor that would play a significant role in this decision is the quality of service
expected by the users: the higher the expectation, the larger the spare capacity that needs to be
provisioned. Such a margin could range anywhere from 50% to 10% of the overall capacity and will
cause the capacity numbers to be adjusted accordingly.
As expected, increase in CPU power will allow a server to support more users if no other limitations are
encountered. The most interesting measure of how increasing CPU capacity affects the overall server
capacity is the scale factor defined as the ratio by which the server capacity increases when the CPU
capacity doubles. This scaling factor is always smaller than 2 on a system where there is no other
limitation except CPU. It is also expected to be a function of the initial number of CPUs involved, and
would decrease in value when the number of CPUs involved increase (the scaling factor going from 1 to
2 CPUs is larger than the one for going from 2 to 4 CPUs). Typically the scaling factor for Remote Desktop
Session Host servers would be found in the 1.5 to 1.9 range.
Although the same hardware box was used, different scenarios yielded different scaling factors: the
normal script version yielded a scale factor of ~1.8, and the version without PowerPoint yielded a factor
of 1.67. The reason for this is that the scenario that included PowerPoint had more variation in CPU
usage, and the system with more CPU capacity available softened the impact of local usage peaks that
can overwhelm the less powerful system.
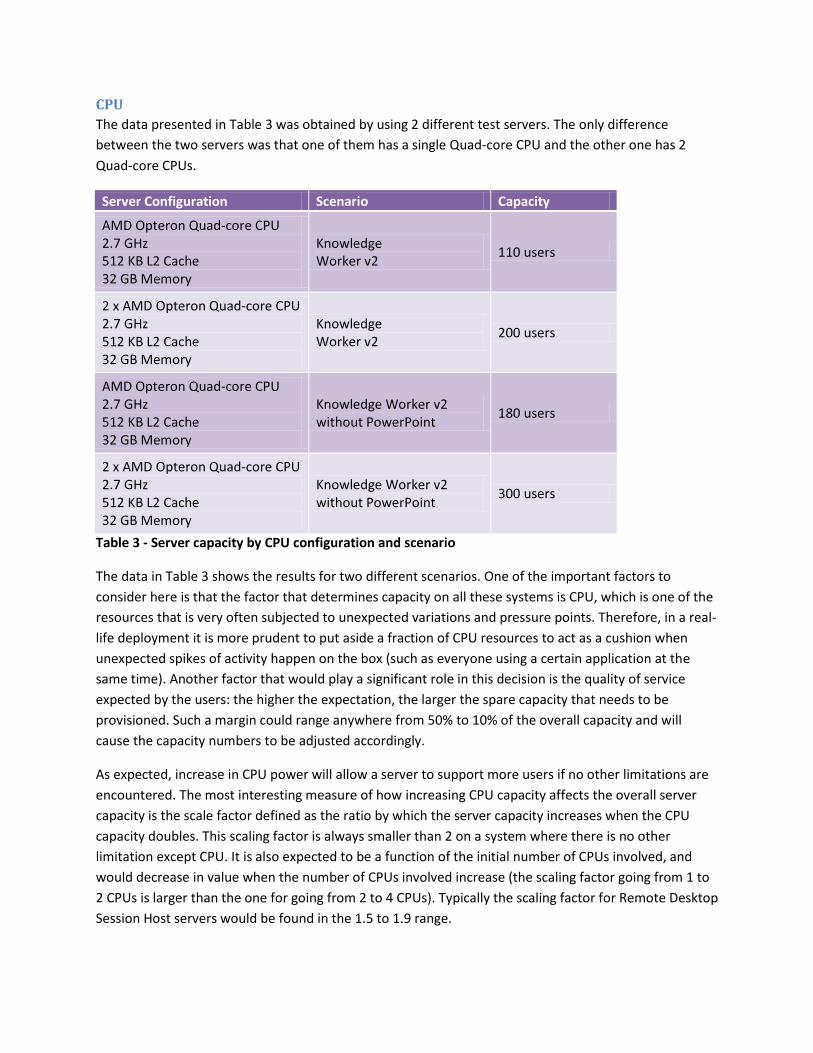
Let’s take a look at the CPU usage profile for the test scenarios in more detail to understand how the
variance and fluctuation in server load impacts server capacity on a CPU limited system.
Figure 3 - CPU usage for Knowledge Worker without PowerPoint
The CPU curve in Figure 3 shows a general increase in CPU usage (green curve) as the number of active
users increases (blue curve). Looking at the CPU curve closely, we can see that every time there is an
increase in users, the CPU curve hits a peak. This peak is followed by a decline as the number of users
becomes constant for a while. This pattern is repeated throughout the test while the overall CPU keeps
rising. The CPU peak results from logon activity associated with the users that are logging on at that time
on the server. Users log on in groups of 10. Each group of users logs on within 5 minutes before the test
enters a steady state for another 5 minutes. Because the users are being logged on so close together,
the CPU spike caused by each user logon overlaps with the ones caused by users preceding/following
them and results in one large CPU peak for the group of 10 users.
Users % Processor Time 30 구간의 이동 평균 (% Processor Time)
100 % CPU Peak
The size of this CPU logon peak impacts the server capacity measurement. Server capacity is reached on
a CPU limited system when the CPU usage reaches close to saturation (100% usage). The slope of the
CPU curve is determined by the steady state load on the system as the number of users increases (this is
the CPU usage minus the logon peaks as depicted by the orange curve in Figure 3). If there was no
logon-related CPU activity, the server would reach capacity when this curve hits 100%. In reality, the
CPU hits 100% sooner because the logon peaks touch 100% (marked as 100% CPU Peak in Figure 3). The
bigger the peaks are, the sooner the CPU curve will touch 100%.
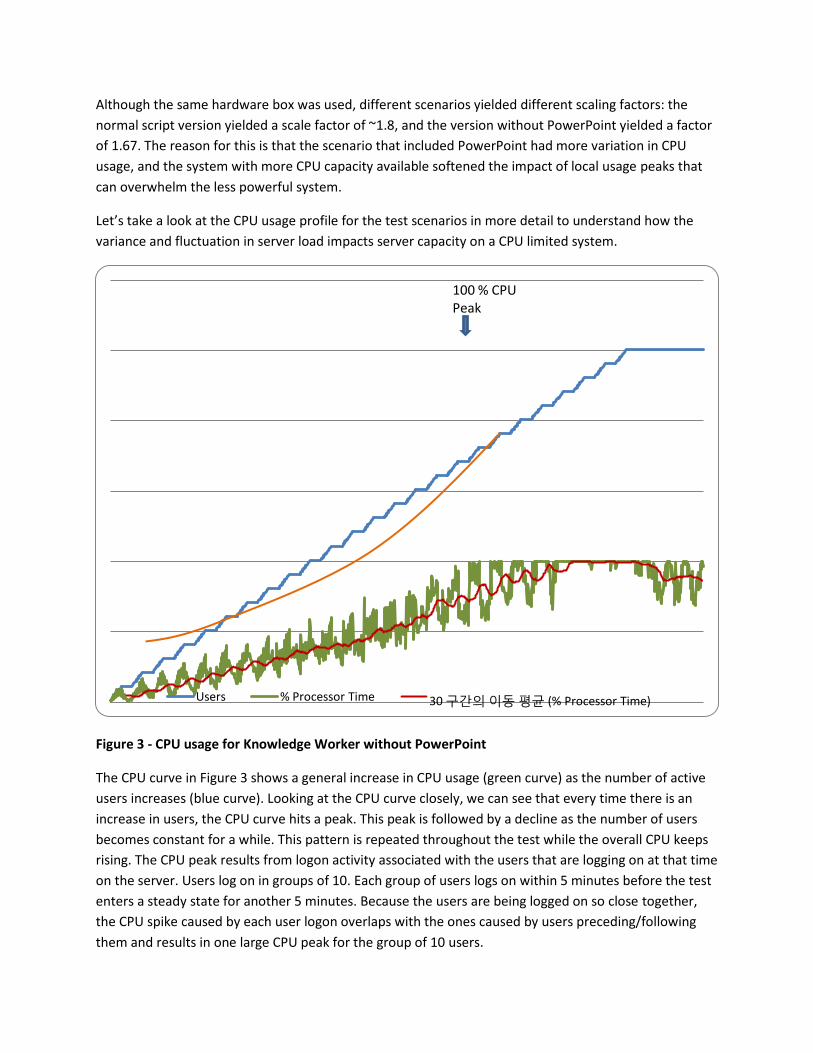
The size of the CPU logon peak is dependent on the total processing power of the server. On a 4-core
computer, the logon peak will be larger than on an 8-core computer. The 8-core computer has more
processing power to absorb the impact of the logon peak. This means that a scenario will be able to
reach further on the steady state CPU curve (the orange curve) on computers with more processing
power.
Figure 4 - Knowledge Worker CPU usage
The other thing to consider when looking at the CPU usage pattern is the variance of the workload in the
scenario. In terms of CPU usage, the variance of the workload is low when all parts of the scenario are
equally CPU intensive. If the variance is low, the CPU usage pattern will be very uniform as in Figure 3. If
the variance is high, the CPU usage pattern will be non-uniform and this can impact the server capacity.
Users % Processor Time
High CPU Peak
High CPU Peak

The variance of the Knowledge Worker scenario with PowerPoint is higher when compared to the
Knowledge Worker without PowerPoint. This is because the PowerPoint part of the scenario is much
more CPU- intensive when compared to the other parts of the scenario. This means that if several users
happen to start working in PowerPoint, the CPU usage jumps up across the system. When this phase
coincides with a user logon peak, the result is that the CPU peak becomes much higher than usual.
Figure 4 shows the CPU usage profile of the Knowledge Worker scenario. The peaks where logon activity
overlaps with a high number of users working in PowerPoint are marked in Figure 4 as "High CPU Peak."
It is not easy to predict when these high peaks will occur during the test beyond a few groups of users
because it becomes increasingly difficult to calculate what all the users are doing at a given time.
Because of these very high peaks, the CPU usage hits 100% even sooner. This means that a scenario with
a low CPU variance will scale better than one with high CPU variance. Also, in this case a computer with
more processing power is able to mitigate the impact of CPU variance and the high peaks and thus
scales better.
Memory
Determining the amount of memory necessary for a particular use of an RD Session Host server is
complex. It is possible to measure how much memory an application has committed—the memory the
operating system has guaranteed the application that it can access. But the application will not
necessarily use all that memory, and it certainly is not using all that memory at any one time. The subset
of pages that an application has accessed recently is referred to as the “working set” of that process.
Because the operating system can page the memory outside a process’s working set to disk without a
performance penalty to the application, the working set is a much better measure of the amount of
memory needed.
The process performance object's working set counter, used on the _Total instance of the counter to
measure all processes in the system, measures how many bytes have been recently accessed by threads
in the process. However, if the free memory in the computer is sufficient, pages are left in the working
set of a process even if they are not in use. If free memory falls below a threshold, unused pages are
trimmed from working sets.
The method used in these tests for determining memory requirements cannot be as simple as observing
a performance counter. It must account for the dynamic behavior of a memory-limited system.
The most accurate method of calculating the amount of memory required per user is to analyze the
results of several performance counters [Memory\Pages Input/sec, Memory\Pages Output/sec,
Memory\Available Bytes and Process\Working Set(Total_)] in a memory-constrained scenario. When a
system has abundant physical RAM, the working set will initially grow at a high rate, and pages will be
left in the working set of a process even if they are not in use. Eventually, when the total working set
tends to exhaust the amount of physical memory, the operating system will be forced to trim the
unused portions of the working set until enough pages are made available to free up the memory
pressure. This trimming of unused portions of the working sets will occur when the applications
collectively need more physical memory than is available, a situation that requires the system to
constantly page to maintain all the processes’ working sets. In operating systems theory terminology,
this constant paging state is referred to as “thrashing.”
Figure 5 shows the values of several relevant counters from a Knowledge Worker test when performed
on a server with 8 GB of RAM installed.
Figure 5 - Stages of memory usage
Zone 1 represents the abundant memory stage. This is when physical memory is greater than the total
amount of memory that applications need. In this zone, the operating system does not page anything to
disk, even seldom used pages.
Zone 2 represents the stage when unused portions of the working sets are trimmed. In this stage the
operating system periodically trims the unused pages from the processes’ working sets whenever the
amount of available memory drops to a critical value. Each time the unused portions are trimmed, the
total working set value decreases, increasing the amount of available memory, which results in a
significant number of pages being written to page files. As more processes are created, more memory is
needed to accommodate their working sets, and the number of unused pages that can be collected
during the trimming process decreases. The page- input rate is mostly driven by pages required when
Pag
es/
seco
nd
Me
mo
ry
Working Set Available Bytes
Pages Input/sec Active Users
Pages Output/sec 50 구간의 이동 평균 (Pages Output/sec)
zdfsd zdfsd zdfsdZone 1 Zone 2 Zone 3
OptimalPoint

creating new processes. The average is typically below the page-output rate. This state is acceptable as
long as the system has a suitable disk storage system. The applications should respond well because, in
general, only unused pages are being paged to disk.
Zone 3 represents the high pressure zone. The working sets are trimmed to a minimal value and mostly
contain pages that are frequented by the greater number of users. Page faults will likely cause the
ejection of a page that will need to be referenced in the future, thus increasing the frequency of page
faults. The output per second of pages will increase significantly, and the page-output curve follows the
shape of the page-input curve to some degree. The system does a very good job of controlling
degradation, almost linearly, but the paging activity increases to a level where the response times are
not acceptable.
In Figure 5, it seems as though the amount of physical memory is greater than 8 GB because the
operating system does not start to trim working sets until the total required is well above 14 GB. This is
due to cross-process code sharing, which makes it appear as if there is more memory used by working
sets than is actually available.
To determine the amount of memory needed per user by the system, we have to look at the three zones
again. Zone 1 is a clearly acceptable working stage for the system, while Zone 3 is clearly unacceptable.
Zone 2 needs more careful consideration. The average total paging activity (pages input and pages
output) steadily rises during this stage. In the example above, the paging activity increases from around
50 pages per second to over 1500 pages per second. This translates into an ever increasing disk access
activity. During this stage, how responsive a system will be is determined by how much the throughput
of the disk storage system is. If, for example, the system is using only a local disk for its storage with a
low throughput, its responsiveness will be unacceptable anywhere in Zone 2. On the other hand, if the
disk storage system is capable of handling this level of disk activity, the system will be responsive during
the entire Zone 2. Even with a responsive disk storage system, it is generally good to be conservative
about choosing the spot in Zone 2 where you think the system will still be responsive. A good rule of
thumb is to choose the point where the operating system does the second large trimming of the
working set (this is the point of the second large spike on the page-output curve marked as 'optimal
point' in Figure 2). The user response times should also be looked at to verify that they are acceptable at
this point.
The amount of memory required per user can be estimated by dividing the total amount of memory in
the system by the number of users at the optimal point in Zone 2. Such an estimate would not account
for the memory overhead required to support the operating system. A more precise measurement can
be obtained by running this test for two different memory configurations (for example, 4 GB and 8 GB),
determining the number of users, and dividing the difference in memory size (8 GB – 4 GB in this case)
by the difference in number of users at the optimal point in Zone 2. In practice, the amount of memory
required for the operating system can be estimated as the memory consumed before the test starts. In
the above example, the optimal point in Zone 2 is where the system has 110 active users logged on. The
total memory available at the start of the test was 7500 MB (the remaining having been consumed by
the operating system. These numbers mean that each user requires approximately 68 MB of memory.
Although a reasonable amount of paging is acceptable, paging naturally consumes a small amount of the
CPU and other resources. Because the maximum number of users that could be loaded onto a system
was determined on systems with abundant physical RAM, a minimal amount of paging occurred. The
working set calculations assume that a reasonable amount of paging has occurred to trim the unused
portions of the working set, but this would only occur on a system that was memory-constrained. If you
take the base memory requirement and add it to the number of users multiplied by the required
working set, you end up with a system that is naturally memory-constrained, and therefore acceptable
paging will occur. On such a system, expect a slight decrease in performance due to the overhead of
paging. This decrease in performance can reduce the number of users who can be actively working on
the system before the response time degrades above the acceptable level.
Comparison of different memory configurations
Server Configuration Model Number Knowledge Worker
4 x AMD Opteron Dual-core CPUs 2.4 GHz 1024 KB L2 Cache 8 GB Memory
DL585 120 users
4 x AMD Opteron Dual-core CPUs 2.4 GHz 1024 KB L2 Cache 4 GB Memory
DL585 60 users
Table 4 - Server capacity by memory configuration
Table 4 shows the comparison of server capacity between different memory configurations. On systems
where physical memory is the limiting factor, the number of supported users increases linearly with the
amount of physical memory.
Disk storage
Storage access is a very significant factor in determining server capacity and needs to be considered
carefully. Although the Knowledge Worker scenarios are not very demanding in terms of storage
performance (they average about 0.5 disk operations per second per user), they still provide a good
high-level view of what the concerns are in this space.
In general, these are the storage areas most likely to face high input/output loads:
1. The storage for user profiles will likely have to handle most of the input/output activity related
to file access because it holds user data, temporary file folders, application data, etc. Some of
this may be alleviated if folder redirection is configured to re-route some of the traffic to
network shares.
2. The storage holding system binaries and applications will service IOs during process creation and
application launch and page faults to executable files under higher memory pressure. This is
generally not much of a problem if the binaries (especially dlls) are not rebased during load
because their code pages are shared across processes (and across session boundaries).
3. The storage holding page files will be solicited only if the system is running low on memory, but
may face significant input/output load even under relatively moderate memory pressure
conditions due to the large amount of RAM involved. You can expect that initial trimming passes
will reclaim as much as 25% of the overall RAM size, which on a 16-GB system is 4 GB, a very
large amount of data that needs to be transferred in a relatively short period of time to disk.
Due to the potential high level of input/output involved in paging operations, we recommend isolating
the page file to its own storage device(s) to avoid its interference with the normal file operations
generated by the workload. We also recommend tracking dll base address collision/relocation problems
to avoid both unnecessary input/output traffic and memory usage.
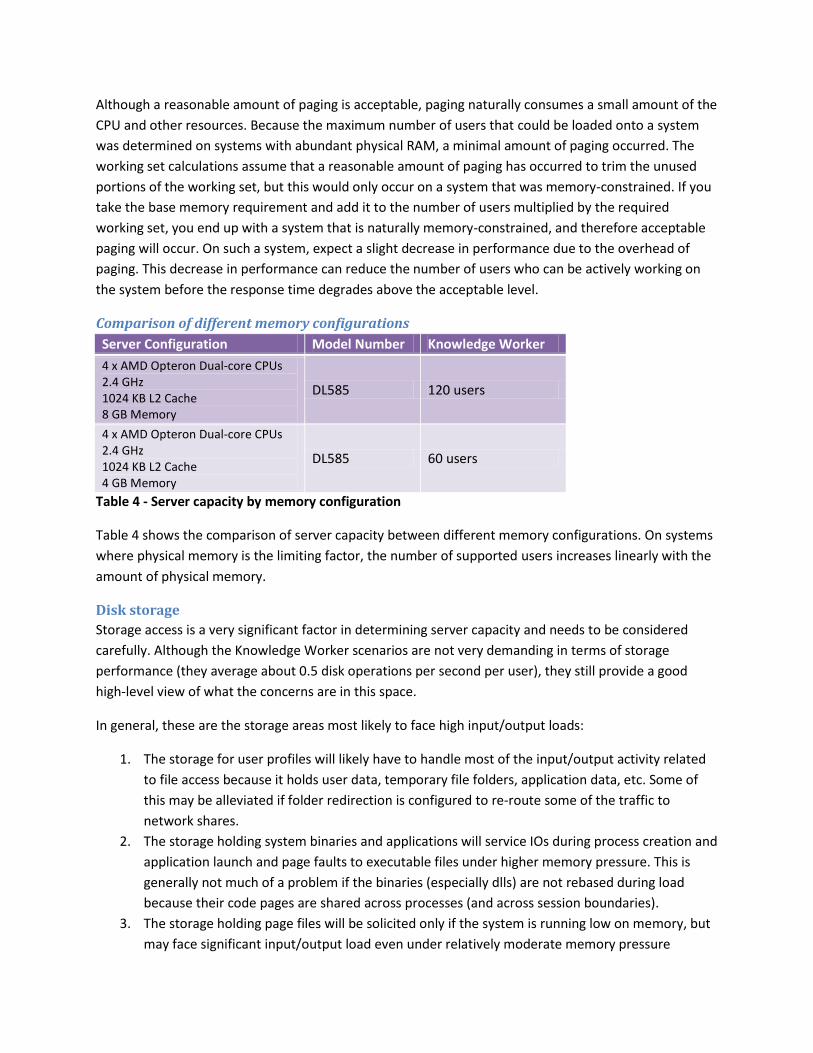
Network
By default, the data sent over Remote Desktop connections is compressed for all connections, which
reduces the network usage for Remote Desktop scenarios. Network usage for two scenarios is shown in
Figure 6. This includes all traffic coming in and going out of the RD Session Host server for these
scenarios.
Figure 6 - Network usage by scenario
It is apparent from this figure that the total network traffic on the server (inbound and outbound) can
vary considerably depending on the scenario. The Knowledge Worker scenario is using richer graphics
계열1, Knowledge
Worker, 14000
계열1, Text-Only
Presentation, 3560계열1, Old
Knowledge Worker, 2800
Byt
es/
Use
r
compared to the other scenarios, especially because of the PowerPoint presentation slide show that is a
part of the scenario. As can be expected, this results in higher network usage.
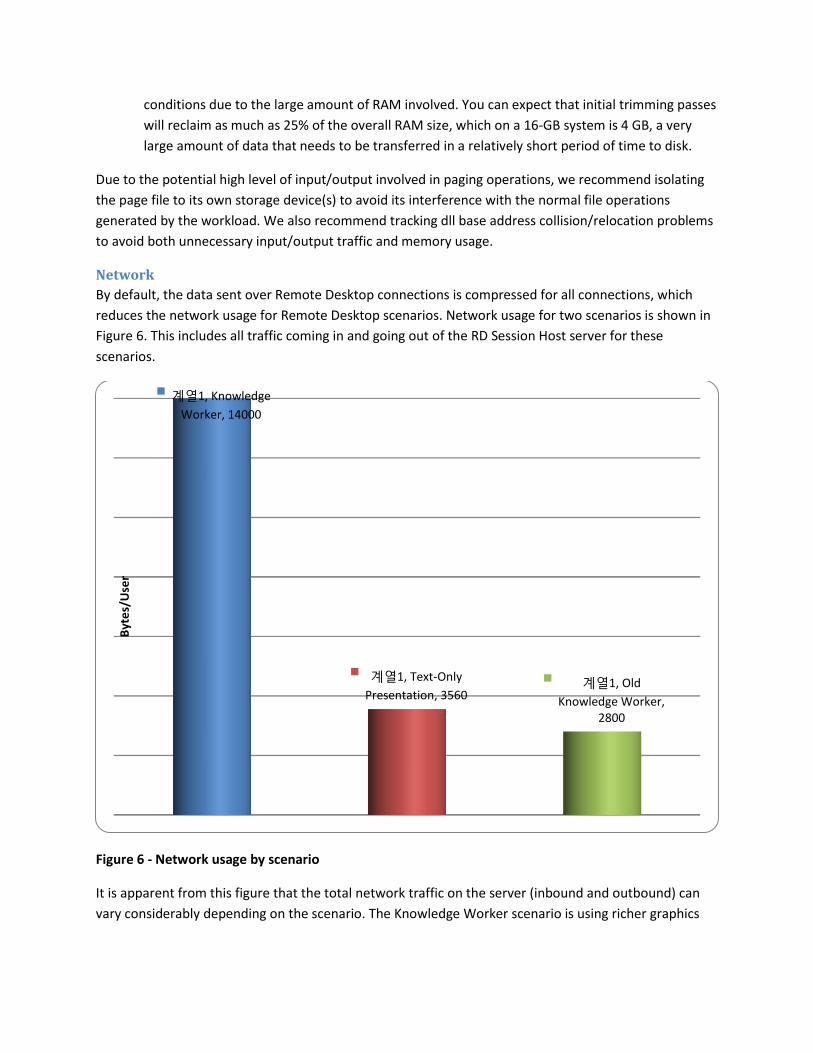
Figure 7 shows network usage in bytes per user for the Knowledge Worker scenario. This is taken from
the Bytes Total/sec counter in the Network Interface performance object. This graph illustrates how the
bytes per user average were calculated, as it converges on a single number when a sufficient amount of
simulated users are running through their scripts. The number of user sessions is plotted on the primary
axis. The count includes both bytes received and sent by the RD Session Host server by using any
network protocol.
Figure 7 - Knowledge Worker scenario network usage per user
The network utilization numbers in these tests only reflect RDP traffic and a small amount of traffic from
the domain controller, Microsoft Exchange Server, IIS Server, and the test controller. In these tests, the
RD Session Host server’s local storage drives are used to store all user data and profiles; no network
home directories were used. In a normal RD Session Host server environment, there will be more traffic
on the network, especially if user profiles are not stored locally.
Use
rs
Byt
es/
Use
r
Bytes Total/User \\DL585-AMD64-0-2\Terminal Services\Active Sessions
Impact of Remote Desktop Services features on server capacity Server capacity can be impacted by choosing to use certain features and settings as opposed to the
system defaults. The default settings used for the tests performed for this white paper are described in
Appendix B. The impact of using some Remote Desktop Services features on server capacity is described
below.
32-bit color depth
Server Configuration Model Number Color Depth Capacity
4 x AMD Opteron Dual-core CPUs 2.4 GHz 1024 KB L2 Cache 64 GB Memory
DL585 16 bpp 150 users
4 x AMD Opteron Dual-core CPUs 2.4 GHz 1024 KB L2 Cache 64 GB Memory
DL585 32 bpp 140 users
Table 5 - Server capacity by desktop color depth for Knowledge Worker scenario
Choosing 32-bit color depth for Remote Desktop Connection sessions instead of 16-bit results in a slight
increase in CPU usage. For the Knowledge Worker scenario, this results in a reduced server capacity
from 150 users to 140 users. There is also an increase in network bandwidth usage (8% in this case).
How much of an impact there will be depends on the scenario as well. A graphics-rich scenario will show
a greater impact of choosing 32-bit color depth because there will be more graphics data to process and
send over the network.
Windows printer redirection (XPS)
Windows printer redirection enables the redirection of a printer installed on the client computer to the
RD Session Host server session. Through this feature, print commands issued to server applications get
redirected to the client printer and the actual printing happens on the client side. To assess the effect of
enabling printer redirection on RD Session Host server scalability, the Knowledge Worker script was run
in a configuration where an HP LaserJet 6P printer was installed on the NULL port on each client
computer, and the clients were configured to redirect to the local printer when connecting to the server.
The script prints twice during the 30-minute work cycle: the first print job is a 19-KB Word document
and the second print job is a 16-KB Excel spreadsheet.
Test results show that network bandwidth usage is not significantly affected by printer redirection, and
the impact on other key system parameters (memory usage, CPU usage) is negligible. There is no impact
in terms of server capacity in the Knowledge Worker scenario.
Compression algorithm for RDP data
It is possible to specify which Remote Desktop Protocol (RDP) compression algorithm to use for Remote
Desktop Services connections by applying the Group Policy setting Set compression algorithm for RDP
data. By default, servers use an RDP compression algorithm that is based on the server's hardware
configuration. In the case of the server computers used for this testing, this algorithm is "Optimize to
use less memory." Testing was performed by using the default compression policy as well as setting the
policy to "Optimize to use less network bandwidth." This option uses less network bandwidth, but is
more memory-intensive. The test results show that there is no impact on server capacity by setting the
compression policy to "Optimize to use less network bandwidth." The impact on memory usage is
negligible, and there is an overall reduction in bandwidth usage. Additionally, the server is slightly more
responsive in this case after capacity is reached compared to the default compression policy.
Desktop Experience pack
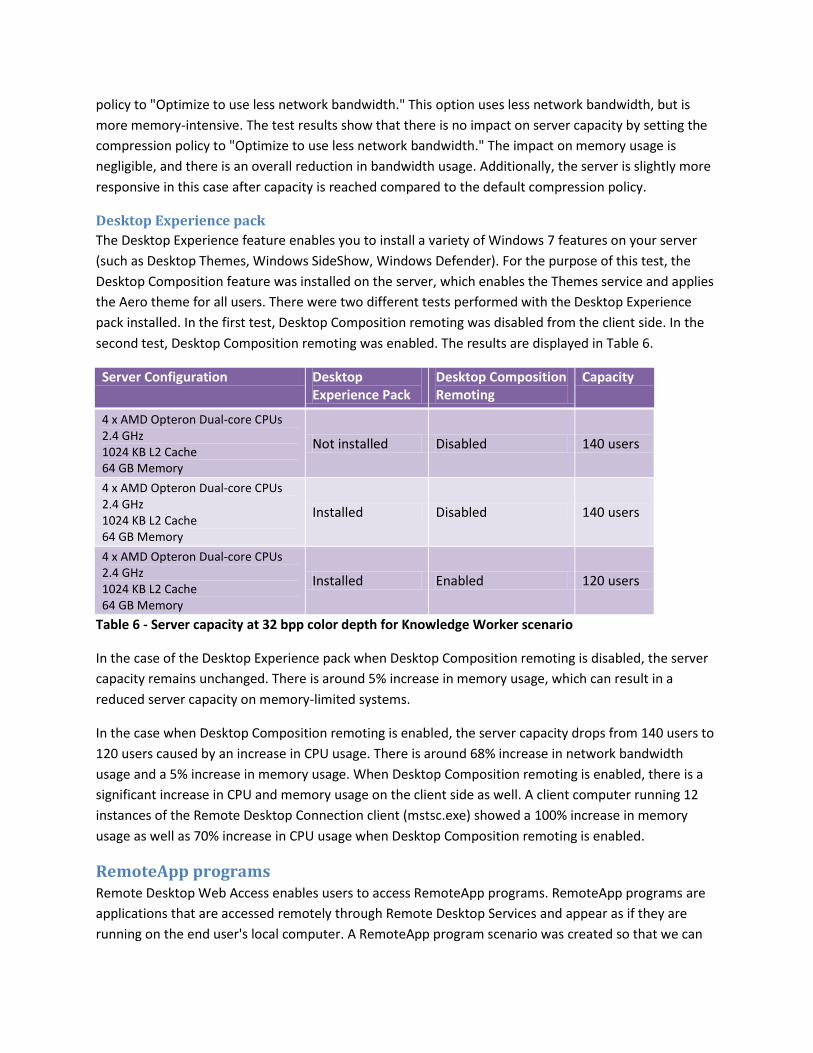
The Desktop Experience feature enables you to install a variety of Windows 7 features on your server
(such as Desktop Themes, Windows SideShow, Windows Defender). For the purpose of this test, the
Desktop Composition feature was installed on the server, which enables the Themes service and applies
the Aero theme for all users. There were two different tests performed with the Desktop Experience
pack installed. In the first test, Desktop Composition remoting was disabled from the client side. In the
second test, Desktop Composition remoting was enabled. The results are displayed in Table 6.
Server Configuration Desktop Experience Pack
Desktop Composition Remoting
Capacity
4 x AMD Opteron Dual-core CPUs 2.4 GHz 1024 KB L2 Cache 64 GB Memory
Not installed Disabled 140 users
4 x AMD Opteron Dual-core CPUs 2.4 GHz 1024 KB L2 Cache 64 GB Memory
Installed Disabled 140 users
4 x AMD Opteron Dual-core CPUs 2.4 GHz 1024 KB L2 Cache 64 GB Memory
Installed Enabled 120 users
Table 6 - Server capacity at 32 bpp color depth for Knowledge Worker scenario
In the case of the Desktop Experience pack when Desktop Composition remoting is disabled, the server
capacity remains unchanged. There is around 5% increase in memory usage, which can result in a
reduced server capacity on memory-limited systems.
In the case when Desktop Composition remoting is enabled, the server capacity drops from 140 users to
120 users caused by an increase in CPU usage. There is around 68% increase in network bandwidth
usage and a 5% increase in memory usage. When Desktop Composition remoting is enabled, there is a
significant increase in CPU and memory usage on the client side as well. A client computer running 12
instances of the Remote Desktop Connection client (mstsc.exe) showed a 100% increase in memory
usage as well as 70% increase in CPU usage when Desktop Composition remoting is enabled.
RemoteApp programs Remote Desktop Web Access enables users to access RemoteApp programs. RemoteApp programs are
applications that are accessed remotely through Remote Desktop Services and appear as if they are
running on the end user's local computer. A RemoteApp program scenario was created so that we can
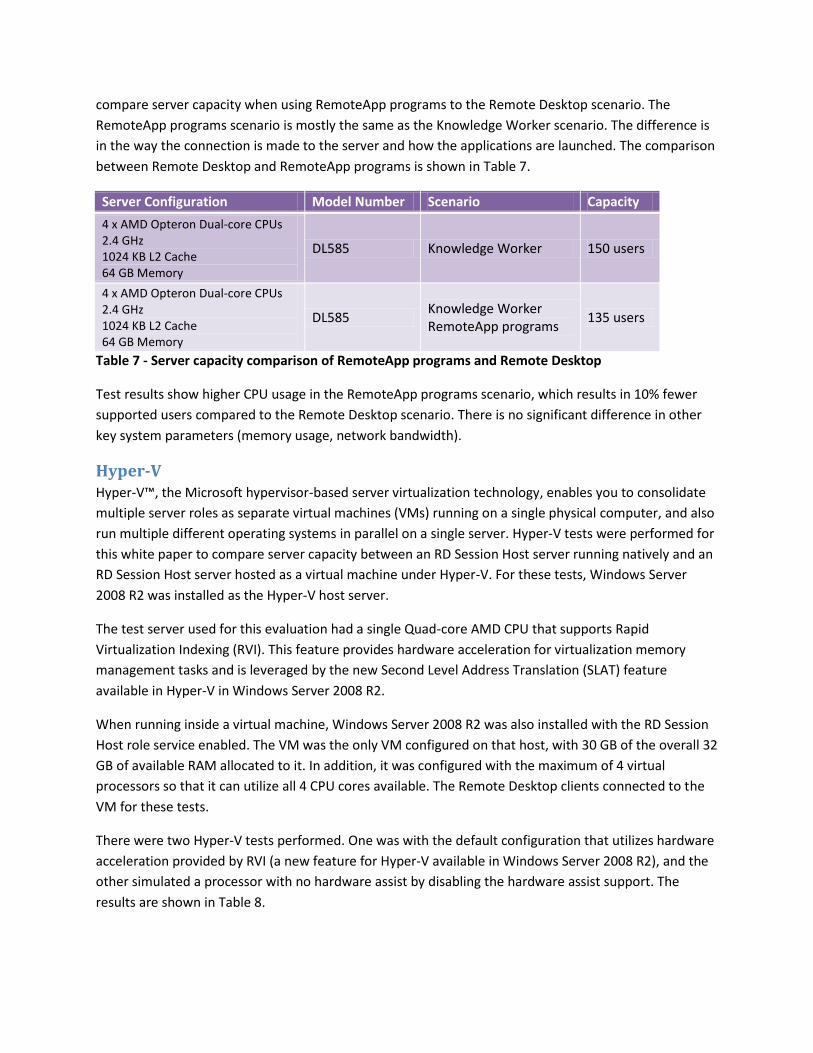
compare server capacity when using RemoteApp programs to the Remote Desktop scenario. The
RemoteApp programs scenario is mostly the same as the Knowledge Worker scenario. The difference is
in the way the connection is made to the server and how the applications are launched. The comparison
between Remote Desktop and RemoteApp programs is shown in Table 7.
Server Configuration Model Number Scenario Capacity
4 x AMD Opteron Dual-core CPUs 2.4 GHz 1024 KB L2 Cache 64 GB Memory
DL585 Knowledge Worker 150 users
4 x AMD Opteron Dual-core CPUs 2.4 GHz 1024 KB L2 Cache 64 GB Memory
DL585 Knowledge Worker RemoteApp programs
135 users
Table 7 - Server capacity comparison of RemoteApp programs and Remote Desktop
Test results show higher CPU usage in the RemoteApp programs scenario, which results in 10% fewer
supported users compared to the Remote Desktop scenario. There is no significant difference in other
key system parameters (memory usage, network bandwidth).
Hyper-V Hyper-V™, the Microsoft hypervisor-based server virtualization technology, enables you to consolidate
multiple server roles as separate virtual machines (VMs) running on a single physical computer, and also
run multiple different operating systems in parallel on a single server. Hyper-V tests were performed for
this white paper to compare server capacity between an RD Session Host server running natively and an
RD Session Host server hosted as a virtual machine under Hyper-V. For these tests, Windows Server
2008 R2 was installed as the Hyper-V host server.
The test server used for this evaluation had a single Quad-core AMD CPU that supports Rapid
Virtualization Indexing (RVI). This feature provides hardware acceleration for virtualization memory
management tasks and is leveraged by the new Second Level Address Translation (SLAT) feature
available in Hyper-V in Windows Server 2008 R2.
When running inside a virtual machine, Windows Server 2008 R2 was also installed with the RD Session
Host role service enabled. The VM was the only VM configured on that host, with 30 GB of the overall 32
GB of available RAM allocated to it. In addition, it was configured with the maximum of 4 virtual
processors so that it can utilize all 4 CPU cores available. The Remote Desktop clients connected to the
VM for these tests.
There were two Hyper-V tests performed. One was with the default configuration that utilizes hardware
acceleration provided by RVI (a new feature for Hyper-V available in Windows Server 2008 R2), and the
other simulated a processor with no hardware assist by disabling the hardware assist support. The
results are shown in Table 8.

Server Configuration Scenario SLAT Capacity
AMD Opteron Quad-core CPU 2.7 GHz 512 KB L2 Cache 30 GB Memory
Native N/A 180 users
AMD Opteron Quad-core CPU 2.7 GHz 512 KB L2 Cache 30 GB Memory
Hyper-V Enabled 150 users
AMD Opteron Quad-core CPU 2.7 GHz 512 KB L2 Cache 30 GB Memory
Hyper-V Disabled 70 users
Table 8 - Server capacity for Knowledge Worker v2 scenario without PowerPoint
In the case of SLAT-capable hardware, the Hyper-V scenario supports 17% fewer users when compared
to running natively without Hyper-V. When SLAT is disabled, the server capacity is reduced by 53%
compared to the SLAT-enabled scenario. Obviously, SLAT makes a very significant difference when
running the RD Session Host role service under Hyper-V. The processors that support this feature—
Rapid Virtualization Index (RVI) for AMD processors and Extended Page Tables (EPT) for Intel
processors—are strongly recommended.
Impact of Windows System Resource Manager (WSRM) Windows System Resource Manager (WSRM) is an administrative tool that can control how CPU and
memory resources are allocated. The WSRM management policy used for testing was "Equal per User,"
which makes sure that each user's set of processes gets equal CPU share. What this means is that one
user's process should not be able to starve other users of CPU.
The test results show that the WSRM "Equal per User" policy does not have a significant impact on
server capacity. The Knowledge Worker scenario was supported at 150 users each with and without
WSRM. However, there is an important effect of the WSRM policy on individual response times in the
Knowledge Worker scenario. Keep in mind the fact that the most CPU-intensive part of the scenario is
the work done in the PowerPoint application. In the baseline case without WSRM, as the CPU usage
reaches 100%, most user action response times deteriorate rapidly. In the WSRM case, it is apparent
from the results that the actions performed in PowerPoint become unresponsive a little earlier than the
baseline case and at a steeper rate. The response times for all other actions deteriorate at a noticeably
gentler pace. This means that the system is not allowing processes that consume higher CPU to starve
other users' processes, and is thus protecting the system overall from users that cause high CPU usage.
Comparison with Windows Server 2008
Server Configuration Model Number OS Capacity
4 x AMD Opteron Dual-core CPUs 2.4 GHz 1024 KB L2 Cache 64 GB Memory
DL585 Windows Server 2008 160 Users
4 x AMD Opteron Dual-core CPUs 2.4 GHz 1024 KB L2 Cache 64 GB Memory
DL585 Windows Server 2008 R2
150 Users
Table 9 - Server capacity by operating system for Knowledge Worker scenario
Table 9 shows the server capacity comparison between Windows Server 2008 and Windows Server 2008
R2 for the knowledge worker scenario. The memory usage on both operating systems is very similar.
Windows Server 2008 R2 uses slightly higher CPU when compared to Windows Server 2008, resulting in
a slightly reduced server capacity.
Conclusions Capacity planning for Remote Desktop deployments is subject to many variables and there are no good
off-the-shelf answers. Based on usage scenario and hardware configuration, the variance in capacity can
reach up to two orders of magnitude. If you need a relatively accurate estimate, either deploying a pilot
or running a load simulation are quite likely the only reliable ways to get that.
Remote Desktop Session Host server can provide good consolidation for certain scenarios if care is taken
when configuring the hardware and software. Supporting 200 users on a dual socket 2U form factor
server is completely viable for some of the medium to lighter weight scenarios.
When configuring an RD Session Host server, give special attention to the following:
Provide more CPU cores to not only increase overall server capacity, but also allow a server to
better absorb temporary peaks in CPU load like logon bursts or variation in load.
Provide the server with at least 8 GB of RAM, typically 16 GB.
Remember that enabling Desktop Composition will have a significant impact on resource usage
and will affect server capacity negatively.
When running RD Session Host servers in a virtualized environment, make sure the processor
supports paging at the hardware level (RVI for AMD, EPT for Intel).
Use WSRM in deployments where there are wide swings in CPU usage.
Properly size the server input/output throughput capacity.

Appendix A: Test Hardware Details The following servers were tested for Remote Desktop Services capacity planning data:
HP ProLiant DL 585
o 4 x AMD Opteron 8216 2.4 GHz CPUs (Dual-core)
o 1024 KB x 2 L2 Cache per processor
o 64 GB DDR2 RAM
o 8 x 72 GB 15K RPM SAS drives
o 100/1000 Mbps Intel NIC
HP ProLiant DL 385
o 2 x AMD Opteron 2216 HE 2.4 GHz CPUs (Dual-core)
o 1024 KB x 2 L2 Cache per processor
o 24 GB DDR2 RAM
o 8 x 72 GB 15K RPM SAS drives
o 100/1000 Mbps Intel NIC
Other components of the test laboratory included:
Domain Controller and Test Controller: HP Proliant DL145
o Dual core AMD Opteron processor 280 2.4GHz
o 2 GB Memory
o Windows Server 2008 Standard
o This server is the DHCP and DNS server for the domain. It manages the workstations
running Windows 7 Ultimate, including script control, software distribution, and remote
reset of the workstations.
Mail server and Web server: Dell PowerEdge 1950
o 2 x Intel(R) Xeon(TM) Dual Core CPU 3.0 GHz
o 2 GB Memory
o Windows Server 2008 Standard
o Exchange Server 2007
Workstations: HP dx5150
o AMD Athlon 64 processor 3000+ 1.8GHz
o 1 GB Memory
o Windows 7 Ultimate
Appendix B: Testing Tools Microsoft developed the Remote Desktop Load Simulation Tools to perform scalability testing. Remote
Desktop Load Simulation Tools is a suite of tools that assists organizations with capacity planning for
Windows Server 2008 R2 Remote Desktop Services. These tools allow organizations to easily place and
manage simulated loads on a server. This in turn can allow an organization to determine whether or not
its environment is able to handle the load that the organization expects to place on it. If you’d like to
conduct a capacity planning exercise for your specific deployment, you can download the Remote
Desktop Load Simulation Tools from the Microsoft Download Center
(http://go.microsoft.com/fwlink/?LinkId=178956).
The automation tools included in the suite are described below.
Test control infrastructure Test Controller - RDLoadSimulationController.exe
The RDLoadSimulationController tool is the central control point for the load simulation testing. It is
typically installed on the test controller computer. RDLoadSimulationController controls all test
parameters and defines the progression of the simulated user load. It also controls all custom
actions that are executed at any point during the test process. It communicates with
RDLoadSimulationClients and RDLoadSimulationServerAgent to synchronize and drive the client-
server remote desktop automation. It commands the RDLoadSimulationClients to run scripts that
load the RD Session Host server at operator-specified intervals.
Client Agent - RDLoadSimulationClient.exe The RDLoadSimulationClient tool controls the client side of the load simulation testing.
RDLoadSimulationClient is typically installed on the test client computers. RDLoadSimulationClient
receives commands from RDLoadSimulationController to run scripts that load the RD Session Host
server at operator-specified intervals. It executes custom commands received from the
RDLoadSimulationController and also sends the status of the executing scripts to the
RDLoadSimulationController. RDLoadSimulationClient also performs desktop management on the
test client computers. It creates a new desktop for each script that it launches and provides the
means to navigate between all desktops.
Server Agent - RDLoadSimulationServerAgent.exe The RDLoadSimulationServerAgent tool runs on the target Remote Desktop Session Host server. It
runs custom commands that are sent to it by the RDLoadSimulationController. It is also used by
RDLoadSimulationController for test synchronization.
SwitchDesktop.exe The SwitchDesktop tool runs on the test client computers. It runs inside each new desktop that is
created on the client. Its only function is to provide a way to switch back to the default desktop
where the RDLoadSimulationClient is running.
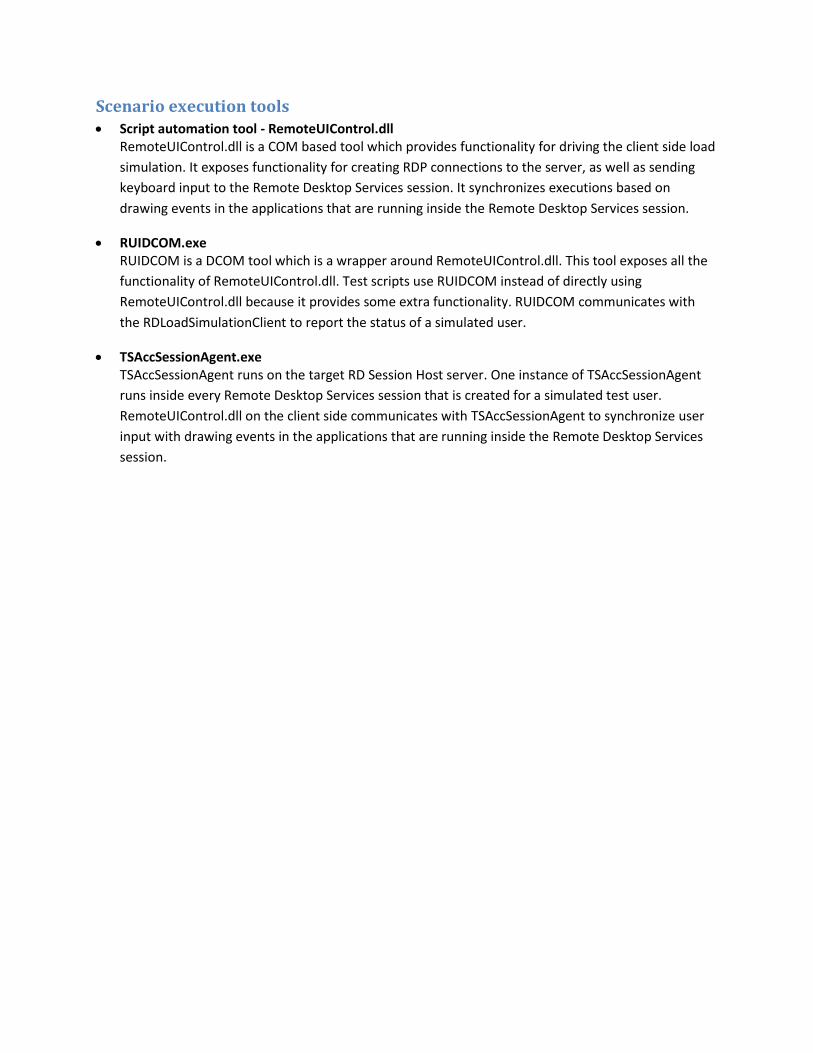
Scenario execution tools Script automation tool - RemoteUIControl.dll
RemoteUIControl.dll is a COM based tool which provides functionality for driving the client side load
simulation. It exposes functionality for creating RDP connections to the server, as well as sending
keyboard input to the Remote Desktop Services session. It synchronizes executions based on
drawing events in the applications that are running inside the Remote Desktop Services session.
RUIDCOM.exe RUIDCOM is a DCOM tool which is a wrapper around RemoteUIControl.dll. This tool exposes all the
functionality of RemoteUIControl.dll. Test scripts use RUIDCOM instead of directly using
RemoteUIControl.dll because it provides some extra functionality. RUIDCOM communicates with
the RDLoadSimulationClient to report the status of a simulated user.
TSAccSessionAgent.exe TSAccSessionAgent runs on the target RD Session Host server. One instance of TSAccSessionAgent
runs inside every Remote Desktop Services session that is created for a simulated test user.
RemoteUIControl.dll on the client side communicates with TSAccSessionAgent to synchronize user
input with drawing events in the applications that are running inside the Remote Desktop Services
session.

Appendix C: Test Scenario Definitions and Flow Chart
Knowledge Worker v2 Typing Speed = 35 words per minute
Definition: the Knowledge Worker scenario includes creating and saving Word documents, printing Excel
spreadsheets, communicating by e-mail in Outlook, adding slides to PowerPoint presentations, running
slide shows, and browsing Web pages in Internet Explorer. The following workflow details the scenario.

Connect User “smcxxx”
Start (Outlook) - Send new e-mail messages Send a new appointment invitation Send a new e-mail message Minimize Outlook Start (Word) - Start and exit Word
Start (Microsoft Excel) - Start and exit Excel loop(forever)
Start (Word) - Type a page of text and print Open a Word document Type a page of text Modify and format text Check spelling Print Save Exit Word
Start (Microsoft Excel) - Load Excel spreadsheet, modify, and print it Load Excel spreadsheet Modify data and format Print Save Exit Excel
Start (PowerPoint) - Load presentation and run slide show Load a PowerPoint presentation Navigate Add a new slide Format text Run slide show Save file Exit PowerPoint
Switch To Process, (Outlook) - send e-mail, read message, and respond Send e-mail to other users Read e-mail and respond Minimize Outlook
Start (Internet Explorer) - Load presentation and run slide show Loop (2)

URL http://tsexchange/tsperf/WindowsServer.htm URL http://tsexchange/tsperf/Office.htm URL http://tsexchange/tsperf/MSNMoney.htm
End of loop Exit Internet Explorer
End of loop
Knowledge Worker v1 Typing Speed = 35 words per minute
Definition: a worker who gathers, adds value to, and communicates information in a decision support
process. Cost of downtime is variable but highly visible. Projects and ad-hoc needs towards flexible tasks
drive these resources. These workers make their own decisions on what to work on and how to
accomplish the task. The usual tasks they perform are marketing, project management, sales, desktop
publishing, decision support, data mining, financial analysis, executive and supervisory management,
design, and authoring.
Connect User “smcxxx” Start (Microsoft Excel) - Load massive Excel spreadsheet and print it
Open File c:\documents and settings\smcxxx\Carolinas Workbook.xls Print Close document Minimize Excel
Start (Outlook) - Send a new, short e-mail message ( e-mail2 ) Minimize Outlook
Start (Internet Explorer) URL http://tsexchange/tsperf/Functions_JScript.asp Minimize Internet Explorer
Start (Word) - Type a page of text ( Document2 ) Save Print Close document Minimize Word
Switch To (Excel) Create a spreadsheet of sales vs months
( spreadsheet )
Create graph ( graph ) Save
Close document Minimize Excel
Switch To Process, (Outlook) - read e-mail message and respond ( Reply2 )
Minimize Outlook Now, Toggle between apps in a loop
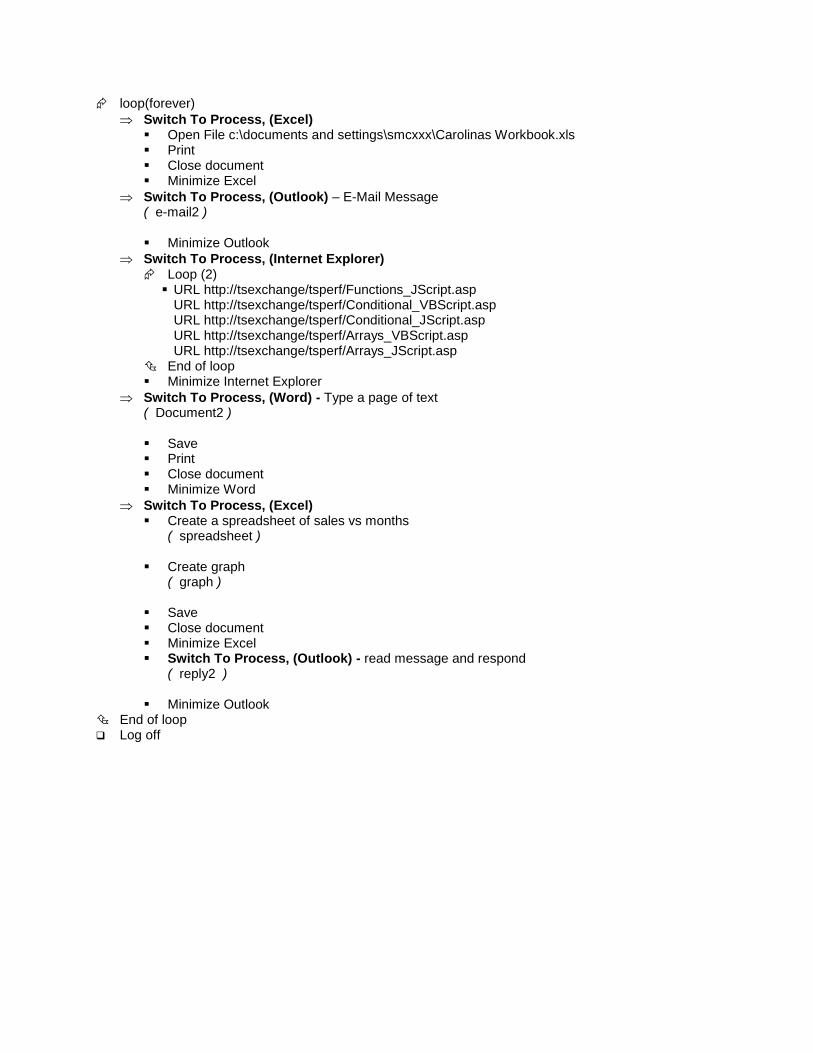
loop(forever)
Switch To Process, (Excel) Open File c:\documents and settings\smcxxx\Carolinas Workbook.xls Print Close document Minimize Excel
Switch To Process, (Outlook) – E-Mail Message ( e-mail2 ) Minimize Outlook
Switch To Process, (Internet Explorer) Loop (2) URL http://tsexchange/tsperf/Functions_JScript.asp
URL http://tsexchange/tsperf/Conditional_VBScript.asp URL http://tsexchange/tsperf/Conditional_JScript.asp URL http://tsexchange/tsperf/Arrays_VBScript.asp URL http://tsexchange/tsperf/Arrays_JScript.asp
End of loop Minimize Internet Explorer
Switch To Process, (Word) - Type a page of text ( Document2 ) Save Print Close document Minimize Word
Switch To Process, (Excel) Create a spreadsheet of sales vs months
( spreadsheet )
Create graph ( graph )
Save Close document Minimize Excel Switch To Process, (Outlook) - read message and respond
( reply2 )
Minimize Outlook End of loop Log off
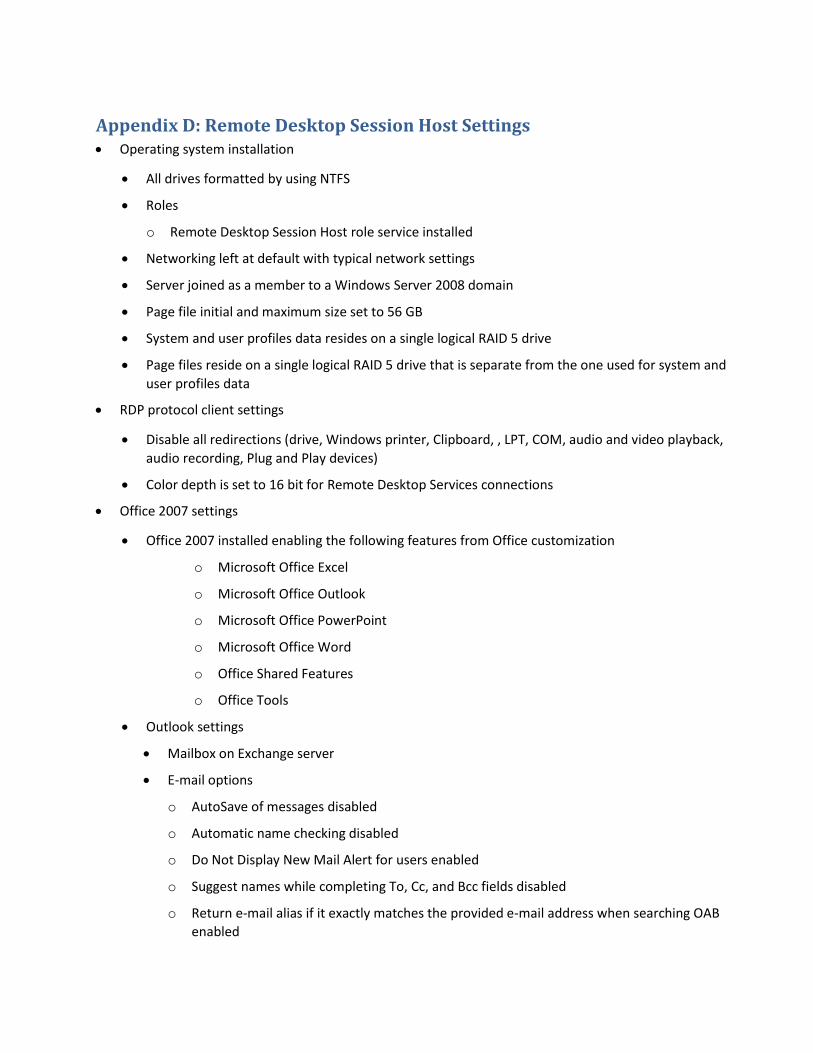
Appendix D: Remote Desktop Session Host Settings Operating system installation
All drives formatted by using NTFS
Roles
o Remote Desktop Session Host role service installed
Networking left at default with typical network settings
Server joined as a member to a Windows Server 2008 domain
Page file initial and maximum size set to 56 GB
System and user profiles data resides on a single logical RAID 5 drive
Page files reside on a single logical RAID 5 drive that is separate from the one used for system and
user profiles data
RDP protocol client settings
Disable all redirections (drive, Windows printer, Clipboard, , LPT, COM, audio and video playback,
audio recording, Plug and Play devices)
Color depth is set to 16 bit for Remote Desktop Services connections
Office 2007 settings
Office 2007 installed enabling the following features from Office customization
o Microsoft Office Excel
o Microsoft Office Outlook
o Microsoft Office PowerPoint
o Microsoft Office Word
o Office Shared Features
o Office Tools
Outlook settings
Mailbox on Exchange server
E-mail options
o AutoSave of messages disabled
o Automatic name checking disabled
o Do Not Display New Mail Alert for users enabled
o Suggest names while completing To, Cc, and Bcc fields disabled
o Return e-mail alias if it exactly matches the provided e-mail address when searching OAB
enabled
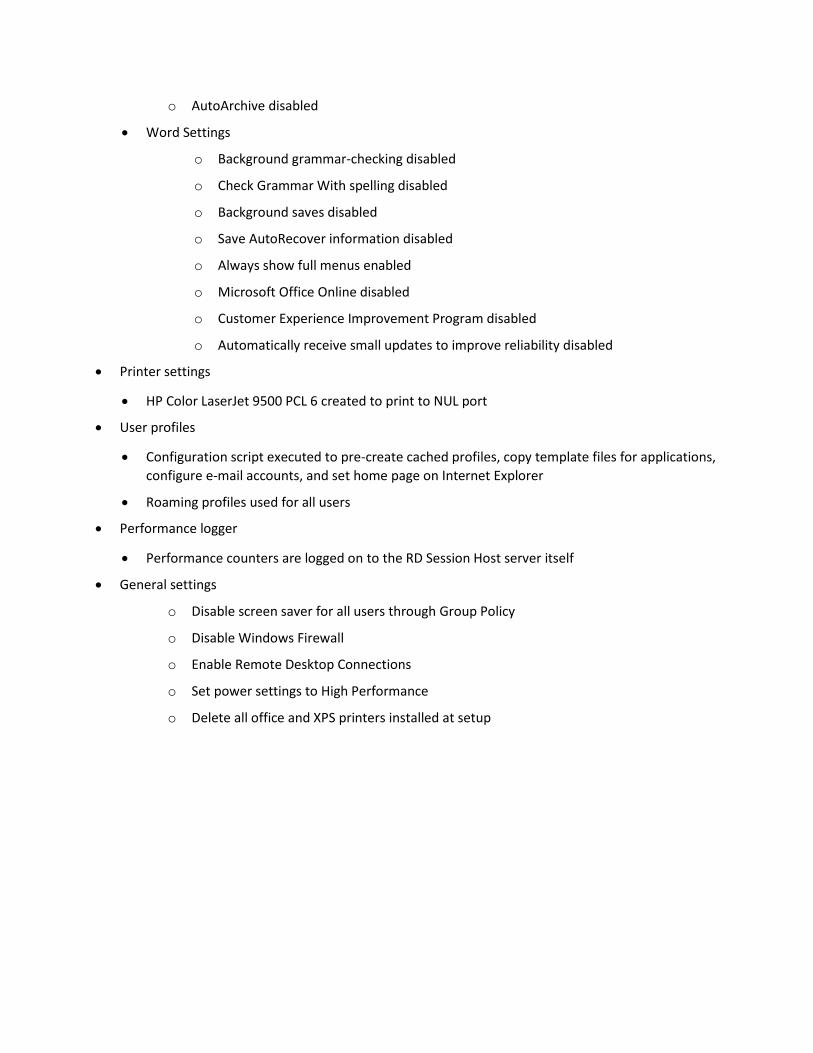
o AutoArchive disabled
Word Settings
o Background grammar-checking disabled
o Check Grammar With spelling disabled
o Background saves disabled
o Save AutoRecover information disabled
o Always show full menus enabled
o Microsoft Office Online disabled
o Customer Experience Improvement Program disabled
o Automatically receive small updates to improve reliability disabled
Printer settings
HP Color LaserJet 9500 PCL 6 created to print to NUL port
User profiles
Configuration script executed to pre-create cached profiles, copy template files for applications,
configure e-mail accounts, and set home page on Internet Explorer
Roaming profiles used for all users
Performance logger
Performance counters are logged on to the RD Session Host server itself
General settings
o Disable screen saver for all users through Group Policy
o Disable Windows Firewall
o Enable Remote Desktop Connections
o Set power settings to High Performance
o Delete all office and XPS printers installed at setup
Recommended


![[MS-RDSOD]: Remote Desktop Services Protocols Overview... · with is referred to as a Remote Desktop Session Host (RD Session Host), which connects the RDP client to the remote application](https://img.dokumen.tips/doc/110x75/5e85843e2c0c33736d047eee/ms-rdsod-remote-desktop-services-protocols-overview-with-is-referred-to.jpg)