19-Sep-17
Key Highlights of the Report:
52wk Range H/L
Mkt Capital (Rs Cr)
Av. Volume (,000)
Financials/Valu
ation
FY15 FY16 FY17 FY18E FY19ENet Sales 3,75,435 2,93,298 3,30,180 4,43,483 4,93,634
EBITDA 37,364 41,704 46,194 68,392 76,153
EBIT 31,114 33,927 40,142 54,437 60,833
PAT 23,566 29,861 29,833 40,049 44,755
1QFY18 4QFY17 3QFY17 EPS (Rs) 73 92 92 124 138
Promoters 46.3 46.3 46.5 EPS growth (%) 5% 27% 0% 34% 12%
Public 53.7 53.7 53.5 ROE (%) 11% 13% 11% 13% 13%
Total 100 100 100 ROCE (%) 8% 8% 8% 11% 11%
BV 675 715 814 941 1,062
P/B (X) 1.2 1.5 1.5 1.3 1.2
1Mn 3Mn 1Yr P/E (x) 11.3 11.3 13.5 10.1 9.0
Absolute 7.3 24.5 63.6
Rel.to Nifty 4.3 19.7 50.9 RECENT DEVELOPMENT: Commencement of Ethane Project
ADITYA [email protected]
Narnolia Securities LtdPlease refer to the Disclaimers at the end of this Report
INDUSTRY - OIL & GAS
BSE Code - 500325
NSE Code - RELIANCE
Target Price 900
Previous Target Price 840
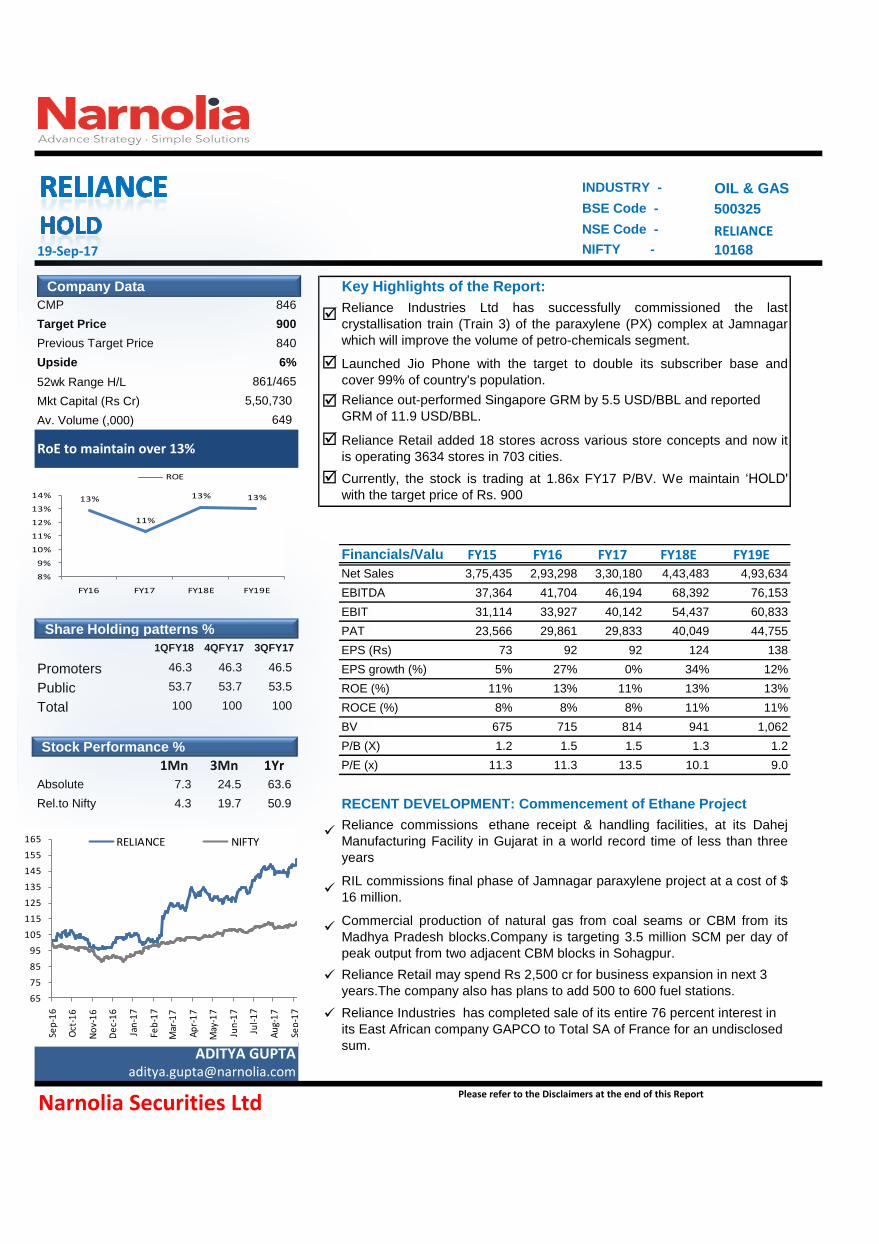
RoE to maintain over 13%
5,50,730
649
Upside 6%
861/465
CMP 846
Reliance Retail may spend Rs 2,500 cr for business expansion in next 3
years.The company also has plans to add 500 to 600 fuel stations.
Reliance Industries has completed sale of its entire 76 percent interest in
its East African company GAPCO to Total SA of France for an undisclosed
sum.
NIFTY - 10168
Currently, the stock is trading at 1.86x FY17 P/BV. We maintain ‘HOLD'
with the target price of Rs. 900
Reliance Retail added 18 stores across various store concepts and now it
is operating 3634 stores in 703 cities.
Reliance out-performed Singapore GRM by 5.5 USD/BBL and reported
GRM of 11.9 USD/BBL.
Reliance Industries Ltd has successfully commissioned the last
crystallisation train (Train 3) of the paraxylene (PX) complex at Jamnagar
which will improve the volume of petro-chemicals segment.
RIL commissions final phase of Jamnagar paraxylene project at a cost of $
16 million.
Reliance commissions ethane receipt & handling facilities, at its Dahej
Manufacturing Facility in Gujarat in a world record time of less than three
years
Launched Jio Phone with the target to double its subscriber base and
cover 99% of country's population.
Commercial production of natural gas from coal seams or CBM from its
Madhya Pradesh blocks.Company is targeting 3.5 million SCM per day of
peak output from two adjacent CBM blocks in Sohagpur.
Company Data
Stock Performance %
Share Holding patterns %
65
75
85
95
105
115
125
135
145
155
165
Sep
-16
Oct
-16
No
v-1
6
De
c-1
6
Jan
-17
Feb
-17
Mar
-17
Ap
r-1
7
May
-17
Jun
-17
Jul-
17
Au
g-1
7
Sep
-17
RELIANCE NIFTY
13%
11%
13% 13%
8%
9%
10%
11%
12%
13%
14%
FY16 FY17 FY18E FY19E
ROE

Financials 1QFY17 2QFY17 3QFY17 4QFY17 1QFY18 YoY % QoQ% FY16 FY17 YoY %
Total Volumes ('000) 17 18 18 18 18 4% 0% 70 70 1%
GRM(USD/BBL) 11.5 10.1 10.8 11.5 11.9 3% 3% 11 11 2%
Net Sales 71,451 81,651 84,189 92,889 90,537 27% -3% 2,93,298 3,30,180 13%
Other Income 2,378 2,393 2,736 1,936 2,124 -11% 10% 7,479 9,443 26%
COGS 49,519 59,396 60,486 67,697 65,196 32% -4% 2,08,113 2,37,098 14%
Employee Cost 2,111 2,017 1,894 2,366 2,455 16% 4% 7,407 8,388 13%
Other Expenses 8,598 9,062 10,257 10,593 10,332 20% -2% 36,074 38,500 7%
EBITDA 11,223 11,176 11,552 12,233 12,554 12% 3% 41,704 46,194 11%
Depreciation 2,725 2,774 2,793 3,354 3,037 11% -9% 11,565 11,646 1%
Interest 1,206 893 1,209 556 1,119 -7% 101% 3,691 3,849 4%
PBT 9,670 9,902 10,286 10,259 10,522 9% 3% 33,927 40,142 18%
Tax 2,581 2,708 2,719 2,201 2,544 -1% 16% 8,876 10,201 15%
PAT 7,113 7,206 7,506 8,053 9,079 28% 13% 29,861 29,833 0%
Robust volume growth accompanied by highest GRM of 11.9 USD/BBL
Reliance operated 1,238 petroleum retail outlets in the country in 1QFY18
Narnolia Securities LtdPlease refer to the Disclaimers at the end of this Report
Quarterly Performance
Reliance Jamnagar refineries processed 17.3 MMT crude in 1Q FY18, vs 17.8 MMT crude processed
in the previous quarter..
Reliance reported Rs.90537 crore of net sales in 1QFY18 a growth of 27% over same quarter
previous year. This was driven by growth in organised retail and petro-chemicals business.
EBITDA for 1QFY18 is Rs. 12554 Cr. a growth of 12% over same quarter previous year.EBITDA
margin in 1QFY18 stood at 13.86%
Profit after tax for 1QFY18 is Rs. 9079 Cr a growth of 28% over same quarter previous year.
The capital expenditure for the year ended 30th June 2017 was Rs. 25192 crore
Reliance has reported GRM of 11.9 USD/BBL in 1QFY18 despite weakening in gasoline/diesel cracks
and lower light- heavy and Brent-Dubai spreads, Higher GRM is achieved due to better yield/crude
optimization and risk management.
Reliance has outperformed singapore GRM
by USD 5.5 /BBL.
0%
2%
4%
6%
8%
10%
12%
14%
-
1,000
2,000
3,000
4,000
5,000
6,000
7,000
8,000
Refining EBIT(Rs in CR) EBIT Margins(%)
87
10 10 1112
1111.5
1011
12 12
5
6
98
6
8 87
5
76 6
0
2
4
6
8
10
12
14
RIL GRM(USD/bbl) Singapore GRM(USD/bbl)
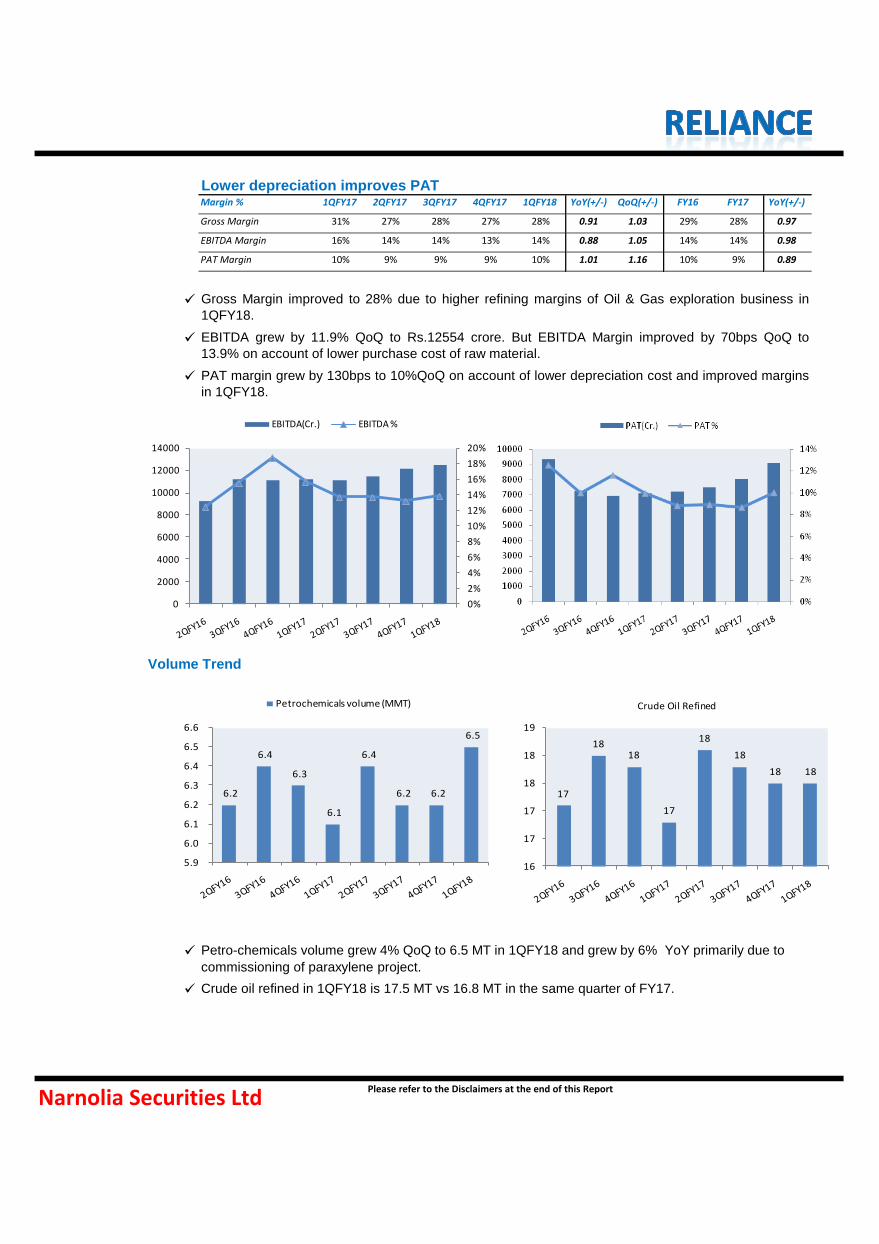
Margin % 1QFY17 2QFY17 3QFY17 4QFY17 1QFY18 YoY(+/-) QoQ(+/-) FY16 FY17 YoY(+/-)
Gross Margin 31% 27% 28% 27% 28% 0.91 1.03 29% 28% 0.97
EBITDA Margin 16% 14% 14% 13% 14% 0.88 1.05 14% 14% 0.98
PAT Margin 10% 9% 9% 9% 10% 1.01 1.16 10% 9% 0.89
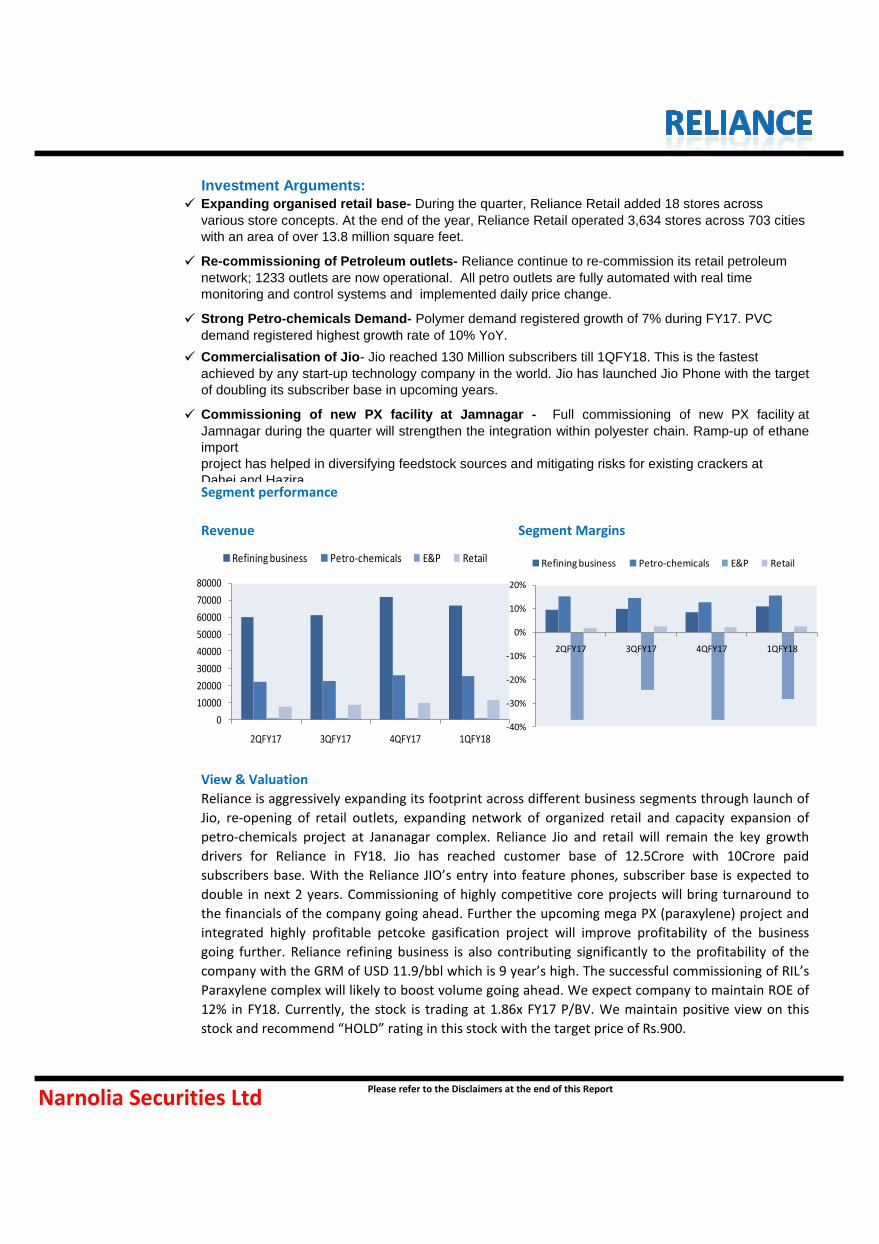
Volume Trend
Lower depreciation improves PAT
Narnolia Securities LtdPlease refer to the Disclaimers at the end of this Report
Gross Margin improved to 28% due to higher refining margins of Oil & Gas exploration business in
1QFY18.
EBITDA grew by 11.9% QoQ to Rs.12554 crore. But EBITDA Margin improved by 70bps QoQ to
13.9% on account of lower purchase cost of raw material.
PAT margin grew by 130bps to 10%QoQ on account of lower depreciation cost and improved margins
in 1QFY18.
Petro-chemicals volume grew 4% QoQ to 6.5 MT in 1QFY18 and grew by 6% YoY primarily due to
commissioning of paraxylene project.
Crude oil refined in 1QFY18 is 17.5 MT vs 16.8 MT in the same quarter of FY17.
0%
2%
4%
6%
8%
10%
12%
14%
16%
18%
20%
0
2000
4000
6000
8000
10000
12000
14000
EBITDA(Cr.) EBITDA %
17
1818
17
18
18
18 18
16
17
17
18
18
19
Crude Oil Refined
6.2
6.4
6.3
6.1
6.4
6.2 6.2
6.5
5.9
6.0
6.1
6.2
6.3
6.4
6.5
6.6
Petrochemicals volume (MMT)
Segment performance
Revenue Segment Margins
View & Valuation
Commercialisation of Jio- Jio reached 130 Million subscribers till 1QFY18. This is the fastest
achieved by any start-up technology company in the world. Jio has launched Jio Phone with the target
of doubling its subscriber base in upcoming years.
Re-commissioning of Petroleum outlets- Reliance continue to re-commission its retail petroleum
network; 1233 outlets are now operational. All petro outlets are fully automated with real time
monitoring and control systems and implemented daily price change.
Strong Petro-chemicals Demand- Polymer demand registered growth of 7% during FY17. PVC
demand registered highest growth rate of 10% YoY.
Reliance is aggressively expanding its footprint across different business segments through launch of
Jio, re-opening of retail outlets, expanding network of organized retail and capacity expansion of
petro-chemicals project at Jananagar complex. Reliance Jio and retail will remain the key growth
drivers for Reliance in FY18. Jio has reached customer base of 12.5Crore with 10Crore paid
subscribers base. With the Reliance JIO’s entry into feature phones, subscriber base is expected to
double in next 2 years. Commissioning of highly competitive core projects will bring turnaround to
the financials of the company going ahead. Further the upcoming mega PX (paraxylene) project and
integrated highly profitable petcoke gasification project will improve profitability of the business
going further. Reliance refining business is also contributing significantly to the profitability of the
company with the GRM of USD 11.9/bbl which is 9 year’s high. The successful commissioning of RIL’s
Paraxylene complex will likely to boost volume going ahead. We expect company to maintain ROE of
12% in FY18. Currently, the stock is trading at 1.86x FY17 P/BV. We maintain positive view on this
stock and recommend “HOLD” rating in this stock with the target price of Rs.900.
Investment Arguments:
Expanding organised retail base- During the quarter, Reliance Retail added 18 stores across
various store concepts. At the end of the year, Reliance Retail operated 3,634 stores across 703 cities
with an area of over 13.8 million square feet.
Narnolia Securities LtdPlease refer to the Disclaimers at the end of this Report
Commissioning of new PX facility at Jamnagar - Full commissioning of new PX facility at
Jamnagar during the quarter will strengthen the integration within polyester chain. Ramp-up of ethane
import
project has helped in diversifying feedstock sources and mitigating risks for existing crackers at
Dahej and Hazira.
0
10000
20000
30000
40000
50000
60000
70000
80000
2QFY17 3QFY17 4QFY17 1QFY18
Refining business Petro-chemicals E&P Retail
-40%
-30%
-20%
-10%
0%
10%
20%
2QFY17 3QFY17 4QFY17 1QFY18
Refining business Petro-chemicals E&P Retail
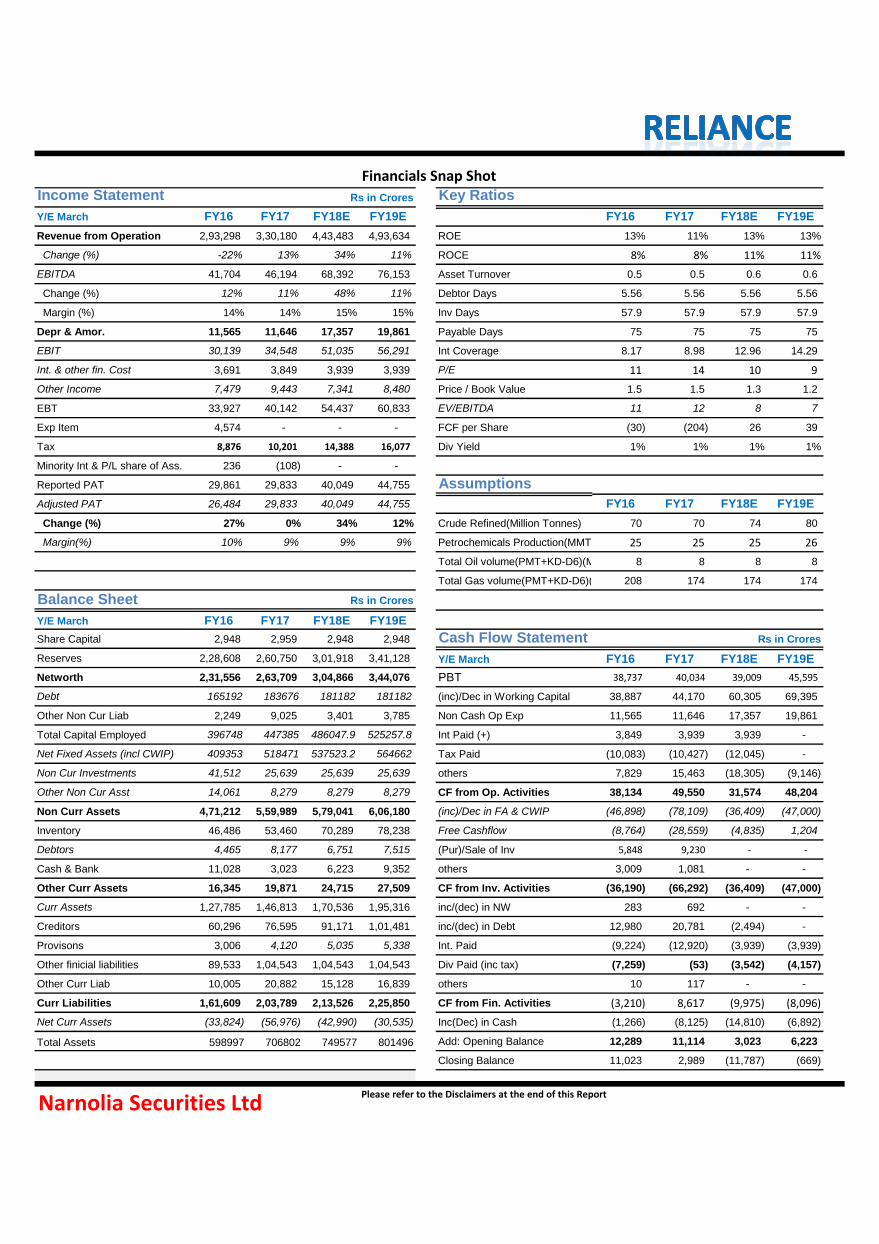
Income Statement Rs in Crores Key Ratios
Y/E March FY16 FY17 FY18E FY19E FY16 FY17 FY18E FY19E
Revenue from Operation 2,93,298 3,30,180 4,43,483 4,93,634 ROE 13% 11% 13% 13%
Change (%) -22% 13% 34% 11% ROCE 8% 8% 11% 11%
EBITDA 41,704 46,194 68,392 76,153 Asset Turnover 0.5 0.5 0.6 0.6
Change (%) 12% 11% 48% 11% Debtor Days 5.56 5.56 5.56 5.56
Margin (%) 14% 14% 15% 15% Inv Days 57.9 57.9 57.9 57.9
Depr & Amor. 11,565 11,646 17,357 19,861 Payable Days 75 75 75 75
EBIT 30,139 34,548 51,035 56,291 Int Coverage 8.17 8.98 12.96 14.29
Int. & other fin. Cost 3,691 3,849 3,939 3,939 P/E 11 14 10 9
Other Income 7,479 9,443 7,341 8,480 Price / Book Value 1.5 1.5 1.3 1.2
EBT 33,927 40,142 54,437 60,833 EV/EBITDA 11 12 8 7
Exp Item 4,574 - - - FCF per Share (30) (204) 26 39
Tax 8,876 10,201 14,388 16,077 Div Yield 1% 1% 1% 1%
Minority Int & P/L share of Ass. 236 (108) - -
Reported PAT 29,861 29,833 40,049 44,755 Assumptions
Adjusted PAT 26,484 29,833 40,049 44,755 FY16 FY17 FY18E FY19E
Change (%) 27% 0% 34% 12% Crude Refined(Million Tonnes) 70 70 74 80
Margin(%) 10% 9% 9% 9% Petrochemicals Production(MMT) 25 25 25 26
Total Oil volume(PMT+KD-D6)(MMBBL) 8 8 8 8
Total Gas volume(PMT+KD-D6)(BCF) 208 174 174 174
Balance Sheet Rs in Crores
Y/E March FY16 FY17 FY18E FY19E
Share Capital 2,948 2,959 2,948 2,948 Cash Flow Statement Rs in Crores
Reserves 2,28,608 2,60,750 3,01,918 3,41,128 Y/E March FY16 FY17 FY18E FY19E
Networth 2,31,556 2,63,709 3,04,866 3,44,076 PBT 38,737 40,034 39,009 45,595
Debt 165192 183676 181182 181182 (inc)/Dec in Working Capital 38,887 44,170 60,305 69,395
Other Non Cur Liab 2,249 9,025 3,401 3,785 Non Cash Op Exp 11,565 11,646 17,357 19,861
Total Capital Employed 396748 447385 486047.9 525257.8 Int Paid (+) 3,849 3,939 3,939 -
Net Fixed Assets (incl CWIP) 409353 518471 537523.2 564662 Tax Paid (10,083) (10,427) (12,045) -
Non Cur Investments 41,512 25,639 25,639 25,639 others 7,829 15,463 (18,305) (9,146)
Other Non Cur Asst 14,061 8,279 8,279 8,279 CF from Op. Activities 38,134 49,550 31,574 48,204
Non Curr Assets 4,71,212 5,59,989 5,79,041 6,06,180 (inc)/Dec in FA & CWIP (46,898) (78,109) (36,409) (47,000)
Inventory 46,486 53,460 70,289 78,238 Free Cashflow (8,764) (28,559) (4,835) 1,204
Debtors 4,465 8,177 6,751 7,515 (Pur)/Sale of Inv 5,848 9,230 - -
Cash & Bank 11,028 3,023 6,223 9,352 others 3,009 1,081 - -
Other Curr Assets 16,345 19,871 24,715 27,509 CF from Inv. Activities (36,190) (66,292) (36,409) (47,000)
Curr Assets 1,27,785 1,46,813 1,70,536 1,95,316 inc/(dec) in NW 283 692 - -
Creditors 60,296 76,595 91,171 1,01,481 inc/(dec) in Debt 12,980 20,781 (2,494) -
Provisons 3,006 4,120 5,035 5,338 Int. Paid (9,224) (12,920) (3,939) (3,939)
Other finicial liabilities 89,533 1,04,543 1,04,543 1,04,543 Div Paid (inc tax) (7,259) (53) (3,542) (4,157)
Other Curr Liab 10,005 20,882 15,128 16,839 others 10 117 - -
Curr Liabilities 1,61,609 2,03,789 2,13,526 2,25,850 CF from Fin. Activities (3,210) 8,617 (9,975) (8,096)
Net Curr Assets (33,824) (56,976) (42,990) (30,535) Inc(Dec) in Cash (1,266) (8,125) (14,810) (6,892)
Total Assets 598997 706802 749577 801496 Add: Opening Balance 12,289 11,114 3,023 6,223
Closing Balance 11,023 2,989 (11,787) (669)
Financials Snap Shot
Narnolia Securities LtdPlease refer to the Disclaimers at the end of this Report

Narnolia Securities Ltd201 | 2nd Floor | Marble Arch Build ing | 236B-AJC Bose
Road | Kolkata-700 020 , Ph : 033-40501500
email: [email protected],
website : www.narnolia.com
Risk Disclosure & Disclaimer: This report/message is for the personal information of
the authorized recipient and does not construe to be any investment, legal or taxation
advice to you. Narnolia Securities Ltd. (Hereinafter referred as NSL) is not soliciting any
action based upon it. This report/message is not for public distribution and has been
furnished to you solely for your information and should not be reproduced or
redistributed to any other person in any from. The report/message is based upon publicly
available information, findings of our research wing “East wind” & information that we
consider reliable, but we do not represent that it is accurate or complete and we do not
provide any express or implied warranty of any kind, and also these are subject to change
without notice. The recipients of this report should rely on their own investigations,
should use their own judgment for taking any investment decisions keeping in mind that
past performance is not necessarily a guide to future performance & that the the value of
any investment or income are subject to market and other risks. Further it will be safe to
assume that NSL and /or its Group or associate Companies, their Directors, affiliates
and/or employees may have interests/ positions, financial or otherwise, individually or
otherwise in the recommended/mentioned securities/mutual funds/ model funds and
other investment products which may be added or disposed including & other mentioned
in this report/message.
Recommended