1
Regulation of Inflammatory Phenotype in Macrophages by a
Diabetes-Induced Long Non-coding RNA
Marpadga A. Reddy1*, Zhuo Chen
1, Jung Tak Park
1,2, Mei Wang
1, Linda Lanting
1, Qiang
Zhang1, Kirti Bhatt
1, Amy Leung
1, Xiwei Wu
1, Sumanth Putta
1, Pål Sætrom
3, Sridevi
Devaraj4 and Rama Natarajan
1*
1 Department of Diabetes and Division of Molecular Diabetes Research, Beckman Research
Institute of City of Hope, Duarte, CA. 2Current address: Department of Internal Medicine,
College of Medicine, Yonsei University, Seoul, Korea. 3Departments of Computer and
Information Science, Cancer Research and Molecular Medicine, Norwegian University of
Science and Technology, Trondheim, Norway (P.S.)., 4Department of Pathology and
Immunology, Baylor College of Medicine and Texas Children's Hospital, Houston, TX.
Running Title: Diabetes induced lncRNA in macrophages
*Correspondence to:
Rama Natarajan, PhD (Email: [email protected])
Marpadga A. Reddy, PhD (Email: [email protected])
Department of Diabetes, Beckman Research Institute of the City of Hope
1500 East Duarte Road, Duarte, CA 91010
Tel. 626-256-4673; Fax: 626-301-8136
Word Count: Abstract -200; Introduction through Discussion - 4943
Number of Figures: 6. Tables: 1
Page 1 of 57 Diabetes
Diabetes Publish Ahead of Print, published online July 9, 2014
2
ABSTRACT
The mechanisms by which macrophages mediate the enhanced inflammation associated with
diabetes complications are not completely understood. We used RNA-seq to profile the
transcriptome of bone marrow macrophages isolated from diabetic db/db mice and identified
1648 differentially expressed genes compared to control db/+ mice. Data analyses revealed that
diabetes promoted a pro-inflammatory, pro-fibrotic and dysfunctional alternatively activated
macrophage phenotype possibly via transcription factors involved in macrophage function.
Notably, diabetes altered levels of several long non-coding RNAs (lncRNAs). Because, the role
of lncRNAs in diabetic complications is unknown, we further characterized the function of
lncRNA E330013P06 which was up-regulated in macrophages from db/db and diet-induced
insulin resistant type-2 diabetic mice, but not from type-1 diabetic mice. It was also up-regulated
in monocytes from type-2 diabetes patients. E330013P06 was also increased along with
inflammatory genes, in mouse macrophages treated with high glucose and palmitic acid.
E330013P06 overexpression in macrophages induced inflammatory genes, enhanced responses
to inflammatory signals, and increased foam cell formation. In contrast, siRNA-mediated
E330013P06 gene silencing inhibited inflammatory genes induced by the diabetic stimuli. These
results define the diabetic macrophage transcriptome, and novel functional roles for lncRNAs in
macrophages that could lead to lncRNA based therapies for inflammatory diabetic
complications.
Key Words: long noncoding RNA, macrophage, diabetes, inflammation.
Page 2 of 57Diabetes
3
INTRODUCTION
Macrophages play important roles in the regulation of physiological and pathological
processes including metabolism, inflammation, pathogen response, tissue damage and repair.
Differentiation and polarization of macrophages into classically activated M1 phenotype or
alternatively activated M2 phenotype are essential for the plasticity needed to adapt cellular
functions in dynamic microenvironments of target tissues and disease states (1,2). In general,
M1 macrophages are involved in host defense and inflammation, and M2 macrophages in tissue
repair. They exhibit distinct gene profiles that are regulated by specific signaling cascades,
transcription factors and epigenetic factors (3,4). Recent studies have also demonstrated key
roles for microRNAs (miRNAs), such as miR-155 and miR-146a, in regulating macrophage
phenotype (5). Dysregulation of macrophage polarization and function plays a central role in the
development of several diseases including diabetes and atherosclerosis (6,7). Increased
infiltration of macrophages into various tissues including adipose, kidney, heart and vascular
tissues is observed in these disorders (8-11). Diabetes and metabolic disorders can regulate
macrophage polarization and alter the expression of genes involved in macrophage functions
such as inflammation, phagocytosis, cholesterol transport and wound healing (2,11-17).
Production of pro-inflammatory mediators by macrophages infiltration into target tissues
activates other cell types and further enhances inflammation (6,9,18,19) and this is associated
with majority of the complications of diabetes. However, a systematic analysis of how diabetes
regulates global coding and non-coding gene expression programs that modulate macrophage
phenotype linked to diabetic complications is not available.
Recent studies using high throughput RNA-sequencing (RNA-seq) and profiling of key
histone modifications have identified thousands of long non-coding RNAs (lncRNAs), once
Page 3 of 57 Diabetes
4
considered to be transcriptional noise, and also demonstrated that they play key roles in
epigenetic mechanisms and gene regulation (20,21). LncRNAs, typically ncRNAs >200
nucleotides long, can be expressed from intergenic regions, antisense strands or introns of
protein coding genes, or they can be derived by alternate splicing. Major features of lncRNAs
include their low expression and ability to form secondary structures that can act as DNA, RNA
and protein binding domains. Several different mechanisms are used by lncRNAs to regulate
gene expression at both transcriptional and posttranscriptional levels. Thus they can act as
signals to recruit or as decoys to titrate out transcription factors, as enhancers to guide chromatin
modifying enzymes to their genomic target sites, and as competitors that inhibit miRNA binding
at the 3’-UTRs of target genes (20). Furthermore, some lncRNAs can serve as host genes for
miRNAs (short ncRNAs) (22), and thereby downregulate multiple targets of these miRNAs
involved in diverse biological processes. Current estimates predict there are thousands of
lncRNAs in the human genome but to date only a few have been well characterized or their
functions identified. Some lncRNAs have recently been linked to various diseases, suggesting
their potential to be novel therapeutic targets (23). One report identified lncRNAs in human
pancreatic islets, including some affected by type 2 diabetes (T2D) (24). However, their role in
macrophages related to diabetic inflammatory complications is not yet known.
We wished to explore the roles of differentially expressed coding transcripts as well as
lncRNAs in the molecular mechanisms involved in impaired macrophage function in diabetes.
Transciptome profiling of bone marrow-derived macrophages (BMM) from diabetic db/db mice
using RNA-seq followed by bioinformatics analyses revealed that diabetes induced a
proinflammatory, dysfunctional polarization and pro-fibrotic phenotype, and also altered
expression of several lncRNAs compared to non-diabetic genetic control db/+. Further
Page 4 of 57Diabetes
5
examination of one of the differentially expressed lncRNAs, E330013P06 (hereafter referred to
as E33) showed that it is significantly upregulated in vivo and in vitro in macrophages under
T2D conditions. Furthermore, we found that E33 regulates pro-inflammatory gene expression
and foam cell formation in macrophages, establishing a novel new functional role for a lncRNA
in processes linked to diabetic inflammatory vascular complications.
RESEARCH DESIGN AND METHODS
Animal experiments: Experiments were performed with male mice (from Jackson Laboratory,
Bar Harbor, ME) using protocols approved by our Institutional Animal Care and Use Committee
in accordance with the National Institutes of Health Guide for the Care and Use of Laboratory
Animals. Macrophages were prepared from 10-12 weeks old T2D db/db mice (BKS.Cg-
m+/+
leprdb
/J) and age matched control littermates db/+ mice (16), as well as from Type1 (T1D)
and T2D C57BL/6J mouse models and respective controls. T1D was induced in by injecting
C57BL/6J mice with streptozotocin (50 mg/kg) for five consecutive days (25). Macrophages
were isolated four weeks post diabetes. In diet-induced T2D models, C57BL/6J mice (8 weeks
old) were fed with high fat diet (60% kcal, Research Diets, Inc., D12492i) for four weeks and
then injected with a single dose of streptozotocin (100 mg/kg) to make them T2D (HFSZ), or
with vehicle citrate buffer (HF). Mice maintained on chow diet were also injected with vehicle
(SF) as a control group. Macrophages were prepared four or more weeks after streptozotocin
injections when HFSZ mice exhibited significantly increased blood glucose and insulin
resistance. Insulin resistance was determined by glucose tolerance tests (GTTs) in mice fasted for
about 16 hrs. Mice were weighed, baseline blood glucose determined and injected intra-
Page 5 of 57 Diabetes
6
peritoneally with glucose solution (2g/kg). Blood glucose levels were determined at different
time intervals up to 2h using AlphaTrak glucometer (Abbott Laboratories, Abbott Park, IL).
Isolation, culture and treatment of mouse macrophages: Bone marrow macrophages were
prepared using published protocols with some modifications (26). Briefly, bone marrow was
expelled from femurs and tibia, and after lysis of red blood cells they were plated in Complete
medium (CM) consisting of DMEM containing 5.5 mmol/L glucose, 10% FBS, 2 mmol/L
Glutamine, Pen/Strep antibiotics, 50 µmol/L β-mercaptoethanol and 10 mmol/L HEPES, pH 7.4
supplemented with either 10 ng/ml of macrophage colony stimulating factor-1 (M-CSF) (R&D
Systems, Minneapolis MN) or 20 ng/ml of granulocyte macrophage stimulating factor (GM-
CSF) (Peprotech, Rocky Hill, NJ). Cells were allowed to differentiate for 7-8 days before further
use. Thioglycollate elicited peritoneal macrophages (PMs) were isolated as described (27). The
mouse macrophage cell line RAW264.7 (from ATCC) was used in some experiments and
maintained in CM. Where indicated, macrophages were treated with media containing normal
(5.5 mmol/L) glucose (NG), high (25 mmol/L) glucose (HG), 200 umol/L palmitic acid (PA),
HG+PA (HP), TNF-α (10 ng/ml) or LPS (100 ng/ml). PA stock solutions (10 mmol/L) were
prepared in BSA (28), diluted to the indicated concentration in the medium, incubated for 30 min
at 37oC and filtered with 0.2 um filter before adding to the cells.
Isolation of Human Monocytes: T2D patients and healthy controls (age and gender matched)
were recruited at the Baylor College of Medicine (Table 1). Following informed consent, fasting
blood (15 ml) was obtained from these subjects and monocytes isolated following Ficoll density
Page 6 of 57Diabetes
7
gradient and negative magnetic separation (Miltenyi Biotec, San Diego, CA) as described (29).
More than 88% of cells were CD14 positive, and viability was >92%.
RNA isolation and quantitative reverse transcriptase PCR (RT-QPCR): RNA was extracted
using miRNeasy columns (Qiagen, Valencia, CA) from mouse macrophages and mirVana kit
(Ambion, Austin TX) from human monocytes, and cDNA synthesis performed with 0.5-1.0 ug
RNA using Quantitect RT kit (Qiagen). Expression of genes, including lncRNAs E33 and
MIR143HG (human equivalent of E33) was analyzed by quantitative Realtime PCR (QPCR)
using SYBR green reagents (Life Technologies, Carlsbad, CA) or Taqman assays (Integrated
DNA Technologies, Coralville, IA) on an ABI 7500 instrument using indicated gene primers
(Table S2). MiRNA expression was determined by RT-QPCR using miScript (Qiagen) or qScript
(Quanta Biosciences, Gaithersburg, MD) kits. RT-QPCR data was analyzed by the 2^-∆∆Ct
method, normalized against internal controls (Actb or Ppia for mRNA and lncRNA, and U6 or
18S RNA for miRNA). Results were expressed as fold over control samples.
RNA-seq and data analysis: Whole transcriptome analysis of RNA from BMMC and BMGM
was performed using total RNA depleted of Ribosomal RNA (RiboMinus kit,Life Technologies,
Carlsbad, CA). Paired End libraries were prepared, size selected, gel purified and sequenced in
our Integrative Genomics Corein an Illumina HiSeq2000 system following manufacturer’s
protocols (Illumina Inc, San Diego, CA). Reads were mapped to the mouse genome assembly
mm9 using Tophat software (30). Each RefSeq gene’s expression was summarized and
normalized by the trimmed mean of M-value (TMM) method using EdgeR bioconductor R
package. The total reads for each gene were then scaled by exon length to obtain average
Page 7 of 57 Diabetes
8
coverage. Differentially expressed genes were identified with coverage (>=1 in at least one
sample) and fold change (>=1.5). Novel transcripts were identified using published approaches
(21,31-33) including ours (22). Specifically, after de-novo assembly of all the transcripts using
Cufflinks (34), transcripts which mapped to RefSeq genes of mouse and seven other organisms
(human, chimp, rat, rabbit, orangutan, rhesus, marmoset) were first filtered out. Filtered
transcripts were further assessed for potential open reading frames by using PhyloCSF and
searching PfamA/B databases. Multi-exonic transcripts with a score of >100, or that encoded
PfamA/B protein domains were classified as novel protein-encoding transcripts. Transcripts of at
least 200bp in length containing at least two exons, having a PhyloCSFscore of <100 and lacking
PfamA/B domains, were defined as novel lncRNAs. Biological functions and network analysis
of differentially expressed genes were performed using DAVID gene ontology and Ingenuity
Pathway Analysis (IPA)®
. Transcription factor motif analysis and enrichment were performed
using Transcription Factor Affinity Prediction (TRAP) method (35) and Gene Set Enrichment
Analysis (GSEA) respectively.
E330013P06 cloning and lentiviral transduction of macrophages: E330013P06 cDNA was
cloned downstream of the CMV promoter in the lentiviral expression vector pEZ-LV105
(Genecopea, Inc, Rockville, MD) and verified by DNA sequencing. Plasmid pEZ-LV105
expressing EGFP (LVGFP) was used as vector control. HEK293T cells were co-transfected with
lentiviral vector plasmids and three packaging plasmids using Fugene (Promega, Madison, WI).
Cell culture supernatants containing lentiviruses were collected 48-96 h post transfection and
concentrated using Lenti-X Concentrator (Clontech, Mountain View, CA). RAW264.7
Page 8 of 57Diabetes

9
macrophages were transduced with the indicated lentiviral vectors in the presence of Polybrene
(8 ug/ml), and cells resistant to Puromycin (2 ug/ml) were selected for further analysis.
Transfection of macrophages: Macrophages were detached by incubating with Accutase
(eBioscience, San Diego, CA) for 5-10 min at 370C, washed with PBS and resuspended at a
concentration of 2.5-3.0 X 10⁷/ml in Nucleofection reagent (Lonza, Walkersville, MD). Then,
100 ul of cell suspension was mixed with plasmid DNA or siRNA oligonucleotides (up to 6 ul)
and transfected using Nucleofector program Y-001. Transfected cells were plated in dishes for
RNA and foam cell formation assays. Specific siRNAs targeting mouse E33 were designed
using GPboost algorithm (36).
Foam cell formation assays: Macrophages were incubated in eight well chamber slides with
Acetylated Low Density Lipoprotein fluorescently labeled with 20 ug/ml 1,1'-dioctadecyl–
3,3,3',3'-tetramethyl-indocarbo-cyanine perchlorate (DiI-Ac-LDL, Biomedical Technologies,
Stoughton, MA) for 4h at 37oC. Cells were washed twice, fixed with 4% para-formaldehyde,
washed, stained with HOECHST dye and mounted on slides using Vectashield. Fluorescent
images of the cells were collected with Pixera 600 digital camera attached to an Olympus BX51
microscope using InStudio software (Pixera Corporation).
Statistical analysis: Statistical significance was calculated using unpaired Student t-tests to
compare two groups and ANOVA to compare multiple groups followed by appropriate multiple
comparison tests selected by PRISM 6.0 software (GraphPad, San Diego, CA). P values ≤0.05
were considered statistically significant.
Page 9 of 57 Diabetes
10
Data Deposition: The RNA-seq data has been deposited in the Gene Expression Omnibus
(GEO) database under accession code GSE54154.
RESULTS
Bone marrow macrophages (BMM) from diabetic db/db mice have a dysfunctional
phenotype: To examine the effects of diabetes on macrophage polarization, we differentiated
BMM from T2D db/db and non-diabetic control db/+ mice in vitro using GM-CSF (BMGM) or
M-CSF (BMMC) to obtain M1 and M2 macrophages respectively and analyzed the expression of
key macrophage markers by RT-QPCR (Fig-S1A-B, Online Supplemental Data). We then
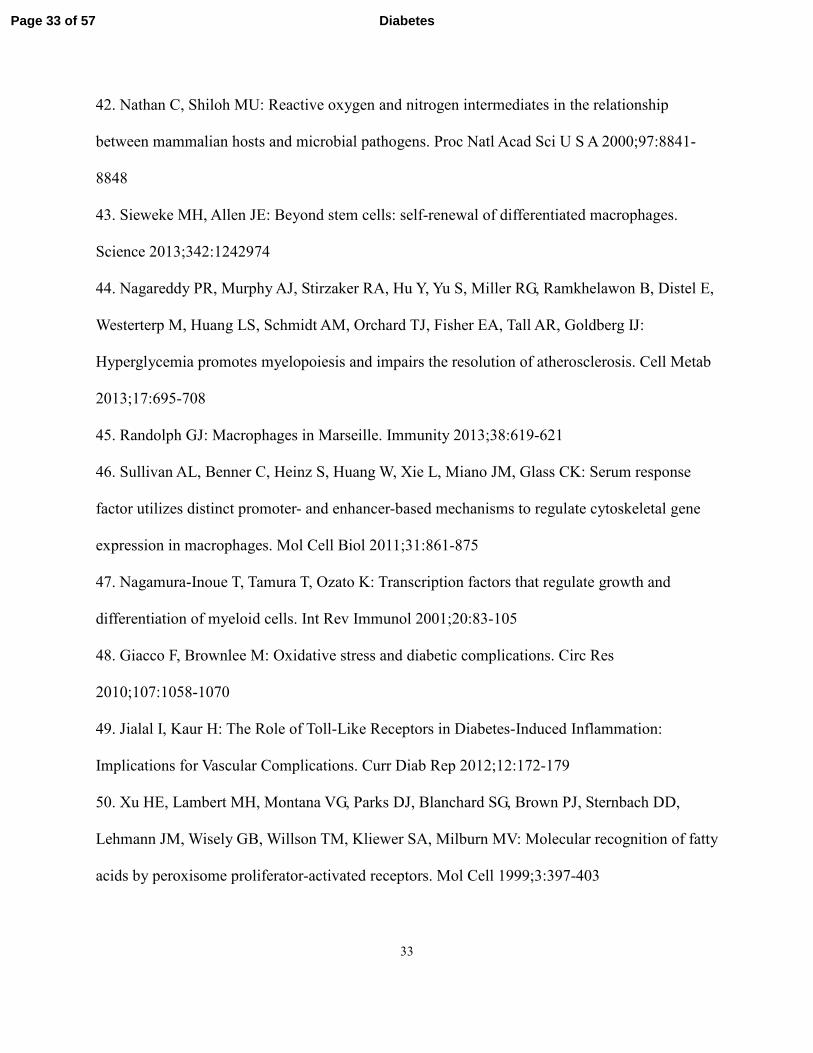
observed that, in BMMC from db/db mice (db/dbBMMC) (M2), the expression of Il10, Tgfb1
and Arg1 (M2 associated genes) was inhibited, but expression of proinflammatory prostaglandin-
endoperoxide synthase 2 (Ptgs2) gene was increased compared to db/+BMMC, indicating that
diabetes induced a dysfunctional M2 phenotype (Fig. 1A). On the other hand, db/dbBMGM
(M1) exhibited increased expression of the pro-inflammatory genes Ccl2, Nos2, Ptgs2 and Tnf
compared to db/+BMGM (Fig. 1B), suggesting enhanced pro-inflammatory M1 phenotype.
Furthermore, db/dbBMMC also exhibited enhanced expression of inflammatory genes relative to
db/+BMMC in response to TNF-α (10 ng/ml) stimulation (Fig. 1C). We also analyzed pro-
inflammatory genes in thioglycollate-elicited peritoneal macrophages (PM) derived from these
mice. The expression of pro-inflammatory genes (Tnf, Il6, Nos2, Ccl2 and Ptgs2) was increased
and anti-inflammatory gene (Il10) was decreased in PM from db/db mice compared to db/+ (Fig.
1D), providing additional in vivo relevance. Overall, our data indicate that diabetes promoted a
dysfunctional M2 phenotype and enhanced M1 inflammatory response in macrophages.
Page 10 of 57Diabetes
11
Diabetes impacts the transcriptome of bone marrow derived macrophages. Prior studies
using gene arrays have revealed differences between the transcriptome of BMMC and BMGM of
normal mice (37) but the impact of diabetes on the macrophage transcriptome genome-wide and
in particular on lncRNAs is unknown. We therefore next used RNA-seq to analyze differences in
global gene expression patterns in BMMs from db/db and db/+mice. RNA-seq data (Table S1)
was analyzed using an in-house data analysis pipeline and publicly available databases (Fig. 2A).
Results showed that the BMGM transcriptome in both db/+ and db/db mice was enriched with
pro-inflammatory genes (Fig. S2A), whereas genes known to be associated with alternatively
activated macrophages were elevated in BMMC (Fig. S2B), further confirming the M1 and M2
phenotype of BMGM and BMMC, respectively (37). RNA-seq data also revealed that levels of
pro-inflammatory markers (Itgax and Ly6c) were increased in BMGM (Fig. S2A), whereas
macrophage specific markers (Emr1 and Mrc1) were elevated in BMMC relative to BMGM (Fig.
S2B). Furthermore, Csf1and Csf1r genes were elevated, and GM-CSF receptors (Csf2ra, Csf2rb
and Csf2rb2) were reduced in BMMC compared to BMGM, indicating inhibition of GM-CSF
signaling in BMMC as anticipated (Fig. S2C). Flow cytometry showed significant inhibition of
F4/80 in BMGM (Fig. S3A) confirming RNA-seq results that GM-CSF inhibited macrophage
phenotype.
Interestingly, when we next compared db/+ and db/db macrophages, we observed that the
levels of 1648 transcripts including 1556 RefSeq genes (Fig. 2B) were altered in db/dbBMMC
compared to db/+BMMC indicating diabetes profoundly affected the BMMC transcriptome. In
contrast, relatively few genes were altered in db/dbBMGM relative to db/+BMGM (Fig. S4).
Further analysis of all the differentially expressed genes (DEG) in db/dbBMMC included both
Page 11 of 57 Diabetes
12
known and novel coding as well as long non-coding transcripts (Fig. 2C). Differentially-
expressed RefSeq genes included growth factors, fibrotic genes, proteases and adhesion
molecules involved in extracellular matrix (ECM) remodeling, chemokines, cytokines, and
neuroimmune signaling and lipid metabolism (GEO accession code GSE54154). Most notably,
db/dbBMMC exhibited a strong pro-fibrotic phenotype relative to db/+BMMC with marked
upregulation of several pro-fibrotic growth factors including Ctgf, Tgfb and fibrotic/ECM genes
including numerous Collagens (Fig. 2D). DAVID gene ontology analysis (Fig. 2E-F) and
Ingenuity Pathway analysis (Fig. 2G and S5) of DEGs also confirmed marked enrichment of
signaling pathways relevant to fibrosis (including TGF-β signaling), inflammation, ECM
remodeling, adhesion and growth factor/cytokine signaling and cardiovascular diseases among
top 10 categories. Motif analysis of upregulated genes by Transcription factor Affinity Prediction
(TRAP) showed that binding sites for SP1, Klf4, Egr1, MZF1_5-13 and RREB1 transcription
factors (TFs) were enriched in proximal promoters of DEG [(-250 to +50 bp relative to
transcription start site (TSS)] (Fig. 2H). In addition, GSEA also showed significant enrichment
of SRF motif in upregulated gene promoters (±2 kb flanking TSS) (Fig. S6). Furthermore, IPA
indicated that activities of several TFs including TP53, Smad3 and SRF were increased whereas
others such as Hoxa10 were inhibited (Fig. 2I). These results suggest that diabetes alters multiple
transcription programs and skews macrophages towards a pro-inflammatory and pro-fibrotic
phenotype that can contribute to vascular disorders. They also reveal a novel pro-fibrotic and
dysfunctional M2 phenotype in diabetic macrophages.
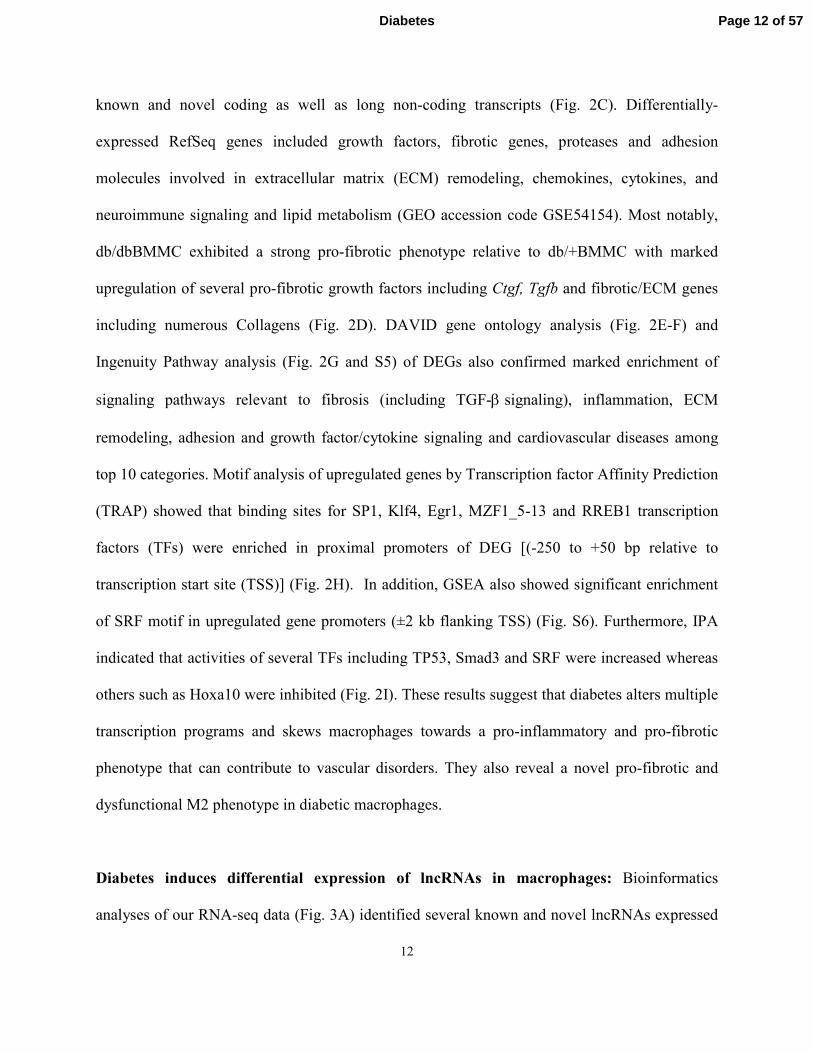
Diabetes induces differential expression of lncRNAs in macrophages: Bioinformatics
analyses of our RNA-seq data (Fig. 3A) identified several known and novel lncRNAs expressed
Page 12 of 57Diabetes
13
in BMMC. Of these, only 156 known (RefSeq) ncRNAs including 119 lncRNAs (≥200bp in
length) and 52 novel lncRNAs were differentially expressed in db/db relative to db/+BMMC
(Fig. 2C). The fold changes of some of these lncRNAs are depicted in Figs. 3B and 3D
(complete list shown in Tables S3-S4). Some of the differentially expressed lncRNAs such as
E330013P06 (E33) are host genes for miRNAs (Fig. 3F). Because lncRNAs can regulate nearby
genes, we also analyzed genes located within about 500 kb from the lncRNAs differentially
expressed in db/dbBMMC. This revealed that expression of some nearby genes was also
affected, suggesting their co-regulation with lncRNAs in db/dbBMMC (Fig. 3C and 3E, and
Tables S2 and S3). Interestingly, IPA indicated that these nearby genes have functions related to
inflammation and endocrine disorders (Fig. 3G). These results demonstrate for the first time that
diabetes can alter the expression of lncRNAs in macrophages, which in turn might affect the
expression of genes involved in macrophage function.
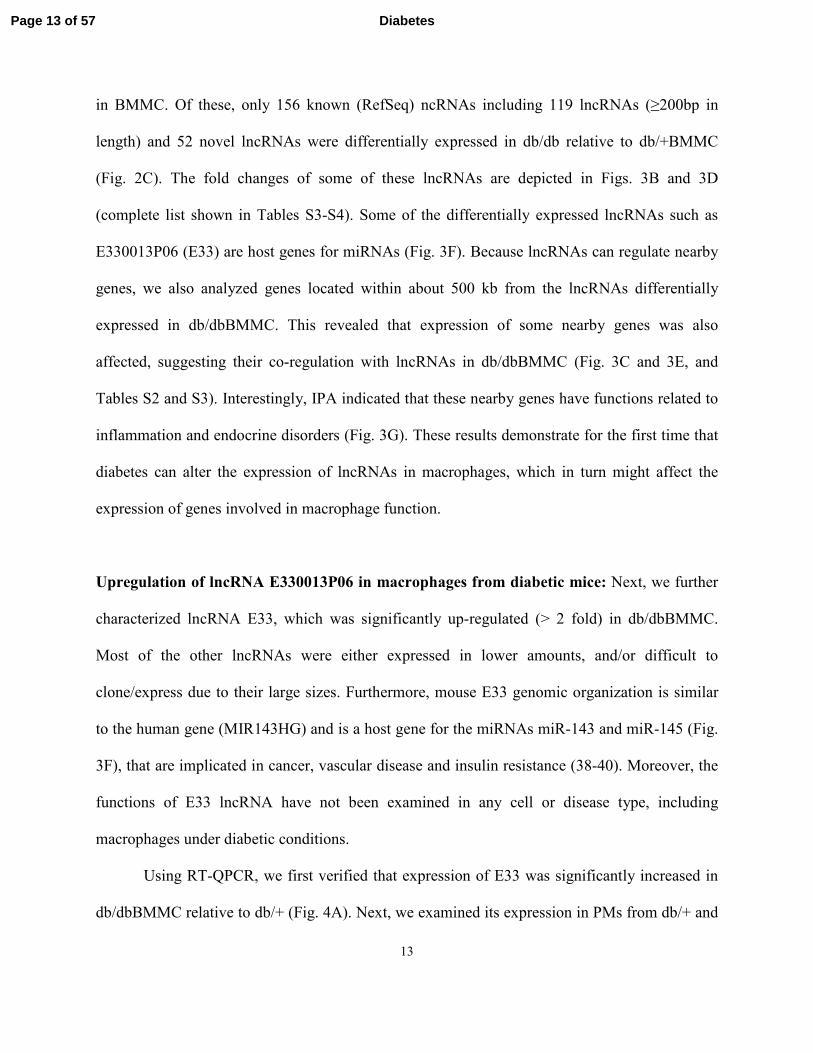
Upregulation of lncRNA E330013P06 in macrophages from diabetic mice: Next, we further
characterized lncRNA E33, which was significantly up-regulated (> 2 fold) in db/dbBMMC.
Most of the other lncRNAs were either expressed in lower amounts, and/or difficult to
clone/express due to their large sizes. Furthermore, mouse E33 genomic organization is similar
to the human gene (MIR143HG) and is a host gene for the miRNAs miR-143 and miR-145 (Fig.
3F), that are implicated in cancer, vascular disease and insulin resistance (38-40). Moreover, the
functions of E33 lncRNA have not been examined in any cell or disease type, including
macrophages under diabetic conditions.
Using RT-QPCR, we first verified that expression of E33 was significantly increased in
db/dbBMMC relative to db/+ (Fig. 4A). Next, we examined its expression in PMs from db/+ and
Page 13 of 57 Diabetes
14
db/db mice which showed that E33 was significantly increased in PM from db/db mice compared
to db/+ further establishing in vivo relevance (Fig. 4B). Because E33 is a host gene for miR-143
and miR-145, we also examined their expression. Levels of miR-143 (Fig. 4C), but not miR-145
(Fig. 4D), were upregulated in db/dbBMMC, indicating these miRNAs may be post-
transcriptionally regulated at the level of biogenesis. Recent studies showed that the combination
of high fat (HF) diet and single streptozotocin (SZ) administration can induce insulin resistance
and hyperglycemia mimicking T2D (41). We used this mouse model of diet-induced T2D
(HFSZ) to verify that observed increases in E33 in db/db versus db/+ mice were not due to
genetic differences. HFSZ mice exhibited characteristic features of T2D including increased
body weight (Fig. 4E), blood glucose (Fig. 4F) and insulin resistance (Fig. 4G) compared with
standard diet fed mice (SF). Expression of inflammatory genes Il6, Nos2 and Ptgs2 was
significantly increased in BMMC from HF and HFSZ mice (Fig. 4H-J). Furthermore, E33
expression was significantly increased in both BMMC (Fig. 4K) and PM (Fig. 4L) derived from
the HFSZ mice compared to SF, as well as in PM from HF mice (Fig. 4L). Increased levels of
E33 in the PMs of these T2D mice further supports the in vivo relevance.
On the other hand, examination of E33 levels in PMs derived from SZ-induced type 1
diabetes (T1D) mice revealed no significant changes macrophages from T1D mice (SZ) versus
controls (NS) (Fig.4M). These results demonstrate that insulin resistance and T2D can induce
E33 expression in macrophages. In order to further determine the relevance to human diabetes,
we determined the levels of MIR143HG (RefSeq NR_105060.1), the human equivalent of E33,
in monocytes from T2D patients. Results showed significantly increased expression of
MIR143HG in monocytes from T2D patients versus healthy controls (Fig. 4N).
Page 14 of 57Diabetes
15
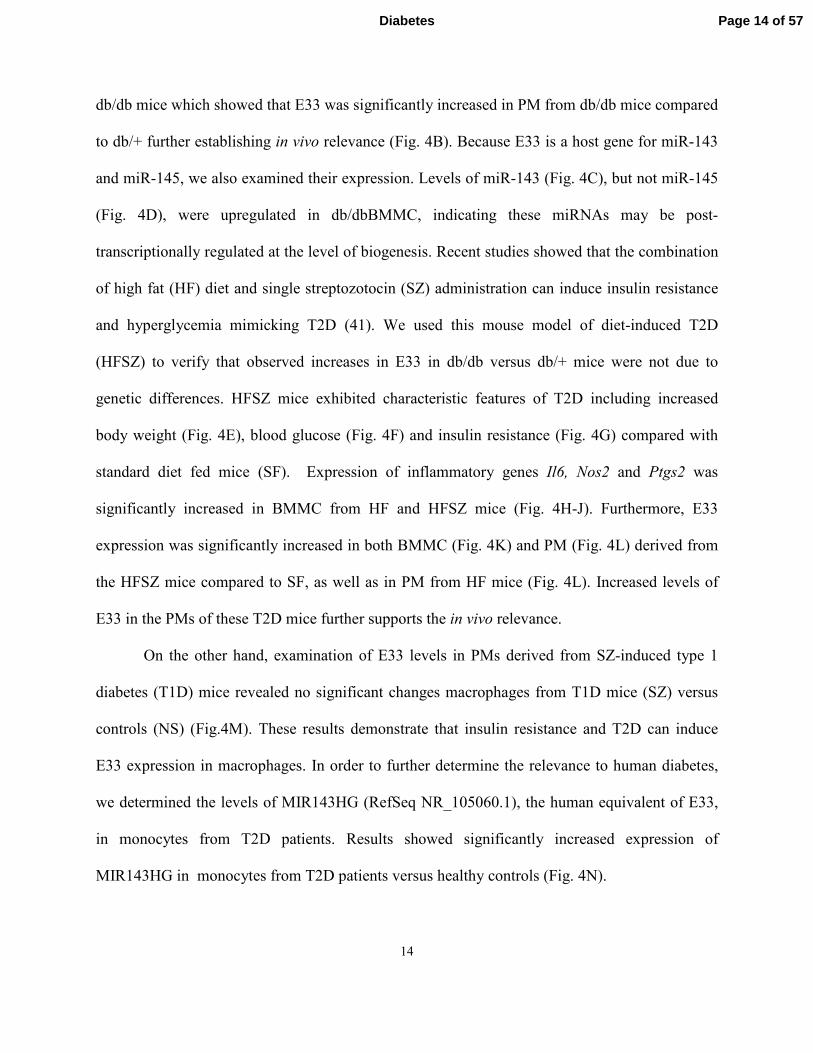
Sustained overexpression of E33 increases pro-inflammatory and pro-atherogenic gene
expression in RAW macrophages: We next determined the functional relevance of E33
upregulation by using RAW 264.7 (RAW) macrophages stably transduced with lentiviral vectors
that express full length mouse E33 mRNA under the control of a CMV promoter (LVE33). RAW
cells transduced with GFP (LVGFP) were used as control. E33 expression was significantly
increased in LVE33-transduced RAW cells relative to LVGFP (Fig. 5A). E33 overexpression in
RAW cells did not affect cell morphology or growth (data not shown) but clearly altered several
inflammatory genes. The anti-inflammatory gene Il10 (Fig. 5B) was downregulated whereas
several pro-inflammatory genes were upregulated (Fig. 5C-F). The chemokine Ccl2 was
inhibited (Fig. 5G), but expression of the pro-atherogenic scavenger receptor Cd36 (Fig. 5H) was
increased by E33 overexpression. We examined if E33 also modulated macrophage responses to
pro-inflammatory signals. LPS (100 ng/ml) dramatically induced the expression of pro-
inflammatory genes in LVGFP as expected. But, the expression of Il6, Tnf, Ptgs2 and Ccl2 was
further augmented in LVE33 cells treated with LPS (Fig. 5I-L), whereas Il10, Nos2 and Cd36
were not altered (Fig. 5M-O). Furthermore, transient overexpression of E33 in BMMC from
normal C57BL/6 mice also increased the expression of inflammatory genes confirming similar
pro-inflammatory effects in primary mouse macrophages (Fig. S7). Overall the data
demonstrates that E33 overexpression can upregulate pro-inflammatory and pro-atherogenic
genes and also enhance their response to pro-inflammatory signals in macrophages.
E33 overexpression in macrophages promotes the foam cell formation: Having shown that
E33 upregulates Cd36 expression, we next examined if this is functionally associated with
increased uptake of modified LDL. As shown in Fig. 5P, Dil-Ac-LDL uptake was markedly
Page 15 of 57 Diabetes
16
increased in LVE33 (Panel b) compared to LVGFP cells (Panel a) suggesting increased foam cell
formation. Nuclear staining with HOECHST confirmed similar numbers of cells in both fields
(Panels c and d). Overall, these data reveal a functional role for E33 in enhancing macrophage
uptake of modified LDL, a key event in foam cell formation and atherosclerosis.
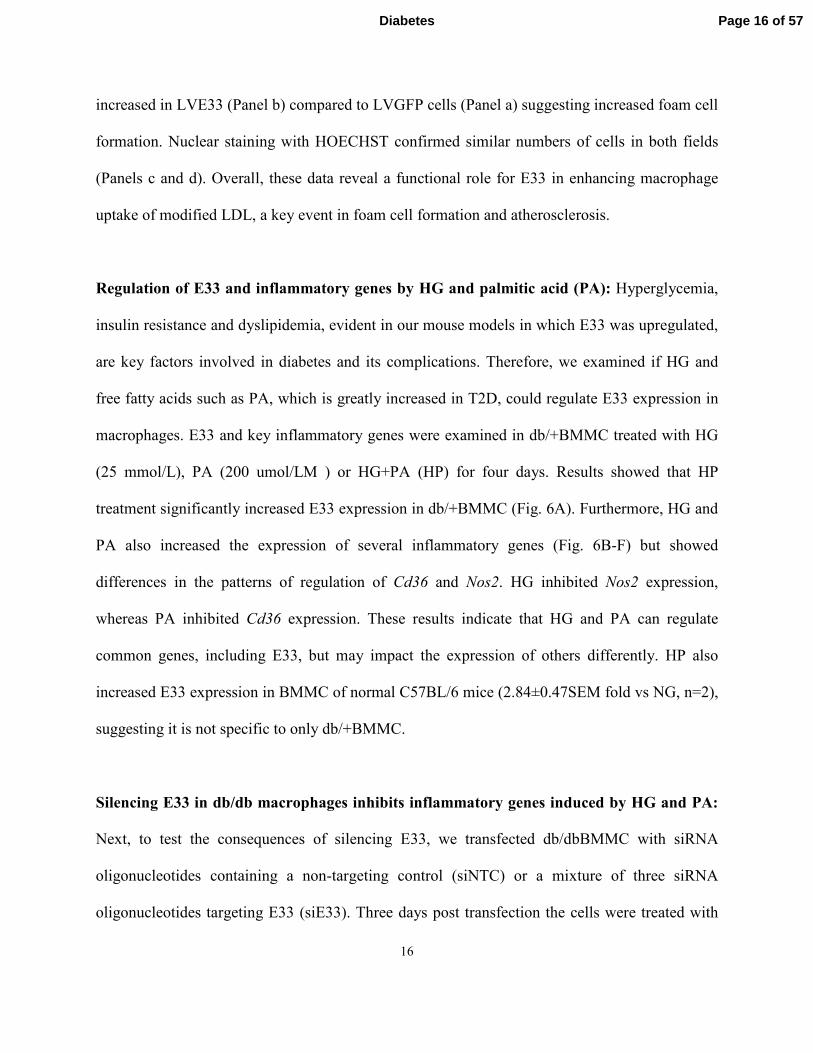
Regulation of E33 and inflammatory genes by HG and palmitic acid (PA): Hyperglycemia,
insulin resistance and dyslipidemia, evident in our mouse models in which E33 was upregulated,
are key factors involved in diabetes and its complications. Therefore, we examined if HG and
free fatty acids such as PA, which is greatly increased in T2D, could regulate E33 expression in
macrophages. E33 and key inflammatory genes were examined in db/+BMMC treated with HG
(25 mmol/L), PA (200 umol/LM ) or HG+PA (HP) for four days. Results showed that HP
treatment significantly increased E33 expression in db/+BMMC (Fig. 6A). Furthermore, HG and
PA also increased the expression of several inflammatory genes (Fig. 6B-F) but showed
differences in the patterns of regulation of Cd36 and Nos2. HG inhibited Nos2 expression,
whereas PA inhibited Cd36 expression. These results indicate that HG and PA can regulate
common genes, including E33, but may impact the expression of others differently. HP also
increased E33 expression in BMMC of normal C57BL/6 mice (2.84±0.47SEM fold vs NG, n=2),
suggesting it is not specific to only db/+BMMC.
Silencing E33 in db/db macrophages inhibits inflammatory genes induced by HG and PA:
Next, to test the consequences of silencing E33, we transfected db/dbBMMC with siRNA
oligonucleotides containing a non-targeting control (siNTC) or a mixture of three siRNA
oligonucleotides targeting E33 (siE33). Three days post transfection the cells were treated with
Page 16 of 57Diabetes
17
HP for 24 h and gene expression analyzed. Results showed that siE33 significantly
downregulated basal and HP induced E33 expression (Fig. 6G). E33 gene silencing did not affect
basal inflammatory gene expression but, significantly inhibited the expression of key
inflammatory genes and Cd36 induced by HP (Fig. 6H-L). Together these new results
demonstrate that E33 lncRNA is upregulated under diabetic conditions and contributes to the
enhanced macrophage inflammatory and atherogenic phenotype and functions. Knockdown of
E33 can reverse the diabetic phenotype, at least in part, especially under stimulated conditions.
DISCUSSION
Macrophage differentiation and polarization are associated with the production of pro-
inflammatory and pro-atherogenic factors. These processes are dysregulated in diabetes and can
contribute to enhanced atherosclerosis. In this study, using RNA-seq, we showed that diabetes
skewed the macrophage transcriptome towards an increased pro-inflammatory and pro-fibrotic
state, and a dysfunctional, alternatively activated phenotype. These changes were associated with
alterations in networks of genes that regulate inflammation and fibrosis. Notably, we observed
for the first time that macrophage lncRNA expression levels were also altered. Furthermore, T2D
was associated with the increased expression of lncRNA E33, which upregulated the expression
of pro-inflammatory genes, and increased lipid update in macrophages (foam cell formation).
Moreover, E33 was upregulated in vitro under metabolically challenged and diabetic conditions
(HG and PA), but silencing its expression prevented increased expression of inflammatory genes.
These results demonstrate that E33 contributes to a pro-inflammatory macrophage phenotype
thereby uncovering a lncRNA with a novel functional role in diabetic macrophages.
Page 17 of 57 Diabetes
18
Imbalances between the M1 and M2 functions of macrophages can result in chronic
inflammation and tissue damage (1,2). Our RNA-seq results indicated diabetes had a profound
effect on the macrophage transcriptome by enhancing pro-inflammatory genes and inhibiting
genes associated with alternatively activated M2 phenotype. Several pro-fibrotic genes and
related TFs were upregulated, which may affect various target tissues related to complications,
and also lead to adipose tissue remodeling, systemic inflammation, insulin resistance, wound
healing defects, and atherosclerotic plaque formation/instability. db/dbBMMC also had lower
levels of Nos2, a key enzyme required for phagocytosis (42), suggesting impaired host defense.
Furthermore, Csf1 expression was enhanced in db/dbBMMC, which may promote monocyte-
VSMC interactions and foam cell formation (18) to confer atherogenic phenotypes in diabetes.
CSF-1 signaling through CSF-1R is not only essential for macrophage survival but could
promote macrophage proliferation in atherosclerotic environments (43). Thus, the diabetic milieu
can augment the macrophage inflammatory phenotype and proliferative capacity, which can
exacerbate atherosclerosis. In support of this, recent studies demonstrated monocytosis in
hyperglycemia (44) and macrophage proliferation in atherosclerosis (45). The key anti-
inflammatory and immunomodulatory cytokine Il10 was downregulated in db/dbBMMC, along
with interferon gamma-induced genes such as guanylate binding proteins, further suggesting
macrophages in diabetes have increased inflammatory activities and defective immune
responses. Bioinformatics and in silico modeling revealed that diabetes can affect the function of
key TFs involved in cytoskeletal gene programs (SRF) (46) and macrophage differentiation
(SP1, Egr1 Klf4 and MZF) (3,47). SRF regulates gene expression by interaction with distal
enhancers (46) and our study indicates that this could be affected in diabetes. Overall, the power
Page 18 of 57Diabetes
19
of RNA-seq reveals enormous changes to the macrophage transcriptome that could lead to
multiple pathologies associated with diabetes.
Our RNA-seq data also revealed that several lncRNAs are differentially expressed in
BMMC from db/db mice compared to db/+. The expression of several genes located within
500kb from differentially expressed lncRNAs was also altered in db/db macrophages, indicating
potential regulation by the lncRNAs. These transcripts included both coding and noncoding
genes, including miRNAs. In addition, bioinformatic analysis indicated that the nearby genes
were involved in inflammation, highlighting the potential importance of gene regulation by
lncRNAs in diabetes. Our hypothesis was that lncRNAs could have a functional role and regulate
genes involved in macrophage dysfunction. We therefore further characterized the function of
lncRNA E33 which was significantly upregulated in db/dbBMMC and has a genomic
organization similar to the human locus. The function and regulation of lncRNA E33 has not
been examined in any cell type or disease condition. We found lncRNA E33 was upregulated in
macrophages from T2D mice, but not T1D mice. In contrast to T1D, T2D is associated with
insulin resistance, hyperglycemia and dyslipidemia, suggesting E33 expression might be affected
by multiple diabetogenic factors including free fatty acids. This was supported by our data
showing that E33 expression was also increased in macrophages from HFSZ and HF mice (Fig.
4K-L) and in macrophages treated with HG+PA (Fig. 6A). Furthermore, MIR143HG expression
was higher in monocytes from T2D patients relative to controls (Fig. 4N), demonstrating
relevance to human disease. Most notably, we found that E33 overexpression significantly
upregulated inflammatory genes and downregulated the anti-inflammatory cytokine, Il10.
Conversely, gene silencing by siRNAs prevented the increased expression of inflammatory genes
induced by HG/PA in db/db macrophages. Interestingly, E33 also upregulated Cd36, a key
Page 19 of 57 Diabetes
20
scavenger receptor involved in oxidized-LDL uptake and foam cell formation. Consistently,
expressing E33 in macrophages greatly increased their LDL uptake, further supporting a key role
for this lncRNA in pro-atherogenic responses of macrophages.
Because E33 is also a host gene for miR-143/145, effects of increased E33 could also be
mediated by these miRNA. However, our E33 expression vector expressed only the exons of
E33 lncRNA, and hence it does not express miR143 or -145, which are located in introns. In
addition, transfection of macrophages with oligonucleotide mimics of miR-143 (which was
increased in db/db mice) did not affect inflammatory genes (data not shown). Therefore, lncRNA
E33 regulates macrophage function independently of the miRNAs that are derived from it.
We also showed that E33 gene silencing with siRNAs significantly inhibited HP induced
inflammatory genes, but not basal levels. HP induced lncRNA E33 might regulate gene
transcription various mechanisms that include modulating recruitment/activity of epigenetic
enzymes to alter chromatin structure and access to transcription factors under insulin resistant
conditions. However, it is known that HG alone can regulate inflammatory genes via activation
of transcription factors such as NF-κB through multiple signaling and epigenetic mechanisms
(48). Furthermore, PA can also regulate gene expression through activation of nuclear receptors,
Toll-Like Receptors and NF-κB to promote inflammation in diabetes (8,49,50). Thus, novel
lncRNA dependent mechanisms identified in our study could fine-tune the inflammatory
phenotype of macrophages in concert with these other pathways activated by the diabetic milieu.
Because E33 was not increased in T1D macrophages although pro-inflammatory genes were
elevated relative to non-diabetic mice (data not shown), E33 dependent mechanisms might
operate only under T2D conditions. Thus, E33, like most non-coding RNAs, may play a fine-
Page 20 of 57Diabetes
21
tuning modulatory role along with the other known factors, to augment macrophage
inflammatory states and lipid uptake in T2D.
The dysregulation of lncRNA expression and function is increasingly being implicated in
various diseases, and related therapeutic strategies are gradually being explored (23). We have
shown for the first time a role for one diabetes induced lncRNAE33 in macrophage dysfunction,
which suggests that, in the future such lncRNAs can serve as novel therapeutic targets to
attenuate inflammation and atherogenic potential of macrophages and concomitant diabetic
complications.
Page 21 of 57 Diabetes

22
ACKNOWLEDGMENTS
These studies were supported by grants from the National Institutes of Health (R01 DK 065073,
HL106089 and DK058191 to RN). The authors are grateful to Dr. H. Gao and J-H. Wang
(Integrative Genomics Core) for assistance with RNA-seq, L. Brown (Analytical Cytometry
core) for Flow cytometry, Dr. R. Chandran (Department of Virology) for analysis with Flowjo
software, and Dr. M. Morgan (Office of Faculty and Institutional Support) for editing the
manuscript (all from the Beckman Research Institute of City of Hope, Duarte, CA). The authors
declare no conflict of interests.
AUTHOR CONTRIBUTIONS
M. A. R., conceived the idea, designed the experiments, performed all the experiments, analyzed
the data, wrote and edited the manuscript. Z. C. analyzed RNA-seq data, performed
bioinformatics analysis, wrote and edited the manuscript. M. W., L. L., Q. Z. and K. B.
performed experiments and analyzed data. J. T. P. and S. P. assisted with macrophage isolation.
X. W. analyzed RNA-seq data. A. L. assisted with analysis of RNA-seq data. P. S. designed
siRNAs. J. T. P., K. B., A. L., P. S. and S. P. reviewed the manuscript. S. D. provided
monocytes from diabetic patients and controls and reviewed the manuscript. R.N. conceived the
idea, designed the experiments, analyzed the data, wrote and edited the manuscript. M. A. R. and
R. N. are the guarantors of this work, as such, had full access to the data in the study and take
responsibility for the integrity of the data and the accuracy of the data analysis.
Page 22 of 57Diabetes
23
FIGURE LEGENDS
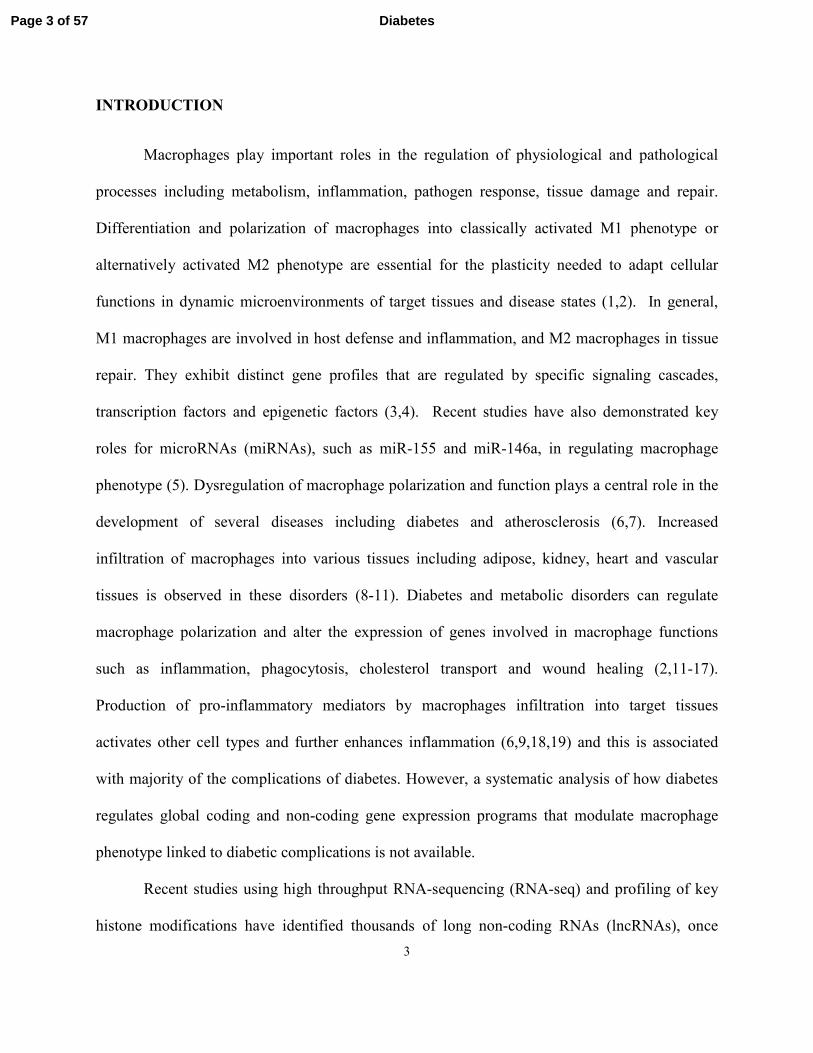
Figure 1. Diabetes induces dysfunctional macrophage polarization. A-B. Quantitative RT-
PCR (RT-QPCR) analysis of gene expression in bone marrow macrophages derived from
diabetic db/db mice and control db/+ mice , which were differentiated in vitro with either MCSF
(BMMC, panel A) or GMCSF (BMGM, panel B). Bone marrow was isolated from 10-12 weeks
old db/db and db/+ mice. Blood glucose levels were 479±28 mg/dL in db/db mice vs 162±8
mg/dL in db/+ mice. C. TNF-α induced gene expression in db/+ and db/dbBMMCs. BMMC
were serum depleted for 4 hours and stimulated with TNF-α (10 ng/ml) for one hour. D. Gene
expression analysis of thioglycollate-elicited peritoneal macrophages (PM) from db/+ (PMdb/+)
and db/db (PMdb/db) mice Gene expression was analyzed by RT-QPCR and results expressed as
fold over db/+ cells. Data are represented as Mean ± SEM (*,p<0.05, n=3-4).
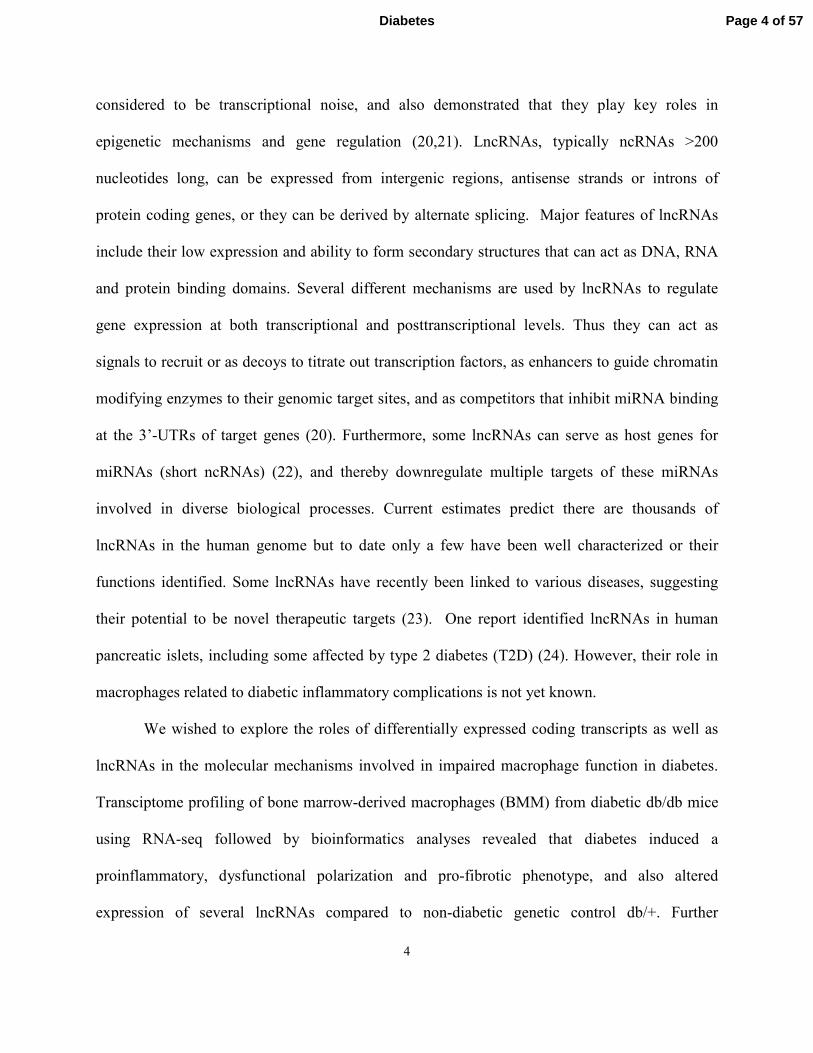
Figure 2. RNA-Seq analysis of gene expression in macrophages from db/+ and db/db mice.
A. Data analysis Pipeline. B. Scatter plot of differentially expressed RefSeq genes including
small nc RNAs (<200bp). C. Pie chart showing differentially expressed genes (DEG) in
db/dbBMMC relative to db/+BMMC (excluding small nc RNAs< 200bp). D. Bar graph showing
fibrotic genes increased in db/dbBMMC compared to db/+ . Data represents log2 ratio
(db/dbBMMC-db/+BMMC). E. Top 10 Biological processes enriched among DEGs in
db/dbBMMC by DAVID analysis. Enrichment score of an annotation cluster refers to the
geometric mean of EASE scores (modified Fisher Exact P value in form of –log10) of all the
biological processes in the cluster. (F) Top 10 KEGG pathways enriched among DEGs (DAVID
analysis). G. Top 10 envolved diseases enriched in DEG of db/dbBMMC by Ingenuity Pathway
Analysis®
(IPA). In panels F and G, y-axis represents p- values (–log10) from Fisher exact tests
with Benjamni-Hochberg (B-H) adjustments. H. Diagrammatic representation of top five
Page 23 of 57 Diabetes
24
transcription factor motifs enriched in promoters (-250 to +50 bp relative to TSS) of upregulated
genes. TRAP was used to find high affinity transcription factor binding sites enriched in the
promoters (-250 bp to 50 bp relative to transcription start site) of upregulated genes. I. IPA
showing activation of the indicated transcription factors in db/dbBMMC. Vasc-vascular; SKS-
skeletal sytem; Emb-embryonic; ECM-extracellular matrix; AA-amino acid; CV-
Cardiovascular; OIA-Organismal Injury and abnormalities; GI-gastrointestinal; CT-connective
tissue; SKM-skeletal and muscular.
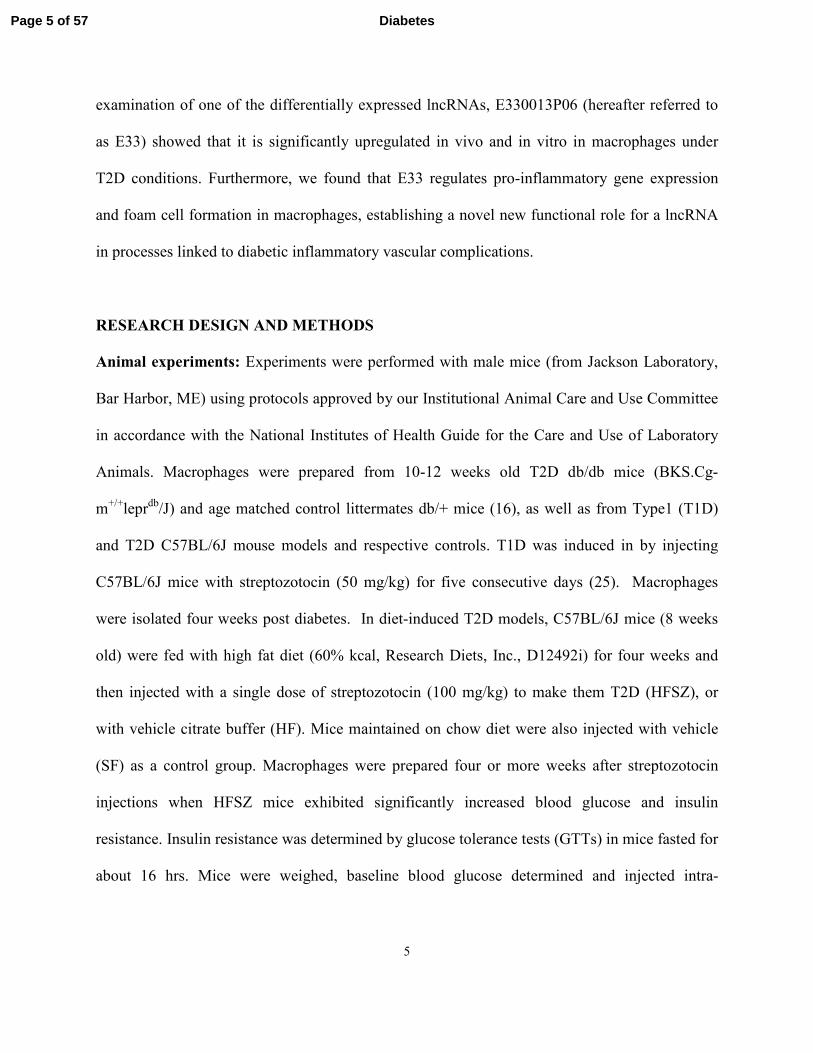
Figure 3. Identification of Differentially expressed lncRNAs in Macrophages from db/db
mice. A. Pipeline used to identify novel lncRNAs in BMMC. B-C. Representative known
(RefSeq) lncRNAs differentially expressed (B) and nearby (±500kb flanking regions)
differentially expressed genes (C) in db/dbBMMC. D-E. Novel differentially-expressed
lncRNAs (>200 bp with at least two exons) (D) and nearby genes with altered expression in
db/dbBMMC (E). F. Schematic showing the genomic structure of lncRNA E330013P06 and the
alignment of RNA-seq reads in db/+BMMC (db/+) and db/dbBMMC (db/db) . Arrow indicates
the direction of transcription. Closed rectangles are exons and open rectangles are miRNAs
expressed from these genomic locations. G. IPA of differentially expressed nearby genes.
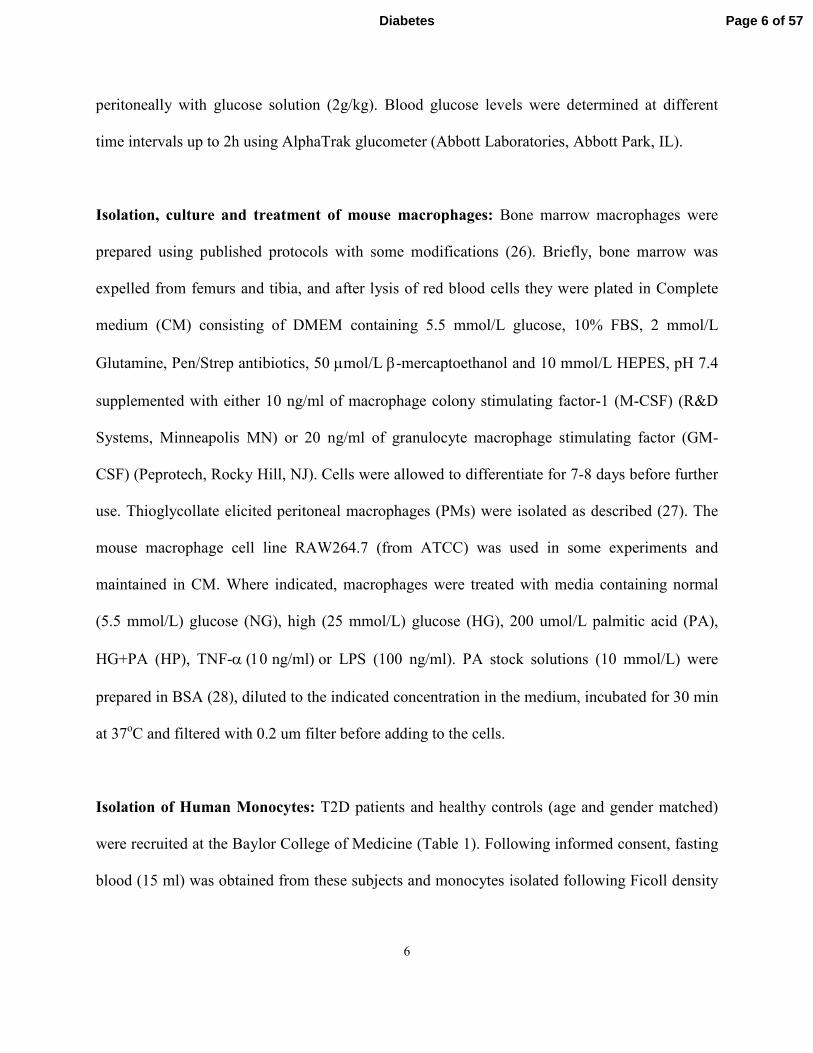
Figure 4. Increased Expression of E330013P06 in macrophages from diabetic mice and
monocytes from type 2 diabetic patients A-B. RT-QPCR analysis shows that E33 is
significantly increased in (A) BMMC (n=6) and (B) PM (n=6) from db/db compared to db/+
mice. C-D. RT-QPCR of miR-143 (C) and miR-145 (D) in db/+ and db/dbBMMC (n=5). Gene
expression was analyzed by RT-QPCR and reults expressed as fold over macrophages from db/+
mice. Data are represented as Mean ± SEM (*,p<0.05). E-G. Body weight (E), blood glucose
Page 24 of 57Diabetes
25
levels (mg/dL) in basal (F) and after intraperitoneal injection of glucose (G) in the control (SF),
high fat fed (HF) and diet induced type2 diabetic (HFSZ) mice. C57BL/6 mice were maintained
on standard (SF) or high fat (HF) diet for 4 weeks. Then half the HF mice were injected with a
single dose of streptozotocin (100 mg/kg) to make them type 2 diabetic (HFSZ). Glucose
tolerance tests (GTTs) were performed 4 weeks later. H-K. Increased expression of inflammatory
genes and E33 in BMMC from HF and HFSZ mice relative to SF mice. L. E33 expression in PM
from indicated mice. BMMC (n=5-7) and PM (n=5-6). Gene expression was analyzed by RT-
QPCR and results expressed as fold over macrophages from SF mice. Data are represented as
Mean ± SEM (*,p<0.05). M. RT-QPCR analysis of PM from streptozotocin induced Type 1
diabetic mice (SZ) showed no changes in E33 levels relative to controls (NS) mice (Mean ±
SEM, n=7-14). Blood glucose levels were 527.1 ±114 mg/dL in SZ (n=14) vs 186.4± 42.6
mg/dL in control NS mice (n=7). N. Increased expression of MIR143HG (human equivalent of
E33) in monocytes from type 2 diabetic (T2D) patients vs healthy controls (Control). RT-QPCR
results were expressed as fold over Control samples. Mean ± SEM (*,p<0.05, n=4 each).
Figure 5. Regulation of inflammatory genes and foam cell formation in RAW macrophages
stably overexpressing E330013P06. A-H. Expression of E33 and the indicated genes in RAW
macrophages that either stably overexpressed lncRNA E33 (LVE33) or a control vector that
expressed GFP (LVGFP). RAWcells were transduced with LVE33 or LVGFP and Puromycin (2
ug/ml) resistant cells were used for further analysis by RT-QPCR. Results are expressed as fold
increase over LVGFP (GFP). I-O. RAW macrophages stably expressing E33 (LVE33) or GFP
(LVGFP) were treated with LPS (100 ng/ml) for 24 hours. Expression of indicated genes was
analyzed by RT-QPCR . Results are expressed as fold over GFP control. Data in A-O represents
Mean ± SEM (*,p<0.05, n=4-9). P. Enhanced foam cell formation in macrophages
Page 25 of 57 Diabetes
26
overexpressing E33. Indicated RAW cells were incubated with Dil-Ac-LDL (panels a-b, Red
fluorescence) and fluorescent images were collected as described in Methods. Blue fluorescence
shows nuclear staining with HOECHST dye.
Figure 6. Regulation of E330013P06 and inflammatory genes in diabetic conditions and its
inhbition by E330013P06 gene silencing in macrophages. A-F. BMMC from db/+ mice were
treated with normal (5.5 mmol/L) glucose (NG), high (25 mmol/L) glucose (HG), 200 umol/L
palmitic acid (PA) or HG+PA (HP) for four days. Levels of E33 (A) and the indicated
inflammatory genes (B-F), as well as Cd36 (F), were determined by RT-QPCR. Results are
expressed as fold over gene expression levels in NG. G-L. BMMC from db/db mice were
transiently transfected with siRNA targeting E33 (siE33) or a non-targeting control (siNTC). 72
hours post transfection BMMC were stimulated with HG+PA (HP) for another 24 hours. The
expression of indicated genes was analyzed by RT-QPCR and results expressed as fold over the
siNTC transfected cells. Data are represented as Mean ± SEM (*, p<0.05, n=3).
Page 26 of 57Diabetes
27
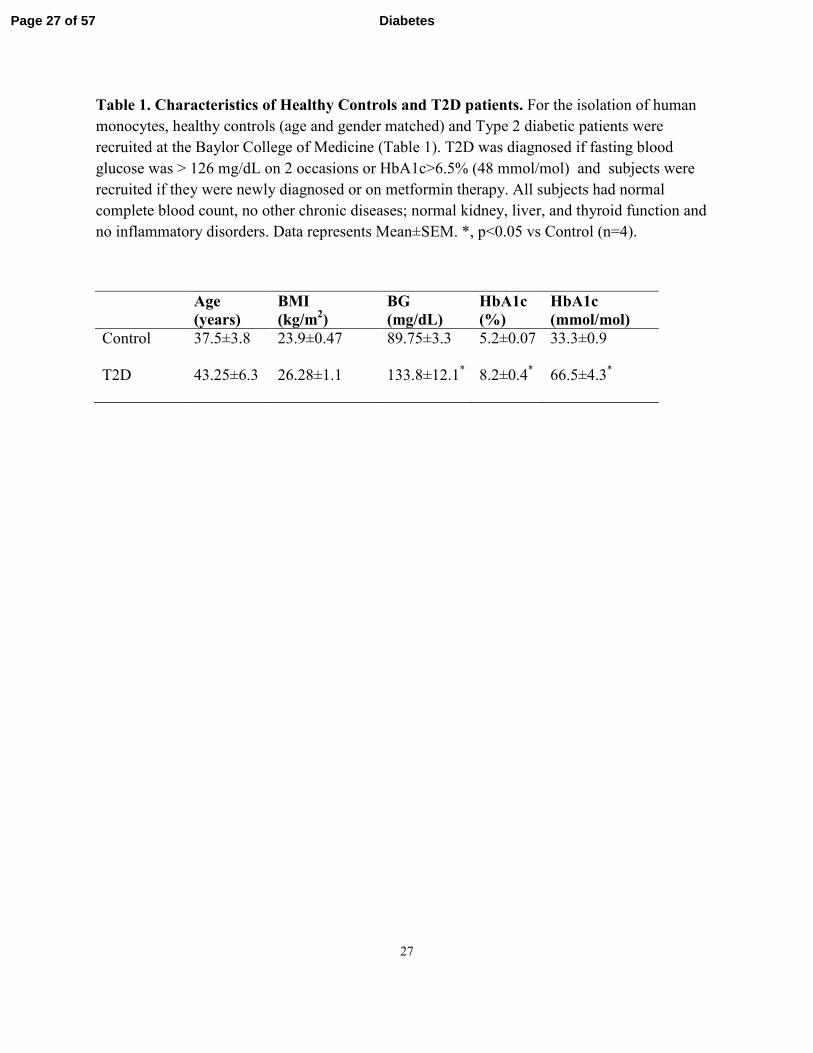
Table 1. Characteristics of Healthy Controls and T2D patients. For the isolation of human
monocytes, healthy controls (age and gender matched) and Type 2 diabetic patients were
recruited at the Baylor College of Medicine (Table 1). T2D was diagnosed if fasting blood
glucose was > 126 mg/dL on 2 occasions or HbA1c>6.5% (48 mmol/mol) and subjects were
recruited if they were newly diagnosed or on metformin therapy. All subjects had normal
complete blood count, no other chronic diseases; normal kidney, liver, and thyroid function and
no inflammatory disorders. Data represents Mean±SEM. *, p<0.05 vs Control (n=4).
Age
(years)
BMI
(kg/m2)
BG
(mg/dL)
HbA1c
(%)
HbA1c
(mmol/mol)
Control 37.5±3.8 23.9±0.47 89.75±3.3 5.2±0.07 33.3±0.9
T2D 43.25±6.3 26.28±1.1 133.8±12.1* 8.2±0.4
* 66.5±4.3
*
Page 27 of 57 Diabetes
28
References
1. Gordon S, Martinez FO: Alternative activation of macrophages: mechanism and functions.
Immunity 2010;32:593-604
2. Odegaard JI, Chawla A: Alternative macrophage activation and metabolism. Annu Rev Pathol
2011;6:275-297
3. Lawrence T, Natoli G: Transcriptional regulation of macrophage polarization: enabling
diversity with identity. Nat Rev Immunol 2011;11:750-761
4. Liao X, Sharma N, Kapadia F, Zhou G, Lu Y, Hong H, Paruchuri K, Mahabeleshwar GH,
Dalmas E, Venteclef N, Flask CA, Kim J, Doreian BW, Lu KQ, Kaestner KH, Hamik A, Clement
K, Jain MK: Kruppel-like factor 4 regulates macrophage polarization. J Clin Invest
2011;121:2736-2749
5. Liu G, Abraham E: MicroRNAs in immune response and macrophage polarization.
Arterioscler Thromb Vasc Biol 2013;33:170-177
6. Olefsky JM, Glass CK: Macrophages, inflammation, and insulin resistance. Annu Rev Physiol
2010;72:219-246
7. Mantovani A, Garlanda C, Locati M: Macrophage diversity and polarization in
atherosclerosis: a question of balance. Arterioscler Thromb Vasc Biol 2009;29:1419-1423
8. Nguyen MT, Favelyukis S, Nguyen AK, Reichart D, Scott PA, Jenn A, Liu-Bryan R, Glass
CK, Neels JG, Olefsky JM: A subpopulation of macrophages infiltrates hypertrophic adipose
tissue and is activated by free fatty acids via Toll-like receptors 2 and 4 and JNK-dependent
pathways. J Biol Chem 2007;282:35279-35292
9. Wang Y, Harris DC: Macrophages in renal disease. J Am Soc Nephrol 2011;22:21-27
10. Rocha VZ, Libby P: Obesity, inflammation, and atherosclerosis. Nat Rev Cardiol
Page 28 of 57Diabetes
29
2009;6:399-409
11. Lumeng CN, Bodzin JL, Saltiel AR: Obesity induces a phenotypic switch in adipose tissue
macrophage polarization. J Clin Invest 2007;117:175-184
12. Devaraj S, Jialal I: Low-density lipoprotein postsecretory modification, monocyte function,
and circulating adhesion molecules in type 2 diabetic patients with and without macrovascular
complications: the effect of alpha-tocopherol supplementation. Circulation 2000;102:191-196
13. Khan T, Muise ES, Iyengar P, Wang ZV, Chandalia M, Abate N, Zhang BB, Bonaldo P, Chua
S, Scherer PE: Metabolic dysregulation and adipose tissue fibrosis: role of collagen VI. Mol Cell
Biol 2009;29:1575-1591
14. Shanmugam N, Reddy MA, Guha M, Natarajan R: High glucose-induced expression of
proinflammatory cytokine and chemokine genes in monocytic cells. Diabetes 2003;52:1256-
1264
15. Li Y, Reddy MA, Miao F, Shanmugam N, Yee JK, Hawkins D, Ren B, Natarajan R: Role of
the histone H3 lysine 4 methyltransferase, SET7/9, in the regulation of NF-kappaB-dependent
inflammatory genes. Relevance to diabetes and inflammation. J Biol Chem 2008;283:26771-
26781
16. Li SL, Reddy MA, Cai Q, Meng L, Yuan H, Lanting L, Natarajan R: Enhanced
proatherogenic responses in macrophages and vascular smooth muscle cells derived from
diabetic db/db mice. Diabetes 2006;55:2611-2619
17. Mauldin JP, Srinivasan S, Mulya A, Gebre A, Parks JS, Daugherty A, Hedrick CC: Reduction
in ABCG1 in Type 2 diabetic mice increases macrophage foam cell formation. J Biol Chem
2006;281:21216-21224
18. Meng L, Park J, Cai Q, Lanting L, Reddy MA, Natarajan R: Diabetic conditions promote
Page 29 of 57 Diabetes
30
binding of monocytes to vascular smooth muscle cells and their subsequent differentiation. Am J
Physiol Heart Circ Physiol 2010;298:H736-745
19. Bornfeldt KE, Tabas I: Insulin resistance, hyperglycemia, and atherosclerosis. Cell Metab
2011;14:575-585
20. Mercer TR, Mattick JS: Structure and function of long noncoding RNAs in epigenetic
regulation. Nat Struct Mol Biol 2013;20:300-307
21. Guttman M, Amit I, Garber M, French C, Lin MF, Feldser D, Huarte M, Zuk O, Carey BW,
Cassady JP, Cabili MN, Jaenisch R, Mikkelsen TS, Jacks T, Hacohen N, Bernstein BE, Kellis M,
Regev A, Rinn JL, Lander ES: Chromatin signature reveals over a thousand highly conserved
large non-coding RNAs in mammals. Nature 2009;458:223-227
22. Leung A, Trac C, Jin W, Lanting L, Akbany A, Saetrom P, Schones DE, Natarajan R: Novel
Long Noncoding RNAs Are Regulated by Angiotensin II in Vascular Smooth Muscle Cells. Circ
Res 2013;113:266-278
23. Wahlestedt C: Targeting long non-coding RNA to therapeutically upregulate gene expression.
Nat Rev Drug Discov 2013;12:433-446
24. Moran I, Akerman I, van de Bunt M, Xie R, Benazra M, Nammo T, Arnes L, Nakic N,
Garcia-Hurtado J, Rodriguez-Segui S, Pasquali L, Sauty-Colace C, Beucher A, Scharfmann R,
van Arensbergen J, Johnson PR, Berry A, Lee C, Harkins T, Gmyr V, Pattou F, Kerr-Conte J,
Piemonti L, Berney T, Hanley N, Gloyn AL, Sussel L, Langman L, Brayman KL, Sander M,
McCarthy MI, Ravassard P, Ferrer J: Human beta cell transcriptome analysis uncovers lncRNAs
that are tissue-specific, dynamically regulated, and abnormally expressed in type 2 diabetes. Cell
Metab 2012;16:435-448
25. Putta S, Lanting L, Sun G, Lawson G, Kato M, Natarajan R: Inhibiting microRNA-192
Page 30 of 57Diabetes
31
ameliorates renal fibrosis in diabetic nephropathy. J Am Soc Nephrol 2012;23:458-469
26. Weischenfeldt J, Porse B: Bone Marrow-Derived Macrophages (BMM): Isolation and
Applications. CSH Protoc 2008;2008:pdb prot5080
27. Kanter JE, Kramer F, Barnhart S, Averill MM, Vivekanandan-Giri A, Vickery T, Li LO,
Becker L, Yuan W, Chait A, Braun KR, Potter-Perigo S, Sanda S, Wight TN, Pennathur S, Serhan
CN, Heinecke JW, Coleman RA, Bornfeldt KE: Diabetes promotes an inflammatory macrophage
phenotype and atherosclerosis through acyl-CoA synthetase 1. Proc Natl Acad Sci U S A
2012;109:E715-724
28. Wen H, Gris D, Lei Y, Jha S, Zhang L, Huang MT, Brickey WJ, Ting JP: Fatty acid-induced
NLRP3-ASC inflammasome activation interferes with insulin signaling. Nat Immunol
2011;12:408-415
29. Dasu MR, Devaraj S, Park S, Jialal I: Increased toll-like receptor (TLR) activation and TLR
ligands in recently diagnosed type 2 diabetic subjects. Diabetes Care 2010;33:861-868
30. Trapnell C, Pachter L, Salzberg SL: TopHat: discovering splice junctions with RNA-Seq.
Bioinformatics 2009;25:1105-1111
31. Lin MF, Jungreis I, Kellis M: PhyloCSF: a comparative genomics method to distinguish
protein coding and non-coding regions. Bioinformatics 2011;27:i275-282
32. Pauli A, Valen E, Lin MF, Garber M, Vastenhouw NL, Levin JZ, Fan L, Sandelin A, Rinn JL,
Regev A, Schier AF: Systematic identification of long noncoding RNAs expressed during
zebrafish embryogenesis. Genome Res 2012;22:577-591
33. Cabili MN, Trapnell C, Goff L, Koziol M, Tazon-Vega B, Regev A, Rinn JL: Integrative
annotation of human large intergenic noncoding RNAs reveals global properties and specific
subclasses. Genes Dev 2011;25:1915-1927
Page 31 of 57 Diabetes
32
34. Trapnell C, Williams BA, Pertea G, Mortazavi A, Kwan G, van Baren MJ, Salzberg SL, Wold
BJ, Pachter L: Transcript assembly and quantification by RNA-Seq reveals unannotated
transcripts and isoform switching during cell differentiation. Nat Biotechnol 2010;28:511-515
35. Thomas-Chollier M, Hufton A, Heinig M, O'Keeffe S, Masri NE, Roider HG, Manke T,
Vingron M: Transcription factor binding predictions using TRAP for the analysis of ChIP-seq
data and regulatory SNPs. Nat Protoc 2011;6:1860-1869
36. Saetrom P, Snove O, Jr.: A comparison of siRNA efficacy predictors. Biochem Biophys Res
Commun 2004;321:247-253
37. Lacey DC, Achuthan A, Fleetwood AJ, Dinh H, Roiniotis J, Scholz GM, Chang MW,
Beckman SK, Cook AD, Hamilton JA: Defining GM-CSF- and macrophage-CSF-dependent
macrophage responses by in vitro models. J Immunol 2012;188:5752-5765
38. Kent OA, Chivukula RR, Mullendore M, Wentzel EA, Feldmann G, Lee KH, Liu S, Leach
SD, Maitra A, Mendell JT: Repression of the miR-143/145 cluster by oncogenic Ras initiates a
tumor-promoting feed-forward pathway. Genes Dev 2010;24:2754-2759
39. Cordes KR, Sheehy NT, White MP, Berry EC, Morton SU, Muth AN, Lee TH, Miano JM,
Ivey KN, Srivastava D: miR-145 and miR-143 regulate smooth muscle cell fate and plasticity.
Nature 2009;460:705-710
40. Jordan SD, Kruger M, Willmes DM, Redemann N, Wunderlich FT, Bronneke HS, Merkwirth
C, Kashkar H, Olkkonen VM, Bottger T, Braun T, Seibler J, Bruning JC: Obesity-induced
overexpression of miRNA-143 inhibits insulin-stimulated AKT activation and impairs glucose
metabolism. Nat Cell Biol 2011;13:434-446
41. Chatzigeorgiou A, Halapas A, Kalafatakis K, Kamper E: The use of animal models in the
study of diabetes mellitus. In Vivo 2009;23:245-258
Page 32 of 57Diabetes
33
42. Nathan C, Shiloh MU: Reactive oxygen and nitrogen intermediates in the relationship
between mammalian hosts and microbial pathogens. Proc Natl Acad Sci U S A 2000;97:8841-
8848
43. Sieweke MH, Allen JE: Beyond stem cells: self-renewal of differentiated macrophages.
Science 2013;342:1242974
44. Nagareddy PR, Murphy AJ, Stirzaker RA, Hu Y, Yu S, Miller RG, Ramkhelawon B, Distel E,
Westerterp M, Huang LS, Schmidt AM, Orchard TJ, Fisher EA, Tall AR, Goldberg IJ:
Hyperglycemia promotes myelopoiesis and impairs the resolution of atherosclerosis. Cell Metab
2013;17:695-708
45. Randolph GJ: Macrophages in Marseille. Immunity 2013;38:619-621
46. Sullivan AL, Benner C, Heinz S, Huang W, Xie L, Miano JM, Glass CK: Serum response
factor utilizes distinct promoter- and enhancer-based mechanisms to regulate cytoskeletal gene
expression in macrophages. Mol Cell Biol 2011;31:861-875
47. Nagamura-Inoue T, Tamura T, Ozato K: Transcription factors that regulate growth and
differentiation of myeloid cells. Int Rev Immunol 2001;20:83-105
48. Giacco F, Brownlee M: Oxidative stress and diabetic complications. Circ Res
2010;107:1058-1070
49. Jialal I, Kaur H: The Role of Toll-Like Receptors in Diabetes-Induced Inflammation:
Implications for Vascular Complications. Curr Diab Rep 2012;12:172-179
50. Xu HE, Lambert MH, Montana VG, Parks DJ, Blanchard SG, Brown PJ, Sternbach DD,
Lehmann JM, Wisely GB, Willson TM, Kliewer SA, Milburn MV: Molecular recognition of fatty
acids by peroxisome proliferator-activated receptors. Mol Cell 1999;3:397-403
Page 33 of 57 Diabetes
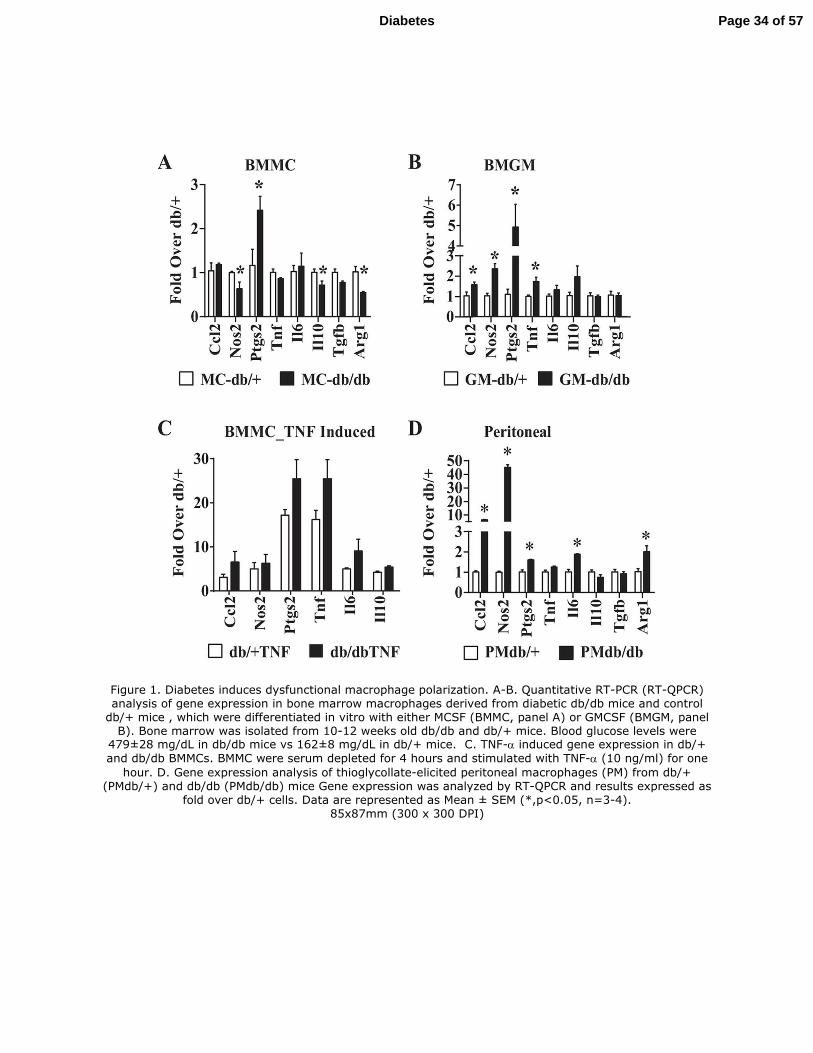
Figure 1. Diabetes induces dysfunctional macrophage polarization. A-B. Quantitative RT-PCR (RT-QPCR) analysis of gene expression in bone marrow macrophages derived from diabetic db/db mice and control db/+ mice , which were differentiated in vitro with either MCSF (BMMC, panel A) or GMCSF (BMGM, panel B). Bone marrow was isolated from 10-12 weeks old db/db and db/+ mice. Blood glucose levels were
479±28 mg/dL in db/db mice vs 162±8 mg/dL in db/+ mice. C. TNF-α induced gene expression in db/+
and db/db BMMCs. BMMC were serum depleted for 4 hours and stimulated with TNF-α (10 ng/ml) for one
hour. D. Gene expression analysis of thioglycollate-elicited peritoneal macrophages (PM) from db/+ (PMdb/+) and db/db (PMdb/db) mice Gene expression was analyzed by RT-QPCR and results expressed as
fold over db/+ cells. Data are represented as Mean ± SEM (*,p<0.05, n=3-4). 85x87mm (300 x 300 DPI)
Page 34 of 57Diabetes
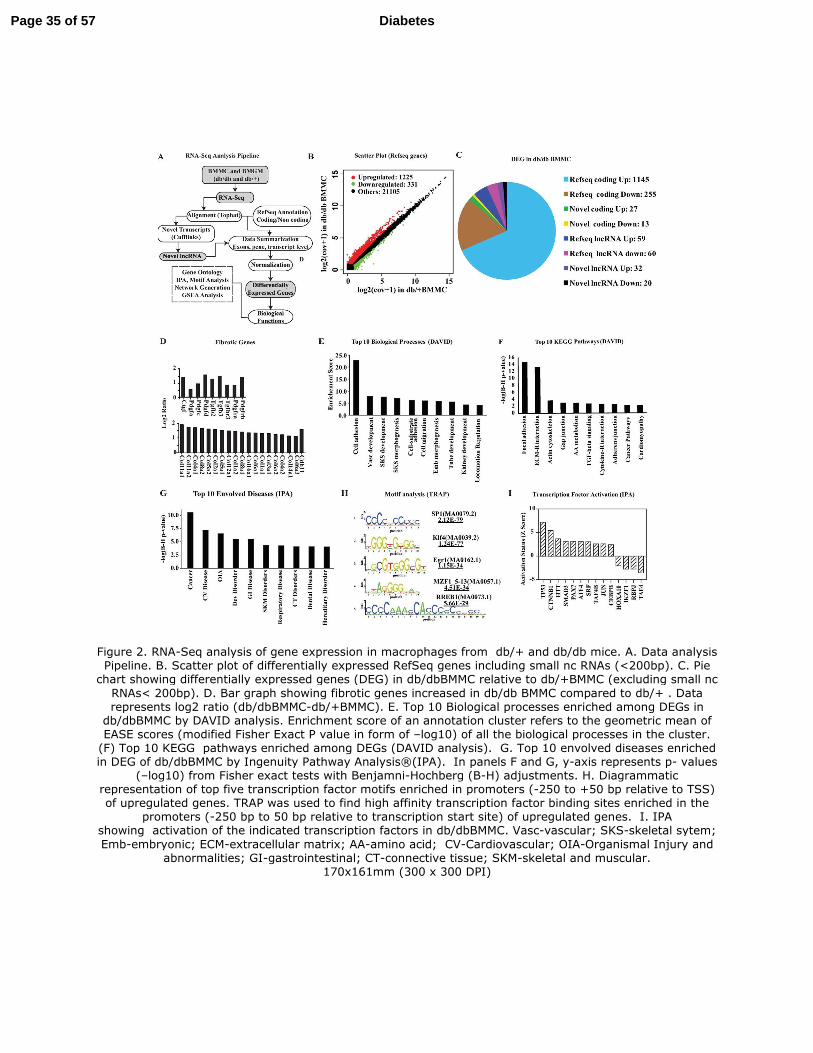
Figure 2. RNA-Seq analysis of gene expression in macrophages from db/+ and db/db mice. A. Data analysis Pipeline. B. Scatter plot of differentially expressed RefSeq genes including small nc RNAs (<200bp). C. Pie chart showing differentially expressed genes (DEG) in db/dbBMMC relative to db/+BMMC (excluding small nc
RNAs< 200bp). D. Bar graph showing fibrotic genes increased in db/db BMMC compared to db/+ . Data represents log2 ratio (db/dbBMMC-db/+BMMC). E. Top 10 Biological processes enriched among DEGs in db/dbBMMC by DAVID analysis. Enrichment score of an annotation cluster refers to the geometric mean of EASE scores (modified Fisher Exact P value in form of –log10) of all the biological processes in the cluster. (F) Top 10 KEGG pathways enriched among DEGs (DAVID analysis). G. Top 10 envolved diseases enriched in DEG of db/dbBMMC by Ingenuity Pathway Analysis®(IPA). In panels F and G, y-axis represents p- values
(–log10) from Fisher exact tests with Benjamni-Hochberg (B-H) adjustments. H. Diagrammatic representation of top five transcription factor motifs enriched in promoters (-250 to +50 bp relative to TSS) of upregulated genes. TRAP was used to find high affinity transcription factor binding sites enriched in the
promoters (-250 bp to 50 bp relative to transcription start site) of upregulated genes. I. IPA showing activation of the indicated transcription factors in db/dbBMMC. Vasc-vascular; SKS-skeletal sytem;
Emb-embryonic; ECM-extracellular matrix; AA-amino acid; CV-Cardiovascular; OIA-Organismal Injury and abnormalities; GI-gastrointestinal; CT-connective tissue; SKM-skeletal and muscular.
170x161mm (300 x 300 DPI)
Page 35 of 57 Diabetes
Figure 3. Identification of Differentially expressed lncRNAs in Macrophages from db/db mice. A. Pipeline used to identify novel lncRNAs in BMMC. B-C. Representative known (RefSeq) lncRNAs differentially expressed (B)
and nearby (±500kb flanking regions) differentially expressed genes (C) in db/dbBMMC. D-E. Novel
differentially-expressed lncRNAs (>200 bp with at least two exons) (D) and nearby genes with altered expression in db/dbBMMC (E). F. Schematic showing the genomic structure of lncRNA E330013P06 and the alignment of RNA-seq reads in db/+BMMC (db/+) and db/dbBMMC (db/db). Arrow indicates the direction of transcription. Closed rectangles are exons and open rectangles are miRNAs expressed from these genomic
locations. G. IPA of differentially expressed nearby genes. 106x64mm (300 x 300 DPI)
Page 36 of 57Diabetes
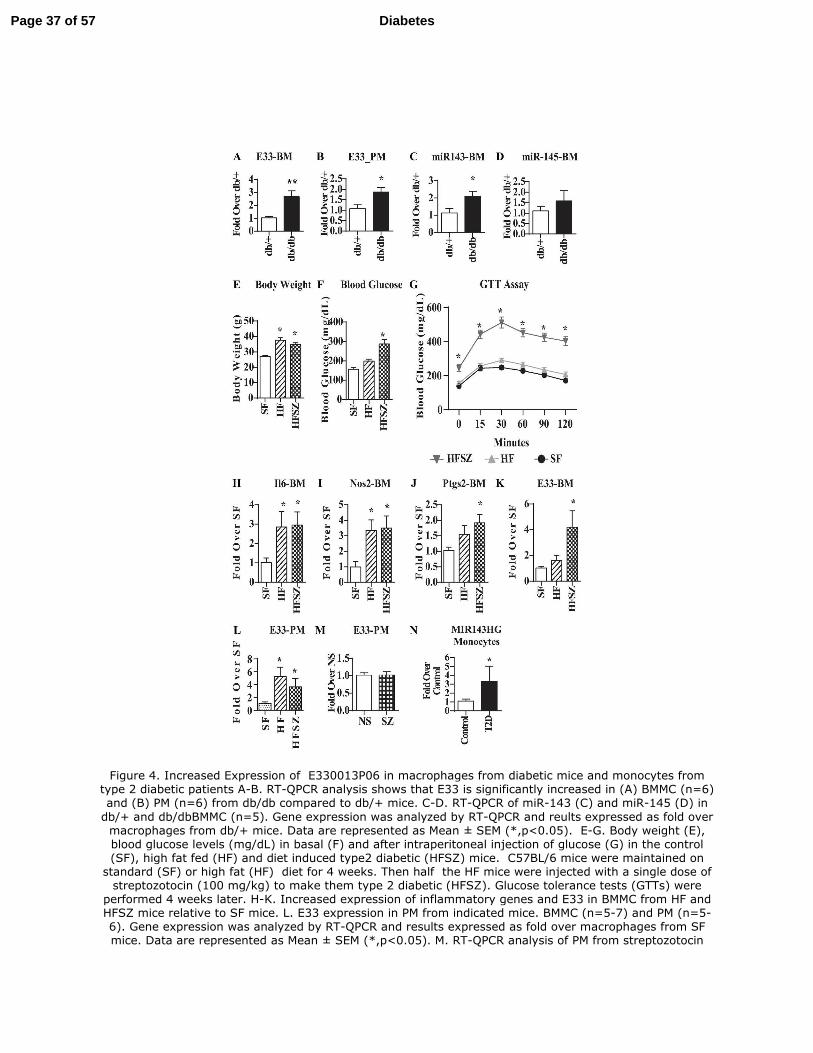
Figure 4. Increased Expression of E330013P06 in macrophages from diabetic mice and monocytes from type 2 diabetic patients A-B. RT-QPCR analysis shows that E33 is significantly increased in (A) BMMC (n=6) and (B) PM (n=6) from db/db compared to db/+ mice. C-D. RT-QPCR of miR-143 (C) and miR-145 (D) in
db/+ and db/dbBMMC (n=5). Gene expression was analyzed by RT-QPCR and reults expressed as fold over macrophages from db/+ mice. Data are represented as Mean ± SEM (*,p<0.05). E-G. Body weight (E), blood glucose levels (mg/dL) in basal (F) and after intraperitoneal injection of glucose (G) in the control (SF), high fat fed (HF) and diet induced type2 diabetic (HFSZ) mice. C57BL/6 mice were maintained on standard (SF) or high fat (HF) diet for 4 weeks. Then half the HF mice were injected with a single dose of streptozotocin (100 mg/kg) to make them type 2 diabetic (HFSZ). Glucose tolerance tests (GTTs) were
performed 4 weeks later. H-K. Increased expression of inflammatory genes and E33 in BMMC from HF and HFSZ mice relative to SF mice. L. E33 expression in PM from indicated mice. BMMC (n=5-7) and PM (n=5-6). Gene expression was analyzed by RT-QPCR and results expressed as fold over macrophages from SF mice. Data are represented as Mean ± SEM (*,p<0.05). M. RT-QPCR analysis of PM from streptozotocin
Page 37 of 57 Diabetes

induced Type 1 diabetic mice (SZ) showed no changes in E33 levels relative to controls (NS) mice (Mean ± SEM, n=7-14). Blood glucose levels were 527.1 ±114 mg/dL in SZ (n=14) vs 186.4± 42.6 mg/dL in control NS mice (n=7). N. Increased expression of MIR143HG (human equivalent of E33) in monocytes from type 2 diabetic (T2D) patients vs healthy controls (Control). RT-QPCR results were expressed as fold over Control
samples. Mean ± SEM (*,p<0.05, n=4 each). 146x250mm (300 x 300 DPI)
Page 38 of 57Diabetes
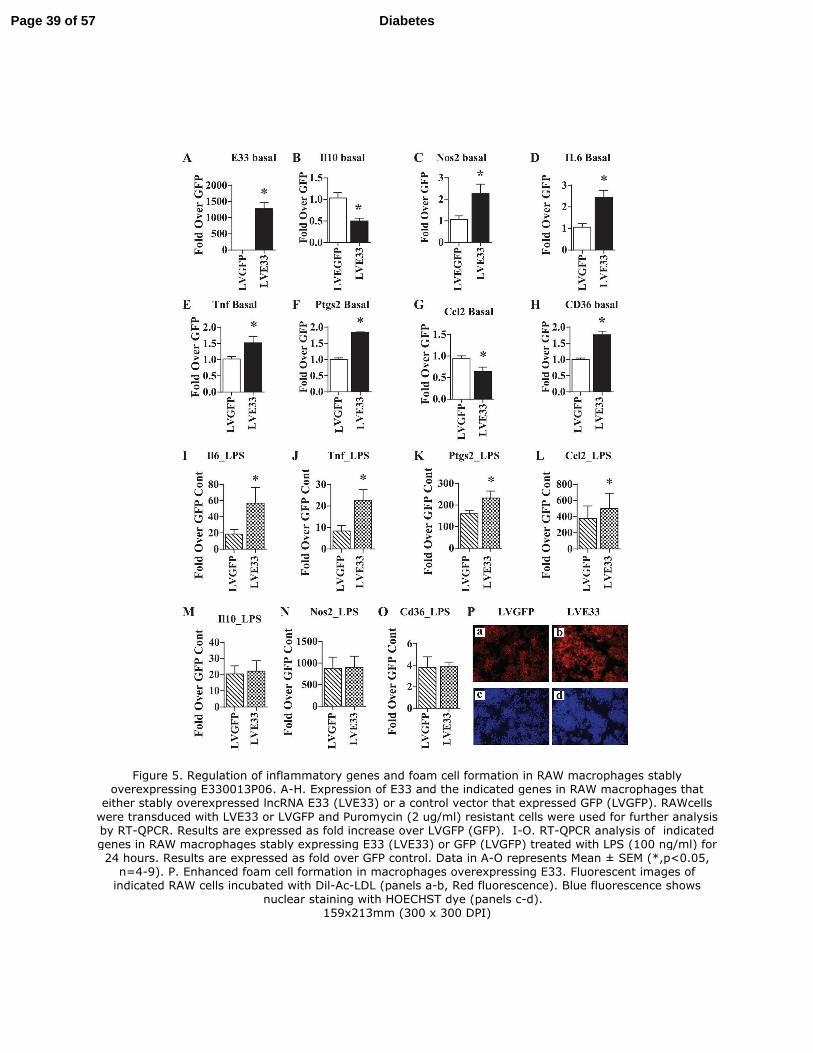
Figure 5. Regulation of inflammatory genes and foam cell formation in RAW macrophages stably overexpressing E330013P06. A-H. Expression of E33 and the indicated genes in RAW macrophages that
either stably overexpressed lncRNA E33 (LVE33) or a control vector that expressed GFP (LVGFP). RAWcells
were transduced with LVE33 or LVGFP and Puromycin (2 ug/ml) resistant cells were used for further analysis by RT-QPCR. Results are expressed as fold increase over LVGFP (GFP). I-O. RT-QPCR analysis of indicated genes in RAW macrophages stably expressing E33 (LVE33) or GFP (LVGFP) treated with LPS (100 ng/ml) for 24 hours. Results are expressed as fold over GFP control. Data in A-O represents Mean ± SEM (*,p<0.05, n=4-9). P. Enhanced foam cell formation in macrophages overexpressing E33. Fluorescent images of indicated RAW cells incubated with Dil-Ac-LDL (panels a-b, Red fluorescence). Blue fluorescence shows
nuclear staining with HOECHST dye (panels c-d). 159x213mm (300 x 300 DPI)
Page 39 of 57 Diabetes
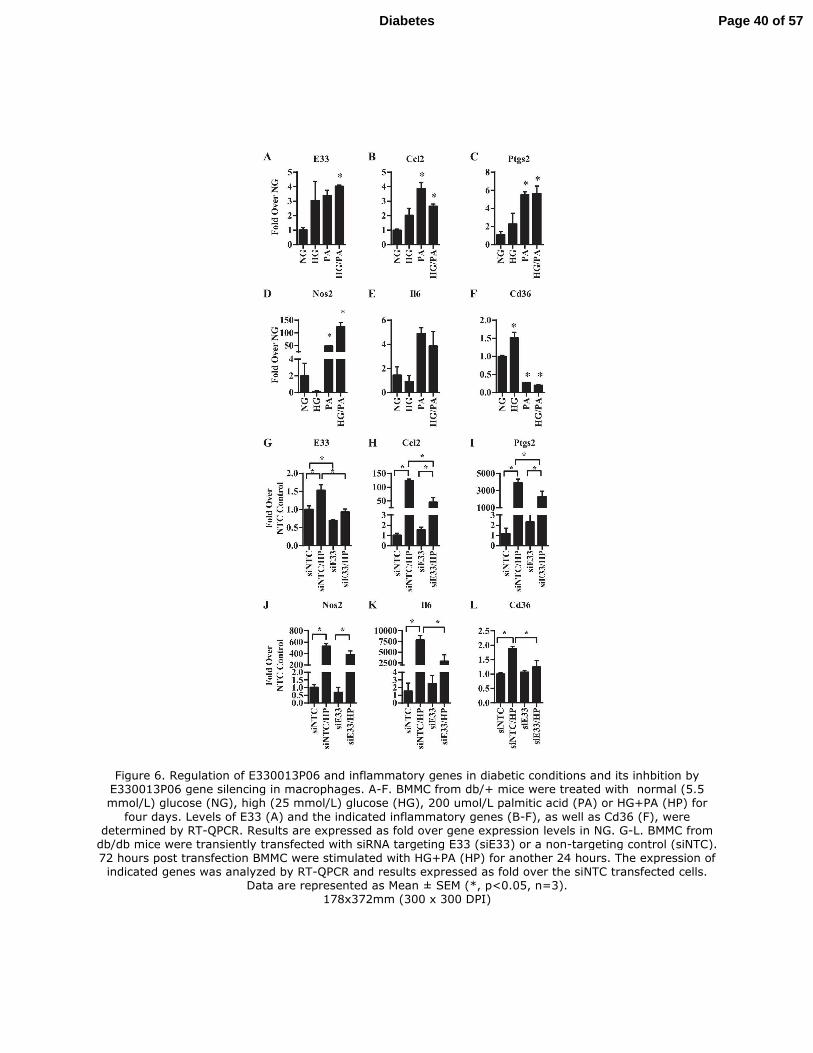
Figure 6. Regulation of E330013P06 and inflammatory genes in diabetic conditions and its inhbition by E330013P06 gene silencing in macrophages. A-F. BMMC from db/+ mice were treated with normal (5.5 mmol/L) glucose (NG), high (25 mmol/L) glucose (HG), 200 umol/L palmitic acid (PA) or HG+PA (HP) for
four days. Levels of E33 (A) and the indicated inflammatory genes (B-F), as well as Cd36 (F), were determined by RT-QPCR. Results are expressed as fold over gene expression levels in NG. G-L. BMMC from db/db mice were transiently transfected with siRNA targeting E33 (siE33) or a non-targeting control (siNTC). 72 hours post transfection BMMC were stimulated with HG+PA (HP) for another 24 hours. The expression of indicated genes was analyzed by RT-QPCR and results expressed as fold over the siNTC transfected cells.
Data are represented as Mean ± SEM (*, p<0.05, n=3). 178x372mm (300 x 300 DPI)
Page 40 of 57Diabetes
Online Supplemental Data
Regulation of Inflammatory Phenotype in Macrophages by a
Diabetes-Induced Long Noncoding RNA
Marpadga A. Reddy1*
, Zhuo Chen1, Jung Tak Park
1,2, Mei Wang
1, Linda Lanting
1, Qiang
Zhang1, Kirti Bhatt
1, Amy Leung
1, Xiwei Wu
1, Sumanth Putta
1, Pål Sætrom
3, Sridevi
Devaraj4 and Rama Natarajan
1*
1 Department of Diabetes and Metabolic Diseases Research, Division of Molecular Diabetes
Research, Beckman Research Institute of City of Hope, Duarte, CA. 2Current address:
Department of Internal Medicine, College of Medicine, Yonsei University, Seoul, Korea.
3Departments of Computer and Information Science, Cancer Research and Molecular Medicine,
Norwegian University of Science and Technology, Trondheim, Norway (P.S.)., 4Department of
Pathology and Immunology, Baylor College of Medicine and Texas Children's Hospital,
Houston, TX.
Page 41 of 57 Diabetes
2
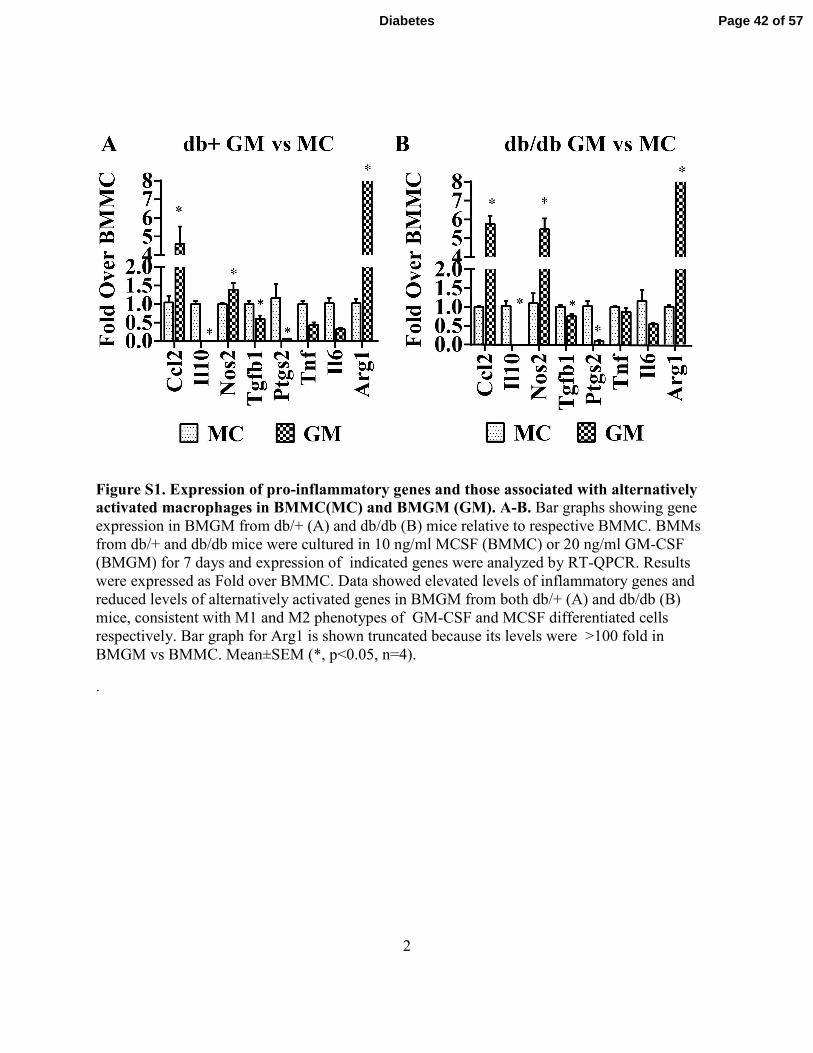
Figure S1. Expression of pro-inflammatory genes and those associated with alternatively activated macrophages in BMMC(MC) and BMGM (GM). A-B. Bar graphs showing gene
expression in BMGM from db/+ (A) and db/db (B) mice relative to respective BMMC. BMMs
from db/+ and db/db mice were cultured in 10 ng/ml MCSF (BMMC) or 20 ng/ml GM-CSF
(BMGM) for 7 days and expression of indicated genes were analyzed by RT-QPCR. Results
were expressed as Fold over BMMC. Data showed elevated levels of inflammatory genes and
reduced levels of alternatively activated genes in BMGM from both db/+ (A) and db/db (B)
mice, consistent with M1 and M2 phenotypes of GM-CSF and MCSF differentiated cells
respectively. Bar graph for Arg1 is shown truncated because its levels were >100 fold in
BMGM vs BMMC. Mean±SEM (*, p<0.05, n=4).
.
Page 42 of 57Diabetes
3
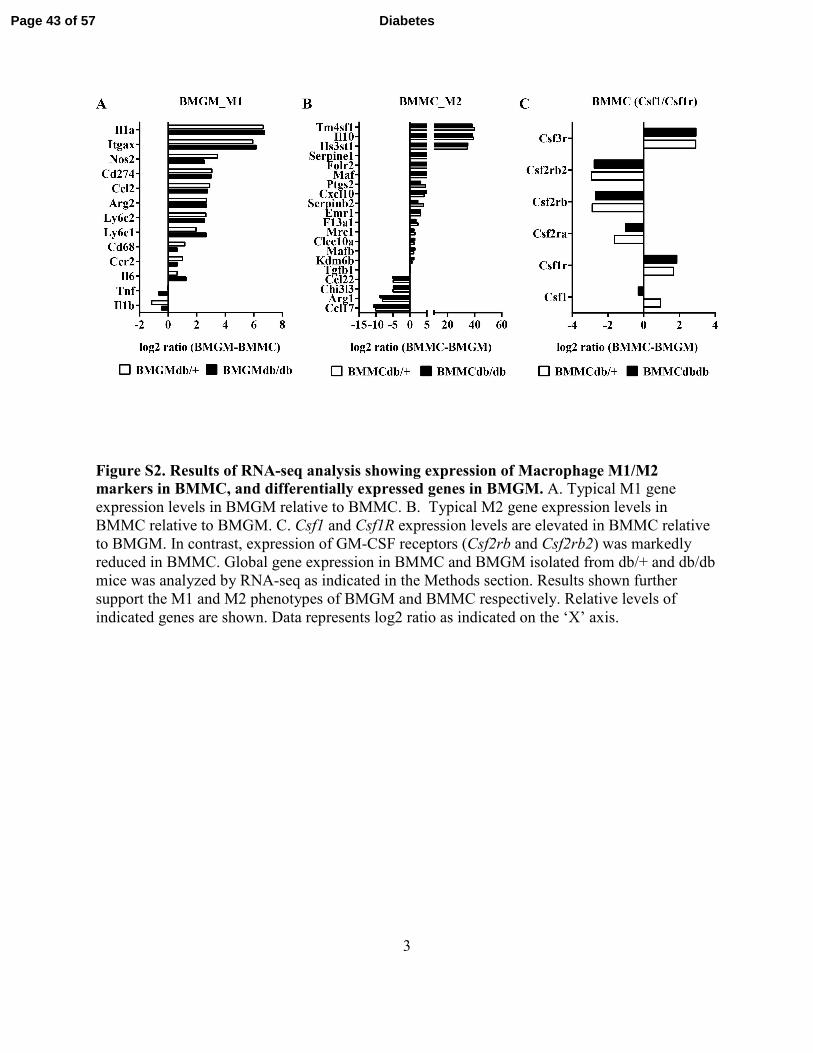
Figure S2. Results of RNA-seq analysis showing expression of Macrophage M1/M2 markers in BMMC, and differentially expressed genes in BMGM. A. Typical M1 gene
expression levels in BMGM relative to BMMC. B. Typical M2 gene expression levels in
BMMC relative to BMGM. C. Csf1 and Csf1R expression levels are elevated in BMMC relative
to BMGM. In contrast, expression of GM-CSF receptors (Csf2rb and Csf2rb2) was markedly
reduced in BMMC. Global gene expression in BMMC and BMGM isolated from db/+ and db/db
mice was analyzed by RNA-seq as indicated in the Methods section. Results shown further
support the M1 and M2 phenotypes of BMGM and BMMC respectively. Relative levels of
indicated genes are shown. Data represents log2 ratio as indicated on the ‘X’ axis.
Page 43 of 57 Diabetes
4
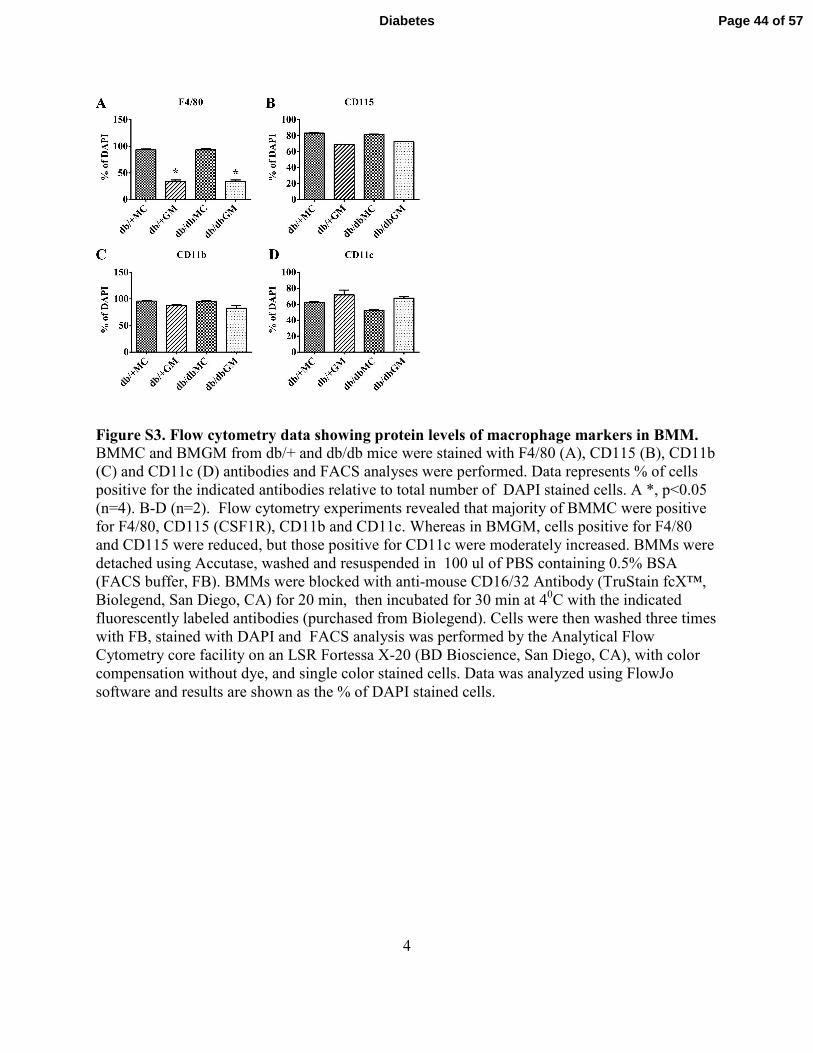
Figure S3. Flow cytometry data showing protein levels of macrophage markers in BMM. BMMC and BMGM from db/+ and db/db mice were stained with F4/80 (A), CD115 (B), CD11b
(C) and CD11c (D) antibodies and FACS analyses were performed. Data represents % of cells
positive for the indicated antibodies relative to total number of DAPI stained cells. A *, p<0.05
(n=4). B-D (n=2). Flow cytometry experiments revealed that majority of BMMC were positive
for F4/80, CD115 (CSF1R), CD11b and CD11c. Whereas in BMGM, cells positive for F4/80
and CD115 were reduced, but those positive for CD11c were moderately increased. BMMs were
detached using Accutase, washed and resuspended in 100 ul of PBS containing 0.5% BSA
(FACS buffer, FB). BMMs were blocked with anti-mouse CD16/32 Antibody (TruStain fcX™,
Biolegend, San Diego, CA) for 20 min, then incubated for 30 min at 40C with the indicated
fluorescently labeled antibodies (purchased from Biolegend). Cells were then washed three times
with FB, stained with DAPI and FACS analysis was performed by the Analytical Flow
Cytometry core facility on an LSR Fortessa X-20 (BD Bioscience, San Diego, CA), with color
compensation without dye, and single color stained cells. Data was analyzed using FlowJo
software and results are shown as the % of DAPI stained cells.
Page 44 of 57Diabetes
5
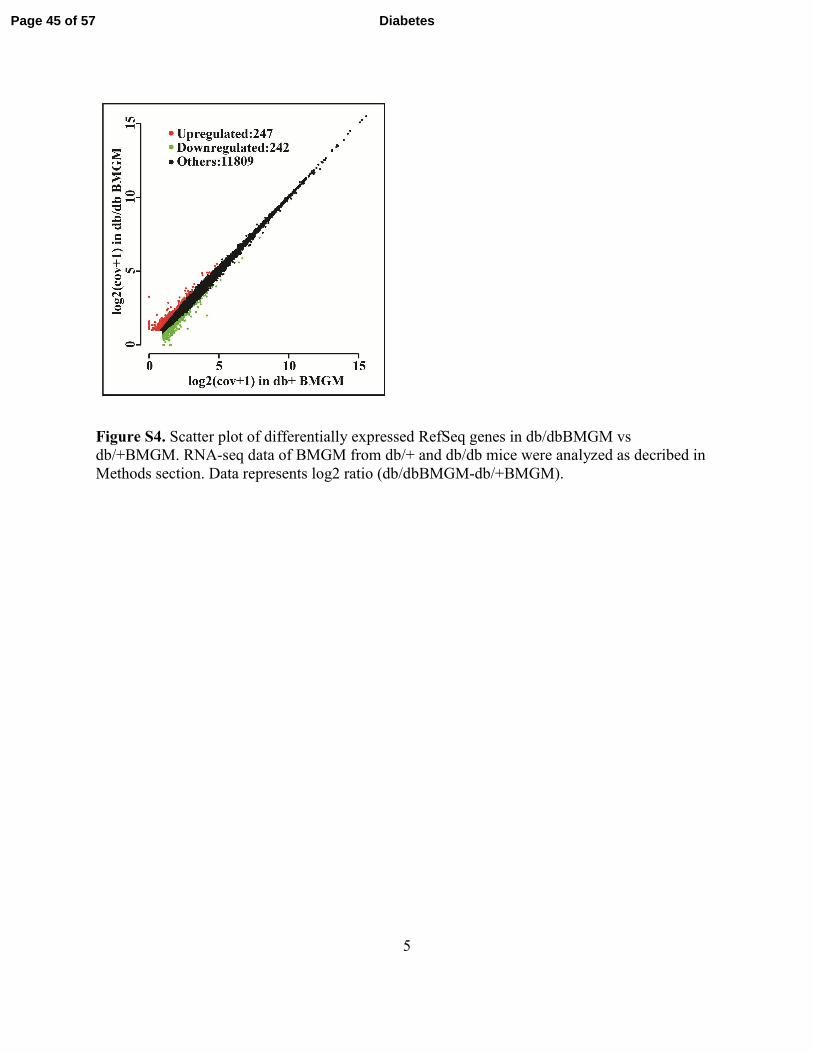
Figure S4. Scatter plot of differentially expressed RefSeq genes in db/dbBMGM vs
db/+BMGM. RNA-seq data of BMGM from db/+ and db/db mice were analyzed as decribed in
Methods section. Data represents log2 ratio (db/dbBMGM-db/+BMGM).
Page 45 of 57 Diabetes
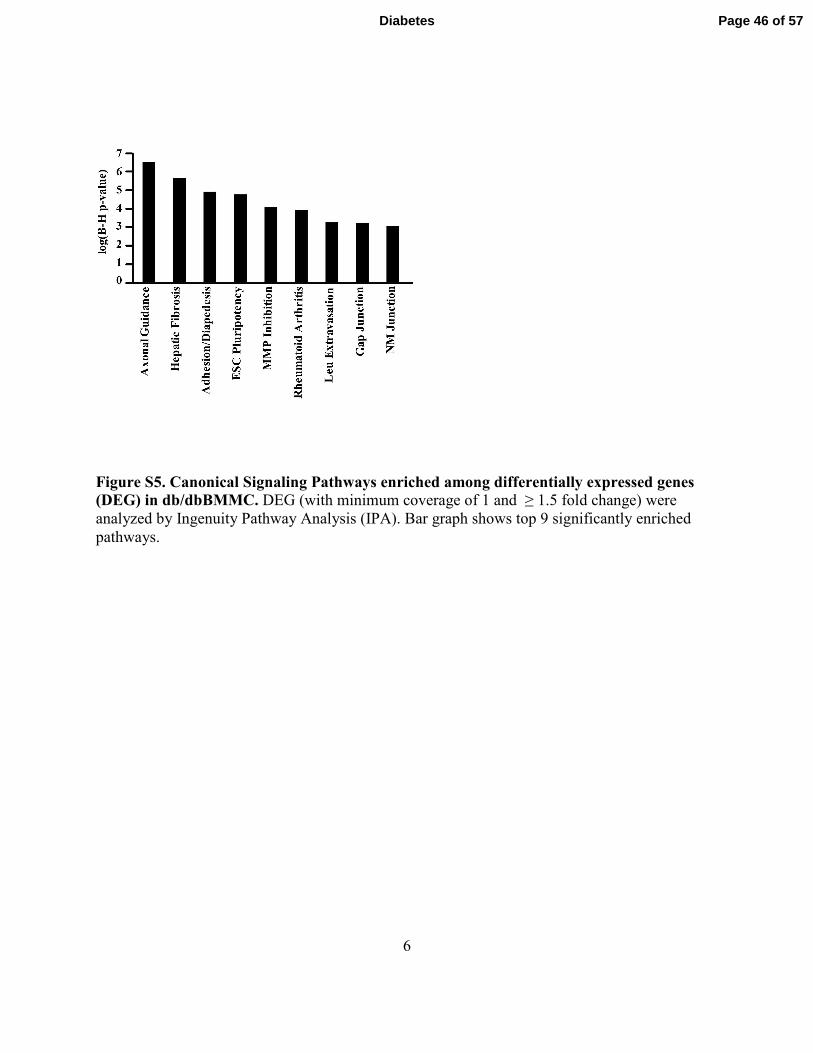
6
Figure S5. Canonical Signaling Pathways enriched among differentially expressed genes (DEG) in db/dbBMMC. DEG (with minimum coverage of 1 and ≥ 1.5 fold change) were
analyzed by Ingenuity Pathway Analysis (IPA). Bar graph shows top 9 significantly enriched
pathways.
Page 46 of 57Diabetes
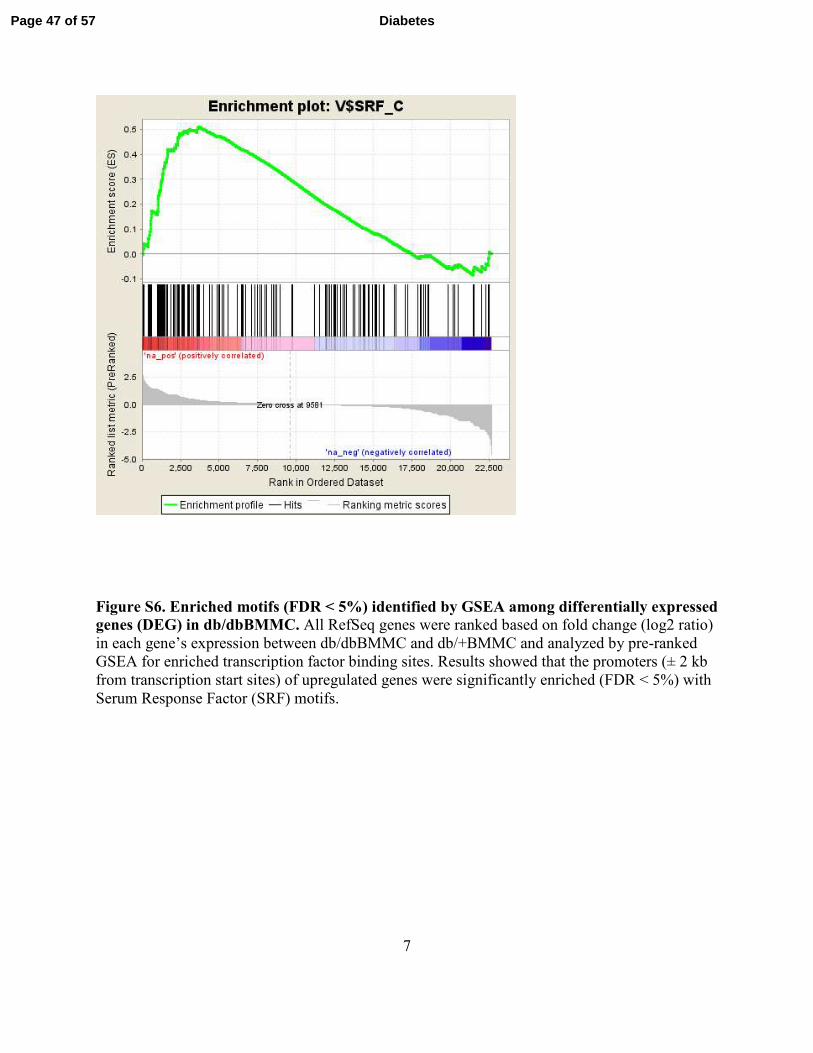
7
Figure S6. Enriched motifs (FDR < 5%) identified by GSEA among differentially expressed genes (DEG) in db/dbBMMC. All RefSeq genes were ranked based on fold change (log2 ratio)
in each gene’s expression between db/dbBMMC and db/+BMMC and analyzed by pre-ranked
GSEA for enriched transcription factor binding sites. Results showed that the promoters (± 2 kb
from transcription start sites) of upregulated genes were significantly enriched (FDR < 5%) with
Serum Response Factor (SRF) motifs.
Page 47 of 57 Diabetes
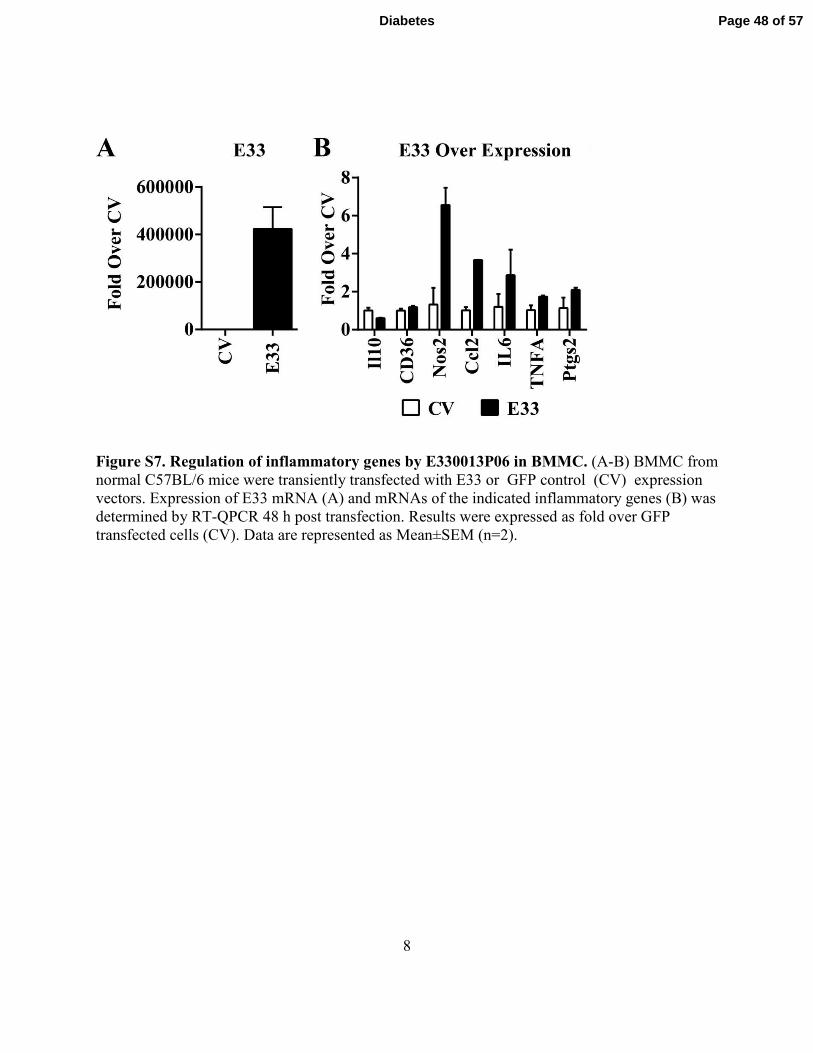
8
Figure S7. Regulation of inflammatory genes by E330013P06 in BMMC. (A-B) BMMC from
normal C57BL/6 mice were transiently transfected with E33 or GFP control (CV) expression
vectors. Expression of E33 mRNA (A) and mRNAs of the indicated inflammatory genes (B) was
determined by RT-QPCR 48 h post transfection. Results were expressed as fold over GFP
transfected cells (CV). Data are represented as Mean±SEM (n=2).
Page 48 of 57Diabetes
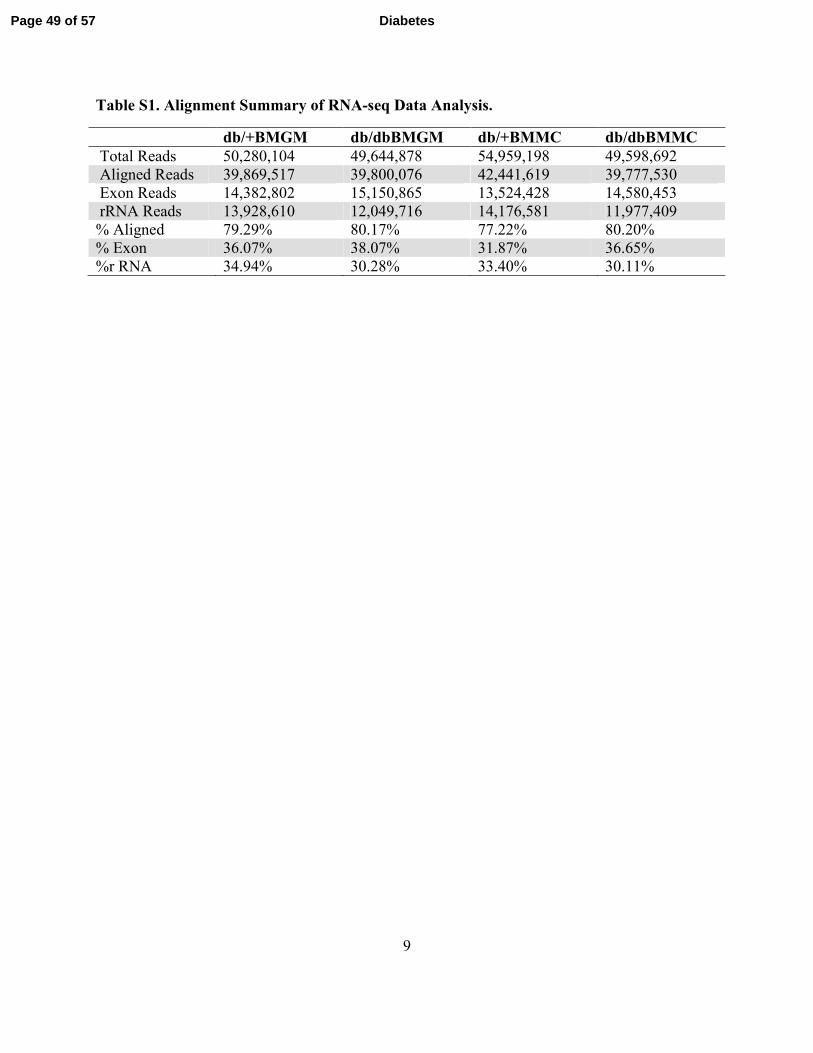
9
Table S1. Alignment Summary of RNA-seq Data Analysis.
db/+BMGM db/dbBMGM db/+BMMC db/dbBMMC
Total Reads 50,280,104 49,644,878 54,959,198 49,598,692
Aligned Reads 39,869,517 39,800,076 42,441,619 39,777,530
Exon Reads 14,382,802 15,150,865 13,524,428 14,580,453
rRNA Reads 13,928,610 12,049,716 14,176,581 11,977,409
% Aligned 79.29% 80.17% 77.22% 80.20%
% Exon 36.07% 38.07% 31.87% 36.65%
%r RNA 34.94% 30.28% 33.40% 30.11%
Page 49 of 57 Diabetes
10
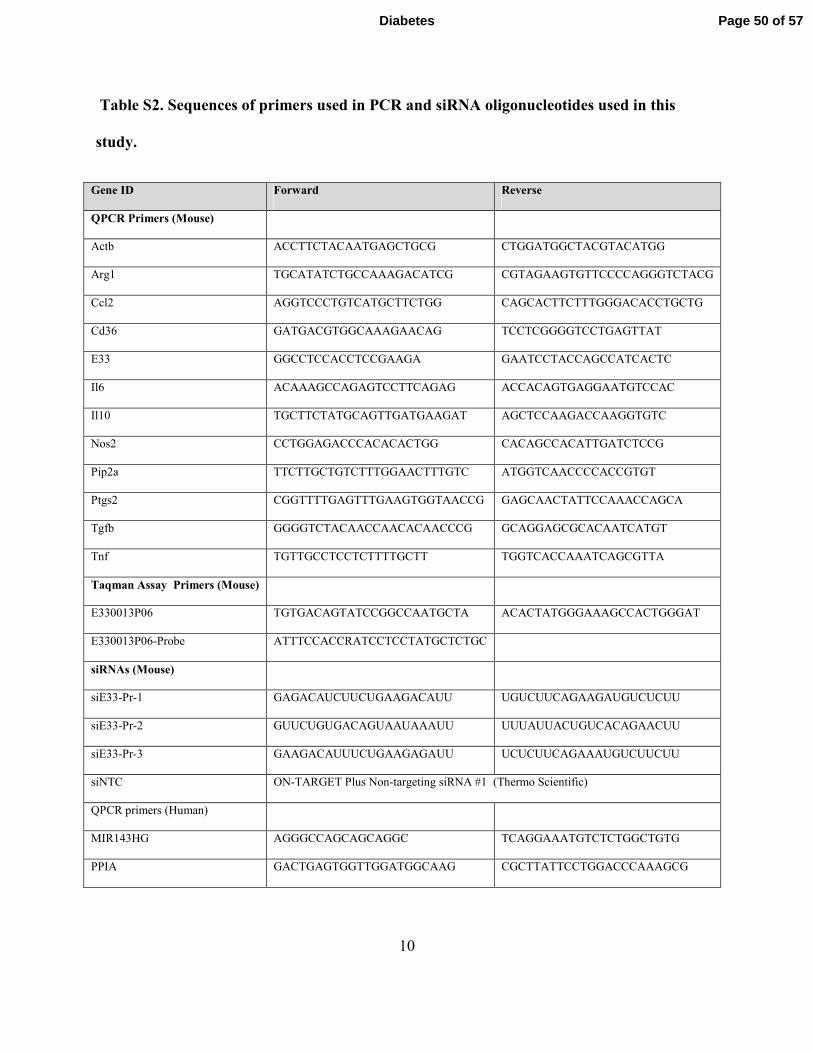
Table S2. Sequences of primers used in PCR and siRNA oligonucleotides used in this
study.
Gene ID Forward Reverse
QPCR Primers (Mouse)
Actb ACCTTCTACAATGAGCTGCG CTGGATGGCTACGTACATGG
Arg1 TGCATATCTGCCAAAGACATCG CGTAGAAGTGTTCCCCAGGGTCTACG
Ccl2 AGGTCCCTGTCATGCTTCTGG CAGCACTTCTTTGGGACACCTGCTG
Cd36 GATGACGTGGCAAAGAACAG TCCTCGGGGTCCTGAGTTAT
E33 GGCCTCCACCTCCGAAGA GAATCCTACCAGCCATCACTC
Il6 ACAAAGCCAGAGTCCTTCAGAG ACCACAGTGAGGAATGTCCAC
Il10 TGCTTCTATGCAGTTGATGAAGAT AGCTCCAAGACCAAGGTGTC
Nos2 CCTGGAGACCCACACACTGG CACAGCCACATTGATCTCCG
Pip2a TTCTTGCTGTCTTTGGAACTTTGTC ATGGTCAACCCCACCGTGT
Ptgs2 CGGTTTTGAGTTTGAAGTGGTAACCG GAGCAACTATTCCAAACCAGCA
Tgfb GGGGTCTACAACCAACACAACCCG GCAGGAGCGCACAATCATGT
Tnf TGTTGCCTCCTCTTTTGCTT TGGTCACCAAATCAGCGTTA
Taqman Assay Primers (Mouse)
E330013P06 TGTGACAGTATCCGGCCAATGCTA ACACTATGGGAAAGCCACTGGGAT
E330013P06-Probe ATTTCCACCRATCCTCCTATGCTCTGC
siRNAs (Mouse)
siE33-Pr-1 GAGACAUCUUCUGAAGACAUU UGUCUUCAGAAGAUGUCUCUU
siE33-Pr-2 GUUCUGUGACAGUAAUAAAUU UUUAUUACUGUCACAGAACUU
siE33-Pr-3 GAAGACAUUUCUGAAGAGAUU UCUCUUCAGAAAUGUCUUCUU
siNTC ON-TARGET Plus Non-targeting siRNA #1 (Thermo Scientific)
QPCR primers (Human)
MIR143HG AGGGCCAGCAGCAGGC TCAGGAAATGTCTCTGGCTGTG
PPIA GACTGAGTGGTTGGATGGCAAG CGCTTATTCCTGGACCCAAAGCG
Page 50 of 57Diabetes
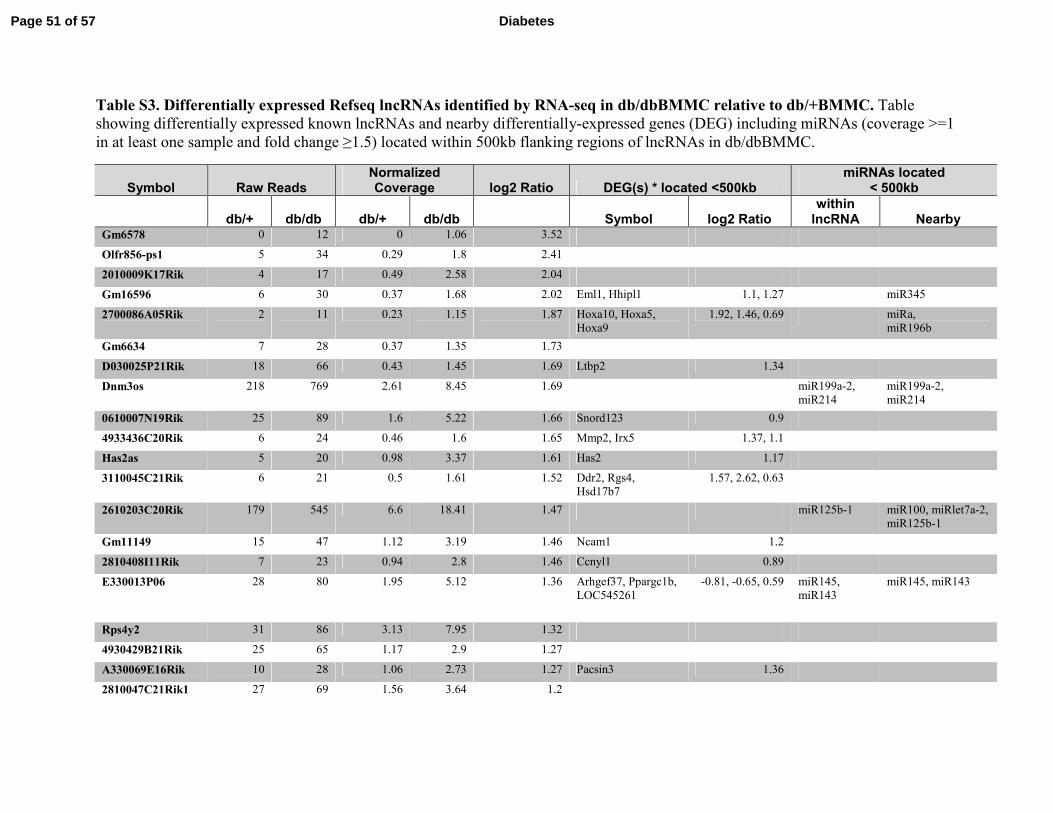
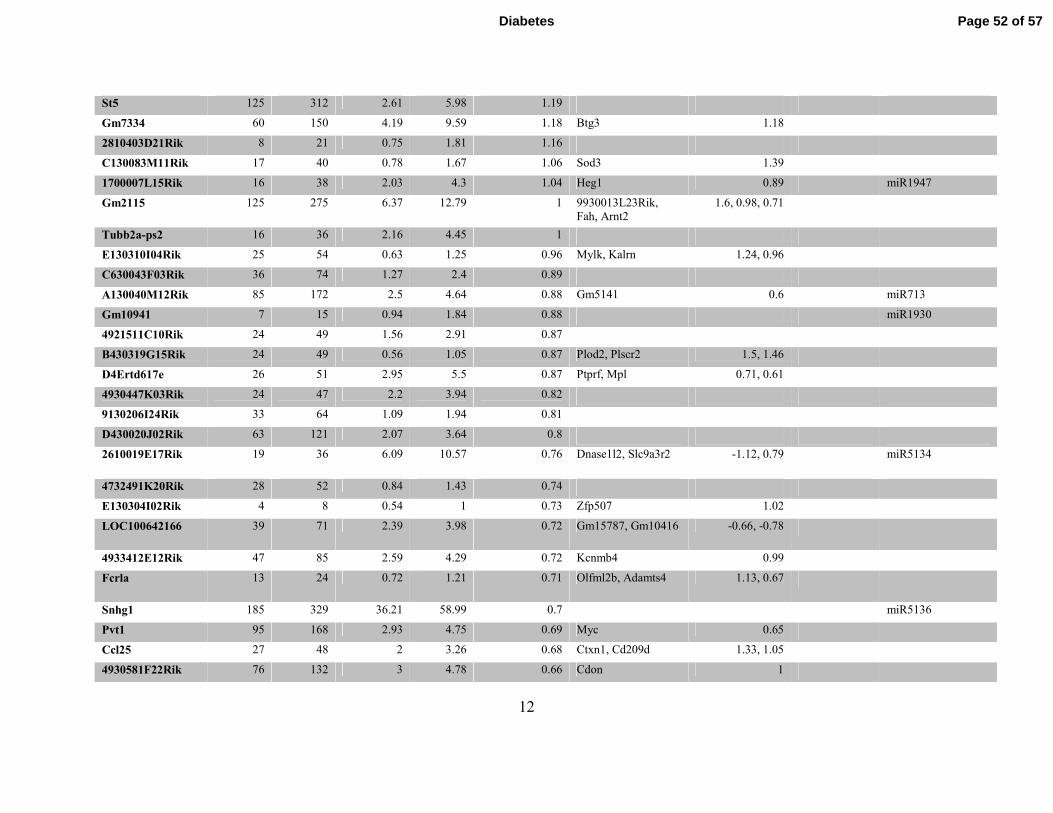
Table S3. Differentially expressed Refseq lncRNAs identified by RNA-seq in db/dbBMMC relative to db/+BMMC. Table
showing differentially expressed known lncRNAs and nearby differentially-expressed genes (DEG) including miRNAs (coverage >=1
in at least one sample and fold change ≥1.5) located within 500kb flanking regions of lncRNAs in db/dbBMMC.
Symbol Raw Reads Normalized Coverage log2 Ratio DEG(s) * located <500kb
miRNAs located < 500kb
db/+ db/db db/+ db/db Symbol log2 Ratio within lncRNA Nearby
Gm6578 0 12 0 1.06 3.52
Olfr856-ps1 5 34 0.29 1.8 2.41
2010009K17Rik 4 17 0.49 2.58 2.04
Gm16596 6 30 0.37 1.68 2.02 Eml1, Hhipl1 1.1, 1.27 miR345
2700086A05Rik 2 11 0.23 1.15 1.87 Hoxa10, Hoxa5,
Hoxa9
1.92, 1.46, 0.69 miRa,
miR196b
Gm6634 7 28 0.37 1.35 1.73
D030025P21Rik 18 66 0.43 1.45 1.69 Ltbp2 1.34
Dnm3os 218 769 2.61 8.45 1.69 miR199a-2,
miR214
miR199a-2,
miR214
0610007N19Rik 25 89 1.6 5.22 1.66 Snord123 0.9
4933436C20Rik 6 24 0.46 1.6 1.65 Mmp2, Irx5 1.37, 1.1
Has2as 5 20 0.98 3.37 1.61 Has2 1.17
3110045C21Rik 6 21 0.5 1.61 1.52 Ddr2, Rgs4,
Hsd17b7
1.57, 2.62, 0.63
2610203C20Rik 179 545 6.6 18.41 1.47 miR125b-1 miR100, miRlet7a-2,
miR125b-1
Gm11149 15 47 1.12 3.19 1.46 Ncam1 1.2
2810408I11Rik 7 23 0.94 2.8 1.46 Ccnyl1 0.89
E330013P06 28 80 1.95 5.12 1.36 Arhgef37, Ppargc1b,
LOC545261
-0.81, -0.65, 0.59 miR145,
miR143
miR145, miR143
Rps4y2 31 86 3.13 7.95 1.32
4930429B21Rik 25 65 1.17 2.9 1.27
A330069E16Rik 10 28 1.06 2.73 1.27 Pacsin3 1.36
2810047C21Rik1 27 69 1.56 3.64 1.2
Page 51 of 57 Diabetes
12
St5 125 312 2.61 5.98 1.19
Gm7334 60 150 4.19 9.59 1.18 Btg3 1.18
2810403D21Rik 8 21 0.75 1.81 1.16
C130083M11Rik 17 40 0.78 1.67 1.06 Sod3 1.39
1700007L15Rik 16 38 2.03 4.3 1.04 Heg1 0.89 miR1947
Gm2115 125 275 6.37 12.79 1 9930013L23Rik,
Fah, Arnt2
1.6, 0.98, 0.71
Tubb2a-ps2 16 36 2.16 4.45 1
E130310I04Rik 25 54 0.63 1.25 0.96 Mylk, Kalrn 1.24, 0.96
C630043F03Rik 36 74 1.27 2.4 0.89
A130040M12Rik 85 172 2.5 4.64 0.88 Gm5141 0.6 miR713
Gm10941 7 15 0.94 1.84 0.88 miR1930
4921511C10Rik 24 49 1.56 2.91 0.87
B430319G15Rik 24 49 0.56 1.05 0.87 Plod2, Plscr2 1.5, 1.46
D4Ertd617e 26 51 2.95 5.5 0.87 Ptprf, Mpl 0.71, 0.61
4930447K03Rik 24 47 2.2 3.94 0.82
9130206I24Rik 33 64 1.09 1.94 0.81
D430020J02Rik 63 121 2.07 3.64 0.8
2610019E17Rik 19 36 6.09 10.57 0.76 Dnase1l2, Slc9a3r2 -1.12, 0.79 miR5134
4732491K20Rik 28 52 0.84 1.43 0.74
E130304I02Rik 4 8 0.54 1 0.73 Zfp507 1.02
LOC100642166 39 71 2.39 3.98 0.72 Gm15787, Gm10416 -0.66, -0.78
4933412E12Rik 47 85 2.59 4.29 0.72 Kcnmb4 0.99
Fcrla 13 24 0.72 1.21 0.71 Olfml2b, Adamts4 1.13, 0.67
Snhg1 185 329 36.21 58.99 0.7 miR5136
Pvt1 95 168 2.93 4.75 0.69 Myc 0.65
Ccl25 27 48 2 3.26 0.68 Ctxn1, Cd209d 1.33, 1.05
4930581F22Rik 76 132 3 4.78 0.66 Cdon 1
Page 52 of 57Diabetes
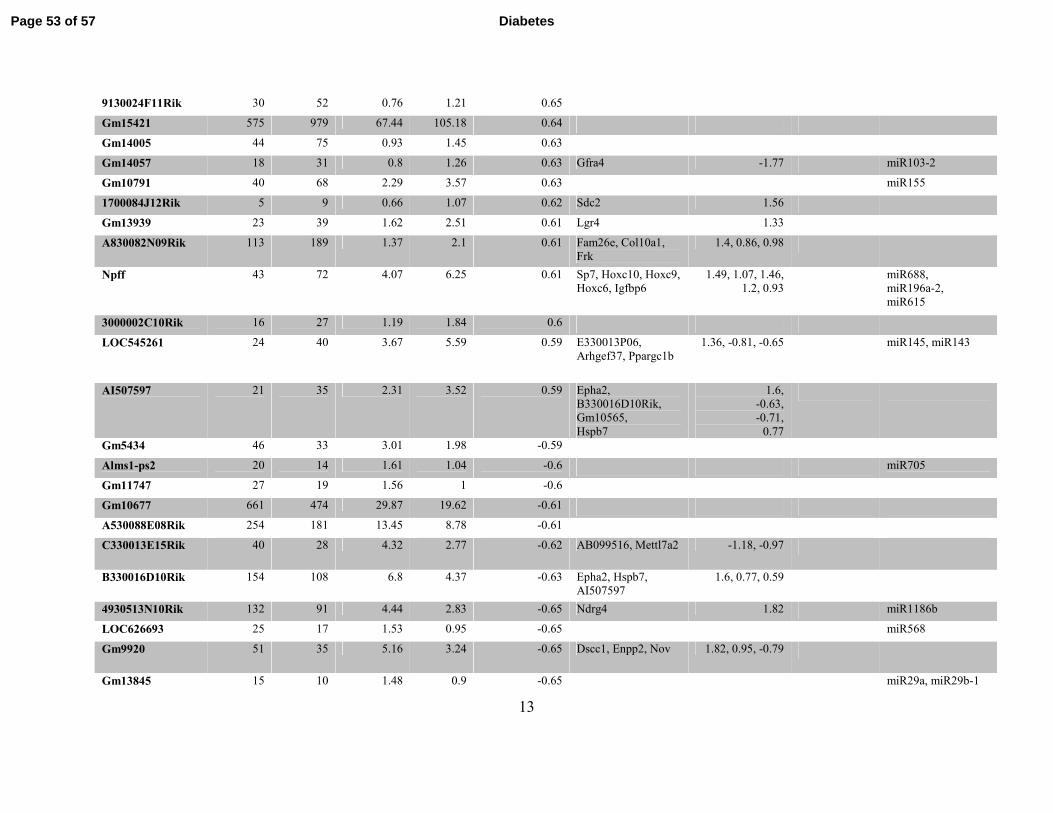
13
9130024F11Rik 30 52 0.76 1.21 0.65
Gm15421 575 979 67.44 105.18 0.64
Gm14005 44 75 0.93 1.45 0.63
Gm14057 18 31 0.8 1.26 0.63 Gfra4 -1.77 miR103-2
Gm10791 40 68 2.29 3.57 0.63 miR155
1700084J12Rik 5 9 0.66 1.07 0.62 Sdc2 1.56
Gm13939 23 39 1.62 2.51 0.61 Lgr4 1.33
A830082N09Rik 113 189 1.37 2.1 0.61 Fam26e, Col10a1,
Frk
1.4, 0.86, 0.98
Npff 43 72 4.07 6.25 0.61 Sp7, Hoxc10, Hoxc9,
Hoxc6, Igfbp6
1.49, 1.07, 1.46,
1.2, 0.93 miR688,
miR196a-2,
miR615
3000002C10Rik 16 27 1.19 1.84 0.6
LOC545261 24 40 3.67 5.59 0.59 E330013P06,
Arhgef37, Ppargc1b
1.36, -0.81, -0.65 miR145, miR143
AI507597 21 35 2.31 3.52 0.59 Epha2,
B330016D10Rik,
Gm10565,
Hspb7
1.6,
-0.63,
-0.71,
0.77
Gm5434 46 33 3.01 1.98 -0.59
Alms1-ps2 20 14 1.61 1.04 -0.6 miR705
Gm11747 27 19 1.56 1 -0.6
Gm10677 661 474 29.87 19.62 -0.61
A530088E08Rik 254 181 13.45 8.78 -0.61
C330013E15Rik 40 28 4.32 2.77 -0.62 AB099516, Mettl7a2 -1.18, -0.97
B330016D10Rik 154 108 6.8 4.37 -0.63 Epha2, Hspb7,
AI507597
1.6, 0.77, 0.59
4930513N10Rik 132 91 4.44 2.83 -0.65 Ndrg4 1.82 miR1186b
LOC626693 25 17 1.53 0.95 -0.65 miR568
Gm9920 51 35 5.16 3.24 -0.65 Dscc1, Enpp2, Nov 1.82, 0.95, -0.79
Gm13845 15 10 1.48 0.9 -0.65 miR29a, miR29b-1
Page 53 of 57 Diabetes
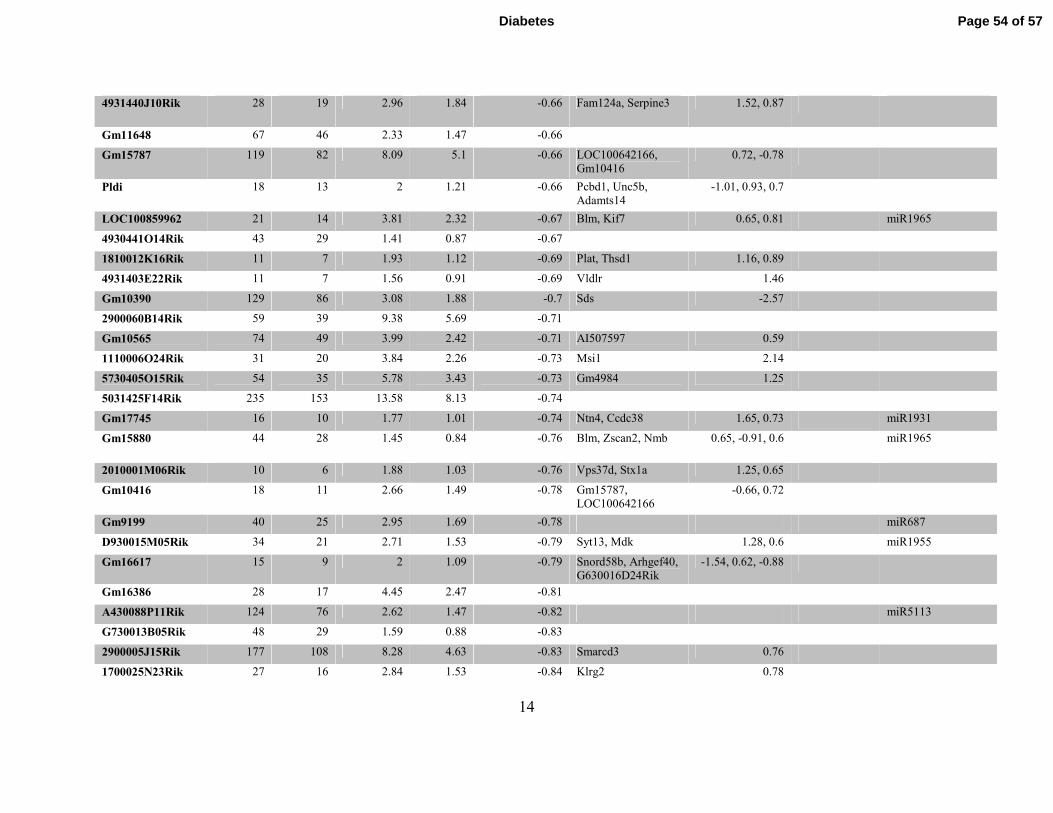
14
4931440J10Rik 28 19 2.96 1.84 -0.66 Fam124a, Serpine3 1.52, 0.87
Gm11648 67 46 2.33 1.47 -0.66
Gm15787 119 82 8.09 5.1 -0.66 LOC100642166,
Gm10416
0.72, -0.78
Pldi 18 13 2 1.21 -0.66 Pcbd1, Unc5b,
Adamts14
-1.01, 0.93, 0.7
LOC100859962 21 14 3.81 2.32 -0.67 Blm, Kif7 0.65, 0.81 miR1965
4930441O14Rik 43 29 1.41 0.87 -0.67
1810012K16Rik 11 7 1.93 1.12 -0.69 Plat, Thsd1 1.16, 0.89
4931403E22Rik 11 7 1.56 0.91 -0.69 Vldlr 1.46
Gm10390 129 86 3.08 1.88 -0.7 Sds -2.57
2900060B14Rik 59 39 9.38 5.69 -0.71
Gm10565 74 49 3.99 2.42 -0.71 AI507597 0.59
1110006O24Rik 31 20 3.84 2.26 -0.73 Msi1 2.14
5730405O15Rik 54 35 5.78 3.43 -0.73 Gm4984 1.25
5031425F14Rik 235 153 13.58 8.13 -0.74
Gm17745 16 10 1.77 1.01 -0.74 Ntn4, Ccdc38 1.65, 0.73 miR1931
Gm15880 44 28 1.45 0.84 -0.76 Blm, Zscan2, Nmb 0.65, -0.91, 0.6 miR1965
2010001M06Rik 10 6 1.88 1.03 -0.76 Vps37d, Stx1a 1.25, 0.65
Gm10416 18 11 2.66 1.49 -0.78 Gm15787,
LOC100642166
-0.66, 0.72
Gm9199 40 25 2.95 1.69 -0.78 miR687
D930015M05Rik 34 21 2.71 1.53 -0.79 Syt13, Mdk 1.28, 0.6 miR1955
Gm16617 15 9 2 1.09 -0.79 Snord58b, Arhgef40,
G630016D24Rik
-1.54, 0.62, -0.88
Gm16386 28 17 4.45 2.47 -0.81
A430088P11Rik 124 76 2.62 1.47 -0.82 miR5113
G730013B05Rik 48 29 1.59 0.88 -0.83
2900005J15Rik 177 108 8.28 4.63 -0.83 Smarcd3 0.76
1700025N23Rik 27 16 2.84 1.53 -0.84 Klrg2 0.78
Page 54 of 57Diabetes
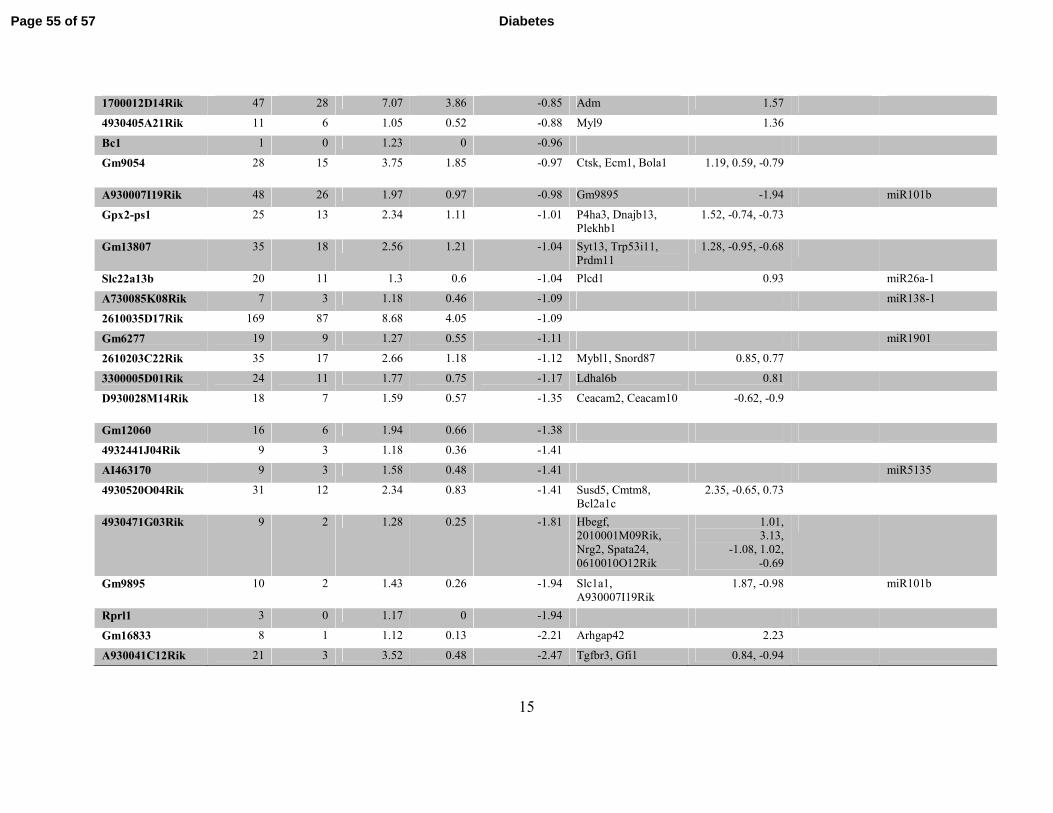
15
1700012D14Rik 47 28 7.07 3.86 -0.85 Adm 1.57
4930405A21Rik 11 6 1.05 0.52 -0.88 Myl9 1.36
Bc1 1 0 1.23 0 -0.96
Gm9054 28 15 3.75 1.85 -0.97 Ctsk, Ecm1, Bola1 1.19, 0.59, -0.79
A930007I19Rik 48 26 1.97 0.97 -0.98 Gm9895 -1.94 miR101b
Gpx2-ps1 25 13 2.34 1.11 -1.01 P4ha3, Dnajb13,
Plekhb1
1.52, -0.74, -0.73
Gm13807 35 18 2.56 1.21 -1.04 Syt13, Trp53i11,
Prdm11
1.28, -0.95, -0.68
Slc22a13b 20 11 1.3 0.6 -1.04 Plcd1 0.93 miR26a-1
A730085K08Rik 7 3 1.18 0.46 -1.09 miR138-1
2610035D17Rik 169 87 8.68 4.05 -1.09
Gm6277 19 9 1.27 0.55 -1.11 miR1901
2610203C22Rik 35 17 2.66 1.18 -1.12 Mybl1, Snord87 0.85, 0.77
3300005D01Rik 24 11 1.77 0.75 -1.17 Ldhal6b 0.81
D930028M14Rik 18 7 1.59 0.57 -1.35 Ceacam2, Ceacam10 -0.62, -0.9
Gm12060 16 6 1.94 0.66 -1.38
4932441J04Rik 9 3 1.18 0.36 -1.41
AI463170 9 3 1.58 0.48 -1.41 miR5135
4930520O04Rik 31 12 2.34 0.83 -1.41 Susd5, Cmtm8,
Bcl2a1c
2.35, -0.65, 0.73
4930471G03Rik 9 2 1.28 0.25 -1.81 Hbegf,
2010001M09Rik,
Nrg2, Spata24,
0610010O12Rik
1.01,
3.13,
-1.08, 1.02,
-0.69
Gm9895 10 2 1.43 0.26 -1.94 Slc1a1,
A930007I19Rik
1.87, -0.98 miR101b
Rprl1 3 0 1.17 0 -1.94
Gm16833 8 1 1.12 0.13 -2.21 Arhgap42 2.23
A930041C12Rik 21 3 3.52 0.48 -2.47 Tgfbr3, Gfi1 0.84, -0.94
Page 55 of 57 Diabetes
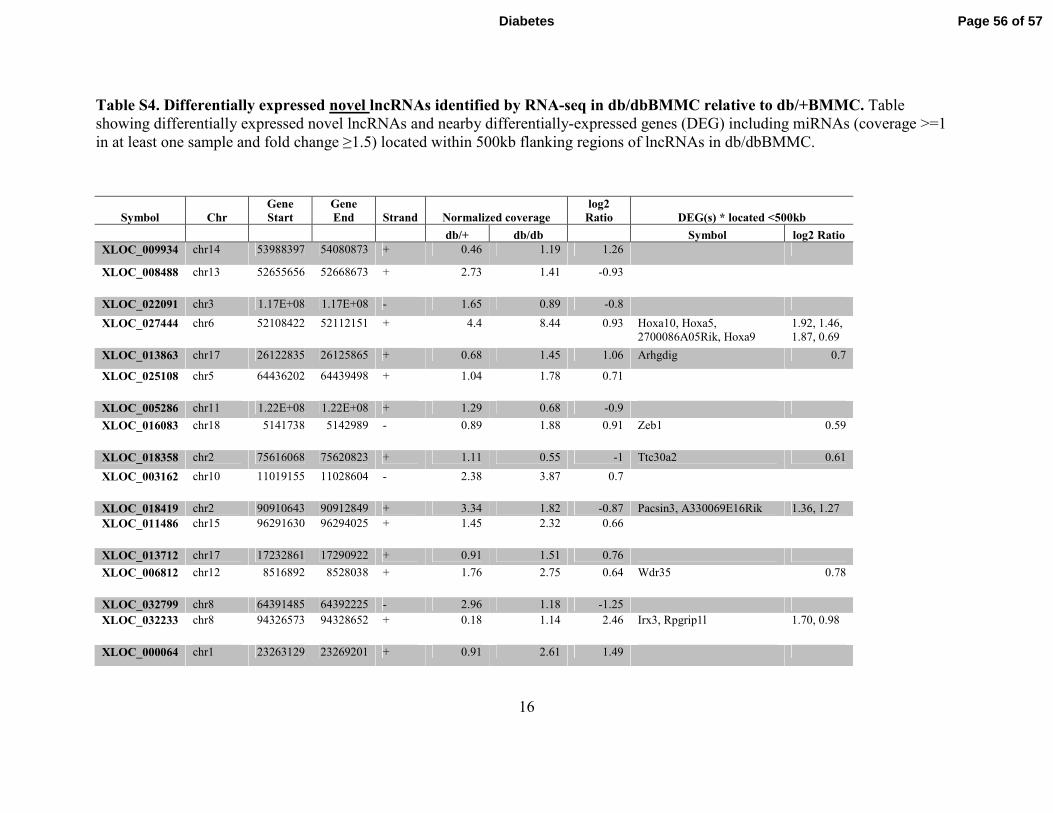
16
Table S4. Differentially expressed novel lncRNAs identified by RNA-seq in db/dbBMMC relative to db/+BMMC. Table
showing differentially expressed novel lncRNAs and nearby differentially-expressed genes (DEG) including miRNAs (coverage >=1
in at least one sample and fold change ≥1.5) located within 500kb flanking regions of lncRNAs in db/dbBMMC.
Symbol Chr
Gene
Start
Gene
End Strand Normalized coverage
log2
Ratio DEG(s) * located <500kb
db/+ db/db Symbol log2 Ratio
XLOC_009934 chr14 53988397 54080873 + 0.46 1.19 1.26
XLOC_008488 chr13 52655656 52668673 + 2.73 1.41 -0.93
XLOC_022091 chr3 1.17E+08 1.17E+08 - 1.65 0.89 -0.8
XLOC_027444 chr6 52108422 52112151 + 4.4 8.44 0.93 Hoxa10, Hoxa5,
2700086A05Rik, Hoxa9
1.92, 1.46,
1.87, 0.69
XLOC_013863 chr17 26122835 26125865 + 0.68 1.45 1.06 Arhgdig 0.7
XLOC_025108 chr5 64436202 64439498 + 1.04 1.78 0.71
XLOC_005286 chr11 1.22E+08 1.22E+08 + 1.29 0.68 -0.9
XLOC_016083 chr18 5141738 5142989 - 0.89 1.88 0.91 Zeb1 0.59
XLOC_018358 chr2 75616068 75620823 + 1.11 0.55 -1 Ttc30a2 0.61
XLOC_003162 chr10 11019155 11028604 - 2.38 3.87 0.7
XLOC_018419 chr2 90910643 90912849 + 3.34 1.82 -0.87 Pacsin3, A330069E16Rik 1.36, 1.27
XLOC_011486 chr15 96291630 96294025 + 1.45 2.32 0.66
XLOC_013712 chr17 17232861 17290922 + 0.91 1.51 0.76
XLOC_006812 chr12 8516892 8528038 + 1.76 2.75 0.64 Wdr35 0.78
XLOC_032799 chr8 64391485 64392225 - 2.96 1.18 -1.25
XLOC_032233 chr8 94326573 94328652 + 0.18 1.14 2.46 Irx3, Rpgrip1l 1.70, 0.98
XLOC_000064 chr1 23263129 23269201 + 0.91 2.61 1.49
Page 56 of 57Diabetes
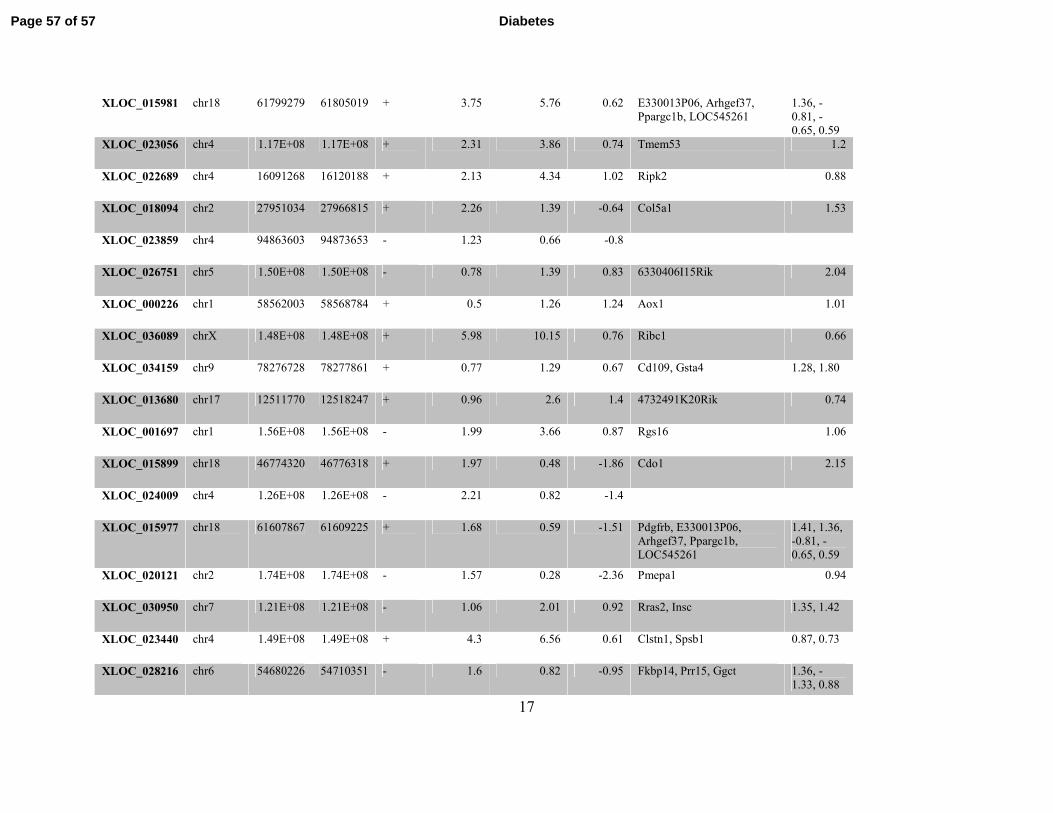
17
XLOC_015981 chr18 61799279 61805019 + 3.75 5.76 0.62 E330013P06, Arhgef37,
Ppargc1b, LOC545261
1.36, -
0.81, -
0.65, 0.59
XLOC_023056 chr4 1.17E+08 1.17E+08 + 2.31 3.86 0.74 Tmem53 1.2
XLOC_022689 chr4 16091268 16120188 + 2.13 4.34 1.02 Ripk2 0.88
XLOC_018094 chr2 27951034 27966815 + 2.26 1.39 -0.64 Col5a1 1.53
XLOC_023859 chr4 94863603 94873653 - 1.23 0.66 -0.8
XLOC_026751 chr5 1.50E+08 1.50E+08 - 0.78 1.39 0.83 6330406I15Rik 2.04
XLOC_000226 chr1 58562003 58568784 + 0.5 1.26 1.24 Aox1 1.01
XLOC_036089 chrX 1.48E+08 1.48E+08 + 5.98 10.15 0.76 Ribc1 0.66
XLOC_034159 chr9 78276728 78277861 + 0.77 1.29 0.67 Cd109, Gsta4 1.28, 1.80
XLOC_013680 chr17 12511770 12518247 + 0.96 2.6 1.4 4732491K20Rik 0.74
XLOC_001697 chr1 1.56E+08 1.56E+08 - 1.99 3.66 0.87 Rgs16 1.06
XLOC_015899 chr18 46774320 46776318 + 1.97 0.48 -1.86 Cdo1 2.15
XLOC_024009 chr4 1.26E+08 1.26E+08 - 2.21 0.82 -1.4
XLOC_015977 chr18 61607867 61609225 + 1.68 0.59 -1.51 Pdgfrb, E330013P06,
Arhgef37, Ppargc1b,
LOC545261
1.41, 1.36,
-0.81, -
0.65, 0.59
XLOC_020121 chr2 1.74E+08 1.74E+08 - 1.57 0.28 -2.36 Pmepa1 0.94
XLOC_030950 chr7 1.21E+08 1.21E+08 - 1.06 2.01 0.92 Rras2, Insc 1.35, 1.42
XLOC_023440 chr4 1.49E+08 1.49E+08 + 4.3 6.56 0.61 Clstn1, Spsb1 0.87, 0.73
XLOC_028216 chr6 54680226 54710351 - 1.6 0.82 -0.95 Fkbp14, Prr15, Ggct 1.36, -
1.33, 0.88
Page 57 of 57 Diabetes
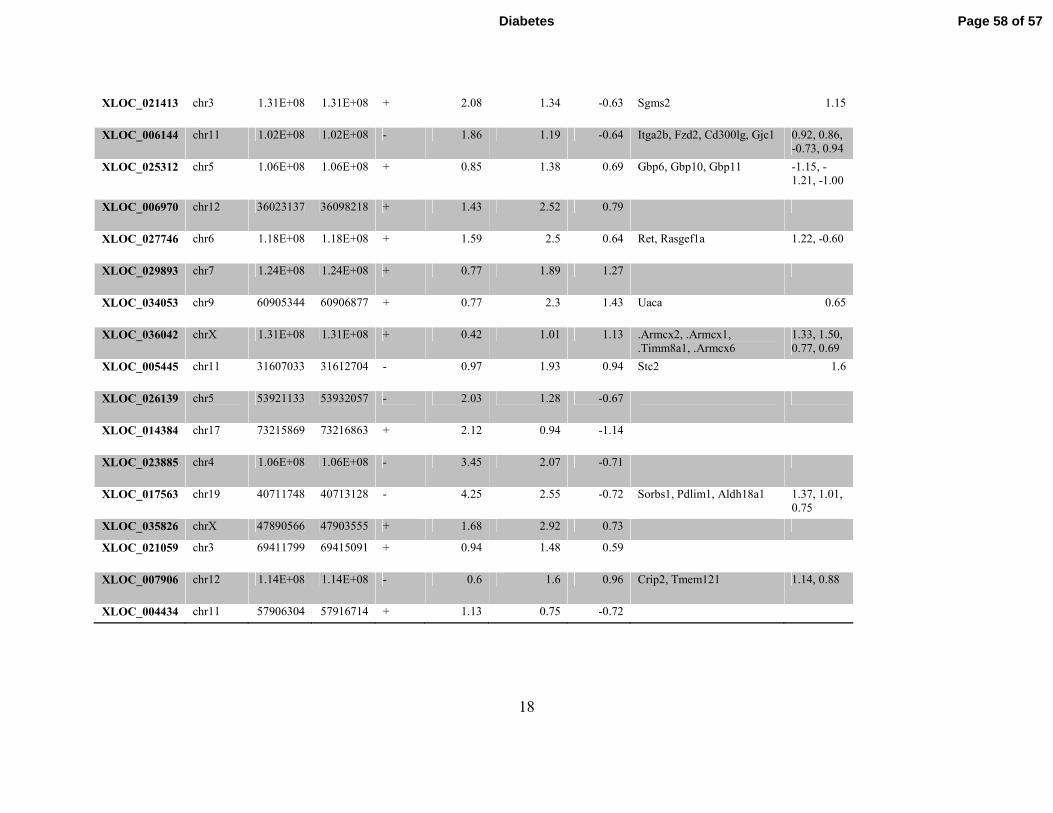
18
XLOC_021413 chr3 1.31E+08 1.31E+08 + 2.08 1.34 -0.63 Sgms2 1.15
XLOC_006144 chr11 1.02E+08 1.02E+08 - 1.86 1.19 -0.64 Itga2b, Fzd2, Cd300lg, Gjc1 0.92, 0.86,
-0.73, 0.94
XLOC_025312 chr5 1.06E+08 1.06E+08 + 0.85 1.38 0.69 Gbp6, Gbp10, Gbp11 -1.15, -
1.21, -1.00
XLOC_006970 chr12 36023137 36098218 + 1.43 2.52 0.79
XLOC_027746 chr6 1.18E+08 1.18E+08 + 1.59 2.5 0.64 Ret, Rasgef1a 1.22, -0.60
XLOC_029893 chr7 1.24E+08 1.24E+08 + 0.77 1.89 1.27
XLOC_034053 chr9 60905344 60906877 + 0.77 2.3 1.43 Uaca 0.65
XLOC_036042 chrX 1.31E+08 1.31E+08 + 0.42 1.01 1.13 .Armcx2, .Armcx1,
.Timm8a1, .Armcx6
1.33, 1.50,
0.77, 0.69
XLOC_005445 chr11 31607033 31612704 - 0.97 1.93 0.94 Stc2 1.6
XLOC_026139 chr5 53921133 53932057 - 2.03 1.28 -0.67
XLOC_014384 chr17 73215869 73216863 + 2.12 0.94 -1.14
XLOC_023885 chr4 1.06E+08 1.06E+08 - 3.45 2.07 -0.71
XLOC_017563 chr19 40711748 40713128 - 4.25 2.55 -0.72 Sorbs1, Pdlim1, Aldh18a1 1.37, 1.01,
0.75
XLOC_035826 chrX 47890566 47903555 + 1.68 2.92 0.73
XLOC_021059 chr3 69411799 69415091 + 0.94 1.48 0.59
XLOC_007906 chr12 1.14E+08 1.14E+08 - 0.6 1.6 0.96 Crip2, Tmem121 1.14, 0.88
XLOC_004434 chr11 57906304 57916714 + 1.13 0.75 -0.72
Page 58 of 57Diabetes
Recommended